Embed Size (px)
Citation preview
Genome-Wide Location andFunction of DNA Binding
ProteinsBing Ren,1* Francois Robert,1* John J. Wyrick,1,2*
Oscar Aparicio,2,4 Ezra G. Jennings,1,2 Itamar Simon,1
Julia Zeitlinger,1 Jorg Schreiber,1 Nancy Hannett,1
Elenita Kanin,1 Thomas L. Volkert,1 Christopher J. Wilson,5
Stephen P. Bell,2,3 Richard A. Young1,2†
Understanding how DNA binding proteins control global gene expression andchromosomal maintenance requires knowledge of the chromosomal locationsat which these proteins function in vivo. We developed a microarray methodthat reveals the genome-wide location of DNA-bound proteins and used thismethod to monitor binding of gene-specific transcription activators in yeast.A combination of location and expression profiles was used to identify geneswhose expression is directly controlled by Gal4 and Ste12 as cells respond tochanges in carbon source and mating pheromone, respectively. The resultsidentify pathways that are coordinately regulated by each of the two activatorsand reveal previously unknown functions for Gal4 and Ste12. Genome-widelocation analysis will facilitate investigation of gene regulatory networks, genefunction, and genome maintenance.
Many proteins bind to specific sites in the ge-nome to regulate genome expression and main-tenance. Transcriptional activators, for exam-ple, bind to specific promoter sequences andrecruit chromatin modifying complexes and thetranscription apparatus to initiate RNA synthe-sis (1–3). The reprogramming of gene expres-sion that occurs as cells move through the cellcycle, or when cells sense changes in theirenvironment, is effected in part by changes inthe DNA binding status of transcriptional acti-vators. Distinct DNA binding proteins are alsoassociated with origins of DNA replication,centromeres, telomeres, and other sites, wherethey regulate chromosome replication, conden-sation, cohesion, and other aspects of genomemaintenance (4, 5). Our understanding of theseproteins and their functions is limited by ourknowledge of their binding sites in the genome.
The genome-wide location analysis methodwe have developed allows protein-DNA inter-actions to be monitored across the entire yeastgenome (6). The method combines a modifiedchromatin immunoprecipitation (ChIP) proce-dure, which has been previously used to studyprotein-DNA interactions at a small number of
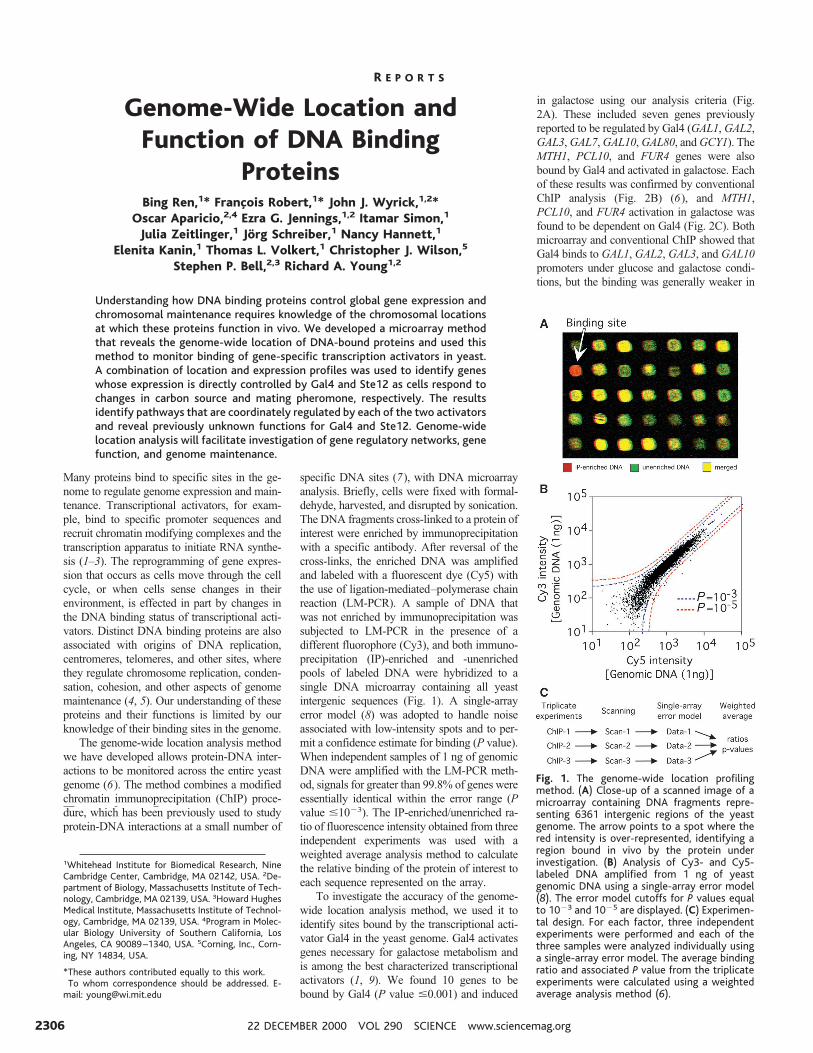
specific DNA sites (7), with DNA microarrayanalysis. Briefly, cells were fixed with formal-dehyde, harvested, and disrupted by sonication.The DNA fragments cross-linked to a protein ofinterest were enriched by immunoprecipitationwith a specific antibody. After reversal of thecross-links, the enriched DNA was amplifiedand labeled with a fluorescent dye (Cy5) withthe use of ligation-mediated–polymerase chainreaction (LM-PCR). A sample of DNA thatwas not enriched by immunoprecipitation wassubjected to LM-PCR in the presence of adifferent fluorophore (Cy3), and both immuno-precipitation (IP)-enriched and -unenrichedpools of labeled DNA were hybridized to asingle DNA microarray containing all yeastintergenic sequences (Fig. 1). A single-arrayerror model (8) was adopted to handle noiseassociated with low-intensity spots and to per-mit a confidence estimate for binding (P value).When independent samples of 1 ng of genomicDNA were amplified with the LM-PCR meth-od, signals for greater than 99.8% of genes wereessentially identical within the error range (Pvalue #1023). The IP-enriched/unenriched ra-tio of fluorescence intensity obtained from threeindependent experiments was used with aweighted average analysis method to calculatethe relative binding of the protein of interest toeach sequence represented on the array.
To investigate the accuracy of the genome-wide location analysis method, we used it toidentify sites bound by the transcriptional acti-vator Gal4 in the yeast genome. Gal4 activatesgenes necessary for galactose metabolism andis among the best characterized transcriptionalactivators (1, 9). We found 10 genes to bebound by Gal4 (P value #0.001) and induced
in galactose using our analysis criteria (Fig.2A). These included seven genes previouslyreported to be regulated by Gal4 (GAL1, GAL2,GAL3, GAL7, GAL10, GAL80, and GCY1). TheMTH1, PCL10, and FUR4 genes were alsobound by Gal4 and activated in galactose. Eachof these results was confirmed by conventionalChIP analysis (Fig. 2B) (6), and MTH1,PCL10, and FUR4 activation in galactose wasfound to be dependent on Gal4 (Fig. 2C). Bothmicroarray and conventional ChIP showed thatGal4 binds to GAL1, GAL2, GAL3, and GAL10promoters under glucose and galactose condi-tions, but the binding was generally weaker in
1Whitehead Institute for Biomedical Research, NineCambridge Center, Cambridge, MA 02142, USA. 2De-partment of Biology, Massachusetts Institute of Tech-nology, Cambridge, MA 02139, USA. 3Howard HughesMedical Institute, Massachusetts Institute of Technol-ogy, Cambridge, MA 02139, USA. 4Program in Molec-ular Biology University of Southern California, LosAngeles, CA 90089–1340, USA. 5Corning, Inc., Corn-ing, NY 14834, USA.
*These authors contributed equally to this work.†To whom correspondence should be addressed. E-mail: [email protected]
Fig. 1. The genome-wide location profilingmethod. (A) Close-up of a scanned image of amicroarray containing DNA fragments repre-senting 6361 intergenic regions of the yeastgenome. The arrow points to a spot where thered intensity is over-represented, identifying aregion bound in vivo by the protein underinvestigation. (B) Analysis of Cy3- and Cy5-labeled DNA amplified from 1 ng of yeastgenomic DNA using a single-array error model(8). The error model cutoffs for P values equalto 1023 and 1025 are displayed. (C) Experimen-tal design. For each factor, three independentexperiments were performed and each of thethree samples were analyzed individually usinga single-array error model. The average bindingratio and associated P value from the triplicateexperiments were calculated using a weightedaverage analysis method (6).
R E P O R T S
22 DECEMBER 2000 VOL 290 SCIENCE www.sciencemag.org2306
glucose (6). The consensus Gal4 binding se-quence that occurs in the promoters of thesegenes (CGGN11CCG) can also be found atmany sites through the yeast genome whereGal4 binding is not detected; therefore, se-quence alone is not sufficient to account for thespecificity of Gal4 binding in vivo. Previousstudies of Gal4-DNA binding have suggestedthat additional factors such as chromatin struc-ture contribute to specificity in vivo (10, 11).
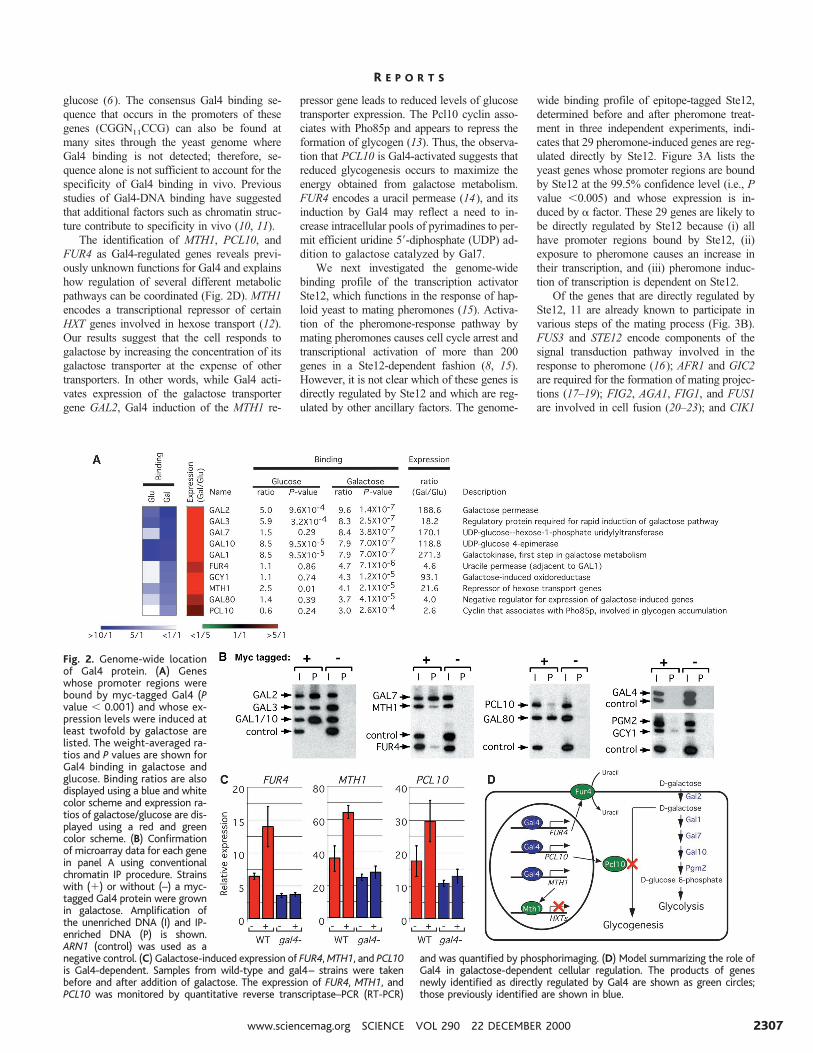
The identification of MTH1, PCL10, andFUR4 as Gal4-regulated genes reveals previ-ously unknown functions for Gal4 and explainshow regulation of several different metabolicpathways can be coordinated (Fig. 2D). MTH1encodes a transcriptional repressor of certainHXT genes involved in hexose transport (12).Our results suggest that the cell responds togalactose by increasing the concentration of itsgalactose transporter at the expense of othertransporters. In other words, while Gal4 acti-vates expression of the galactose transportergene GAL2, Gal4 induction of the MTH1 re-
pressor gene leads to reduced levels of glucosetransporter expression. The Pcl10 cyclin asso-ciates with Pho85p and appears to repress theformation of glycogen (13). Thus, the observa-tion that PCL10 is Gal4-activated suggests thatreduced glycogenesis occurs to maximize theenergy obtained from galactose metabolism.FUR4 encodes a uracil permease (14), and itsinduction by Gal4 may reflect a need to in-crease intracellular pools of pyrimadines to per-mit efficient uridine 59-diphosphate (UDP) ad-dition to galactose catalyzed by Gal7.
We next investigated the genome-widebinding profile of the transcription activatorSte12, which functions in the response of hap-loid yeast to mating pheromones (15). Activa-tion of the pheromone-response pathway bymating pheromones causes cell cycle arrest andtranscriptional activation of more than 200genes in a Ste12-dependent fashion (8, 15).However, it is not clear which of these genes isdirectly regulated by Ste12 and which are reg-ulated by other ancillary factors. The genome-
wide binding profile of epitope-tagged Ste12,determined before and after pheromone treat-ment in three independent experiments, indi-cates that 29 pheromone-induced genes are reg-ulated directly by Ste12. Figure 3A lists theyeast genes whose promoter regions are boundby Ste12 at the 99.5% confidence level (i.e., Pvalue ,0.005) and whose expression is in-duced by a factor. These 29 genes are likely tobe directly regulated by Ste12 because (i) allhave promoter regions bound by Ste12, (ii)exposure to pheromone causes an increase intheir transcription, and (iii) pheromone induc-tion of transcription is dependent on Ste12.
Of the genes that are directly regulated bySte12, 11 are already known to participate invarious steps of the mating process (Fig. 3B).FUS3 and STE12 encode components of thesignal transduction pathway involved in theresponse to pheromone (16); AFR1 and GIC2are required for the formation of mating projec-tions (17–19); FIG2, AGA1, FIG1, and FUS1are involved in cell fusion (20–23); and CIK1
Fig. 2. Genome-wide locationof Gal4 protein. (A) Geneswhose promoter regions werebound by myc-tagged Gal4 (Pvalue , 0.001) and whose ex-pression levels were induced atleast twofold by galactose arelisted. The weight-averaged ra-tios and P values are shown forGal4 binding in galactose andglucose. Binding ratios are alsodisplayed using a blue and whitecolor scheme and expression ra-tios of galactose/glucose are dis-played using a red and greencolor scheme. (B) Confirmationof microarray data for each genein panel A using conventionalchromatin IP procedure. Strainswith (1) or without (–) a myc-tagged Gal4 protein were grownin galactose. Amplification ofthe unenriched DNA (I) and IP-enriched DNA (P) is shown.ARN1 (control) was used as anegative control. (C) Galactose-induced expression of FUR4, MTH1, and PCL10is Gal4-dependent. Samples from wild-type and gal4– strains were takenbefore and after addition of galactose. The expression of FUR4, MTH1, andPCL10 was monitored by quantitative reverse transcriptase–PCR (RT-PCR)
and was quantified by phosphorimaging. (D) Model summarizing the role ofGal4 in galactose-dependent cellular regulation. The products of genesnewly identified as directly regulated by Gal4 are shown as green circles;those previously identified are shown in blue.
R E P O R T S
www.sciencemag.org SCIENCE VOL 290 22 DECEMBER 2000 2307
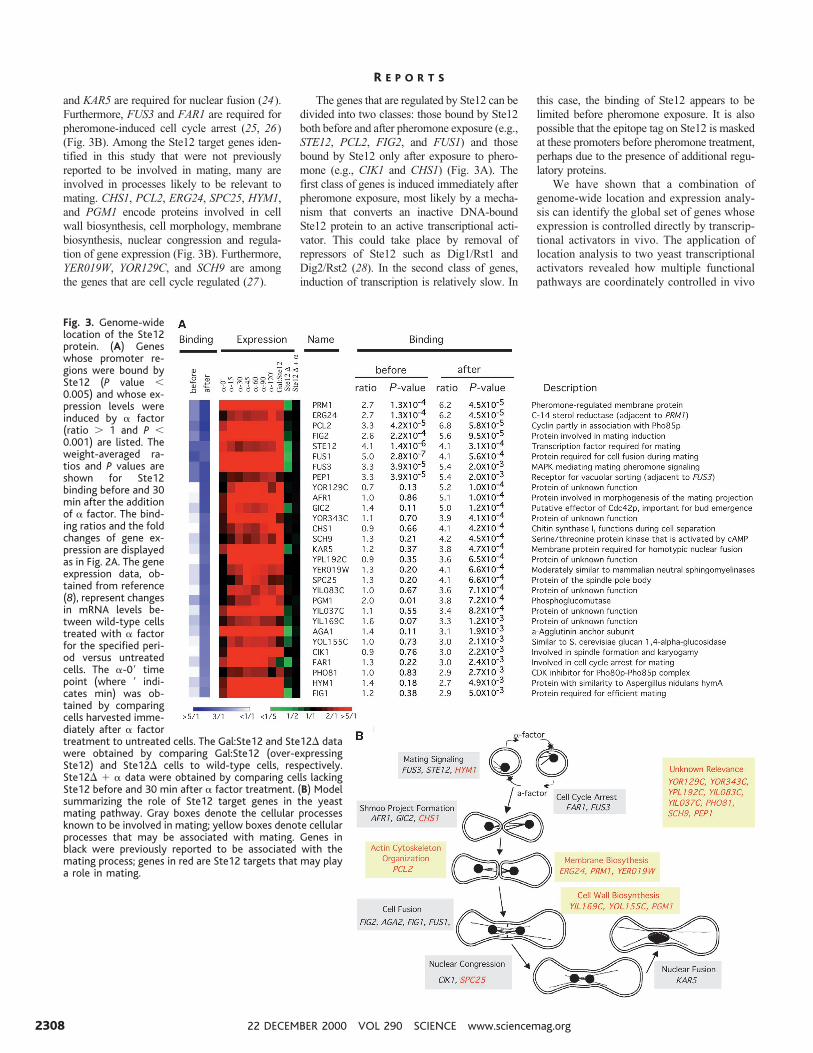
and KAR5 are required for nuclear fusion (24).Furthermore, FUS3 and FAR1 are required forpheromone-induced cell cycle arrest (25, 26)(Fig. 3B). Among the Ste12 target genes iden-tified in this study that were not previouslyreported to be involved in mating, many areinvolved in processes likely to be relevant tomating. CHS1, PCL2, ERG24, SPC25, HYM1,and PGM1 encode proteins involved in cellwall biosynthesis, cell morphology, membranebiosynthesis, nuclear congression and regula-tion of gene expression (Fig. 3B). Furthermore,YER019W, YOR129C, and SCH9 are amongthe genes that are cell cycle regulated (27).
The genes that are regulated by Ste12 can bedivided into two classes: those bound by Ste12both before and after pheromone exposure (e.g.,STE12, PCL2, FIG2, and FUS1) and thosebound by Ste12 only after exposure to phero-mone (e.g., CIK1 and CHS1) (Fig. 3A). Thefirst class of genes is induced immediately afterpheromone exposure, most likely by a mecha-nism that converts an inactive DNA-boundSte12 protein to an active transcriptional acti-vator. This could take place by removal ofrepressors of Ste12 such as Dig1/Rst1 andDig2/Rst2 (28). In the second class of genes,induction of transcription is relatively slow. In
this case, the binding of Ste12 appears to belimited before pheromone exposure. It is alsopossible that the epitope tag on Ste12 is maskedat these promoters before pheromone treatment,perhaps due to the presence of additional regu-latory proteins.
We have shown that a combination ofgenome-wide location and expression analy-sis can identify the global set of genes whoseexpression is controlled directly by transcrip-tional activators in vivo. The application oflocation analysis to two yeast transcriptionalactivators revealed how multiple functionalpathways are coordinately controlled in vivo
Fig. 3. Genome-widelocation of the Ste12protein. (A) Geneswhose promoter re-gions were bound bySte12 (P value ,0.005) and whose ex-pression levels wereinduced by a factor(ratio . 1 and P ,0.001) are listed. Theweight-averaged ra-tios and P values areshown for Ste12binding before and 30min after the additionof a factor. The bind-ing ratios and the foldchanges of gene ex-pression are displayedas in Fig. 2A. The geneexpression data, ob-tained from reference(8), represent changesin mRNA levels be-tween wild-type cellstreated with a factorfor the specified peri-od versus untreatedcells. The a-09 timepoint (where 9 indi-cates min) was ob-tained by comparingcells harvested imme-diately after a factortreatment to untreated cells. The Gal:Ste12 and Ste12D datawere obtained by comparing Gal:Ste12 (over-expressingSte12) and Ste12D cells to wild-type cells, respectively.Ste12D 1 a data were obtained by comparing cells lackingSte12 before and 30 min after a factor treatment. (B) Modelsummarizing the role of Ste12 target genes in the yeastmating pathway. Gray boxes denote the cellular processesknown to be involved in mating; yellow boxes denote cellularprocesses that may be associated with mating. Genes inblack were previously reported to be associated with themating process; genes in red are Ste12 targets that may playa role in mating.
R E P O R T S
22 DECEMBER 2000 VOL 290 SCIENCE www.sciencemag.org2308
during the response to specific changes in theextracellular environment. All of the knowntargets for these two activators were con-firmed, and functional modules were discov-ered that are regulated directly by these factors.
Expression analysis with DNA microar-rays allows investigators to identify changesin mRNA levels in living cells, but the in-ability to distinguish direct from indirect ef-fects limits the interpretation of the data interms of the genes that are controlled byspecific regulatory factors. Genome-wide lo-cation analysis provides information on thebinding sites at which proteins reside throughthe genome under various conditions in vivo,and will prove to be a powerful tool for furtherdiscovery of global regulatory networks.
References and Notes1. M. Ptashne, A. Gann, Nature 386, 569 (1997).2. T. I. Lee, R. A. Young, Annu. Rev. Genet. 34, 77 (2000).3. S. Malik, R. G. Roeder, Trends Biochem. Sci. 25, 277
(2000).4. T. J. Kelly, G. W. Brown, Annu. Rev. Biochem. 69, 829
(2000).
5. A. Dutta, S. P. Bell, Annu. Rev. Cell Dev. Biol. 13, 293(1997).
6. Complete experimental protocols and other infor-mation are available at Science Online at www.sciencemag.org/cgi/content/full/290/5500/2309/DC1and on the author’s Web site at http://web.wi.mit.edu/young/location.
7. V. Orlando, Trends Biochem. Sci. 25, 99 (2000).8. C. J. Roberts et al., Science 287, 873 (2000).9. M. Johnston, M. Carlson, in The Molecular and Cellu-
lar Biology of the Yeast Saccharomyces, E. W. Jones,J. R. Pringle, J. R. Broach, Eds. (Cold Spring HarborLaboratory Press, Cold Spring Harbor, NY, 1992), vol.2, pp. 193–281.
10. D. I. Chasman et al., Genes Dev. 4, 503 (1990).11. R. Marmorstein, M. Carey, M. Ptashne, S. C. Harrison,
Nature 356, 408 (1992).12. M. C. Schmidt et al., Mol. Cell. Biol. 19, 4561 (1999).13. D. Huang et al., Mol. Cell. Biol. 18, 3289 (1998).14. R. Jund, E. Weber, M. R. Chevallier, Eur. J. Biochem.
171, 417 (1988).15. G. F. Sprague Jr., J. Thorner, in The Molecular and
Cellular Biology of the Yeast Saccharomyces, E. W.Jones, J. R. Pringle, J. R. Broach, Eds. (Cold SpringHarbor Laboratory Press, Cold Spring Harbor, NY,1992), vol. 2, pp. 657–744.
16. H. D. Madhani, G. R. Fink, Trends Genet. 14, 151 (1998).17. J. B. Konopka, Mol. Cell. Biol. 13, 6876 (1993).18. J. L. Brown, M. Jaquenoud, M. P. Gulli, J. Chant, M.
Peter, Genes Dev. 11, 2972 (1997).
19. G. C. Chen, Y. J. Kim, C. S. Chan, Genes Dev. 11, 2958(1997).
20. S. Erdman, L. Lin, M. Malczynski, M. Snyder, J. CellBiol. 140, 461 (1998).
21. A. Roy, C. F. Lu, D. L. Marykwas, P. N. Lipke, J. Kurjan,Mol. Cell. Biol. 11, 4196 (1991).
22. J. Trueheart, J. D. Boeke, G. R. Fink, Mol. Cell. Biol. 7,2316 (1987).
23. G. McCaffrey, F. J. Clay, K. Kelsay, G. F. Sprague Jr.,Mol. Cell. Biol. 7, 2680 (1987).
24. L. Marsh, M. D. Rose, in The Molecular and CellularBiology of the Yeast Saccharomyces, J. R. Pringle, J. R.Broach, E. W. Jones, Eds. (Cold Spring Harbor LaboratoryPress, Cold Spring Harbor, 1997), vol. 3, pp. 827–888.
25. F. Chang, I. Herskowitz, Cell 63, 999 (1990).26. H. Fujimura, Curr. Genet. 18, 395 (1990).27. P. T. Spellman et al., Mol. Biol. Cell 9, 3273 (1998).28. K. A. Olson et al., Mol. Cell. Biol. 20, 4199 (2000).29. We thank P. Cosma, K. Nasmyth, V. Myer, F. Hol-
stege, and F. Lewitter for reagents, protocols, andhelpful discussions. Supported by funds from Corn-ing, Inc., NIH (R.A.Y. and S.P.B.), Helen Hay Whit-ney Foundation (B.R.), National Cancer Institute ofCanada (F.R.), NSF ( J.J.W.), Burroughs-WellcomeFund (O.A.), Howard Hughes Medical Institute(E.G.J. and S.P.B.), European Molecular Biology Or-ganization (I.S.), and the Human Frontier ScienceProgram ( J.Z.).
18 September 2000; accepted 16 November 2000
Inhibition of Eukaryotic DNAReplication by Geminin
Binding to Cdt1James A. Wohlschlegel,1 Brian T. Dwyer,1 Suman K. Dhar,1
Christin Cvetic,2 Johannes C. Walter,2 Anindya Dutta1*
In all eukaryotic organisms, inappropriate firing of replication origins during theG2 phase of the cell cycle is suppressed by cyclin-dependent kinases. Multi-cellular eukaryotes contain a second putative inhibitor of re-replication calledgeminin. Geminin is believed to block binding of the mini-chromosome main-tenance (MCM) complex to origins of replication, but the mechanism of thisinhibition is unclear. Here we show that geminin interacts tightly with Cdt1, arecently identified replication initiation factor necessary for MCM loading. Theinhibition of DNA replication by geminin that is observed in cell-free DNAreplication extracts is reversed by the addition of excess Cdt1. In the normalcell cycle, Cdt1 is present only in G1 and S, whereas geminin is present in S andG2 phases of the cell cycle. Together, these results suggest that geminin inhibitsinappropriate origin firing by targeting Cdt1.
Eukaryotic cells maintain a tight control on theinitiation of DNA replication to ensure thatchromosome duplication in S phase and chro-mosome segregation in M phase strictly alter-nate with each other so that daughter cells donot receive too many or too few chromosomes.Fusion of cells in the G2 phase of the cell cycleto those in S phase revealed that the G2 nucleiwere unable to replicate their DNA, although
conditions in the heterokaryon were permissivefor replication in the S phase nuclei (1). Thisobservation led to the hypothesis that G2 nucleilack a factor essential for replication initiationand/or possess a negative factor that preventsreplication initiation. For the initiation of DNAreplication in eukaryotes, the origin recognitioncomplex (ORC) binds to initiator elements andrecruits the CDC6 and Cdt1 proteins to chro-matin in the G1 phase of the cell cycle. Thelatter, in turn, are required to recruit the MCMcomplex to form the pre-replication complex(pre-RC). After origin firing at the beginning ofS phase, the pre-RC is dissociated and is notre-assembled until the cell passes through mi-tosis into the G1 phase of the next cell-cycle. Asfactors essential for replication initiation were
discovered, it became clear that some of thembecome limiting in G2 nuclei (2, 3). In partic-ular, CDC6 is exported out of the nucleus (orproteolysed in yeast) as S phase proceeds, whilethe MCM proteins are phosphorylated and be-come dissociated from the chromatin (or ex-ported out of the nucleus in yeast). In addition,the elevated activity of cyclin-dependent kinase(cdk) in the G2-M phase of the cell cycle blocksre-replication by preventing assembly of pre-RC even when initiation factors such as CDC6are artificially expressed or stabilized in G2
nuclei (4–6). Therefore, the absence of initia-tion factors and the presence of negative factorsprevent a second round of origin firing untilcells pass through mitosis.
Geminin was identified in a screen for pro-teins that are degraded in mitotic extracts fromXenopus eggs and was shown to inhibit DNAreplication by preventing the loading of MCMcomplex on chromatin (7). The target of gemi-nin in this inhibitory reaction was unclear, butits expression in S and G2 led to the suggestionthat it provides an additional mechanism toprevent re-replication in the normal cell cycle.To identify the target of geminin, we raisedantibodies to bacterially expressed His6-gemi-nin (Fig. 1A) (8). Immunoblotting of extractsfrom 293T cells with this antibody recognizedthe 33-kD geminin protein in cell extracts (Fig.1A). Immunoprecipitation of 35S-methioninelabeled cell extracts indicated that the 33-kDgeminin protein co-immunoprecipitated withcellular proteins of 65 and 130 kD (Fig. 1B) (9).Re-immunoprecipitation with antibody togeminin under denaturing conditions precipitat-ed geminin but not the 65- and 130-kDpolypeptides (Fig. 1B). These results suggestthat the 65- and 130-kD polypeptides werepresent in the native anti-geminin immunopre-
1Department of Pathology, Brigham and Women’sHospital, Harvard Medical School, 75 Francis Street,Boston, MA 02115, USA. 2Department of BiologicalChemistry and Molecular Pharmacology, HarvardMedical School, 240 Longwood Avenue, Boston, MA02115, USA.
*To whom correspondence should be addressed. E-mail: [email protected]
R E P O R T S
www.sciencemag.org SCIENCE VOL 290 22 DECEMBER 2000 2309