Embed Size (px)
Citation preview

R E S EARCH ART I C L E
ZOOLOG ICAL POPULAT ION GENET I CS
1Department of Veterinary Integrative Biosciences, Interdisciplinary Program in Genetics,Texas A&M University, College Station, TX 77843, USA. 2McDonnell Genome Institute,WashingtonUniversity School ofMedicine, St. Louis,MO63108, USA. 3Institute of Experimen-tal Pathology (ZMBE), University of Münster, D-48149 Münster, Germany. 4Institute of Evolu-tion and Biodiversity, University of Münster, D-48149 Münster, Germany. 5University ofCalgary, Calgary, Alberta T2N 1N4, Canada. 6Departments of Anthropology and BiologicalSciences, Dartmouth College, Hanover, NH 03755, USA. 7Natural Sciences and Science Edu-cation, National Institute of Education, Nanyang Technological University, Singapore 637616,Singapore. 8Lee Kong Chian Natural History Museum, National University of Singapore,Singapore 117377 , Singapore. 9Department of Biology, University of California, Riverside,Riverside, CA 92521, USA. 10Division ofMammals, Smithsonian Institution, NationalMuseumof Natural History, Washington, DC 20013, USA.*Corresponding author. Email: [email protected] (W.J.M.); [email protected] (K.M.H.)
Mason et al. Sci. Adv. 2016; 2 : e1600633 10 August 2016
2016 © The Authors, some rights reserved;
exclusive licensee American Association for
the Advancement of Science. Distributed
under a Creative Commons Attribution
NonCommercial License 4.0 (CC BY-NC).
10.1126/sciadv.1600633
Genomic analysis reveals hidden biodiversitywithin colugos, the sister group to primates
Victor C. Mason,1 Gang Li,1 Patrick Minx,2 Jürgen Schmitz,3 Gennady Churakov,3,4 Liliya Doronina,3 Amanda D. Melin,5Nathaniel J. Dominy,6 Norman T-L. Lim,7,8 Mark S. Springer,9 Richard K. Wilson,2 Wesley C. Warren,2
Kristofer M. Helgen,10* William J. Murphy1*
Dow
nlo
Colugos are among the most poorly studied mammals despite their centrality to resolving supraordinal primate re-lationships. Two described species of these gliding mammals are the sole living members of the order Dermoptera,distributed throughout Southeast Asia. We generated a draft genome sequence for a Sunda colugo and a Philippinecolugo reference alignment, and used these to identify colugo-specific genetic changes that were enriched in sensoryandmusculoskeletal-related genes that likely underlie their nocturnal andgliding adaptations. Phylogenomic analysisand catalogs of rare genomic changes overwhelmingly support the contested hypothesis that colugos are the sistergroup to primates (Primatomorpha), to the exclusion of treeshrews. We captured ~140 kb of orthologous sequencedata from colugo museum specimens sampled across their range and identified large genetic differences betweenmany geographically isolated populations that may result in a >300% increase in the number of recognized colugospecies. Our results identify conservation units to mitigate future losses of this enigmatic mammalian order.
aded
on April 7, 2018http://advances.sciencem
ag.org/ from
INTRODUCTION
As members of a strictly arboreal lineage of Southeast Asian glidingmammals, colugos (Order Dermoptera) have been known to sciencefor centuries. However, the absence of captive individuals and a cryptic,nocturnal lifestyle have left basic questions surrounding their ecologyand evolutionary history unanswered (1–3). At various times within thepast century, colugos have been allied to mammals as divergent as in-sectivores and bats, and have played a central role in discussions ofprimate ancestry (4, 5). The phylogenetic position of colugos relative toother euarchontan orders remains highly controversial, with competingstudies favoring anassociationof colugoswith either primates or treeshrews(6–12). Current taxonomy describes the order Dermoptera as one ofthe least speciose within all of Mammalia, consisting of just two spe-cies in monotypic genera: the Sunda colugo, Galeopterus variegatus,and the Philippine colugo, Cynocephalus volans (13). This low speciesrichness is surprising because colugos are widely distributed throughoutthe Southeast Asian mainland and archipelago, a region of otherwiseremarkable biodiversity (14). Colugos also have the most elaborategliding membrane among living vertebrates, which inhibits terrestrialmovement and dispersal outside of forests (1, 2). Population differenti-ation has been supported by morphology (3) and high mitochondrialdivergence between some Sunda colugo populations (15, 16). Thesedistinctionsmay reflect valid species isolated in allopatry but remain un-substantiated in the absence of broader geographic and genomic samplingand comparison. Thus, evolutionary questions surrounding dermopteran
origins and taxonomic diversity remain unresolved, despite their impor-tance to the interpretation of early primate origins and evolution, and todeveloping effective conservation strategies, respectively (8, 17, 18).
RESULTS AND DISCUSSION
Assembling a colugo reference genomeTo produce the first detailed genetic insights into the poorly knownhistory of this enigmaticmammalian order, we produced a draft genomeassembly fromamale Sunda colugo fromWest Java.We generated~55×depth of coverage using Illumina sequence reads and produced an as-sembly (G_variegatus-3.0.2) that is 3.2 giga–base pairs (Gbp) in length(seeMaterials andMethods). This assembly is longer thanmost eutheriangenomes, with a scaffold N50 of 245.2 kbp and contig N50 of 20.7 kbp.The assembly was annotated with the National Center for BiotechnologyInformation (NCBI) annotation pipeline and colugo RNA sequencing(RNAseq) libraries (seeMaterials andMethods), which identified 23,081protein-coding genes. To test competing hypotheses concerning the re-lationship of colugos to othermammals, we performed comparative ge-nomic analyses with a 2.5-Mbp one-to-one orthologous coding DNAsequence alignment between colugo and 17 other sequenced mammali-an genomes (seeMaterials andMethods and table S1). These alignmentswere augmentedwith reference assemblies fromamale Philippine colugoon the basis of 14× Illumina sequencing coverage, and from a pentailedtreeshrew (Ptilocercus lowii) on the basis of ~5× coverage, to mitigatelong-branch attraction effects (see Materials and Methods).
The closest living relative of primatesThe relationship of colugos to othermammalian orders remains a topicof considerabledebate.Craniodental characters primarily support colugosas sister to treeshrews (Sundatheria) (10), whereas retrotransposon inser-tions and some interpretations of postcranial skeleton characters suggestthat colugos are sister to primates (Primatomorpha) (4, 6). Previous studieshavedemonstrated that evolutionary relationshipsbased solelyonphenomic
1 of 15

R E S EARCH ART I C L E
on Ahttp://advances.sciencem
ag.org/D
ownloaded from
data sets generate numerous polyphyletic relationships of convergentlyevolved mammals positioned within different superorders of placentalmammals (10, 19). To address these conflicting hypotheses, we con-structed maximum likelihood and coalescent-based phylogenies with thegenome-wide supermatrix of 21 species from8 eutherian orders (fig. S1).Our results consistently supported the Primatomorpha hypothesis (4),confirming colugos as the sister group of primates (Fig. 1 and fig. S1)(7, 9, 18). Because tree-building methods applied to deep, star-like radia-tions with shallow terminal lineages may be confounded by long-branchattraction artifacts (12), we also searched thewhole-genome alignments fortwo independent types of phylogenetic character support that are notinfluenced in this way: (i) in-frame protein-coding indels (insertion/deletions) and (ii) near homoplasy-free retrotransposon insertions (seeMaterials and Methods). We identified 20, 5, and 5 coding indels (P =4.5 × 10⁻⁵, c2 test) and 16, 1, and 0 retrotransposon insertions [P= 2.7 ×10⁻⁷, Kuritzin-Kischka-Schmitz-Churakov test (20)] supporting Primato-morpha, Sundatheria, and primates + treeshrews, respectively (Fig. 1, figs.S2 to S4, and tables S2 to S4). These statistically robust reconstructions ofPrimatomorpha stand in contrast to the phenomic data set ofO’Leary et al.(10), who identified 69 morphological characters uniting colugoswith treeshrews (Sundatheria). Our results imply that anymorphologicalsimilarities shared by colugos and treeshrews (10, 21) are due to convergentevolution or represent primitive characters lost in the primate ancestor.
Colugo adaptive evolutionWe used a comparative genomic approach to explore the annotatedgene sets of multiple euarchontans to investigate two major eventsin their early evolution: (i) lineage-specific genic changes that plau-sibly underpin colugo adaptations and provide insight into theirdistinctive biology, and (ii) lineage-specific genic changes that underpinancestral primate innovations. We annotated the colugo olfactory re-ceptor (OR) and vomeronasal (V1R) gene superfamilies (see Materialsand Methods), which encode odorant and pheromone receptors, andfound that they were intermediate in size between treeshrews and pri-mates (Fig. 2A and table S5). This finding supports a progressive loss of
Mason et al. Sci. Adv. 2016; 2 : e1600633 10 August 2016
OR gene repertoires that began in the ancestral lineage of Primato-morpha. We also found evidence for an increased importance of visionand hearing in the colugo lineage based on significant enrichment forpositively selected genes involved in these sensory modalities (Padj =0.0097 and Padj = 0.004, respectively) including genes that, when mutated,cause sensorial hearing loss and a variety of visual pathologies, notablymacular degeneration (Fig. 2C and databases S1 and S2). The increasednumber of loss-of-function OR gene mutations in colugos is consistentwith the view that selection for enhanced visual processing in a nocturnal,arboreal milieu corresponds with a relaxation of selection on olfaction(22). The magnitude of this hypothesized trade-off is greatest amongmammals that experienced adaptive shifts from nocturnality to diurnality(23), but here, we show prevalence in a decidedly nocturnal lineage.
Positive selectionwas detected on similar vision-related genes on theancestral primate branch, notably those inwhichmutations are implicatedin night blindness and retinal degeneration (for example, NXNL1 andC8orf37). The ancestral primate branch also showed significant enrich-ment for positively selected genes that underlie brain function (Padj =0.0001), including neurotransmitter genes implicated in behavioral dis-orders, such as schizophrenia andbipolar disorder, andneurodegenerativedisease (Padj = 0.0004) (databases S3 and S4). The latter category includesATXN10 and SACS, two genes in which mutations are associated withautosomal recessive spastic ataxia of Charlevoix-Saguenay, a human ge-netic disorder characterized by early-onset spastic ataxia, nystagmus, distalmuscle wasting, finger and foot deformities, and retinal hypermyelination(24). It is highly plausible that positive selection on this suite of genes un-derpins the early morphological and behavioral evolution from ground-dwelling ancestors to early arboreal primates adept at grasping andclimbing (25). The colugo patagium is the most extensive glidingmem-brane of any living vertebrate and stretches to the extremes of the digitsand the tail when fully extended, resembling a living kite (Fig. 2B). En-riched disease gene categories within the dermopteran positively selectedgene set include muscular atrophy (Padj = 0.0086) and protein deficiency(Padj = 0.0002), including genes involved in muscle contraction (forexample, SLC18A2, TNNI1, and TNNI3) (database S2). Eight positively
pril 7, 2018
Primates
Colugos
Treeshrews
Primates
Colugos
Treeshrews
Primates
Treeshrews
Colugos
Primatomorpha Sundatheria Primates + treeshrews
P = 1.08 10–4 P = 2.7e 10–7
A
CB
Fig. 1. Phylogenetic placement of Dermoptera. (A) Phylogenies depicting alternative hypotheses for dermopteran relationships relative to primates andtreeshrews. (B) Number of indels supporting each evolutionary relationship. (C) Number of transposed elements supporting each evolutionary relationship.
2 of 15

R E S EARCH ART I C L E
on April 7, 2018
http://advances.sciencemag.org/
Dow
nloaded from
selected genes are also associatedwith joint/digital deformities in a varietyof disorders (database S2). We speculate that adaptive changes in thissuite of genes contribute to the gross anatomical transformations of themusculature and skeleton that evolved in the arboreal ancestors of theseskilled gliders (4).
Colugo museomics, species diversity, and SoutheastAsian biogeographyColugos are widely distributed throughout Sundaland, a region wellknown for species richness and complex biogeographic patterns be-cause of fluctuations in temperature, sea level, and vegetation through-out the Neogene (14, 26). Although current Sundaic forest distributionsare in a refugial state with high sea stands, sea levels have beenmore than40 m below current levels for ~92% of the past 1 million years (14, 26).The exposure of the Sunda shelf connectedmany islandswith themain-land andwith eachother. It has beendifficult to decipher the geographicalextent of forested connections during low sea stands because geological,biotic, and climatic evidence remains inconclusive. Sundaic phylogeo-graphy is potentially informative in this regard; however, most widelydistributed species that have been studied are either volant (for example,birds or bats) or highly vagile (for example, carnivorans), andmany havediversified very recentlywithin the region (26, 27).We hypothesized thatcolugos should track ancient Sundaic forest distributions because oftheir probable origin and widespread diversification within Sundaland;
Mason et al. Sci. Adv. 2016; 2 : e1600633 10 August 2016
preference for closed-canopy forests; and reported isolation by rivers,disturbed forests, and savannahs (1, 2).
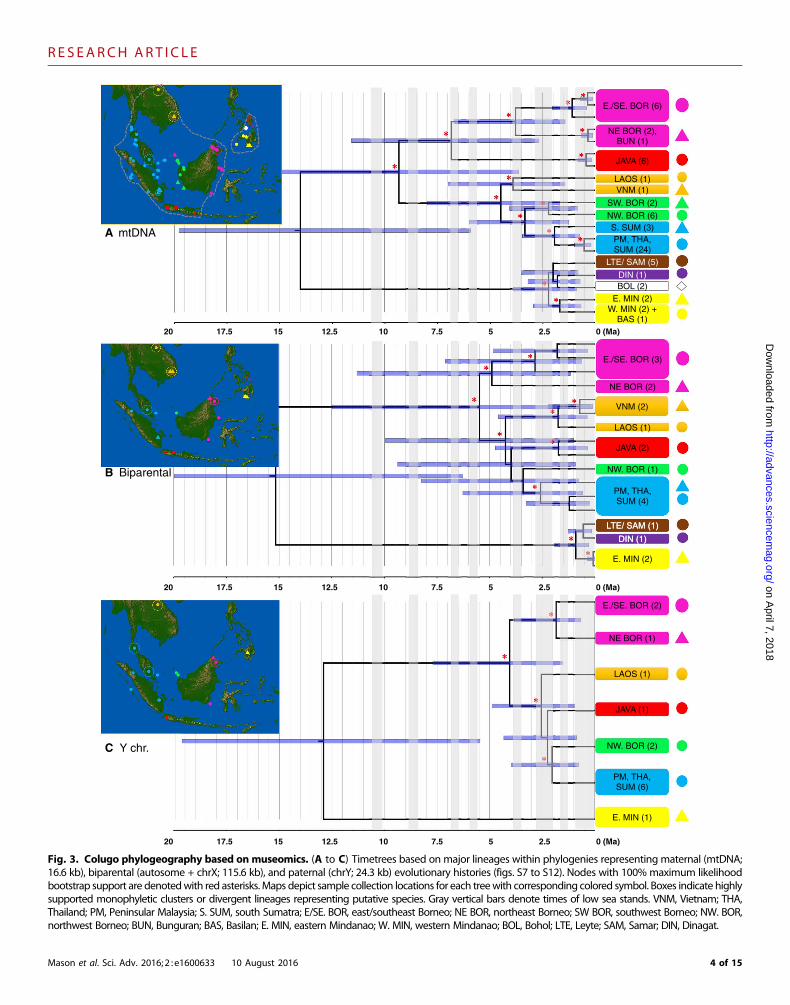
Given the scarcity of modern colugo samples with which to test thishypothesis, we exploited capture-based next-generation sequencingtechnologies (16) to retrieve orthologous DNA sequences from a broadsampling ofmuseum specimens (seeMaterials andMethods, tables S6 toS8, and database S5) distributed across Sundaland and the southernPhilippine islands of Greater Mindanao (Fig. 3A). We targeted ~140 kbpof biparental andY chromosome loci from66 colugomuseum specimensthat were between 28 and 121 years old and yielded adequate DNA (seeMaterials andMethods and database S6).We also obtainedmitogenomicsequences from both off-target nuclear capture reads and direct low-coverage genome sequencing (see Materials and Methods and table S6).The colugomolecular timetrees were calibratedwith the 95% confidenceinterval of our molecular estimate (average, 11.3 Ma) of divergence timebetween Galeopterus and Cynocephalus (see Materials and Methods,figs. S5 and S6, and table S9). Maximum likelihood–based maternal,paternal, and biparental phylogenies for both genera sort strongly bygeography, showing major colugo lineages diversified in the Miocene orPliocene (Fig. 3 and figs. S7 to S12). In addition, principal componentanalyses (PCAs) of X chromosome single-nucleotide polymorphism(SNP) variation (fig. S15) sort Sunda colugos largely by geographic loca-tion. PCAof 19 craniodentalmeasurements (figs. S13 and S14, tables S15and S16, and database S7) also sorts colugos roughly by geography to
A B
ACADVL CF CYP17A1 F12 IL27 LHX3 PROP1SPTAN1 SUOX TNFAIP8L2 UNC93B1
BFSP1APOECD40
MYO7AGJB2
CTC1
CX3CR1
OTOF
EPO SERPINF1
PAX2
USH2A
CDHR1
SOD2RP1L1BLOC1S
COL4A4LMO7
FAT4
VIM
PDCLINPP5J
INSC
GNG13
HPCAL4HPCAL5
CFPADM
ABT1 CHRD
Eye disease
F2DMP1 MARCO
PSMB8
Retinal disease
Macular degeneration
Hearing loss
Joint/skeletal abnormalities
CAV3GEMIN6EXOSC3STAC3
SLC18A2YAF2
ATP10BGEMIN3
MBPTRFTNNI1TNNI3
Skeletal muscle disease
BCS1L
Deaf-blind disorders
CProtein deficiency
Fig. 2. Functional gene evolution and positive selection in colugos and ancestral primates. (A) Relative abundance of functional V1R (orange) andOR(blue) genes across sequenced mammals. The size of the circles is proportional to the number of functional genes. (B) Colugo gliding with patagium fullyextended. (C). Venn diagram showing relationship between categories of enriched disease gene categories of colugo positively selected genes.
3 of 15
R E S EARCH ART I C L E
on April 7, 2018
http://advances.sciencemag.org/
Dow
nloaded from
PM, THA, SUM (24)
JAVA (6)
LAOS (1)
SW. BOR (2)
E./SE. BOR (6)
VNM (1)
NE BOR (2), BUN (1)
S. SUM (3)
E. MIN (2) BOL (2) DIN (1)
LTE/ SAM (5)
NW. BOR (6)
PM, THA, SUM (4)
JAVA (2)
LAOS (1)
E./SE. BOR (3)
VNM (2)
NE BOR (2)
E. MIN (2)
DIN (1)
LTE/ SAM (1)
NW. BOR (1)
PM, THA, SUM (6)
JAVA (1)
LAOS (1)
E./SE. BOR (2)
NE BOR (1)
NW. BOR (2)
E. MIN (1)
20 17.5 15 12.5 10 7.5 5 2.5 0 (Ma)
W. MIN (2) + BAS (1)
20 17.5 15 12.5 10 7.5 5 2.5 0 (Ma)
20 17.5 15 12.5 10 7.5 5 2.5 0 (Ma)
A mtDNA
B Biparental
C Y chr.
Fig. 3. Colugo phylogeography based on museomics. (A to C) Timetrees based on major lineages within phylogenies representing maternal (mtDNA;16.6 kb), biparental (autosome + chrX; 115.6 kb), and paternal (chrY; 24.3 kb) evolutionary histories (figs. S7 to S12). Nodes with 100% maximum likelihoodbootstrap support are denotedwith red asterisks.Maps depict sample collection locations for each treewith corresponding colored symbol. Boxes indicate highlysupported monophyletic clusters or divergent lineages representing putative species. Gray vertical bars denote times of low sea stands. VNM, Vietnam; THA,Thailand; PM, Peninsular Malaysia; S. SUM, south Sumatra; E/SE. BOR, east/southeast Borneo; NE BOR, northeast Borneo; SW BOR, southwest Borneo; NW. BOR,northwest Borneo; BUN, Bunguran; BAS, Basilan; E. MIN, eastern Mindanao; W. MIN, western Mindanao; BOL, Bohol; LTE, Leyte; SAM, Samar; DIN, Dinagat.
Mason et al. Sci. Adv. 2016; 2 : e1600633 10 August 2016 4 of 15
R E S EARCH ART I C L E
on April 7, 2018
http://advances.sciencemag.org/
Dow
nloaded from
Nuclear
Gen
etic
dis
tanc
eG
enet
ic d
ista
nce
Genera
MitochondrialA
B
Genera
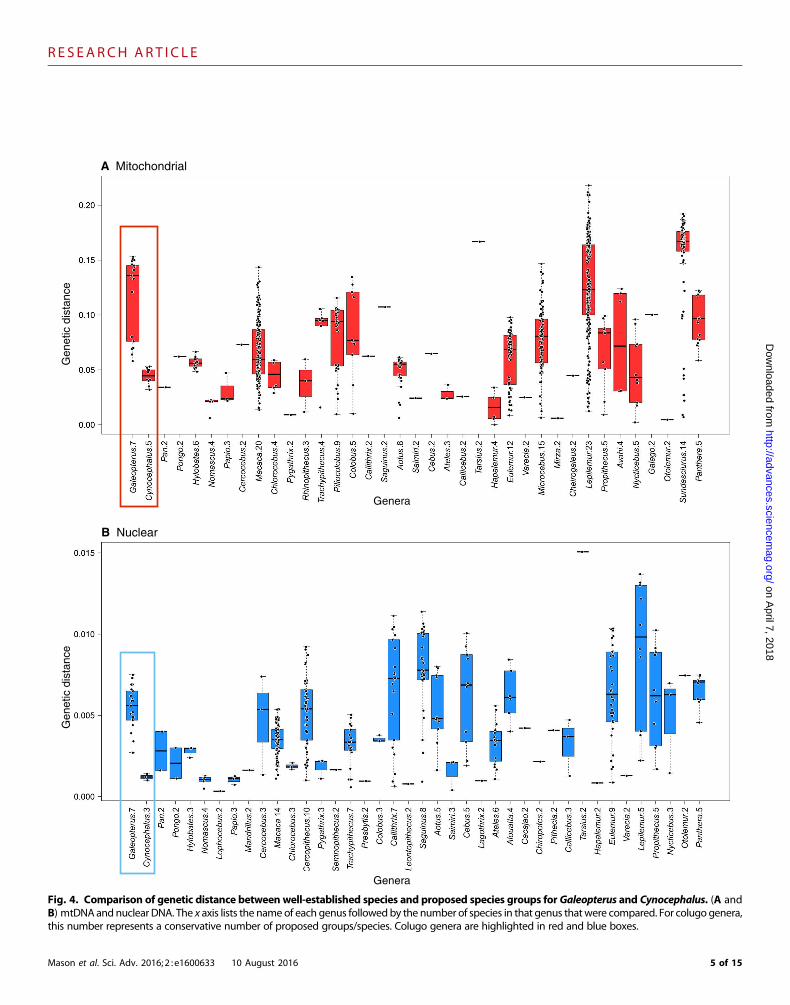
Fig. 4. Comparison of genetic distance between well-established species and proposed species groups forGaleopterus and Cynocephalus. (A andB) mtDNA andnuclear DNA. The x axis lists the nameof each genus followedby the number of species in that genus thatwere compared. For colugo genera,this number represents a conservative number of proposed groups/species. Colugo genera are highlighted in red and blue boxes.
Mason et al. Sci. Adv. 2016; 2 : e1600633 10 August 2016 5 of 15

R E S EARCH ART I C L E
on April 7, 2018
http://advances.sciencemag.org/
Dow
nloaded from
subsets of a continuous distribution but is insufficient to definitivelyseparate colugos fromdifferent geographicoriginsor evolutionary lineages(seeMaterials andMethods). Notably, the large island of Borneo harborsmultiple, deeply divergent colugo lineages, with eastern andwestern po-pulations spanning the oldest bifurcationwithinGaleopterus (Fig. 3, figs.S7 to S12, and tables S12 and S13). This finding supports our predictionthat ecological or topographic features such as mountains or major riversystems presented substantial dispersal barriers to colugos despite simu-lations that predict forested connections throughout Borneo up to the lastglacial maximum (26).
Ongoing debates argue for the presence/absence of a Pleistocenesavannah corridor separating Borneo from Peninsular Malaysia andSumatra, which may have prevented dispersal of forest-dependentspecies while allowing dispersal of larger terrestrial mammals betweenIndochina and Java (27, 28). We observed complete sorting of colugomitochondrial and nuclear haplotypes from Peninsular Malaysia/Sumatra and western Borneo (Fig. 3), suggesting an absence of Pleisto-cene genetic exchange despite evidence for a forested connection at thelast glacial maximum (26, 29).We infer that forested dispersal corridorsduring late Pleistocene glacial maximawere fragmentary or rare, or thatstrong reproductive isolating barriers to gene flow had accumulated inallopatry throughout the Pliocene, limiting introgression and retaininggeographic structure. In contrast, colugos from Thailand, PeninsularMalaysia, and Sumatra show less than 1.0% mitochondrial divergencefrom most of their satellite islands (table S14), supporting recent, geo-graphically limited dispersal and colonization following repeated insularsubmergence during the late Pleistocene.
Similar to the separation of colugos from Borneo versus Java andPeninsular Malaysia/Sumatra, Philippine colugo mitochondrial lineagesareprivate todifferent islandsandcoalesce to theearlyPleistocene (>1.5Ma)(Fig. 3A and figs. S7 to S9). These dates mirror similar genetically struc-tured patterns in several Philippine mammals, including tarsiers (30)andApomys (forest mice) (31), suggesting that current deepwater chan-nels formed effective barriers to interisland dispersal of arboreal lineagesfor much of the early Pleistocene. Nuclear gene loci also support mono-phyly of sampled islands (Fig. 3B and fig. S10), but divergences coalesceinstead to the late Pleistocene, suggesting more recent nuclear gene flowbetween islands at low sea stands via forested connections.
Despite the overall similarity in phylogeographic patterns betweenmitochondrial and nuclear genomes, some discordance in phylogenetictopologies suggests that inheritance patterns reflected bymale and femalecolugos differed (Fig. 3). Nuclear timetrees indicate Javan colugos di-verged ~4.0 Ma from Indochinese, Peninsular Malaysian/Sumatran,andwestBornean colugos.However, in themitochondrialDNA(mtDNA)phylogeny, Javan colugos are sister to east Bornean colugos and di-vergedmuch earlier at ~9.3Ma (Fig. 3). This earlierMiocenemitochon-drial divergence time and alternative topological placement of Javancolugos suggests that colugosmost likely colonized Java from the ancestraleast Borneo population. During Pliocene glacialmaxima, eastwardlymi-grating colugomales could have dispersed into Java fromwestern Sundaicsource populations and captured the localmtDNAgenome that ismoresimilar to East Bornean colugos. This finding is consistent with the ob-servation thatmale-biased dispersal is common inmammals and usuallyresults in introgression of a local population’smitochondria into the ge-nome of the dispersing population, oftenwith little nuclear introgression(32). Similar scenarios ofmale-mediated nuclear gene flowwould explainthe much older mtDNA versus nuclear divergence times of Philippinecolugos (Fig. 3).
Mason et al. Sci. Adv. 2016; 2 : e1600633 10 August 2016
To underscore the magnitude of population genetic differentiationwithin both colugo genera, we calculated between-group maximumlikelihood genetic distances for populations represented in the biparentaland mitogenomic phylogenies (Fig. 3) and compared them to geneticdistances betweenwell-established mammal species (Fig. 4). The averagebetween-group Sunda colugo mtDNA genetic distance was 11.7% (SD,3.57%; minimum, 5.8%), and the neutral X chromosome distance was0.58% (SD, 0.16%; minimum, 0.27%) between groups (tables S10 andS11), exceeding divergences between numerous well-accepted primateand Sundaic species (Fig. 4) (14). Partitioning of mtDNA genetic vari-ation was similarly high among seven Sundaic populations [fixation in-dices (FST) = 0.89, P < 1× 10⁻⁵] and little within populations (table S15).Philippine colugomtDNApopulation differentiation between andwith-in islands was also very high (FST = 0.96, P < 1× 10⁻⁵; 4.42% meandivergence), whereas the average X chromosome divergence is 0.12%(SD, 0.02%; minimum, 0.1% between three sampled populations; tablesS10 and S11), with fivemitochondrial and three nuclear lineages displayingequivalent or greater genetic divergence than is observed betweenmanyprimate species (Fig. 4) (30). Bayesian phylogenetics andphylogeography(BPP) analyses show the most significant support (PP ≥ 0.95) for sixSundaic and twoPhilippine species (tables S18 and S19). Considering theseresults, we argue that Sundaic and Philippine lineages each comprisemultiple distinct species based on the application ofmodern species con-cepts (for example, genetic, general lineage) that recognize separatelyevolving lineages (33).
ConservationOur findings have far-reaching implications for the conservation ofSunda andPhilippine colugos,which are presently listed as “least concern”on the InternationalUnion forConservation ofNature (IUCN)RedListwhen considered as just two species. Here, we present concordant mito-chondrial and nuclear genetic evidence for seven to eight colugo lineagesthat should be recognized as evolutionary significant units (ESUs) (34), oreven distinct species, deserving of a conservation management strategy.Inclusion of additional, deeply divergent (that is, >4 to 5%)mitochondriallineages from populations that currently lack nuclear DNA datamay in-crease the number of ESUs to 14 (fig. S8 and table S16). The current andfuture conservation status ofmany of these smaller, isolated species-leveltaxa (for example, West Java) is uncertain, given their present low con-servation status in the IUCN Red List and a general lack of populationmonitoring throughout their distribution. By 2010, ~70% of the pri-mary lowland forests within Sundaland had been removed (35). Muchof this land has been converted into oil palm and rubber plantations,and deforestation continues apace. Logging in the Philippines has alsoled to >90% reduction in forest cover over the past century (36). Pop-ulation and ecological assessments within Singapore report that whilecolugos can persist quite well within secondary tropical forests with>95% canopy cover, these folivorous generalists are rarely found withinboundaries ofmonoculture plantations (1, 2). Therefore, preservingmin-imally disturbed forests with high-density canopies within the range ofthese newly defined species will be critical for their future persistence andmay facilitate the survival of many other endangered species in this region.
MATERIALS AND METHODS
G_variegatus-3.0.2 genome assembly and annotationSample and DNA extraction. The DNA used for sequencing
Galeopterus variegatus was derived from a single male animal collected in
6 of 15

R E S EARCH ART I C L E
on April 7, 2018
http://advances.sciencemag.org/
Dow
nloaded from
West Java by M. Baba (Kitakyushu Museum of Natural History andHuman History, Japan) under Indonesian Institute of Sciences ResearchPermits 6541/I/KS/1999, 3452/SU/KS/2002, and 3380/SU/KS/2003 (15).Ethanol-preserved tissuewas used to extract genomicDNAwith aQiagenDNeasy Blood and Tissue Kit.
Genome sequencing and assembly. Total input sequence cov-erage of Illumina reads was 60× (45× 230- to 330-bp short inserts, 15×3-kb mate pairs, and 5× 8-kb mate pairs) using a genome size estimateof 3.0 Gb. The assembled sequence coverage was 55×. The combinedsequence reads were assembled using the SOAPdenovo2 software (37).The assembly was improved using an unpublished program designedto close gaps, and SSPACE (38). This draft assembly was referred to asGaleopterus_variegatus-3.0.2. This version had been gap-filled, error-corrected with approximately 12× Illumina reads, and cleaned of con-taminating contigs. The assembly was made up of a total of 179,513scaffolds with an N50 scaffold length of 249 kb (N50 contig lengthwas 20.8 kb). The assembly spanned over 3.2 Gb.
RNA sequencing. Annotation for the G_variegatus-3.0.2 ge-nome assembly was performed byNCBI and used RNAseq data fromsequence readarchive (SRA) samplesSAMN02736899andSAMN02736900.
Genome data set construction and analysesConstructing coding sequences and determining orthology.
One-to-one orthologous amino acid and nucleotide raw alignments fornine taxa (Homo sapiens, Pan troglodytes,Macaca mulatta, Callithrixjacchus, Otolemur garnettii,Ochotona princeps,Oryctolagus cuniculus,Canisfamiliaris, and Felis catus) (Ensembl v.79) were downloaded fromOrthoMaMv9 (39). Coding DNA sequences were extracted from ge-nome scaffolds for Galeopterus and Tupaia belangeri chinensis using theirrespective .gff annotation files. Coding DNA sequences were constructedfor Cynocephalus using the Galeopterus.gff annotation file andconsensus sequences derived from aligning Cynocephalus reads tothe Galeopterus reference genome with Burrows-Wheeler Alignment(BWA) (settings: -n 0.001 -o 1 -l 24 -k 2). All coding DNA sequenceswere translated to amino acid sequences and only the longest isoformwas kept for Galeopterus, Tupaia, and Cynocephalus. Orthologous se-quences were determined by a three-way protein Basic Local Align-ment Search Tool (BLAST) of human, mouse, and dog amino acidsequences to the longest amino acid isoforms from Galeopterus,Cynocephalus, and Tupaia followed by BLAST filtration. Filtration re-quired that each query taxon (human, mouse, and dog) must have onlyone best BLAST hit per database species (Galeopterus, Tupaia, orCynocephalus), the query sequence must have had >50% of databasesequence bases covered, and the best BLAST hit bit score must be 2%greater than its second bit score.
Aligningorthologousaminoacid isoformstoexistingOrthoMaMv9amino acid alignment. Unaligned orthologous amino acid longest iso-forms from Galeopterus, Tupaia, and Cynocephalus were aligned to theexisting raw amino acid alignment using Prank (40). Any stop codoncharacters (“*” or “_”) were masked with “X” before alignment. Thisensured proper reverse translation of amino acid alignments to aminoacid–guided nucleotide alignments. The stop codons were reintroducedto the amino acid–guided nucleotide alignments. Stop codon positionswere recorded, and any nucleotide gene alignment with an internal stopcodon not at the terminus was removed. Nucleotides corresponding toterminal stop codons were removed before analysis.
Genomic alignment filtration. Amino acid genome-wide codingDNA sequence alignmentswere filtered byGblocks v0.9.1 (41) and sub-
Mason et al. Sci. Adv. 2016; 2 : e1600633 10 August 2016
sequently filtered with two custom python scripts. The first removesthe entire gene alignment if one or more individuals include frameshiftmutations, which result in poor alignments for the length of the gene.The second removes highly divergent windows, which is useful formaskingpoorly aligned isoforms, and highly divergent regions of dubiousorthology. Filtrations were applied to amino acid alignments with awindow size of 10 amino acids, using a pairwise divergence calculationbetweeneach taxonandhuman.Pairwisedeletionwas applied todivergencecalculations within windows such that gaps andmissing data were skip-ped andmatched nucleotide pairs = the numerator andmatched +mis-matched nucleotide pairs = the denominator. Windows were excluded(maskedwithX’s) if the amino acid divergence for one taxonwas greaterthan 2 SDs away from the mean amino acid divergence across windowsfrom identical alignment coordinates assuming a normal distribution,and the amino acid window had to be more than 20% diverged fromhuman. In addition, all postfiltration amino acid sequences required>50%amino acid coverage and≥20 amino acids in total length. Filteredamino acid sequences were back-translated to nucleotide sequencesusing custom python scripts. Nucleotide sequences only contained basescorresponding to unambiguous (that is, notX) amino acid bases, and skipblocks that were removed by Gblocks (41).
We also applied a filter to identify and remove poor alignments andputative paralogous sequences. We constructed maximum likelihoodphylogenies for each gene alignment. Genes were excluded if the phylo-genetic distance between any two pairs of taxa was more than 2.5× theobserved genetic distance between human andmouse sequences, or over3.75 SDs away from themean branch length between terminal nodes forthe 21-taxondata set. The same filterwas applied to the 12-taxondata setto estimate the divergence time between colugo genera; however, weused a branch length cutoff of 2.5× the distance between human and dogas the criterion for gene exclusion. We chose human, mouse, and dog forthese calculations because these species have the highest qualitymammaliangenome assemblies, with relatively large phylogenetic distances that wecould use to compare to other taxa in the tree.
Phylogenetic analyses. RAxMLv8.1.17wasused for all phylogeneticanalyses with rapid bootstrap algorithm “-f a,” GTR + G “-mGTRGAMMA,” and 1000 bootstrap replicates for all nucleotide phy-logenies (42). Amino acid phylogenies were constructed with sim-ilar settings and JTT amino acid substitution matrix + G “-mPROTGAMMAJTT.” SVDquartets analyses (43) were conducted withPAUP* 4.0a147 (D. Swofford). SVDquartets was originally designedfor SNP data, but this method also performed well with simulated,multilocus data (43). All possible quartets were evaluated. Tree infer-ence was based on the QFM quartet assembly method with the multi-species coalescent tree model. We performed a search for the optimaltree and a bootstrap analysis with 500 pseudoreplicate data sets.
Codinggene indels. Apool of potentially phylogenetically inform-ative indels was identified by a custom python script that searches aminoacid gene alignments for indels supporting a specific phylogenetic hy-pothesis. Input gene alignments were unfiltered whole-genome aminoacid–coding sequence alignments (OrthoMaMv9) (39). Galeopterus,Cynocephalus, and Tupaia amino acid–coding sequences were thenadded to these alignments, as described in the Aligning orthologousamino acid isoforms to existingOrthoMaMv9 amino acid alignment sec-tion. Deletions were identified by shared gaps in taxa specified for a givenhypothesis, whereas insertions were identified as gaps shared by all taxaexclusive of a specific hypothesis. For the Primatomorpha hypothesis(Homo, Pan,Gorilla, Pongo,Nomascus, Papio,Macaca,Callithrix,Tarsius,
7 of 15
R E S EARCH ART I C L E
on April 7, 2018
http://advances.sciencemag.org/
Dow
nloaded from
Otolemur,Microcebus, andGaleopterus), we specified that all 12 taxa hada shared gap of equal length in a sequence alignment. In the first stage ofscreening, we relaxed indel identification to only require a subset of thesetaxa (Homo,Macaca, andGaleopterus) to have the deletion, whereas therest of the taxa (Pan, Gorilla, Pongo, Nomascus, Papio, Callithrix, Tarsius,Otolemur, and Microcebus) could, but were not required to, have thedeletion. This was done because of errors in the lower quality genomeassemblies and gene annotation for the remaining nine primates, whichwould prevent identification of the indel if all taxa were required to havethe indel. Similarly,Galeopterus and Tupaia alignments were requiredto support Sundatheria indels, andHomo,Macaca, and Tupaia align-ments were required to support primate + treeshrew indels. Candidateindels were filtered from the final list if any of the nonspecified taxa hada deletion (because of homoplasy or alignment error) with the samecoordinates as those specified in the hypothesis. Candidate gene align-ments weremanually curated to identify the final set of phylogeneticallyinformative indels (fig. S4). We required good indels to be flanked byconserved amino acid residues. We tested for statistical significance ofeach of the three specified hypotheses (table S4) following previouslydescribed methods (44).
Retrotransposons. Given the newly sequenced colugo genome,we further explored the question of how closely colugos were relatedto primates by focusing on anothermore complex but reliable set of raregenomic changes by screening for and analyzing the integrationpatterns of retroposed elements, virtually non-homoplastic phylogenet-ic markers. In mammals, retrotransposons integrated continuously overtime andwere accompanied by duplications of randomly selected 4 to 30nucleotides [4 to 12 for long terminal repeats (LTRs) and 8 to 30 for longinterspersed element 1 (LINE1s)] of the coincidental genomic targetsites. Target site duplications enabled verification of orthology of diagnosticretroposon insertions in different taxa. Identical retroposon insertions intwo species and an orthologous empty site in a third species supportedthe monophyly of the two and provided no support for relatedness ofthe third. We systematically tested all possible evolutionary hypothesesrelating colugos (Dermoptera) to treeshrews (Scandentia) and human(Primates), by statistically considering the following three possible evolu-tionary scenarios: a phylogenetic group composed of (i) colugo + human,(ii) colugo + treeshrew, or (iii) treeshrew + human.
On the basis of a previous successful screening in Euarchontoglires,we searched the newly sequenced colugo genome (fig. S3) for LTRs(MLT1A/MSTD) and LINE (L1MA5/6) retrotransposon subfamilies,which were both active during the euarchontan speciation (11, 45). Wethen compared the 29,222 LTR-MLT1A and 12,983 LINE-L1MA5/6hits we received alongwith their flanking target site duplications to othereuarchontan genomes, which yielded 221 pairwise-aligned regions. Aftercomparing these to the genomes of additional outgroup species (Ochotonaprinceps, Oryctolagus cuniculus, Mus musculus, Dipodomys ordii, Caviaporcellus, Ictidomys tridecemlineatus,Canis familiaris, Felis catus,Pteropusvampyrus, Equus caballus, Loxodonta africana, Procavia capensis,Choloepushoffmanni, and Dasypus novemcinctus), we generated a retroposonpresence/absence pattern for these species (table S2). Seventeen of theseretroposons were phylogenetically informative; 12 LTR-MLT1A/MSTDelements and 4 LINE-L1MA5/6 elements were present in both colugoand human but were absent in treeshrew and other mammals. Oneadditional LTR-MSTD element was present in both colugo and treesh-rew but absent in human and outgroups. To specifically test the thirdhypothesis (treeshrews + primates), we also screened 66,860 loci of thetwo-way (University of California, Santa Cruz) human-treeshrew align-
Mason et al. Sci. Adv. 2016; 2 : e1600633 10 August 2016
ment (34,703 MLT1A/MSTD and 32,157 LiMA5/6), yielding 198orthologous elements in human and treeshrew, but nonewere found thatwere also absent in colugo and the outgroup species (figs. S2 and S3).Sixteen retroposon elements shared between Primates and Dermopterasupport the sister group relatedness of these two eutherian orders (tableS2). The KKSC statistical test for genomic insertion data (http://retro-genomics.uni-muenster.de:3838/KKSC_significance_test/) (20) wassignificant (P = 2.7 × 10⁻⁷).
Sensory gene family expansions and positive selection. Pub-lished V1R and OR gene sequences from human, mouse, rat, cow,dog, andopossumwere used as the query sequences for BLAST searchesagainst the domestic cat genome. We enforced an E value threshold of10−5 for filtering BLAST results. All identified sequences were extended1 kb on either side for open reading frame identification and assessmentof functionality. If multiple start codons were found, then the alignmentresults of known intactmammalian V1R andOR amino acid sequenceswere used as guidance. Anyputative genes containing early stop codons,frameshift mutations, and/or incomplete gene structure (that is, threeextracellular regions, seven transmembrane regions, and three intracellularregions)weredesignated aspseudogenes. To confirmorthology,we alignedallmembers of theV1R andOR gene families and constructedmaximumlikelihood trees. We compared the V1R and OR gene trees generatedabove to amammalian species tree (9) to estimate gene gain and loss usingthe softwareNotung (46).Notunguses a given species tree andgene familynumbers for each terminal taxon, and then uses an automated event-inference parsimony approach to estimate ancestral gene family sizesand gene duplication histories on each branch of the phylogeny.
Two data sets were constructed to test for positive selection: (i) aseven-taxon data set (H. sapiens, C. jacchus, O. garnettii, G. variegatus,Tupaia belangeri chinensis, M. musculus, and C. familiaris) and (ii) aneight-taxon data set (H. sapiens, C. jacchus, O. garnettii, G. variegatus,C. volans, T. belangeri chinensis,M. musculus, and C. familiaris). Aminoacid sequences were downloaded from OrthoMaMv9. The initial seven-taxondata set contained 8514 gene orthologs, and the eight-taxondata setcontained 4899 gene orthologs. Individual genes were removed if at leastone taxon had a frameshift mutation or premature stop codon. A Perlscript pipelinewas applied, which removed poorly aligned or incorrectlyannotated amino acid residues caused by obvious gene annotation errorswithin the genome assemblies. Aligned amino acid sequences were usedto guide nucleotide coding sequences by adding insertion gaps and re-moving poorly aligned regions. Sequences were then back-translated tonucleotide sequences, and then genes still containing sequences for alltaxa were aligned with Prank (40) and filtered as described in the Ge-nomic alignment filtration section. We estimated nonsynonymous andsynonymous substitution rates using the software PAML 4.0 (47). Weused both branch-site and branch models as described in the study byMontague et al. (48) to identify accelerated rates of genes on specificbranches of each evolutionary tree and specific amino acid residues thatwere potentially under positive selection. Paired models representingdifferent hypotheses consisted of branch tests andbranch-site tests (fixedw = 1 versus variablew). For the branch tests, free-ratio tests versus one-ratio tests were used to identify putatively positively selected genes.These genes were subsequently tested by two- and one-ratio models toidentify genes with significant positive selection of one branch versus allotherbranches (two-branch test) (databases S1andS3). Significanceof like-lihood ratio test results used a threshold of P < 0.05.We assessed enrichmentofKyotoEncyclopedia ofGenes andGenomes (KEGG)pathway anddiseasegene association tests using WebGestalt (http://bioinfo.vanderbilt.edu/
8 of 15

R E S EARCH ART I C L E
on April 7, 2018
http://advances.sciencemag.org/
Dow
nloaded from
webgestalt/), and gene symbols as input (organism of interest:H. sapiens)(databases S2 and S4). Only significant KEGG Pathways and DiseaseAssociation categories were reported using a hypergeometric test, andthe significance level was set at 0.05, implementing the Benjamini andHochbergmultiple test adjustment to control for false discovery. Themostsignificant enrichment for genes in the colugo lineagewas related to variouscategories of cardiovascular disease and lipid metabolism in humans,notably those encoding apolipoproteins (that is,APOE andAPOH) thatfunction inphospholipid and lipoproteinmetabolism (Fig. 2C).However,we argue that this enrichment categorywas likely drivenby a largenumberof genes with pleiotropic effects in both sensory systems and skeletalmuscular function (shown in red in Fig. 2C; databases S1 to S4).
Colugo population data set construction andphylogenetic analyses
Sampling andDNAextraction. Ethanol-preserved tissues for CVOwere obtained from the Field Museum of Natural History (Chicago, IL).DNA was extracted using Qiagen DNeasy Blood and Tissue Kit fol-lowing the manufacturer’s specifications.
Dried museum tissues were sampled from three different institu-tions: the Smithsonian Institution, National Museum of Natural History,Washington, DC; the AmericanMuseum of Natural History, New York,NY; and theRafflesMuseumofBiodiversityResearch,NationalUniversityof Singapore (database S5). Formost of the specimens, we removed ~5mgof adherent tissue from inside the cranial cavity or nasal turbinatesystem. For some specimens, we collectedmultiple sample types, includ-ing hair, skin, cartilage, and bone. DNA was extracted from all tissuesthrough proteinase K digestion, protein precipitation and removal, andethanolDNAprecipitation.Digestionwas performedwith 520 ml of CellLysis Solution (Puregene D-5002; Gentra, Qiagen), 600 mg of proteinaseK, and 50 mg of linear acrylamide (Ambion) and incubated with a rotat-ing heat block at 60°C for 48 hours. Undigested samples were disruptedwith a pestle after 24 hours. Protein precipitation and ethanol DNApre-cipitation followed the standard guidelines of the Gentra/Puregene DNAisolation protocol (Qiagen).
Illumina library preparation, low-coverage sequencing, andnuclear capture. Illumina libraries for low-coverage sequencing wereprepared with the Illumina TruSeq HT Dual Indexing kit following themanufacturer’s specifications, except that Microcon-30 centrifugal filters(Millipore) were used following the blunt-ending step, before adapterligation, to retain degraded, low-molecular-weight DNA fragments(≥50 bp). Illumina libraries for nuclear capture were prepared withtheNEXTflex RapidDNASequencing Kit following themanufacturer’sspecifications. Libraries were sequenced on the Illumina HiSeq 2000.
Nuclear capture was performed following the study by Mason et al.(16) with slight modifications, including a 72-hour hybridization reac-tion with Illumina adapter blocking oligos (49, 50). Primers for probeamplificationwere designed from theG_variegatus-3.0.2 genomeassembly(database S6). Capture probes were generated through polymerase chainreaction (PCR) amplification of ~1 kb DNA fragments from modernGaleopterus (GVA), andCynocephalus (CVO)DNA extracts (15). Fourseparate probe pools were generated, including individuals from differ-ent geographical locations. These were applied to different targetsamples, on the basis of locality, to minimize sequence divergence be-tween the probe and the sample during capture experiments. Probeswere amplified from high–molecular weight DNA extracted from thefollowing frozen tissue samples: GVA_03 (Singapore, PeninsularMalaysia), GVA_04 (West Java), andCVO_02 (Leyte, Philippines). Three
Mason et al. Sci. Adv. 2016; 2 : e1600633 10 August 2016
probe pools [(i) Peninsular Malaysia, (ii) West Java, and (iii) PeninsularMalaysia + West Java] were used to perform hybrid capture fromGaleopterus samples, and theCVO_02probeswereused toperformhybridcapture from Cynocephalus samples. Amplifications were performedwith Platinum Taq DNA polymerase (Invitrogen), 1.5 mM MgCl2,0.8 mM deoxynucleotide triphosphates, and 2 mM primers under thefollowing cycling conditions: 2-min hot start at 94°C, denaturation for30 s at 94°C, touchdown annealing at 2 cycles each of 60°, 58°, 56°,54°, and 52°C, followed by 30 cycles at 50°C, extension for 1 min at72°C, and final extension for 5 min at 72°C. Successful amplicons werepooled (equal volume) and labeled with biotin using Biotin-High Prime(Roche).
Probe design and generation. X chromosome probes:We queriedthe draft colugo genome assembly using a set of human and mouse 1:1orthologous X chromosome coding sequences (Ensembl v67) usingBLAST to identify candidate colugo X chromosome contigs. We thenperformed reverse BLAST of the top scoring colugo contigs back to thehuman (GRCh37.p7), mouse (NCBI m37), and dog (CanFam 2.0)genome assemblies. Colugo contigs that had top-scoring BLAST hits totheXchromosome sequence fromall three specieswere considered ortho-logous. We generated nearly neutral X chromosome capture probes bydesigning PCR-based amplicons ~1 kb in length from within each re-trieved scaffold (database S6). We specifically targeted nonrepetitivesequence that was the greatest possible distance from any annotatedcoding sequence within the scaffold.
Y chromosome probes:Humanandmouse single-copyYchromosomegenes (51, 52) were queried against Galeopterus_variegatus-3.0.2 usingBLAST.We thenperformed reverseBLASTof the top-scoring colugo con-tigs back to the human genome (GRCh37.p7).We selected those contigswith a best BLAST hit to the same single-copy Y chromosome sequencesand/or to the X chromosome with >15% sequence divergence. We alsoconstructed maximum likelihood trees with each candidate contigand annotated X and Y orthologs to validate reciprocal monophyly ofX and Y gene sequences. We generated nearly neutral Y chromosomecapture probes in the same manner as described above for the X chro-mosome probes (database S6). Primers were validated as Y-specific bysimultaneous PCR screening of male and female DNA samples.
Autosomal gene probes:We designed capture probes to target a sub-set of selected protein-coding genes that influence vision, coat color, andbody size in mammals (database S6). Candidate human protein-codinggenes were queried against Galeopterus_variegatus-3.0.2 using BLAST.Identified exons were aligned to human genes and trimmed to humanexon boundaries. Orthology versus paralogy was determined by max-imum likelihood phylogenetic tree construction using a sequencematrix of knownmammalian orthologs, as well as closely related para-logs. We selected all exon-containing contigs that formed a mono-phyletic group with orthologous mammalian exons for the genesof interest. Primers were designed for all targeted sequences withBatchPrimer3 (53).
Modern DNA sequence trimming and filtration. Illumina se-quenceswere filteredwithTrimGalore! v0.3.3 to remove Illumina adaptersequences and trim low-quality bases (parameters: –paired –retain_unpaired -q 20 –length 30 –stringency 1 –length_1 31 length_2 31)(www.bioinformatics.babraham.ac.uk/projects/trim_galore/).
Modern genome reference assemblies. We generated ~14×paired-end Illumina read coverage for Cynocephalus from a 300-bp av-erage insert size Illumina library created from DNA of CVO_02. Areference assembly was constructed by aligning quality-filtered Illumina
9 of 15

R E S EARCH ART I C L E
on April 7, 2018
http://advances.sciencemag.org/
Dow
nloaded from
sequences to the G_variegatus-3.0.2 genome assembly with BWAv0.7.5a-r405, bwa-mem (http://bio-bwa.sourceforge.net/bwa.shtml). Ap-proximately 5× coverage of pen-tailed treeshrew (Ptilocercus lowii)Illumina reads (SRA accession no. SRP064536) was reference-alignedto the Tupaia genome scaffolds (54) using bwa-mem.
Museum DNA sequence trimming and filtration. Raw Illuminasequences were filtered with SeqPrep to remove Illumina adaptersequences, trim low-quality bases, and merge overlapping sequencepairs (parameters: -A AGATCGGAAGAGCACACGTC -B AGATCG-GAAGAGCGTCGTGT -q 13 -o 15 -L 30 -g) (https://github.com/jstjohn/SeqPrep).We removed the first and last three bases of each sequence read,because these bases are highly susceptible to chemical damage (55).However, a previous analysis of a subset of these DNA samples failedto indicate significant levels of DNA damage (16).
mtDNA, biparental, and Y chromosome sequence assembly.Mitochondrial genomes were assembled using both de novo (SOAPandCAP3, http://seq.cs.iastate.edu/cap3.html) (37,56) and reference-based(BWA aln v0.7.5a-r405) (57) assembly strategies. Multiple assembliesbasedon a range of k-mer valueswere performedon sequences fromeachindividual.Denovo assemblies that produced completemitogenomeswereused as reference sequences for other individuals, and selected on the basisof geographic proximity, to reduce sequence divergence between thereference sequence and the assembled reads. The reference sequences werethree completeGaleopterusmtDNAgenomes fromGenBank (AJ428849.1,JN800721.1, andAF460846.1) and five de novomitogenome assembliesfrom samplesGVA_22 (Palembang, Sumatra), GVA_45 (Sabah, Borneo),GVA_49 (Pulau Sebuko, Borneo), CVO_06 (Samar Island, Philippines),and CVO_08 (Tupi,Mindanao). Sequence reads from each sample werealigned to reference mitogenomes from several of the geographicallyclosest candidates, with BWA aln parameters -n 0.0001 -o 1 -l 24 -k 3.The assemblywith the highest percentage of reference bases covered andthe highest average depth of sequence was chosen for final consensussequence generation.
Biparentally inherited target loci were extracted from theG_variegatus-3.0.2 genome assembly and used as the reference sequence for reference-based assemblies for allGaleopterus samples. Sample CVO_08 was cho-sen as the reference sequence for all Cynocephalus assemblies because itmapped to the G_variegatus-3.0.2 probe sequences with the highestreference base coverage and depth. Reference assemblies were mappedusing BWA with parameters -n 0.001 -o 1 -l 24 -k 2.
Y chromosome sequence alignments for male Sunda colugos wereconstructed by aligning toY chromosome scaffolds identifiedwithin theG_variegatus-3.0.2 genome assembly. Philippine colugos were alignedto a Cynocephalus reference-based Y chromosome consensus sequencegenerated from aligning the reads of the highest quality male DNAspecimen, CVO_10, to G_variegatus-3.0.2 Y chromosome scaffolds.
Consensus sequences. Consensus sequences were called usingSAMtools (58) [v1.1-26-g29b0367 (htslib 1.1-90-g9a88137)] mpileup,vcftools [v1.1-88-g4c0d79d (htslib 1.1-90-g9a88137)], and vcfutils.pl.All biparental sequences were called as diploid requiring a minimumread depth of 3. Y chromosome sequences were called as haploid andrequired a minimum depth of 2.
Sequence alignments and phylogenetic analyses. Mafft v7.127(59) was used to align all consensus sequences. Alignments weremanuallycurated to remove poorly aligned regions. RAxML v8.1.17 was used forall phylogenetic analyses with rapid bootstrap algorithm -f a, GTR + G-mGTRGAMMA, and1000 bootstrap replicates for all nucleotide phylo-genies (42).
Mason et al. Sci. Adv. 2016; 2 : e1600633 10 August 2016
Genetic distance estimates. MEGA6 v6.06 (60) was used to cal-culate between-group mean genetic distances. Groups were defined asstrongly supported (100% bootstrap support) monophyletic groups orlineages that had at least ~3 to 5% between-group mtDNA divergenceand, in some cases, corroborative nuclear phylogenetic structure.MEGA-CC v7.0.7 (61) was used to calculate between-species divergencelevels within primate genera sampled from the study by Perelman et al.(62). Species comparisons were required to have >20% total sequencecoverage for mitogenome data and >50% coverage for nuclear data.We used themaximum composite likelihood + G distance and pairwisedeletion (removing all ambiguous bases for each sequence pair) for allcomparisons.We required aminimum of two species per genus for com-parisons to other primate and Sundaic mitochondrial and nuclear genesequences. Panthera interspecific distance calculations were derived fromwhole-genome alignments between several species (63). Boxplots wereconstructed in R v3.1.2 (R Core Team, 2014).
Analysis of molecular variance. To estimate the degree of differ-entiation among populations, we estimated FST using an analysis of mo-lecular variance (AMOVA) approach calculated in Arlequin v3.5.2.2(64). Mitochondrial haplotype data were compiled in DnaSP v5 usinga complete deletion-option alignment (7176-bp final sites) for 45 Sundacolugos to make the input Arlequin file (65). We defined seven popula-tions for the AMOVA, with 16,000 permutations.
PCAofgenetic variation. Weanalyzed 1340 SNPspresent in ourXchromosome capture data from12 individuals that represent the 7majorclades of Sunda colugos present in the biparental phylogenies. Specimenread group (@RG) and sample (SM:) information were introduced toeach .bamalignment file during the alignment. SNPswere called throughSAMtools mpileup, bcftools, and vcfutils.pl. SNPs were required to havea minimum root mean squared mapping quality of 30, a minimumdepth of 3, and a maximum depth of 100.
We used the R package SNPRelate to perform the PCA from the .vcffile. The first five principal components explained 19.4, 13.7, 12.2, 10.9,and 9.1% of the total variation. Therefore, only 65.3% of the total Xchromosome SNP variation was explained by the first five principalcomponents. Although only a small subset of the variation can be ex-plained in two-dimensional space, we still see clear separation of five ofthe seven proposed Sundaic species from the first two principal compo-nents (fig. S13). Biplots for principal components 1 to 6 are shown infigs. S15 to S19. The biplot for PC1 versus PC2 illustrated almost novariation between peninsular Malaysian/Sumatran individuals and thewestBornean individual (GVA_16).However, the first twoprincipal com-ponents are inappropriate for comparisons toGVA_16, becauseGVA_16is onlyminimally correlatedwithPC1 (r2 =0.11) andPC2 (r2=−0.05) andtherefore does not vary along dimensions described by PC1 and PC2. Onthe other hand, GVA_16 is highly correlated with PC5 (r2 = −0.35) andPC6 (r2 = −0.73) (table S19), meaning GVA_16 varies along these axesand the total variance explained by PC5 and PC6 is still substantial: 9.1and 7.5%, respectively. Because the total variance explained by each prin-cipal component is known and the sum of squares of one principal com-ponent’s loadings is equal to 1,we can calculate theproportionof varianceexplained by each variable (individual in this case) for each principal com-ponent. vi = (l)^2*(v), where vi is the percentage of total variance ex-plained by one variable (individual) for one principal component, l isthe variable component loading, and v is the percentage of total variationexplained by this one principal component. The calculated percentages oftotal variation explained by GVA_16 for PC1 and PC2 were 0.23 and0.03%, whereas those for PC5 and PC6 were 1.15 and 4.06%, respectively.
10 of 15

R E S EARCH ART I C L E
on April 7, 2018
http://advances.sciencemag.org/
Dow
nloaded from
Divergence datingCalibrations. The poor dermopteran fossil record precluded the
application of internal fossil calibrations. Therefore, we calibrated thesephylogenies with the 95% confidence intervals of the Galeopterus-Cynocephalus divergence date estimated from 2729 genome-wideorthologous coding gene alignments (final matrix length, 3,515,409 bp)extracted from 12 mammalian genomes (H. sapiens, P. troglodytes,M.mulatta,C. jacchus,O. garnettii,O. cuniculus,O.princeps,C. familiaris,F. catus,G. variegatus,C. volans, andT. belangeri chinensis) (OrthoMaMv9)(39) and 7 external fossil calibrations (table S9) as minimum and max-imum constraints.
MCMCTree. Divergence time estimationwas performed under sev-eral different analysis conditions that varied both rates (independentand autocorrelated) and calibration (hard and soft) following the studybyMeredith et al. (9).We chose an approximate-likelihoodmethod undera GTR+ Gmodel of sequence evolution in theMCMCTree package (47).We used v4.8a, which implements a revised dirichlet prior, enablingproper estimation of rgene_gamma (substitution rate through unit time)and proper retention of uncertainty in confidence intervals from fossilcalibrations (66). All MCMCTree calculations were performed twice toensure convergence. Timetree branch lengthswere averaged frommultipleruns, and the maximal range of 95% confidence intervals was kept torepresent maximal uncertainty for each node.
The rgene_gamma prior shape and scale (a and b) values were es-timated by first calculating the clock-like substitution rate per unit timein baseml for the whole phylogeny given a nucleotide alignment androoted phylogenywith branch lengths, and point estimates of divergencetime at available calibratednodes. Prior valuesa = (m/s)^2 andb =m/s^2,where m is the mean and s is the SD. Mean is the SD of the G dis-tribution when the shape parameter a= 1. If a = 1, thenwe solve for bwith m = s.
Molecular divergence time estimate between colugo genera.The mean divergence time between Galeopterus and Cynocephaluswas estimated as 11.3 Ma (with a 95% credibility interval of 5.1 to24.3 Ma). The point estimate coincided approximately with thelowest sea stand of any prior to that during the Tertiary (67) andrepresented the first glacial period that lowered sea levels belowpresent-day levels during the Miocene (68, 69). We note, however, thatconflicting long- and short-term eustatic sea level curves have been re-ported throughout the Neogene (70). We hypothesized that a forestedcorridor between Borneo and the Philippines must have been present tofacilitate colonization of the Philippines, likely via a route formed alongthe current Sulu archipelago.
Molecular divergence time estimates within colugo genera.Weestimateddivergence timeswithineachcolugogenususingMCMCTree,assuming an autocorrelated rates model with a soft calibration for thebasal split betweenCynocephalus andGaleopterusderived from the 95%confidence intervals of ourmolecular supermatrix-based estimate (Molec-ulardivergence timeestimatebetweencolugogenera section).Calculationswere performed with exact likelihood and an HKY-85 + G model ofsequence evolution. Data sets were reduced to one taxon per divergentlineage, selecting individuals with the greatest capture probe coverage.
Craniodental morphometric analysesMorphometric data included 19 linear craniodental measurements takenfrom 82 Sunda colugo skulls after sampling tissue frommuseum speci-mens (database S7).Datawere log-normalizedbeforePCA.PCAwasper-formed with the R package “prcomp” by singular value decomposition.
Mason et al. Sci. Adv. 2016; 2 : e1600633 10 August 2016
Weconducted PCAwith andwithout normalizing for body size (fig. S16).Condylobasal length (CBL) is a measurement of skull length and iscorrelated with body size; therefore, we divided measurements by CBLto normalize measurements for body size (3).
We observed the most geographic sorting in PCAs without normal-izing for body size and when recently diverged dwarf individuals wereremoved (fig. S18). After males, females, and dwarfs were normalizedfor body size, we saw little geographic structuring, which indicated thatmost of the variation in craniodental measurements was due to bodysize variation, confirming observations by Stafford and Szalay (3) (figs.S18 and S19). This is expected because all measurements are highly cor-relatedwithCBL (mean=0.68 andSD=0.18).However, themeasurementof “min.w.temps” (the minimum distance between the temporal lineson the roof of the skull) is least correlated with body size (r = 0.26).The min.w.temps (minimum width between temporal lines) vector isof significant magnitude and tends to sort Bornean colugos to a subsetof the distribution after body size normalization (fig. S17 and table S19).No PCAs based onmorphology were capable of sorting colugo popula-tions to mutually exclusive clusters; however, they did generally sort onthe basis of regional geographic distribution.
Dwarf colugos were defined as individuals with a 10% reduction inCBL compared to the average CBL of neighboring populations fromlarge islands or the mainland. Dwarf individuals residing on satelliteislands represent recent deviations in phenotype when compared to themorphology of larger islands and therefore are not representative of thedeeper evolutionary history of Sunda colugo species. This again agreeswithStafford and Szalay (3), who concluded that dwarf populations did notwarrant species-level classifications based on body size reduction alone.
Species classifications, BPP, and conservation unitsThe genetic species concept by Baker andBradly (33) argues that speciescan be classified on the basis of genetic isolation rather than reproductiveisolation. We present evidence for multiple, genetically divergentlineageswithin the Sunda andPhilippine colugo that, inmost of the cases,is consistent across two or more genetic transmission components (thatis, mtDNA, Y chromosome, and biparentally inherited loci). The geneticdivergence levels between six and seven Sunda colugo populations (tablesS10 to S13) exceeded those observed between numerous well-establishedspecieswithinothermammalianorders.NuclearDNAandmtDNAgeneticdivergence levels conservatively supported a classification scheme thatrecognizes a minimum of six species within Galeopterus. Three addi-tional ESUs, and potentially valid species, may be recognized withinthe genus [southwest Borneo (GVA_58 andGVA_61), southeast Borneo(GVA_49), and south Sumatra (GVA_21, GVA_22, and GVA_28)] onthe basis of divergent (>4%) mitochondrial haplotypes.
The nuclear sequence divergence estimated for all Cynocephaluspairwise comparisons exceeded that of at least seven pairs of describedprimate species (Fig. 4), potentially supporting up to three species-leveltaxa within the Philippines: Leyte, Dinagat, and easternMindanao. OnlymtDNAwas obtained from specimens of colugos sampled fromwesternMindanao (Zamboanga Peninsula), Basilan, and Bohol. Mitochondrialdivergence between Basilan and western Mindanao was less than 1%.However, themtDNA sequence divergence between Bohol andwesternMindanao and between these two populations and all other Philippinepopulationswasbetween3.2 and4.1%(estimateddivergence time,≥1.5Ma)(table S12 and Fig. 3A). Given the general concordance between diver-gent nuclear and mitochondrial lineages, we consider each of the fol-lowing five Philippine populations as ESUs worthy of formal recognition
11 of 15
R E S EARCH ART I C L E
on April 7, 2018
http://advances.sciencemag.org/
Dow
nloaded from
and separate conservation strategies: (i) eastern Mindanao, (ii) westernMindanao + Basilan, (iii) Dinagat, (iv) Leyte, and (v) Bohol.
We used BPP, which uses multispecies coalescent models (MSCs)(71), to test our proposed colugo species groups against alternative speciesmodels. We provided a fixed guide tree based on the structure recoveredfrom phylogenies constructed in RAxML to serve as our species delimi-tation model. We used transmodel inference, where two MSC models[rjMCMC (reversible-jump Markov chain Monte Carlo) algorithm 0and rjMCMC algorithm 1] were used to calculate the posterior probabil-ities for the splitting of each node within the phylogeny frommultilocusdata (A10: speciesdelimitation = 1 and speciestree = 0). BPP implementsthe rjMCMCalgorithm (72) andwas used to test species delimitationwithtwo parameter settings. The species delimitation parameters were set asspecies delimitation = 1 0 2 and as species delimitation = 1 1 2 1 in theBPP control file. The first model, species delimitation = 1 0 2, can betranslated as 1 (which means that species delimitation is not fixed), 0(whichmeans that rjMCMCalgorithm0 is used), and2 [whichmeans thate (a fine-tuning parameter) is equal to 2] (reasonable values for e are 1,2, 5, etc.) [(72), bppDOC.pdf]. The secondmodel, species delimitation =1 1 2 1, can be translated as 1 (which means that species delimitation isnot fixed), the second 1 (whichmeans that rjMCMCalgorithm1 is used),2 [whichmeans thata (shape) is equal to 2], and 1 [whichmeans thatm(mean) is equal to 1], where a andm are fine-tuning parameters. Equalprior probabilities for rooted trees were specified by speciesmodelprior =1. The provided fixed phylogeny represented the seven proposed speciesgroups of the Sunda colugo “((east Borneo and northeast Borneo),((Vietnam, Laos), (Java, (west Borneo, PeninsularMalaysia + Sumatra)))),”with 3 1 2 1 2 1 4 individuals representing each species group, respectively.For the Philippine colugo, we proposed three species for which we suc-cessfully captured adequate nuclearDNA: “(Mindanao, (Leyte, Dinagat))”using 211 individuals per species group.The rjMCMCmodel imitates thebiological species concept for speciation because it assumes that no recentgene flow (migration) is experienced between populations (72). Thismodel includes two main parameters qs and ts.
We estimated the G priors theta (qs), the parameter for modern andancestral species population sizes, and tau (ts), the divergence timeparameter for the root in the species tree [(71), bppDOC.pdf]. AG prior’sdistribution is defined by two parameters: shape parameter (a) and rateparameter (b). The shape parameter should be changed depending onhowaccurately the prior represents the data (71).High-confidence priorvaluesmight have a high a value, whereas low-confidence priors shouldhave a low a value. Increasing a restricts theG distribution, reducing howmuch parameters can vary in the posterior, whereas low a results in adiffuse G distribution, where estimated values can vary more freely inthe Bayesian posterior (71). To lessen restrictions on parameter esti-mates in the posterior, we chose a diffuse shape parameter a = 2. Weestimated the rate parameter b for G priors theta (qs) and tau (ts) witha = 2, the mean (m) of the G distribution, and the SD (s) of the G dis-tribution. The G prior theta is based on the population size, and themean of the G distribution is calculated as the average proportionof different sites between any two random sequences. The averagebetween-group genetic divergence for Sunda colugos is ~0.5%; therefore,the average proportion of differing sites is ~0.005, which is equal to themean (m) of the G distribution. For Cynocephalus,m = ~0.001. The rel-ationship between the mean and SD of a G distribution changes as achanges. The SD of the G distribution is s = m/√a. For Galeopterus, s =0.005/√2 = ~0.0035. The mean and SD are used to calculate b =m/s2 =0.005/0.00352 = 408. Calculated a and b for theta prior were 2408. The
Mason et al. Sci. Adv. 2016; 2 : e1600633 10 August 2016
mean for tau was calculated as the years of divergence of the root of thetree divided by the mutation rate (1 × 10⁻⁹). The mean of the Gdistribution for tau for Galeopterus was 5.5 × 10⁶/1 × 10−9 = 0.0055.Divergence time for the root was derived from the biparental timetree,which is ~5.5 Ma. The same procedure was followed for calculatingpriors for tau and Cynocephalus. Estimating priors followed the studyby Yang (71) and the BPP documentation. All BPP runs were executedtwice to confirm convergence. The sensitivity of BPP analyses was alsoassessed by varying the rate parameter (b) for theta and tau priors (71).The Galeopterus biparental data set was sensitive to variations of b fortheta when varied from 10 to 1000; however, it was not sensitive to var-iation in b for tau (table S11). The sensitivity of the biparental data setfor Galeopterus only changed the support values between the six- andseven-species models and the probability for the presence of a nodeseparating Laos from Vietnam; however, only six species were stronglysupported,withposterior probability >0.95 (table S17). TheCynocephalusdata set was neither sensitive to variation in b for theta, when varied from1000 to 2040, nor to variation in b from 10 to 1000 for tau (table S18).
Biogeography notesThe presence of a north-south savannah corridor running through theSouth China Sea and the Javan Sea during Pleistocene glacial maximawould likely have prevented dispersal of forest-dependent taxa, like co-lugos, between Borneo and Sumatra + Peninsular Malaysia, and be-tween Borneo and Java. However, the extent to which this savannahcorridor was present, and the continuity of the corridor across its pro-posed distribution, is debated (26, 27, 29). In general, glacialmaxima arecharacterized as dry periods with less precipitation, accompanied bydrastically lowered sea levels (−120m), which expose sandy seabed soils(73). Simulations have predicted that the last glacial maximum was verydry and cold, suggesting the possibility of a continuous savannah corri-dor. This finding is supported by genetic evidence from many forest-dependent vertebrate species distributed between Borneo, PeninsularMalaysia, and Sumatra, which have estimated divergence times predatingthe last glacial maximum (28). However, even if there was a savannahcorridor present at the last glacialmaximum, thereweremany interglacialperiods during prior millenia when forested corridors likely would haveexisted to connect these present-day landmasses (14, 26, 74).
SUPPLEMENTARY MATERIALSSupplementary material for this article is available at http://advances.sciencemag.org/cgi/content/full/2/8/e1600633/DC1fig. S1. Maximum likelihood phylogeny of Euarchontoglires based on an alignment of 631orthologous protein-coding sequences.fig. S2. Insertion-deletion evidence for colugo phylogenetic relationships based on transposons.fig. S3. Description of the transposon screening strategy.fig. S4. Phylogenetically informative protein-coding gene indels supporting Primatomorpha(P1 to P15), Sundatheria (S1 to S5), and Primates + Scandentia (PS1 to PS5).fig. S5. Maximum likelihood timetree showing seven nodes with external fossil calibrations.fig. S6. Maximum likelihood timetree showing seven nodes with external fossil calibrations,with euarchontan monophyly enforced.fig. S7. Maximum likelihood mtDNA tree based on a matrix of 53 colugos with ≥90%mitogenome coverage.fig. S8. Maximum likelihood mtDNA tree based on a matrix of 65 colugos with ≥30%mitogenome coverage.fig. S9. Maximum likelihood tree based on a combined nuclear (biparental + Y) matrix of 17 taxa.fig. S10. Maximum likelihood tree based on biparental data set (18 taxa).fig. S11. Maximum likelihood Y chromosome tree (depth 2) (15 taxa).fig. S12. Maximum likelihood Y chromosome tree (depth 3) (14 taxa).fig. S13. Biplot of PC1 and PC2 from PCA of colugo X chromosome variants.
12 of 15

R E S EARCH ART I C L E
ohttp://advances.sciencem
ag.org/D
ownloaded from
fig. S14. Biplot of PC2 and PC3 from PCA of colugo X chromosome variants.fig. S15. Biplot of PC3 and PC4 from PCA of colugo X chromosome variants.fig. S16. Biplot of PC4 and PC5 from PCA of colugo X chromosome variants.fig. S17. Biplot of PC5 and PC6 from PCA of colugo X chromosome variants.fig. S18. Biplot of morphometric PCA with males and females, and no dwarf specimensremoved.fig. S19. Biplot of colugo morphometric PCA, with male, female, and dwarf specimens, whereall measurements are normalized by body size.table S1. Mammals used in phylogenetic analyses.table S2. Presence/absence of phylogenetically informative retroposon markers and speciesdistribution.table S3. Location of diagnostic retroposon markers in the human genome.table S4. c2 calculation for phylogenetically informative indels.table S5. Colugo and select mammal V1R and OR gene annotation summaries.table S6. Nuclear capture efficiency.table S7. Adapter blocking oligos.table S8. Off-target mtDNA assembly statistics.table S9. External fossil calibrations used to calculate divergence timebetween the two colugo genera.table S10. Principal component loadings for morphometric PCA using males and females withno dwarf individuals.table S11. Principal component loadings for morphometric PCA using males, females, anddwarf individuals, and all measurements were normalized for body size.table S12. mtDNA maximum composite likelihood + G distance matrix calculated betweenseven Sunda colugo groups and five Philippine groups.table S13. X chromosome maximum composite likelihood + G distance matrix calculatedbetween seven Sunda colugo groups and three Philippine groups.table S14. Between-group mtDNA composite likelihood + G distance matrix for Sunda colugosfrom Thailand, Peninsular Malaysia, and Sumatra, and their satellite islands.table S15. Within-group mtDNA maximum composite likelihood + G distance matrix.table S16. Between-group mtDNA composite likelihood + G distance matrix for 10 Sunda colugogroups and 5 Philippine groups.table S17. BPP species estimation results for Sunda colugos.table S18. BPP species estimation results for Philippine colugos.table S19. Principal component loadings for X chromosome genetic variants.database S1. Dermopteran positively selected genes.database S2. Dermopteran WebGestalt results.database S3. Ancestral primate positively selected genes.database S4. Ancestral primate WebGestalt results.database S5. Museum specimen information.database S6. Primers used to amplify nuclear DNA capture probes.database S7. Craniodental morphometric measurements for 125 Sunda colugos.References (75–80)
n April 7, 2018
REFERENCES AND NOTES1. N. T-L. Lim, Colugo: The Flying Lemur of South-East Asia (Draco Publishing, Singapore, 2007),
80 pp.2. N. T-L. Lim, X. Giam, G. Byrnes, G. R. Clements, Occurrence of the Sunda colugo (Galeopterus
variegatus) in the tropical forests of Singapore: A Bayesian approach. Mamm. Biol. 78, 63–67(2013).
3. B. J. Stafford, F. S. Szalay, Craniodental functional morphology and taxonomy of dermopterans.J. Mammal. 81, 360–385 (2000).
4. K. C. Beard, in Primates and Their Relatives in Phylogenetic Perspective, R. D. E. MacPhee, Ed.(Springer, New York, 1993), pp. 63–90.
5. S. M. Jackson, R. W. Thorington Jr., Gliding mammals: Taxonomy of living and extinct species.Smithson Contrib. Zool. 10.5479/si.00810282.638.1 (2012).
6. J. Schmitz, M. Ohme, B. Suryobroto, H. Zischler, The colugo (Cynocephalus variegatus, Dermoptera):The Primates’ gliding sister? Mol. Biol. Evol. 19, 2308–2312 (2002).
7. J. E. Janečka, W. Miller, T. H. Pringle, F. Wiens, A. Zitzmann, K. M. Helgen, M. S. Springer,W. J. Murphy, Molecular and genomic data identify the closest living relative of primates.Science 318, 792–794 (2007).
8. R. D. Martin, Colugos: Obscure mammals glide into the evolutionary limelight. J. Biol. 7, 13 (2008).9. R. W. Meredith, J. E. Janečka, J. Gatesy, O. A. Ryder, C. A. Fisher, E. C. Teeling, A. Goodbla,
E. Eizirik, T. L. L. Simão, T. Stadler, D. L. Rabosky, R. L. Honeycutt, J. J. Flynn, C. M. Ingram,C. Steiner, T. L. Williams, T. J. Robinson, A. Burk-Herrick, M. Westerman, N. A. Ayoub,M. S. Springer, W. J. Murphy, Impacts of the Cretaceous terrestrial revolution and KPgextinction on mammal diversification. Science 334, 521–524 (2011).
10. M. A. O’Leary, J. I. Bloch, J. J. Flynn, T. J. Gaudin, A. Giallombardo, N. P. Giannini,S. L. Goldberg, B. P. Kraatz, Z.-X. Luo, J. Meng, X. Ni, M. J. Novacek, F. A. Perini,
Mason et al. Sci. Adv. 2016; 2 : e1600633 10 August 2016
Z. S. Randall, G. W. Rougier, E. J. Sargis, M. T. Silcox, N. B. Simmons, M. Spaulding,P. M. Velazco, M. Weksler, J. R. Wible, A. L. Cirranello, The placental mammal ancestorand the post–K-Pg radiation of placentals. Science 339, 662–667 (2013).
11. J. O. Kriegs, G. Churakov, J. Jurka, J. Brosius, J. Schmitz, Evolutionary history of 7SL RNA-derivedSINEs in Supraprimates. Trends Genet. 23, 158–161 (2007).
12. J. Lin, G. Chen, L. Gu, Y. Shen, M. Zheng, W. Zheng, X. Hu, X. Zhang, Y. Qiu, X. Liu, C. Jiang,Phylogenetic affinity of tree shrews to Glires is attributed to fast evolution rate. Mol. Phylogenet.Evol. 71, 193–200 (2014).
13. D. E. Wilson, D. M. Reeder, Mammal Species of the World: A Taxonomic and GeographicReference (Johns Hopkins Univ. Press, Baltimore, MD, 2005).
14. M. de Bruyn, B. Stelbrink, R. J. Morley, R. Hall, G. R. Carvalho, C. H. Cannon, G. van den Bergh,E. Meijaard, I. Metcalfe, L. Boitani, L. Maiorano, R. Shoup, T. von Rintelen, Borneo and Indo-china are major evolutionary hotspots for Southeast Asian biodiversity. Syst. Biol. 63,879–901 (2014).
15. J. E. Janečka, K. M. Helgen, N. T-L. Lim, M. Baba, M. Izawa, Boeadi, W. J. Murphy, Evidencefor multiple species of Sunda colugo. Curr. Biol. 18, R1001–R1002 (2008).
16. V. C. Mason, G. Li, K. M. Helgen, W. J. Murphy, Efficient cross-species capture hybridizationand next-generation sequencing of mitochondrial genomes from noninvasively sampledmuseum specimens. Genome Res. 21, 1695–1704 (2011).
17. G. L. Moritz, N. T-L. Lim, M. Neitz, L. Peichl, N. J. Dominy, Expression and evolution of shortwavelength sensitive opsins in colugos: A nocturnal lineage that informs debate on primateorigins. Evol. Biol. 40, 542–553 (2013).
18. A. D. Melin, K. Wells, G. L. Moritz, L. Kistler, J. D. Orkin, R. M. Timm, H. Bernard, M. B. Lakim,G. H. Perry, S. Kawamura, N. J. Dominy, Euarchontan opsin variation brings new focus toprimate origins. Mol. Biol. Evol. 33, 1029–1041 (2016).
19. M. S. Springer, R. W. Meredith, E. C. Teeling, W. J. Murphy, Technical comment on “Theplacental mammal ancestor and the post–K-Pg radiation of placentals”. Science 341, 613 (2013).
20. A. Kuritzin, T. Kischka, J. Schmitz, G. Churakov, Incomplete lineage sorting and hybrid-ization statistics for retroposon insertion data. PLOS Comput. Biol. 12, e1004812(2016).
21. J. I. Bloch, M. T. Silcox, D. M. Boyer, E. J. Sargis, New Paleocene skeletons and the relationshipof plesiadapiforms to crown-clade primates. Proc. Natl. Acad. Sci. U.S.A. 104, 1159–1164(2007).
22. G. Wang, P. Shi, Z. Zhu, Y.-P. Zhang, More functional V1R genes occur in nest-living andnocturnal terricolous mammals. Genome Biol. Evol. 2, 277–283 (2010).
23. R. A. Barton, A. Purvis, P. H. Harvey, Evolutionary radiation of visual and olfactory brainsystems in primates, bats and insectivores. Philos. Trans. R. Soc. Lond. B Biol. Sci. 348,381–392 (1995).
24. E. Storey, Genetic cerebellar ataxias. Semin. Neurol. 34, 280–292 (2014).25. R. W. Sussman, D. Tab Rasmussen, P. H. Raven, Rethinking primate origins again. Am. J. Primatol.
75, 95–106 (2013).26. C. H. Cannon, R. J. Morley, A. B. G. Bush, The current refugial rainforests of Sundaland are
unrepresentative of their biogeographic past and highly vulnerable to disturbance. Proc.Natl. Acad. Sci. U.S.A. 106, 11188–11193 (2009).
27. M. I. Bird, D. Taylor, C. Hunt, Palaeoenvironments of insular Southeast Asia duringthe Last Glacial Period: A savanna corridor in Sundaland? Quat. Sci. Rev. 24, 2228–2242(2005).
28. J. A. Leonard, R. J. den Tex, M. T. R. Hawkins, V. Muñoz-Fuentes, R. Thorington,J. E. Maldonado, Phylogeography of vertebrates on the Sunda Shelf: A multi‐species comparison.J. Biogeogr. 42, 871–879 (2015).
29. F. H. Sheldon, H. C. Lim, R. G. Moyle, Return to the Malay Archipelago: The biogeography ofSundaic rainforest birds. J. Ornithol. 156, 99–113 (2015).
30. R. M. Brown, J. A. Weghorst, K. V. Olson, M. R. M. Duya, A. J. Barley, M. V. Duya, M. V. Duya,M. Shekelle, I. Neri-Arboleda, J. A. Esselstyn, N. J. Dominy, P. S. Ong, G. L. Moritz, A. Luczon,M. L. L. Diesmos, A. C. Diesmos, C. D. Siler, Conservation genetics of the Philippine tarsier:Cryptic genetic variation restructures conservation priorities for an island archipelago primate.PLOS One 9, e104340 (2014).
31. S. J. Steppan, C. Zawadzki, L. R. Heaney, Molecular phylogeny of the endemic Philippinerodent Apomys (Muridae) and the dynamics of diversification in an oceanic archipelago.Biol. J. Linn. Soc. 80, 699–715 (2003).
32. R. J. Petit, L. Excoffier, Gene flow and species delimitation. Trends Ecol. Evol. 24, 386–393(2009).
33. R. J. Baker, R. D. Bradley, Speciation in mammals and the genetic species concept. J. Mammal.87, 643–662 (2006).
34. C. Moritz, Defining ‘evolutionary significant units’ for conservation. Trends Ecol. Evol. 9,373–375 (1994).
35. D. S. Wilcove, X. Giam, D. P. Edwards, B. Fisher, L. P. Koh, Navjot’s nightmare revisited:Logging, agriculture, and biodiversity in Southeast Asia. Trends Ecol. Evol. 28, 531–540(2013).
36. R. M. Brown, A. C. Diesmos, in Encyclopedia of Islands, R. Gillespie, D. Clague, Eds. (University ofCalifornia Press, Berkeley, 2009), pp. 723–732.
13 of 15

R E S EARCH ART I C L E
on April 7, 2018
http://advances.sciencemag.org/
Dow
nloaded from
37. R. Luo, B. Liu, Y. Xie, Z. Li, W. Huang, J. Yuan, G. He, Y. Chen, Q. Pan, Y. Liu, J. Tang, G. Wu,H. Zhang, Y. Shi, Y. Liu, C. Yu, B. Wang, Y. Lu, C. Han, D. W. Cheung, S.-M. Yiu, S. Peng,Z. Xiaoqian, G. Liu, X. Liao, Y. Li, H. Yang, J. Wang, T.-W. Lam, J. Wang, SOAPdenovo2: Anempirically improved memory-efficient short-read de novo assembler. GigaScience 1, 18(2012).
38. M. Boetzer, C. V. Henkel, H. J. Jansen, D. Butler, W. Pirovano, Scaffolding pre-assembledcontigs using SSPACE. Bioinformatics 27, 578–579 (2011).
39. E. J. P. Douzery, C. Scornavacca, J. Romiguier, K. Belkhir, N. Galtier, F. Delsuc, V. Ranwez,OrthoMaM v8: A database of orthologous exons and coding sequences for comparativegenomics in mammals. Mol. Biol. Evol. 31, 1923–1928 (2014).
40. A. Löytynoja, Phylogeny-aware alignment with PRANK. Methods Mol. Biol. 1079, 155–170(2014).
41. G. Talavera, J. Castresana, Improvement of phylogenies after removing divergent and ambiguouslyaligned blocks from protein sequence alignments. Syst. Biol. 56, 564–577 (2007).
42. A. Stamatakis, RAxML version 8: A tool for phylogenetic analysis and post-analysis of largephylogenies. Bioinformatics 30, 1312–1313 (2014).
43. J. Chifman, L. Kubatko, Quartet inference from SNP data under the coalescent model. Bioinformatics30, 3317–3324 (2014).
44. P. J. Waddell, H. Kishino, R. Ota, A phylogenetic foundation for comparative mammaliangenomics. Genome Inform. 12, 141–154 (2001).
45. J. O. Kriegs, G. Churakov, M. Kiefmann, U. Jordan, J. Brosius, J. Schmitz, Retroposed elements asarchives for the evolutionary history of placental mammals. PLOS Biol. 4, e91 (2006).
46. K. Chen, D. Durand, M. Farach-Colton, NOTUNG: A program for dating gene duplicationsand optimizing gene family trees. J. Comput. Biol. 7, 429–447 (2000).
47. Z. Yang, PAML 4: Phylogenetic analysis by maximum likelihood. Mol. Biol. Evol. 24,1586–1591 (2007).
48. M. J. Montague, G. Li, B. Gandolfi, R. Khan, B. L. Aken, S. M. J. Searle, P. Minx, L. W. Hillier,D. C. Koboldt, B. W. Davis, C. A. Driscoll, C. S. Barr, K. Blackistone, J. Quilez,B. Lorente-Galdos, T. Marques-Bonet, C. Alkan, G. W. C. Thomas, M. W. Hahn,M. Menotti-Raymond, S. J. O’Brien, R. K. Wilson, L. A. Lyons, W. J. Murphy, W. C. Warren,Comparative analysis of the domestic cat genome reveals genetic signatures underlyingfeline biology and domestication. Proc. Natl. Acad. Sci. U.S.A. 111, 17230–17235 (2014).
49. T. Maricic, M. Whitten, S. Pääbo, Multiplexed DNA sequence capture of mitochondrial genomesusing PCR products. PLOS One 16, e14004 (2010).
50. R. G. Del Mastro, M. Lovett, in Gene Isolation and Mapping Protocols (Springer, New York,1997), pp. 183–199.
51. H. Skaletsky, T. Kuroda-Kawaguchi, P. J. Minx, H. S. Cordum, L. D. Hillier, L. G. Brown,S. Repping, T. Pyntikova, J. Ali, T. Bieri, A. Chinwalla, A. Delehaunty, K. Delehaunty,H. Du, G. Fewell, L. Fulton, R. Fulton, T. Graves, S.-F. Hou, P. Latrielle, S. Leonard,E. Mardis, R. Maupin, J. McPherson, T. Miner, W. Nash, C. Nguyen, P. Ozersky, K. Pepin,S. Rock, T. Rohlfing, K. Scott, B. Schultz, C. Strong, A. Tin-Wollam, S.-P. Yang,R. H. Waterston, R. K. Wilson, S. Rozen, D. C. Page, The male-specific region of the humanY chromosome is a mosaic of discrete sequence classes. Nature 423, 825–837 (2003).
52. Y. Q. S. Soh, J. Alföldi, T. Pyntikova, L. G. Brown, T. Graves, P. J. Minx, R. S. Fulton,C. Kremitzki, N. Koutseva, J. L. Mueller, S. Rozen, J. F. Hughes, E. Owens, J. E. Womack,W. J. Murphy, Q. Cao, P. de Jong, W. C. Warren, R. K. Wilson, H. Skaletsky, D. C. Page,Sequencing the mouse Y chromosome reveals convergent gene acquisition andamplification on both sex chromosomes. Cell 159, 800–813 (2014).
53. F. M. You, N. Huo, Y. Q. Gu, M.-c. Luo, Y. Ma, D. Hane, G. R. Lazo, J. Dvorak, O. D. Anderson,BatchPrimer3: A high throughput web application for PCR and sequencing primer design.BMC Bioinformatics 9, 253 (2008).
54. Y. Fan, Z.-Y. Huang, C.-C. Cao, C.-S. Chen, Y.-X. Chen, D.-D. Fan, J. He, H.-L. Hou, L. Hu,X.-T. Hu, X.-T. Jiang, R. Lai, Y.-S. Lang, B. Liang, S.-G. Liao, D. Mu, Y.-Y. Ma, Y.-Y. Niu,X.-Q. Sun, J.-Q. Xia, J. Xiao, Z.-Q. Xiong, L. Xu, L. Yang, Y. Zhang, W. Zhao, X.-D. Zhao,Y.-T. Zheng, J.-M. Zhou, Y.-B. Zhu, G.-J. Zhang, J. Wang, Y.-G. Yao, Genome of the Chinesetree shrew. Nat. Commun. 4, 1426 (2013).
55. J. Dabney, M. Knapp, I. Glocke, M.-T. Gansauge, A. Weihmann, B. Nickel, C. Valdiosera,N. García, S. Pääbo, J.-L. Arsuaga, M. Meyer, Complete mitochondrial genome sequenceof a Middle Pleistocene cave bear reconstructed from ultrashort DNA fragments. Proc.Natl. Acad. Sci. U.S.A. 110, 15758–15763 (2013).
56. X. Huang, A. Madan, CAP3: A DNA sequence assembly program. Genome Res. 9, 868–877(1999).
57. H. Li, R. Durbin, Fast and accurate short read alignment with Burrows–Wheeler transform.Bioinformatics 25, 1754–1760 (2009).
58. H. Li, B. Handsaker, A. Wysoker, T. Fennell, J. Ruan, N. Homer, G. Marth, G. Abecasis,R. Durbin; 1000 Genome Project Data, The sequence alignment/map format and SAM-tools. Bioinformatics 25, 2078–2079 (2009).
59. K. Katoh, D. M. Standley, MAFFT multiple sequence alignment software version 7: Improvementsin performance and usability. Mol. Biol. Evol. 30, 772–780 (2013).
60. K. Tamura, G. Stecher, D. Peterson, A. Filipski, S. Kumar, MEGA6: Molecular evolutionarygenetics analysis version 6.0. Mol. Biol. Evol. 30, 2725–2729 (2013).
Mason et al. Sci. Adv. 2016; 2 : e1600633 10 August 2016
61. S. Kumar, G. Stecher, D. Peterson, K. Tamura, MEGA-CC: Computing core of molecular evolu-tionary genetics analysis program for automated and iterative data analysis. Bioinformatics 28,2685–2686 (2012).
62. P. Perelman, W. E. Johnson, C. Roos, H. N. Seuánez, J. E. Horvath, M. A. M. Moreira,B. Kessing, J. Pontius, M. Roelke, Y. Rumpler, M. P. C. Schneider, A. Silva, S. J. O’Brien,J. Pecon-Slattery, A molecular phylogeny of living primates. PLOS Genet. 7, e1001342(2011).
63. G. Li, B. W. Davis, E. Eizirik, W. J. Murphy, Phylogenomic evidence for ancient hybridizationin the genomes of living cats (Felidae). Genome Res. 26, 1–11 (2016).
64. L. Excoffier, H. E. L. Lischer, Arlequin suite ver 3.5: A new series of programs to performpopulation genetics analyses under Linux and Windows. Mol. Ecol. Resour. 10, 564–567(2010).
65. P. Librado, J. Rozas, DnaSP v5: A software for comprehensive analysis of DNA polymorphismdata. Bioinformatics 25, 1451–1452 (2009).
66. M. Dos Reis, T. Zhu, Z. Yang, The impact of the rate prior on Bayesian estimation ofdivergence times with multiple loci. Syst. Biol. 63, 555–565 (2014).
67. E. Meijaard, Solving mammalian riddles: A reconstruction of the Tertiary and Quaternarydistribution of mammals and their palaeoenvironments in island South-East Asia, unpublishedthesis, Australian National University, Canberra, Australia (2004).
68. B. U. Haq, J. Hardenbol, P. R. Vail, Chronology of fluctuating sea levels since the Triassic.Science 235, 1156–1167 (1987).
69. C. E. Uba, M. R. Strecker, A. K. Schmitt, Increased sediment accumulation rates andclimatic forcing in the central Andes during the late Miocene. Geology 35, 979–982(2007).
70. M. A. Kominz, J. V. Browning, K. G. Miller, P. J. Sugarman, S. Mizintseva, C. R. Scotese, LateCretaceous to Miocene sea-level estimates from the New Jersey and Delaware coastalplain coreholes: An error analysis. Basin Res. 20, 211–226 (2008).
71. Z. Yang, The BPP program for species tree estimation and species delimitation. Curr. Zool.61, 854–865 (2015).
72. Z. Yang, B. Rannala, Bayesian species delimitation using multilocus sequence data. Proc.Natl. Acad. Sci. U.S.A. 107, 9264–9269 (2010).
73. N. Raes, C. H. Cannon, R. J. Hijmans, T. Piessens, L. G. Saw, P. C. van Welzen, J. W. F. Slik,Historical distribution of Sundaland’s Dipterocarp rainforests at Quaternary glacial maxima.Proc. Natl. Acad. Sci. U.S.A. 111, 16790–16795 (2014).
74. D. J. Lohmann, M. de Bruyn, T. Page, K. von Rintelen, R. Hall, P. K. L. Ng, H.-T. Shih,G. R. Carvalho, T. von Rintelen, Biogeography of the Indo-Australian Archipelago. Annu.Rev. Ecol. Evol. Syst. 42, 205–226 (2011).
75. C. A. Emerling, H. T. Huynh, M. A. Nguyen, R. W. Meredith, M. S. Springer, Spectral shiftsof mammalian ultraviolet-sensitive pigments (short wavelength-sensitive opsin 1) areassociated with eye length and photic niche evolution. Proc. Biol. Sci. 282, 20151817(2015).
76. K. D. Rose, V. B. DeLeon, P. Missiaen, R. S. Rana, A. Sahni, L. Singh, T. Smith, Early Eocenelagomorph (Mammalia) from Western India and the early diversification of Lagomorpha.Proc. R. Soc. B 275, 1203–1208 (2008).
77. V. V. Kapur, S. Bajpai, Oldest South Asian tapiromorph (Perissodactyla, Mammalia) from theCambay Shale Formation, western India, with comments on its phylogenetic position andbiogeographic implications. The Palaeobotanist 64, 95–103 (2015).
78. M. J. Benton, P. C. J. Donoghue, R. J. Asher, M. Friedman, T. J. Near, J. Vinther, Con-straints on the timescale of animal evolutionary history. Palaeontol. Electron. 18,1–106 (2015).
79. S. G. B. Chester, J. I. Bloch, D. M. Boyer, W. A. Clemens, Oldest known euarchontan tarsalsand affinities of Paleocene Purgatorius to Primates. Proc. Natl. Acad. Sci. U.S.A. 112,1487–1492 (2015).
80. M. J. Benton, P. C. J. Donoghue, R. J. Asher, in The Timetree of Life, S. B. Hedges, S. Kumar,Eds. (Springer, New York, 2009), pp. 35–86.
Acknowledgments: We thank the following individuals for providing samples and/or technicalassistance during the course of this project: M. Baba, B. Covert, H. Minh Duc, L. Gordon, L. Heaney,J. Janečka, D. Lunde, P. Ng, T. Raudsepp, and M. Roberts. Funding: This work was supported in partby the NSF (grant EF0629849 to W.J.M.), Texas A&M Institute for Genome Sciences and Society (toW.J.M. and V.C.M.), Texas A&M College of VeterinaryMedicine and Biomedical Sciences (to V.C.M.),the German Research Foundation (grant SCHM1469/3-2 to J.S.), and the NIH–National HumanGenome Research Institute (grant 5U54HG00307907 to R.K.W.). Author contributions:W.J.M., V.C.M.,and G.L. conceived and designed the phylogenomic and population genomic experiments. K.M.H.,V.C.M., andW.J.M. performedmuseum specimen sampling. N.T-L.L. provided specimens. W.C.W.,P.M., and R.K.W. generated and assembled the Galeopterus draft genome sequence. V.C.M. generatedthe sequence data and reference assembly for Cynocephalus, performed mammalian phylogenomicanalysis, and wrote code for and performed the coding indel analysis. A.D.M. and N.J.D. providedPtilocercus sequence data. J.S. and G.C. conceived the retroposon presence/absence analysis. G.C.extracted potential informative retroposons. G.C., J.S., and L.D. analyzed phylogenetically diagnosticretroposons. G.C. compiled the genomic transposon landscape. V.C.M. and G.L. performed DNA
14 of 15

R E S EARCH ART I C L E
ortholog curation and developed code for filtration pipelines. G.L. performed olfactory and vom-eronasal gene annotation and gene family analysis. G.L. performed positive selection analyses.G.L. andW.J.M. performed positive selected gene curation and enrichment analyses. W.J.M., G.L.,A.D.M., and N.J.D. analyzed sensory gene results. V.C.M. and M.S.S. performed relaxed molecularclock analyses. M.S.S. performed SNP coalescent analyses. V.C.M. isolated museum DNA; de-signed and created capture probes; performed museum DNA capture; analyzed sequence data;and performed population genetic analysis, molecular dating, and BPP analyses. K.M.H. scoredmorphometric data. V.C.M. analyzedmorphometric data. W.J.M., V.C.M., J.S., A.D.M., M.J.D., M.S.S.,and K.M.H. wrote the article with input from the remaining authors. Competing interests: Theauthors declare that they have no competing interests. Data and materials availability: Datareported in this article are availableunderNCBIGenomeaccessionno.GCA_000696425.1G_variegatus-3.0.2, short read archive accession numbers SRX1854847-1854914, and Dryad accession
Mason et al. Sci. Adv. 2016; 2 : e1600633 10 August 2016
number doi:10.5061/dryad.6q738. Additional data related to this paper may be requested fromthe authors.
Submitted 24 March 2016Accepted 13 July 2016Published 10 August 201610.1126/sciadv.1600633
Citation: V. C. Mason, G. Li, P. Minx, J. Schmitz, G. Churakov, L. Doronina, A. D. Melin,N. J. Dominy, N. T-L. Lim, M. S. Springer, R. K. Wilson, W. C. Warren, K. M. Helgen,W. J. Murphy, Genomic analysis reveals hidden biodiversity within colugos, the sister group toprimates. Sci. Adv. 2, e1600633 (2016).
15 of 15
on April 7, 2018
http://advances.sciencemag.org/
Dow
nloaded from

Genomic analysis reveals hidden biodiversity within colugos, the sister group to primates
Dominy, Norman T-L. Lim, Mark S. Springer, Richard K. Wilson, Wesley C. Warren, Kristofer M. Helgen and William J. MurphyVictor C. Mason, Gang Li, Patrick Minx, Jürgen Schmitz, Gennady Churakov, Liliya Doronina, Amanda D. Melin, Nathaniel J.
DOI: 10.1126/sciadv.1600633 (8), e1600633.2Sci Adv
ARTICLE TOOLS http://advances.sciencemag.org/content/2/8/e1600633
MATERIALSSUPPLEMENTARY http://advances.sciencemag.org/content/suppl/2016/08/08/2.8.e1600633.DC1
REFERENCES
http://advances.sciencemag.org/content/2/8/e1600633#BIBLThis article cites 71 articles, 18 of which you can access for free
PERMISSIONS http://www.sciencemag.org/help/reprints-and-permissions
Terms of ServiceUse of this article is subject to the
registered trademark of AAAS.is aScience Advances Association for the Advancement of Science. No claim to original U.S. Government Works. The title
York Avenue NW, Washington, DC 20005. 2017 © The Authors, some rights reserved; exclusive licensee American (ISSN 2375-2548) is published by the American Association for the Advancement of Science, 1200 NewScience Advances
on April 7, 2018
http://advances.sciencemag.org/
Dow
nloaded from