Embed Size (px)
Citation preview

Genomic copy number dictates a gene-independent cell response to CRISPR-Cas9 targeting
Andrew J. Aguirre1,2,3,4*, Robin M. Meyers2*, Barbara A. Weir1,2, Francisca Vazquez1,2,
Cheng-Zhong Zhang1,2, Uri Ben-David2, April Cook1,2, Gavin Ha1,2, William F.
Harrington2, Mihir B. Doshi1,2, Maria Kost-Alimova2, Stanley Gill1,2, Han Xu2, Levi D. Ali2,
Guozhi Jiang2, Sasha Pantel2, Yenarae Lee2, Amy Goodale2, Andrew D. Cherniack2,
Coyin Oh2, Gregory Kryukov1,2, Glenn S. Cowley2, Levi A. Garraway1,2,3,4,5, Kimberly
Stegmaier1,2,4,6, Charles W. Roberts2,7, Todd R. Golub1,2,4,5, Matthew Meyerson1,2,4,8,9,
David E. Root2, Aviad Tsherniak2#, William C. Hahn1,2,3,4,9#
1 Dana-Farber Cancer Institute, 450 Brookline Avenue, Boston, MA 02215 USA 2 Broad Institute of Harvard and MIT, 415 Main Street, Cambridge, MA 02142 USA 3 Department of Medicine, Brigham and Women’s Hospital and Harvard Medical School,
75 Francis Street, Boston, MA 02115 4 Harvard Medical School, 25 Shattuck Street, Boston, Massachusetts 02115, USA. 5 Howard Hughes Medical Institute, 4000 Jones Bridge Road, Chevy Chase, Maryland
20815, USA. 6 Boston Children’s Hospital, Boston, MA, USA 7 St. Jude Children’s Research Hospital, 262 Danny Thomas Place, Memphis, TN 8 Department of Pathology, Harvard Medical School, Boston, Massachusetts, USA. 9 Center for Cancer Genome Discovery, Dana-Farber Cancer Institute, Boston, MA,
USA
* These authors contributed equally # Co-corresponding authors
William C. Hahn, M.D., Ph.D., 450 Brookline Avenue, Dana 1538, Boston, MA 02215
USA, 617-632-2641 (phone), 617-632-4005 (fax), [email protected]
Aviad Tsherniak, Broad Institute of Harvard and MIT, 415 Main Street, Cambridge, MA
02142 USA, 617-714-7506 (phone), [email protected]
Running Title: Genomic copy number impacts CRISPR-Cas9 screens
Research. on April 17, 2020. © 2016 American Association for Cancercancerdiscovery.aacrjournals.org Downloaded from
Author manuscripts have been peer reviewed and accepted for publication but have not yet been edited. Author Manuscript Published OnlineFirst on June 3, 2016; DOI: 10.1158/2159-8290.CD-16-0154

2
Conflict of Interest Disclosure: Levi A. Garraway and William C. Hahn are consultants
for Novartis. Matthew Meyerson receives research support from Bayer.
Research. on April 17, 2020. © 2016 American Association for Cancercancerdiscovery.aacrjournals.org Downloaded from
Author manuscripts have been peer reviewed and accepted for publication but have not yet been edited. Author Manuscript Published OnlineFirst on June 3, 2016; DOI: 10.1158/2159-8290.CD-16-0154
3
Abstract: The CRISPR-Cas9 system enables genome editing and somatic cell genetic
screens in mammalian cells. We performed genome scale loss-of-function screens in 33
cancer cell lines to identify genes essential for proliferation/survival and found a strong
correlation between increased gene copy number and decreased cell viability after
genome editing. Within regions of copy number gain, CRISPR-Cas9 targeting of both
expressed and unexpressed genes, as well as intergenic loci, led to significantly
decreased cell proliferation through induction of a G2 cell cycle arrest. By examining
single guide RNAs that map to multiple genomic sites, we found that this cell response
to CRISPR-Cas9 editing correlated strongly with the number of target loci. These
observations indicate that genome targeting by CRISPR-Cas9 elicits a gene-
independent anti-proliferative cell response. This effect has important practical
implications for interpretation of CRISPR-Cas9 screening data and confounds the use of
this technology for identification of essential genes in amplified regions.
Significance: We found that the number of CRISPR-Cas9-induced DNA breaks dictates a gene-
independent anti-proliferative response in cells. These observations have practical
implications for using CRISPR-Cas9 to interrogate cancer gene function and illustrate
that cancer cells are highly sensitive to site-specific DNA damage, which may provide a
path to novel therapeutic strategies.
Research. on April 17, 2020. © 2016 American Association for Cancercancerdiscovery.aacrjournals.org Downloaded from
Author manuscripts have been peer reviewed and accepted for publication but have not yet been edited. Author Manuscript Published OnlineFirst on June 3, 2016; DOI: 10.1158/2159-8290.CD-16-0154
4
Introduction Genome engineering using site-specific DNA endonucleases has operationalized
functional somatic cell genetics, enabling precise perturbation of both coding and non-
coding regions of the genome in cells from a range of different organisms. Zinc-finger
nucleases (ZFNs) and transcription activator-like effector nucleases (TALENs) are
custom-designed endonucleases that enable site-specific genome editing, but their
widespread application has been limited by reagent complexity and cost (1, 2). The
bacterial CRISPR-Cas9 (clustered regularly interspaced short palindromic repeats–
CRISPR-associated 9) system, which serves as an adaptive immune mechanism, has
been shown to serve as a versatile and highly effective technology for genome editing
(3-8). CRISPR-Cas9 applications require introduction of two fundamental components
into cells: (i) the RNA-guided CRISPR-associated Cas9 nuclease derived from
Streptococcus pyogenes and (ii) a single guide RNA (sgRNA) that directs the Cas9
nuclease through complementarity with specific regions of the genome (3, 7-11).
Genome editing occurs through induction of double stranded breaks in DNA by
the Cas9 endonuclease in an sgRNA-directed sequence-specific manner. These DNA
breaks can be repaired by one of two mechanisms: non-homologous end joining
(NHEJ) or homology-directed repair (HDR)(3, 12). CRISPR-Cas9-mediated gene knock-
out results from a DNA break being repaired in an error-prone manner through NHEJ
and introduction of an insertion/deletion (indel) mutation with subsequent disruption of
the translational reading frame (11). Alternatively, HDR-mediated repair in the presence
of an exogenously supplied nucleotide template can be utilized to generate specific
point mutations or other precise sequence alterations. Furthermore, nuclease-dead
versions of Cas9 (dCas9) can also be fused to transcriptional activator or repressor
domains to modulate gene expression at specific sites in the genome (13-17). CRISPR-
Cas9 technology has been effectively utilized in cultured cells from a myriad of
organisms (12), and has also been successfully employed for in vivo modeling in the
mouse germline (18, 19) as well as for somatic gene editing to generate novel mouse
models of cancer (20-24).
Recent studies have shown that CRISPR-Cas9 can be effectively used for loss-
of-function genome scale screening in human and mouse cells (9-11, 25-28). These
Research. on April 17, 2020. © 2016 American Association for Cancercancerdiscovery.aacrjournals.org Downloaded from
Author manuscripts have been peer reviewed and accepted for publication but have not yet been edited. Author Manuscript Published OnlineFirst on June 3, 2016; DOI: 10.1158/2159-8290.CD-16-0154
5
approaches rely upon lentiviral delivery of the gene encoding the Cas9 nuclease and
sgRNAs targeting annotated human or mouse genes. Multiple different CRISPR-Cas9
knock-out screening libraries have been developed, including both single-vector (Cas9
and the sgRNA on the same vector) and dual-vector systems (9, 25, 29). Pooled
CRISPR-Cas9 screening is typically performed through massively parallel introduction
of sgRNAs targeting all genes into Cas9-expressing cells, with a single sgRNA per cell.
Positive- or negative-selection proliferation screens are performed and sgRNA
enrichment or depletion is measured by next generation sequencing (9, 10).
To date, only a limited number of genome-scale CRISPR-Cas9 knock-out
screens have been reported, and these screens have demonstrated a high rate of target
gene validation (9-11, 25-28). Wang et al. recently reported an analysis of cell essential
genes using CRISPR-Cas9-mediated loss-of-function screens in four leukemia and
lymphoma cell lines (28). Hart et al. also reported identification of core and cell line-
specific essential genes in five cancer cell lines of differing lineages (25). This approach
has enabled the identification of known oncogene dependencies as well as many novel
essential genes and pathways in individual cancer cell lines (25, 28). In addition to
knock-out screens, proof-of-concept CRISPR-activator or inhibitor screens using dCas9
and genome-scale sgRNA libraries have also been successfully conducted (30, 31).
Moreover, in vivo genome-scale screens with CRISPR-Cas9 have also been performed
for cancer-relevant phenotypes (32).
To identify cancer cell vulnerabilities in a genotype- and phenotype-specific
manner, we performed genome-scale loss-of-function genetic screens in 33 cancer cell
lines representing a diversity of cancer types and genetic contexts of both adult and
pediatric lineages (Table S1)(29). When we analyzed essential genes across the entire
dataset, we unexpectedly found a robust correlation between apparent gene essentiality
and genomic copy number, where the number of CRISPR-Cas9-induced DNA cuts
predict the cellular response to genome editing.
Research. on April 17, 2020. © 2016 American Association for Cancercancerdiscovery.aacrjournals.org Downloaded from
Author manuscripts have been peer reviewed and accepted for publication but have not yet been edited. Author Manuscript Published OnlineFirst on June 3, 2016; DOI: 10.1158/2159-8290.CD-16-0154
6
Results High-resolution CRISPR-Cas9 screening in cancer cell lines for gene dependencies
Using the dual-vector GeCKOv2 CRISPR-Cas9 system, we performed genome-
scale pooled screening in 33 cancer cell lines representing a wide diversity of adult and
pediatric cancer types (Table S1; Fig. 1A). Cancer cell lines were transduced with a
lentiviral vector expressing the Cas9 nuclease under blasticidin selection. These stable
cell lines were then infected in replicate (n = 3 or 4) at low multiplicity of infection
(MOI<1) with a library of 123,411 unique sgRNAs targeting 19,050 genes (6 sgRNAs
per gene), 1,864 miRNAs and 1,000 non-targeting negative control sgRNAs (29).
Infected cells were purified by selection with puromycin and then passaged with an
average representation of 500 cells per sgRNA until an endpoint of 21 or 28 days. At
the endpoint, the abundance of sgRNAs in these cells was quantitated from genomic
DNA by massively parallel sequencing and compared to the abundance in the plasmid
pool used for virus production to define the relative drop-out or enrichment in the screen
(Fig. 1A).
The log2 normalized read counts of the 1000 non-targeting sgRNAs show a slight
enrichment in representation from the original plasmid DNA pool, indicating that on
average non-targeting guides have no substantial detrimental effect on viability (Fig.
1B). As positive controls, we also compiled a list of 213 putative cell essential genes
that are part of the ribosome, proteasome or spliceosome complexes (Table S2). In
contrast to the non-targeting negative control guides, the read counts of these positive
controls in late time point samples were substantially depleted compared to the initial
reference pool (Fig. 1B). Replicate reproducibility after quality control for each cell line
was consistently high (Fig. 1C).
We defined a CRISPR-Cas9 guide score for each sgRNA in the screen by first
calculating the log2 fold-change in abundance from the screen endpoint compared to the
pool of plasmid DNA, followed by subtraction of the median scores of the negative
control sgRNAs (see Methods). Hence, in our dataset a guide score of zero equates to
the median effect of negative control sgRNAs. Similarly, the second most depleted
sgRNA for each gene was used to call a single “second best” CRISPR-Cas9 guide
Research. on April 17, 2020. © 2016 American Association for Cancercancerdiscovery.aacrjournals.org Downloaded from
Author manuscripts have been peer reviewed and accepted for publication but have not yet been edited. Author Manuscript Published OnlineFirst on June 3, 2016; DOI: 10.1158/2159-8290.CD-16-0154
7
score and therefore allow the representation of gene level dependencies (33).
Significant depletions of sgRNAs are denoted by negative CRISPR-Cas9 guide scores
and correspond to decreased proliferation/survival after CRISPR-Cas9-mediated gene
editing.
To identify genes essential for viability in each cell line across a variety of cancer
contexts, we rank ordered genes by second best CRISPR-Cas9 guide score from most
negative (most depleted) to positive (not depleted or enriched). For each cell line, we
identified key vulnerabilities corresponding to both oncogenic driver lesions as well as
non-oncogene dependencies (Fig. 1D-F). For instance, we observed that KRAS, ESR1
and EGFR were essential genes in KRAS mutant (Fig. 1D), estrogen-receptor positive
(Fig. 1E) and EGFR mutant cell lines (Fig. 1F), respectively. Moreover, we observed
strong dependency on a number of other cancer-relevant genes and therapeutic targets
in each cell line, including BRD4, MTOR, IGF1R, CCND1 and MYC (Fig. 1D-F). Thus,
our approach to CRISPR-Cas9 screening yields high quality reproducible data that
enables identification of cancer gene dependencies across many different cellular
contexts.
Genomic copy number variation predicts the response to CRISPR-Cas9 genome targeting independent of target gene expression Copy number alterations (CNA’s) are the most common genetic alterations in
human epithelial cancers (34) and lead to overexpression of driver oncogenes in
cancer. To identify such driver oncogenes responsible for cancer cell proliferation and
survival within regions of copy number amplification, we mapped sgRNAs in CRISPR-
Cas9 screens of each cell line to genomic coordinates and investigated the relationship
of apparent gene essentiality with ABSOLUTE DNA copy number (CN) data available
from the Broad Institute-Novartis Cancer Cell Line Encyclopedia (CCLE) (Methods;
Table S1) (35, 36). We observed a striking enrichment of negative CRISPR-Cas9 guide
scores for genes that reside in copy number amplifications in several cancer cell lines
(Fig. 2A-B; Fig. S1A-C). Specifically, CRISPR-Cas9 targeting of genes that reside in
amplifications conferred decreased proliferation/survival as compared with targeting
genes that mapped outside of these amplifications. As expected, we found that known
Research. on April 17, 2020. © 2016 American Association for Cancercancerdiscovery.aacrjournals.org Downloaded from
Author manuscripts have been peer reviewed and accepted for publication but have not yet been edited. Author Manuscript Published OnlineFirst on June 3, 2016; DOI: 10.1158/2159-8290.CD-16-0154
8
oncogenes, such as AKT2, MYC, or CDK4, scored as essential in cell lines that
harbored amplifications involving these genes. However, we also noted that sgRNAs
targeting other genes in these same amplified regions appeared similarly detrimental to
cell proliferation or survival (Fig. 2A-B; Fig. S1A-C).
When we compared these observations to those derived from genome scale
RNA interference (RNAi) screens performed in the same cell lines (37), we failed to
observe enrichment of apparently essential genes within amplifications and instead
identified a small number of genes in each region of copy number gain that scored as
essential (Fig. 2A-B; Fig. 1B-C). Moreover, we found that sensitivity to CRISPR-Cas9
targeting within amplified genomic regions was also observed for genes that failed to
show significant mRNA expression (Fig. 2C-D; Fig. S1D-F). These observations
suggested that the observed dependency of cancer cells to CRISPR-Cas9 targeting of
genes resident in amplifications was not the direct consequence of deleting the target
gene.
We next sought to determine if this “CRISPR-CN relationship” also extends to
lower levels of copy number alterations. For all 33 cancer cell lines screened, we
defined genomic segments by their copy number and labeled those segments with their
median CRISPR-Cas9 guide score across all sgRNAs targeting within the segment (Fig.
2E-F; Fig. S2). We found a striking correlation between copy number and median
CRISPR-Cas9 guide score across even low ranges of copy number alterations. The
1000 “negative control” sgRNAs in the CRISPR-Cas9 library exhibited minimal effects
on cell proliferation and viability, and the majority of other data points had lower
CRISPR-Cas9 guide scores than the median of these negative controls (Fig. 2E-F, Fig.
S2). Strikingly, targeting a locus with an ABSOLUTE copy number of 1, which
corresponds to a single CRISPR-Cas9-induced DNA cut, also resulted in reduced
proliferation/viability in comparison to the negative controls (Fig. 2E-F, Fig. S2),
indicating that even a discrete instance of CRISPR-Cas9 genome modification
significantly affects cell proliferation/viability. For each incremental increase in DNA
copy number, we observed a progressive decrease in CRISPR-Cas9 guide scores in
nearly all of the cell lines that we screened (Fig. 2E-F, Fig. S2). Moreover, we observed
this CRISPR-CN correlation among both low-level copy number gains (e.g. 1-2 extra
Research. on April 17, 2020. © 2016 American Association for Cancercancerdiscovery.aacrjournals.org Downloaded from
Author manuscripts have been peer reviewed and accepted for publication but have not yet been edited. Author Manuscript Published OnlineFirst on June 3, 2016; DOI: 10.1158/2159-8290.CD-16-0154
9
copies), as well as high-level amplifications, and both focal and arm-level copy number
alterations (Fig. 2, S1, S2).
Amplified genes rank among the top dependencies in genome scale negative-selection CRISPR-Cas9 screens
Given the profound impact of genomic copy number on apparent gene
essentiality in CRISPR-Cas9 screens as well as the high rate of CNAs in cancer cells,
we reasoned that this effect could result in a high false-positive rate for identification of
essential genes. To characterize the impact of these false positives on CRISPR-Cas9
screening data, we compared the apparent essentiality of amplified genes with that of
all other genes within each of the 33 cell lines. Specifically, we examined CRISPR guide
scores for all genes and observed that genes residing in focal high-level amplifications
consistently rank among the most highly essential genes identified for each cell line
(Fig. 3A-B; Fig. S3A-C).
We then performed an aggregate analysis of apparent essentiality due to
amplified genes across the entire CRISPR-Cas9 dataset. For this analysis of all genes
and all cell lines, we accounted for differences in Cas9 activity/efficacy across cell lines
using cell-line specific Z-score normalization (Methods). To investigate relative gene
dependencies within the dataset, we calculated composite CRISPR-Cas9 gene scores
using the ATARiS algorithm, as previously described (Methods) (38). We next
calculated a global Z-score for gene dependency values, representing the number of
standard deviations from the mean of the distribution. In parallel, we performed a similar
analysis of an available RNAi dataset (Fig. 3C). Thus, this analysis enables a global
examination of apparent relative gene dependencies and their relationship to genomic
copy number amplification. Strikingly, we observed that increasingly essential genes
(lower Z-scores) were more likely to reside on copy number amplifications in CRISPR-
Cas9 data but not RNA-interference data (Fig. 3C). For genes with a Z-score of less
than or equal to -5, 27.6% (81/294) of those genes reside within a copy number
amplification, defined as a copy number ratio (ABSOLUTE / average sample ploidy)
greater than two. Thus, copy number amplification is a strong determinant of apparent
essentiality in CRISPR-Cas9 screening data, and if not properly accounted for, this
Research. on April 17, 2020. © 2016 American Association for Cancercancerdiscovery.aacrjournals.org Downloaded from
Author manuscripts have been peer reviewed and accepted for publication but have not yet been edited. Author Manuscript Published OnlineFirst on June 3, 2016; DOI: 10.1158/2159-8290.CD-16-0154
10
CRISPR-CN relationship will likely contribute to a higher false-positive rate for calling
gene dependency. When we inspected results from another recently published study
that screened five human cancer cell lines with a different CRISPR-Cas9 library (25),
we found that gene copy number also predicted essentiality (Fig. S4A-E), thus
indicating that the CRISPR-CN correlation occurs independently of the specific sgRNA
library used.
The CRISPR-CN relationship is observed across multiple different chromosome structural alterations To investigate the CRISPR-CN relationship across a spectrum of different
chromosomal structural alterations, we performed whole genome sequencing (WGS) on
three cell lines harboring copy number gains and amplifications and showing a strong
correlation between copy number and CRISPR-Cas9 guide scores (HT29, CAL120,
PANC-1). We observed the CRISPR-CN relationship in the context of several different
structural amplification patterns, including near arm-level copy number gain (Fig. S5A),
simple tandem duplication (Fig. S5A), low-level copy gain from inter-chromosomal
translocation (Fig. S5B), and complex amplicon structure involving breakage-fusion-
bridge cycles and chromothripsis (Fig. S6). These observations suggest that the
CRISPR-CN correlation occurs at both low and high-amplitude copy number changes
and does not relate to specific types of chromosomal structural variation.
The response of cells to CRISPR-Cas9 genome targeting correlates with the total predicted number of DNA cuts at target loci
We have demonstrated that there is a gene-independent anti-proliferative effect
of CRISPR-Cas9 targeting that occurs with even a single target locus, increases with
increasing genomic copy number, and is independent of the type of structural alteration
that leads to increased copy number. Thus, we hypothesized that this gene-
independent response reflects the total number of CRISPR-Cas9-induced DNA cuts at
target loci. The GeCKOv2 library contains 3593 sgRNAs that have multiple perfect
match alignments along with a protospacer-adjacent motif (PAM) sequence within the
hg19 reference genome. We typically remove these sgRNAs prior to analyzing cancer
Research. on April 17, 2020. © 2016 American Association for Cancercancerdiscovery.aacrjournals.org Downloaded from
Author manuscripts have been peer reviewed and accepted for publication but have not yet been edited. Author Manuscript Published OnlineFirst on June 3, 2016; DOI: 10.1158/2159-8290.CD-16-0154
11
cell line dependencies. However, these promiscuous sgRNAs provided an opportunity
to perform a comparative analysis of the response of cells to CRISPR-Cas9 editing and
the relationship to the predicted number of CRISPR-Cas9-induced DNA cuts based on
either copy number or number of perfect-match on- and off-target alignments (“multiple
alignment analysis”). For the copy number analysis, we used only sgRNAs mapping to a
single genomic locus. For the multiple alignment analysis, we reintroduced these multi-
targeting sgRNAs and only used sgRNAs targeting non-amplified regions, thus allowing
segregation of the impact of CRISPR-Cas9-induced DNA cuts due to copy-number or
promiscuous multiple genome alignments.
We observed that sgRNAs that target multiple sites in the unamplified genome
yield a strong anti-proliferative effect, similar to that observed for sgRNAs targeting
genomic amplifications (Fig. 4A-D). We found that the number of predicted DNA cuts
correlated strongly with the observed depletion of sgRNAs, whether mediated by copy
number (Fig. 4A,C) or multiple alignments (Fig. 4B,D). To quantify this effect, we
calculated the slope coefficient for a linear regression of CRISPR guide scores versus
predicted number of cuts for both singly and multiply targeted sets of sgRNAs within
each cell line. We term these coefficients the CRISPR-Cut Index (CCI) for single-
targeting sgRNAs where the amount of cutting depends on copy number (CCI-CN, Fig.
4A,C), and for multiple-targeting sgRNAs where the amount of cutting depends on the
number of multiple alignments (CCI-MA, Fig. 4B,D). We observed that the CCI-CN and
the CCI-MA for each individual cell line are comparable, suggesting that the decreased
proliferation/survival response of cells to increases in the number of loci targeted by
CRISPR-Cas9 is similar whether the number of target loci is driven by copy number
alteration of a single target locus or multiple different target loci within the genome (Fig.
4E).
We further investigated whether there was a difference in the cell response to
CRISPR-Cas9-induced DNA cuts targeted to different chromosomes or multiple cuts
within a single chromosome. Using the multiple alignment analysis described above, we
further split multiple-targeting sgRNAs into sets that either targeted multiple
chromosomes (inter-chromosomal) or targeted sites within only a single chromosome
(intra-chromosomal). We observed, on average, lower guide scores for sgRNAs
Research. on April 17, 2020. © 2016 American Association for Cancercancerdiscovery.aacrjournals.org Downloaded from
Author manuscripts have been peer reviewed and accepted for publication but have not yet been edited. Author Manuscript Published OnlineFirst on June 3, 2016; DOI: 10.1158/2159-8290.CD-16-0154
12
targeting multiple inter-chromosomal loci as compared to sgRNAs targeting a
comparable number of intra-chromosomal loci (Fig. 5A-B; Fig. S7). Moreover, the most
promiscuous sgRNAs targeting more than ten inter-chromosomal loci rank among most
depleted sgRNAs in pooled screening data for each cell line (Fig. 5C-D). Thus, the
response of cancer cells to multiple CRISPR-Cas9-induced DNA cuts is greater when
multiple loci are targeted across several chromosomes. Beyond the effects of target
gene disruption, these observations further suggest that CRISPR-Cas9 gene editing
also yields an anti-proliferative response that is truly gene-independent.
Variation in cell response to CRISPR-Cas9 targeting
Since CCI-CN and CCI-MA are correlated across cell lines, we next calculated a
net index for each cell line by integrating the number of targeted sites and genomic copy
number to predict the total number of cuts for all sgRNAs. We observed a plateau in
CRISPR guide scores beyond a certain number of cuts for each cell line, typically
ranging from 10-50 cuts, suggesting an important limitation in the resolution of sgRNA
depletion for sgRNAs targeting many genomic sites (Fig. S8A, B). Informed by this
observation, we fit a segmented least-squares model composed of a general linear
regression below a breakpoint (estimated by the model) and a flat segment above this
breakpoint. The slope coefficient of the first segment of the model is used as the net
index (CCI-Total) reflecting the magnitude of the effect of cutting on CRISPR guide
scores.
The CCI-Total showed considerable variability across cell lines. While the limited
sample size of this CRISPR-Cas9 screening dataset restricts the power for a full multi-
variate analysis of the genetic and biologic influences on the CCI-Total, we found two
variables that impact this index. Investigating the median CRISPR-Cas9 guide score for
“positive control” cell essential genes as a surrogate for CRISPR-Cas9 efficacy in the
screens, we identified a strong correlation of this metric with the CCI-Total (Fig. S8C),
suggesting that Cas9 efficacy influences the strength of the CRISPR-CN relationship.
We also identified that TP53 mutation status also correlates with the CCI-Total (Fig.
S8D). While both TP53 mutant and wild-type cells clearly demonstrate the CRISPR-CN
relationship, wild-type cells on average show a more pronounced effect, therefore
Research. on April 17, 2020. © 2016 American Association for Cancercancerdiscovery.aacrjournals.org Downloaded from
Author manuscripts have been peer reviewed and accepted for publication but have not yet been edited. Author Manuscript Published OnlineFirst on June 3, 2016; DOI: 10.1158/2159-8290.CD-16-0154
13
suggesting that the p53 pathway may play a role in mediating the gene-independent
response of cells to CRISPR-Cas9 targeting.
CRISPR-Cas9 targeting of amplified regions induces DNA damage and a G2 cell cycle arrest
To interrogate a specific amplification example, we introduced sgRNAs targeting
genes and intergenic regions inside and outside of the 19q13 amplicon in the PANC-1
pancreatic cancer cell line (Fig. 6A) and measured viable cell number in a short-term,
arrayed format Cell-Titer-Glo luminescent assay (Fig. 6B, S9A). We observed a
significant reduction in cell proliferation for sgRNAs targeting loci inside the amplicon as
compared to outside the amplicon at 6 days after expression of each sgRNA. We noted
that the observed effect was equally strong for sgRNAs targeting both amplified genes
and intergenic regions and was at least as potent as those sgRNAs targeting non-
amplified known essential genes, such as RPL4, U2AF1 and MYC (Fig. 6B).
Furthermore, we noted that CRISPR-Cas9 targeting of other loci that are not highly
amplified resulted in decreased cell proliferation compared to Lac-Z and Luciferase
targeting negative controls. In addition to interrogating sgRNAs targeting amplified
regions, we also investigated the effect of two multi-targeted sgRNAs on cell
proliferation in this 6-day assay, including one sgRNA with multiple perfect match
alignments as well as an sgRNA previously shown to target the genome at 151 different
loci (Fig. 6B) (39). Here, we also observed a potent reduction in cell proliferation with
these multi-targeted sgRNAs.
To investigate the mechanism of decreased cell proliferation observed with
sgRNAs targeting amplified regions or multiple genomic loci, we utilized a high-content
imaging assay to interrogate cell cycle kinetics in multiple sgRNAs in parallel (40). At 48
hours after expression of these sgRNAs, we observed decreased incorporation of the
modified thymidine analogue EdU, with diminished S-phase suggestive of decreased
DNA synthesis (Fig. 6C). We also observed an accumulation of cells in the G2 phase of
the cell cycle with sgRNAs targeting amplified regions or multiple genomic loci (Fig. 6C).
Moreover, we observed an increased number of γ-H2AX foci in cells infected with these
amplicon-targeting or multi-targeted sgRNAs as compared to control sgRNAs,
Research. on April 17, 2020. © 2016 American Association for Cancercancerdiscovery.aacrjournals.org Downloaded from
Author manuscripts have been peer reviewed and accepted for publication but have not yet been edited. Author Manuscript Published OnlineFirst on June 3, 2016; DOI: 10.1158/2159-8290.CD-16-0154
14
suggesting that increased DNA damage leads to a G2 cell cycle arrest in these cells
(Fig. 6C-D). Notably, we did not observe significant levels of apoptosis at this same time
point by measuring cleaved PARP by immunoblotting (Fig. S9B). We have performed
similar experiments with the chromosome 12 amplicon in the CAL120 breast cancer cell
line and confirmed that these observations are not restricted to the chromosome 19
amplicon in PANC-1 (Fig. S10A-E).
Overall, these observations suggest that CRISPR-Cas9 genome targeting of
amplified regions induces a potent early DNA damage response and cell cycle arrest
that is proportional to the number of target loci. Notably, this anti-proliferative effect is
independent of targeting expressed protein coding genes and does not depend on
target gene disruption and protein loss, which typically occurs on a longer timescale
(10).
Increased genomic copy number of cell essential genes may protect from complete gene knock-out
Although we found that an increased number of target loci for each sgRNA
generally leads to increased gene-independent CRISPR-Cas9-mediated cytotoxicity, we
reasoned that since CRISPR-Cas9 genome editing is often incomplete within a cell
population, more copies of a target gene could also make a cell resistant to complete
gene disruption and protein loss through CRISPR-Cas9 targeting of that locus.
Therefore, we hypothesized that certain cell essential gene sets may show the opposite
correlation with DNA copy number in pooled negative-selection screening. When we
examined the CRISPR-CN correlation across all genes screened in all cell lines from
the dataset, we first found an overall negative correlation as expected. However, we
also observed that cell essential genes from the KEGG gene sets for the proteasome,
ribosome and spliceosome exhibit a CRISPR-CN correlation significantly shifted in the
positive direction relative to the rest of the genes in the genome, i.e. higher copy
number correlated with higher CRISPR gene scores and less observed gene
essentiality (Fig. 7). These observations suggest that increased DNA copy number for
target genes with strong underlying essentiality may protect cells from complete
CRISPR-induced knock-out of these genes, and thus manifest as relatively less
Research. on April 17, 2020. © 2016 American Association for Cancercancerdiscovery.aacrjournals.org Downloaded from
Author manuscripts have been peer reviewed and accepted for publication but have not yet been edited. Author Manuscript Published OnlineFirst on June 3, 2016; DOI: 10.1158/2159-8290.CD-16-0154
15
apparent essentiality compared with other essential genes in copy number normal
regions of the genome. Together, these data further highlight the importance of
considering target gene copy number and gene function in the interpretation of negative
selection pooled screening data.
Discussion
Using data from the genome scale interrogation of essential genes in 33 cancer
cell lines by CRISPR-Cas9, we report that the number of CRISPR-Cas9-induced DNA
cuts strongly influences the proliferation/survival response of cells to CRISPR-Cas9
genome editing in a gene-independent manner. We report that targeting sequences
within copy number amplifications with the CRISPR-Cas9 endonuclease induces
decreased cell proliferation/viability that is independent of target gene expression or the
structure of the targeted amplicon. The magnitude of the effect increases with the
amplitude of copy number amplification, and CRISPR-Cas9 targeting within high-level
amplifications shows some of the most profound anti-proliferative effects observed in
the screens. Moreover, analysis of sgRNAs targeting multiple genomic sites also
revealed a strong correlation of cell proliferation/viability with the number of predicted
CRISPR-Cas9 DNA cuts. Thus, we propose that there are two types of responses to
CRISPR-Cas9 targeting in cancer cell lines: (i) an early anti-proliferative effect of
CRISPR-Cas9-induced DNA cuts that increases with the number of cuts conferred by
each sgRNA and that is independent of the target gene, and (ii) the gene essentiality
resulting from CRISPR-Cas9-induced knock-out of the target gene and subsequent loss
of normal protein expression.
The mechanism of the early anti-proliferative response to CRISPR-Cas9-
mediated gene editing likely relates to induction of multiple double-strand DNA breaks
and subsequent G2 cell cycle arrest. Wang et al. also recently reported an analysis of
cell essential genes using CRISPR-Cas9-mediated loss of function screens in 4
leukemia and lymphoma cell lines (28). They found that CRISPR-Cas9-mediated
targeting of several genes within the BCR-ABL amplification in the K562 leukemia cell
line and JAK2 amplification in the HEL erythroleukemia cell line induced decreased cell
viability associated with increased levels of phosphorylated histone H2AX, a marker of
Research. on April 17, 2020. © 2016 American Association for Cancercancerdiscovery.aacrjournals.org Downloaded from
Author manuscripts have been peer reviewed and accepted for publication but have not yet been edited. Author Manuscript Published OnlineFirst on June 3, 2016; DOI: 10.1158/2159-8290.CD-16-0154
16
DNA damage. Hart et al. also recently reported that guide RNAs targeting greater than
20 sites appear similar to known essential genes (25). Here, we present a
comprehensive global analysis of this CRISPR-CN correlation in a large and diverse
array of cancer cell lines and demonstrate that this phenomenon is pervasive across
many different genetic and phenotypic contexts. Moreover, we provide the first evidence
that this CRISPR-CN correlation occurs across a wide range of copy number alterations
and chromosome structures, including those with low-level copy number gain.
Importantly, we demonstrate that targeting sequences within regions of high-level copy
number gain induces among the strongest observed viability phenotypes of all sgRNAs
in the screen. Since this effect is not related to specific genes, these observations have
important practical implications for utilizing CRISPR-Cas9 technology for cancer
dependency profiling and for studying gene essentiality in general.
When we analyzed the effects on cell proliferation/viability induced by increased
numbers of cuts, we noted that even a single CRISPR-Cas9-induced DNA cut resulted
in decreased cell proliferation when compared to sgRNAs that do not target any human
sequence. Thus, choice of negative controls for CRISPR-Cas9 experiments is critically
important to interpret the consequences of CRISPR-Cas9-mediated genome editing.
While non-targeting sgRNAs may best represent truly neutral negative controls, it may
be more appropriate to use a targeting sgRNA directed at a non-genic and copy number
normal region of the genome to better model the baseline impact of non-specific DNA
targeting with CRISPR-Cas9. The observation that off-target CRISPR-Cas9 cuts likely
also cooperate with on-target cuts to effect a cumulative toll on the cell highlights the
paramount importance of optimal library design for better on-target and less off-target
activity. Improved sgRNA libraries would thus allow better prediction of the total number
of CRISPR-Cas9-induced DNA cuts according to baseline copy number and therefore
enable enhanced resolution of actual gene-based dependencies within the data.
Moreover, the observation that targeting the CRISPR-Cas9 endonuclease to
even a single locus induced decreased proliferation/viability indicates that this approach
to targeting genes induces a cellular response in the majority of cases. As such, the
effects of this response should be considered in the interpretation of any phenotype
Research. on April 17, 2020. © 2016 American Association for Cancercancerdiscovery.aacrjournals.org Downloaded from
Author manuscripts have been peer reviewed and accepted for publication but have not yet been edited. Author Manuscript Published OnlineFirst on June 3, 2016; DOI: 10.1158/2159-8290.CD-16-0154
17
observed after targeting a specific gene. Indeed, this observation may also affect efforts
to use the CRISPR-Cas9 approach to perform genome editing for therapeutic purposes.
We also observed that for high-level genomic amplifications, the cellular
responses to CRISPR-Cas9 cutting toxicity overwhelm the signal from underlying gene
essentiality, thus complicating efforts to use CRISPR-Cas9 for identification of essential
genes in amplified regions. Hence, it may be most prudent in individual cell line
screening data to exclude certain reagents from consideration for identification of
essential genes, including sgRNAs targeting genomic amplifications as well as those
predicted to confer multiple CRISPR-Cas9 DNA cuts. Failure to properly account for
copy number alterations may lead to confounding effects and a higher rate of false
positive identification of cell essential genes. Since copy number alterations are the
most common genetic alteration found in human epithelial cancers, these observations
have practical implications on both individual experiments as well as systematic efforts
to interrogate the consequences of gene depletion. These observations also highlight
the need to perform CRISPR-Cas9 screens across a large collection of diverse cancer
cell lines to represent a variety of cancer gene dependencies while accounting for
specific confounding genomic structural alterations within individual cell lines.
We propose that this observation extends beyond merely a confounding artifact
of CRISPR-Cas9 technology and uncovers an important underlying biologic concept
that cancer cells are vulnerable to induction of site-specific double-stranded DNA
breaks within regions of genomic amplification. Genome-scale CRISPR-Cas9 screening
has provided an unprecedented resolution of the degree of DNA damage necessary to
effect an anti-proliferative or cytotoxic response in cancer cells, revealing an
unappreciated susceptibility to even a small number of site-specific DNA breaks. Our
observations support the notion that CRISPR-Cas9 targeting of amplified regions of the
genome leads to increased DNA-damage and a significant consequent anti-proliferative
response. Although these findings complicate the study of amplified regions with
CRISPR-Cas9-based approaches, this early anti-proliferative cell response may enable
sequence specific therapeutic approaches to target cancer. Many chemotherapy agents
(e.g. cisplatin), as well as ionizing radiation, achieve their effects by inducing DNA-
damage that is not adequately repaired by cancer cells (41, 42). While many cancer
Research. on April 17, 2020. © 2016 American Association for Cancercancerdiscovery.aacrjournals.org Downloaded from
Author manuscripts have been peer reviewed and accepted for publication but have not yet been edited. Author Manuscript Published OnlineFirst on June 3, 2016; DOI: 10.1158/2159-8290.CD-16-0154
18
cells are more susceptible than normal cells to chemotherapy and radiation, a major
limitation of these treatment approaches is the non-specific nature of these modalities
and the narrow therapeutic window for preferential killing of cancer cells versus normal
cells. Our observations suggest that targeting non-essential genes or even non-coding,
intergenic regions of amplified DNA with CRISPR-Cas9 technology may unveil critical
vulnerabilities in cancer cells that could be harnessed for cancer-specific therapy. A
precision medicine approach employing simultaneous combination of CRISPR-Cas9
reagents to target multiple amplified loci or tumor-specific mutated sequences within a
cancer cell, may enable development of cancer-specific treatments with an optimal
therapeutic window.
Research. on April 17, 2020. © 2016 American Association for Cancercancerdiscovery.aacrjournals.org Downloaded from
Author manuscripts have been peer reviewed and accepted for publication but have not yet been edited. Author Manuscript Published OnlineFirst on June 3, 2016; DOI: 10.1158/2159-8290.CD-16-0154
19
Materials and Methods CRISPR-Cas9 screening Cancer cell lines were transduced with a lentiviral vector expressing the Cas9 nuclease
under blasticidin selection (pXPR-311Cas9). Each Cas9 expressing cell line was
subjected to a Cas9 activity assay (see below) to characterize the efficacy of CRISPR-
Cas9 in these cell lines (Table S1). Cell lines with less than 45% measured Cas9
activity were considered ineligible for screening. Stable polyclonal Cas9+ cell lines were
then infected in replicate (n = 3) at low multiplicity of infection (MOI<1) with a library of
123,411 unique sgRNAs targeting 19,050 genes (6 sgRNAs per gene), 1,864 miRNAs
and 1,000 non-targeting control sgRNAs (GeCKO v2), selected in puromycin and
blasticidin for 7 days and then passaged without selection while maintaining a
representation of 500 cells per sgRNA until a defined time point. Genomic DNA was
purified from end cell pellets and the guide sequence PCR amplified with sufficient
gDNA to maintain representation, and quantified using massively parallel sequencing.
Data quality control Quality control measures were used to remove cell line replicate samples where (1) the
SNP genotype fingerprint failed to match the reference cell line as previously described
(37), (2) the reproducibility between replicates was less than 80% and (3) principal
component analysis showed a replicate or cell line to be an outlier.
Data processing Data were processed in a reproducible GenePattern pipeline and are provided on the
Project Achilles portal (43). A fold change was calculated per sgRNA and the median of
non-targeting controls (n=1000) in the GeCKOv2 library were subtracted from each
sgRNA to generate a CRISPR guide score. Given the gene-independent effect of
CRISPR-Cas9 described in this manuscript, we chose to use the second-best CRISPR-
Cas9 guide score for the purpose of ranking gene-level dependencies in individual cell
lines. See supplemental methods for further details.
Cancer cell lines and Cas9 activity assay
Research. on April 17, 2020. © 2016 American Association for Cancercancerdiscovery.aacrjournals.org Downloaded from
Author manuscripts have been peer reviewed and accepted for publication but have not yet been edited. Author Manuscript Published OnlineFirst on June 3, 2016; DOI: 10.1158/2159-8290.CD-16-0154
20
Cancer cell lines were obtained primarily from the Cancer Cell Line Encyclopedia, which
obtained each line from the original source (Table S1) (35). All cell lines were
mycoplasma negative and identity was confirmed through fingerprinting prior to
screening using an Affymetrix single nucleotide polymorphism (SNP) array as
previously described (37). Prior to screening, cell lines were engineered to stably
express Cas9 under Blasticidin selection and Cas9 activity was assayed using a
lentivirus with an EF1a driven puromycin-2A-GFP cassette, and a U6 driven sgRNA
targeting GFP (pXPR_011) (44). The initial level of GFP is measured with FACs and
monitored over time as a measure of cells harboring modified alleles. Cells with GFP
remaining are due to either modifications that do not inactivate GFP florescence or
inactive Cas9.
Essential gene controls Genes from the KEGG gene sets for ribosome, proteasome and spliceosome subunits
(Table S2) were used as cell essential (positive) controls in the analysis of negative
selection CRISPR-Cas9 screening data. Guide sequences that were a perfect match to
sgRNAs targeting any other gene or noncoding sequence were removed, except when
specifically utilized in described analyses.
Copy number analysis DNA copy number data were derived from single-nucleotide polymorphism (SNP)
microarrays and ABSOLUTE copy number calls were made as previously described
(35, 36). CRISPR-Cas9 screening data were mapped according to genomic position of
sgRNA sequence (guide-level data) or target gene (by ATARiS algorithm) to the human
genome version 19 (hg19). CRISPR-Cas9 screening data were plotted in parallel to
Project Achilles shRNA dependency data (43) or Cancer Cell Line Encyclopedia copy
number or gene expression data (35, 37).
Whole genome sequencing and analysis Whole genome sequencing was performed through the Broad Institute-Novartis CCLE,
as previously described (45). Whole-genome DNA sequencing data of the cancer cell
Research. on April 17, 2020. © 2016 American Association for Cancercancerdiscovery.aacrjournals.org Downloaded from
Author manuscripts have been peer reviewed and accepted for publication but have not yet been edited. Author Manuscript Published OnlineFirst on June 3, 2016; DOI: 10.1158/2159-8290.CD-16-0154
21
lines are aligned by Burrows-Wheeler Aligner (46) to the human genome reference 19.
The aligned reads are filtered for PCR duplicates by MarkDuplicates from Picard. Read
depth coverage was computed and normalized using the previously described approach
(47). Briefly, the number of aligned reads were counted for non-overlapping 1kb bins
and then normalized for GC-content and mappability biases using the HMMcopy
R/Biocondutor package. The normalization was applied to both the cancer cell line and
pseudo-normal sample, independently, and then used to generate a log2 ratio
(tumor:normal) of GC-corrected coverage. The GC-corrected coverage is then
smoothed over 20 kb bins and plotted in Fig. S6 and S7. Chromosomal rearrangements
are detected by dRanger (48) from clusters of discordant pairs. Rearrangements at the
breakpoint boundaries are manually reviewed and plotted. The relative order of
breakage-fusion-bridge cycles and chromothripsis in PANC-1 is inferred based on the
criteria in Li et al. (49).
Analysis of published CRISPR-Cas9 screening data Bayes Factor (BF) values were derived from Hart et al. (25), and fitness genes were
determined per cell line according to the thresholds described therein. Gene level copy
number data for HCT116, A375 and DLD1 were downloaded from the Cancer Cell Line
Encyclopedia. Gene level copy number data for HeLa were downloaded from the Gene
Expression Omnibus (GEO) database, accession number GSE8605. Further details of
the analysis are provided in the supplemental methods.
sgRNA design and cloning sgRNAs for validation experiments were designed utilizing the Broad Institute Avana
sgRNA design tool (44). sgRNA sequences and characteristics are provided in the
supplement (Table S3).
Cell viability assay The PANC-1 and CAL120 cell lines stably expressing Cas9 were plated in a 96-well
plate at 1000 cells/well. One day after plating, cells were infected at a high multiplicity of
infection with virus harboring each of the indicated sgRNAs. Cells were cultured +/-
Research. on April 17, 2020. © 2016 American Association for Cancercancerdiscovery.aacrjournals.org Downloaded from
Author manuscripts have been peer reviewed and accepted for publication but have not yet been edited. Author Manuscript Published OnlineFirst on June 3, 2016; DOI: 10.1158/2159-8290.CD-16-0154
22
puromycin and infection efficiency was calculated from comparison of the puromycin
selected and unselected wells. At 6 days post-infection, cell viability was read out using
Cell-Titer-Glo. Data is presented using unselected wells and calculating fold-change
relative to the non-targeting negative control sgRNA. Error bars are the result of three
biological replicates.
Immunoblots Cells were infected at high MOI in 6 well plates and protein was extracted at 48 hours
post-infection. Immunoblotting was performed using antibodies for PARP (Cell
Signaling, 46D11, #9532) and beta-actin (Sigma Aldrich A5316).
High-content imaging assay and analysis PANC-1 and CAL120 cells constitutively expressing Cas9 protein were plated at a
density of 4000 cells per well, infected in replicate in 96-well paltes at high MOI and
analyzed at an endpoint of 48 hours post-infection. Cells were labeled with EdU and
fixed with paraformaldehyde and then labeled with anti-pHH3 (S10) primary antibody
(Rabbit: #9701, Cell Signaling, 1:800), anti-phospho-histone H2A.X (Ser139, Mouse:
05-636, END Millipore, 1:1250) and Hoechst 33342 (H3570, Thermo Fisher Scientific,
1ug/mL). Imaging was perfomed with the OperaPhenix imaging system on 20x
magnification and data was analyzed using the PerkinElmer Harmony software (40).
See supplemental methods for additional details.
Acknowledgements
We thank Eejung Kim, Joseph Rosenbluh, Srivatsan Raghavan and Belinda Wang for
helpful discussions.
Financial Support This project was supported by R01 CA130988 (W.C.H.), U01 CA199253 (W.C.H.), U01
CA176058 (W.C.H.), P01 CA154303 (W.C.H), and P50 CA12700323 (W.C.H. and
A.J.A.). A.J.A. was supported by the Pancreatic Cancer Action Network Samuel Stroum
Fellowship, Hope Funds for Cancer Postdoctoral Fellowship, American Society of
Research. on April 17, 2020. © 2016 American Association for Cancercancerdiscovery.aacrjournals.org Downloaded from
Author manuscripts have been peer reviewed and accepted for publication but have not yet been edited. Author Manuscript Published OnlineFirst on June 3, 2016; DOI: 10.1158/2159-8290.CD-16-0154

23
Clinical Oncology Young Investigator Award, Dana Farber Cancer Institute Hale Center
for Pancreatic Cancer, Perry S. Levy Endowed Fellowship, and the Harvard Catalyst
and Harvard Clinical and Translational Science Center (UL1 TR001102). This work was
conducted as part of the Slim Initiative for Genomic Medicine, a project funded by the
Carlos Slim Foundation in Mexico.
Research. on April 17, 2020. © 2016 American Association for Cancercancerdiscovery.aacrjournals.org Downloaded from
Author manuscripts have been peer reviewed and accepted for publication but have not yet been edited. Author Manuscript Published OnlineFirst on June 3, 2016; DOI: 10.1158/2159-8290.CD-16-0154
24
References 1. Urnov FD, Rebar EJ, Holmes MC, Zhang HS, Gregory PD. Genome editing with
engineered zinc finger nucleases. Nature reviews Genetics. 2010;11:636-46.
2. Joung JK, Sander JD. TALENs: a widely applicable technology for targeted
genome editing. Nature reviews Molecular cell biology. 2013;14:49-55.
3. Hsu PD, Lander ES, Zhang F. Development and applications of CRISPR-Cas9
for genome engineering. Cell. 2014;157:1262-78.
4. Jinek M, Chylinski K, Fonfara I, Hauer M, Doudna JA, Charpentier E. A
programmable dual-RNA-guided DNA endonuclease in adaptive bacterial immunity.
Science. 2012;337:816-21.
5. Jinek M, East A, Cheng A, Lin S, Ma E, Doudna J. RNA-programmed genome
editing in human cells. eLife. 2013;2:e00471.
6. Cho SW, Kim S, Kim JM, Kim JS. Targeted genome engineering in human cells
with the Cas9 RNA-guided endonuclease. Nat Biotechnol. 2013;31:230-2.
7. Cong L, Ran FA, Cox D, Lin S, Barretto R, Habib N, et al. Multiplex genome
engineering using CRISPR/Cas systems. Science. 2013;339:819-23.
8. Mali P, Yang L, Esvelt KM, Aach J, Guell M, DiCarlo JE, et al. RNA-guided
human genome engineering via Cas9. Science. 2013;339:823-6.
9. Wang T, Wei JJ, Sabatini DM, Lander ES. Genetic screens in human cells using
the CRISPR-Cas9 system. Science. 2014;343:80-4.
10. Shalem O, Sanjana NE, Hartenian E, Shi X, Scott DA, Mikkelsen TS, et al.
Genome-scale CRISPR-Cas9 knockout screening in human cells. Science.
2014;343:84-7.
11. Shalem O, Sanjana NE, Zhang F. High-throughput functional genomics using
CRISPR-Cas9. Nature reviews Genetics. 2015;16:299-311.
12. Sander JD, Joung JK. CRISPR-Cas systems for editing, regulating and targeting
genomes. Nat Biotechnol. 2014;32:347-55.
13. Gilbert LA, Larson MH, Morsut L, Liu Z, Brar GA, Torres SE, et al. CRISPR-
mediated modular RNA-guided regulation of transcription in eukaryotes. Cell.
2013;154:442-51.
Research. on April 17, 2020. © 2016 American Association for Cancercancerdiscovery.aacrjournals.org Downloaded from
Author manuscripts have been peer reviewed and accepted for publication but have not yet been edited. Author Manuscript Published OnlineFirst on June 3, 2016; DOI: 10.1158/2159-8290.CD-16-0154
25
14. Maeder ML, Linder SJ, Cascio VM, Fu Y, Ho QH, Joung JK. CRISPR RNA-
guided activation of endogenous human genes. Nature methods. 2013;10:977-9.
15. Perez-Pinera P, Kocak DD, Vockley CM, Adler AF, Kabadi AM, Polstein LR, et
al. RNA-guided gene activation by CRISPR-Cas9-based transcription factors. Nature
methods. 2013;10:973-6.
16. Konermann S, Brigham MD, Trevino AE, Hsu PD, Heidenreich M, Cong L, et al.
Optical control of mammalian endogenous transcription and epigenetic states. Nature.
2013;500:472-6.
17. Cheng AW, Wang H, Yang H, Shi L, Katz Y, Theunissen TW, et al. Multiplexed
activation of endogenous genes by CRISPR-on, an RNA-guided transcriptional activator
system. Cell research. 2013;23:1163-71.
18. Wang H, Yang H, Shivalila CS, Dawlaty MM, Cheng AW, Zhang F, et al. One-
step generation of mice carrying mutations in multiple genes by CRISPR/Cas-mediated
genome engineering. Cell. 2013;153:910-8.
19. Yang H, Wang H, Shivalila CS, Cheng AW, Shi L, Jaenisch R. One-step
generation of mice carrying reporter and conditional alleles by CRISPR/Cas-mediated
genome engineering. Cell. 2013;154:1370-9.
20. Platt RJ, Chen S, Zhou Y, Yim MJ, Swiech L, Kempton HR, et al. CRISPR-Cas9
knockin mice for genome editing and cancer modeling. Cell. 2014;159:440-55.
21. Sanchez-Rivera FJ, Papagiannakopoulos T, Romero R, Tammela T, Bauer MR,
Bhutkar A, et al. Rapid modelling of cooperating genetic events in cancer through
somatic genome editing. Nature. 2014;516:428-31.
22. Chiou SH, Winters IP, Wang J, Naranjo S, Dudgeon C, Tamburini FB, et al.
Pancreatic cancer modeling using retrograde viral vector delivery and in vivo
CRISPR/Cas9-mediated somatic genome editing. Genes & development.
2015;29:1576-85.
23. Xue W, Chen S, Yin H, Tammela T, Papagiannakopoulos T, Joshi NS, et al.
CRISPR-mediated direct mutation of cancer genes in the mouse liver. Nature.
2014;514:380-4.
Research. on April 17, 2020. © 2016 American Association for Cancercancerdiscovery.aacrjournals.org Downloaded from
Author manuscripts have been peer reviewed and accepted for publication but have not yet been edited. Author Manuscript Published OnlineFirst on June 3, 2016; DOI: 10.1158/2159-8290.CD-16-0154
26
24. Maddalo D, Manchado E, Concepcion CP, Bonetti C, Vidigal JA, Han YC, et al.
In vivo engineering of oncogenic chromosomal rearrangements with the CRISPR/Cas9
system. Nature. 2014;516:423-7.
25. Hart T, Chandrashekhar M, Aregger M, Steinhart Z, Brown KR, MacLeod G, et
al. High-Resolution CRISPR Screens Reveal Fitness Genes and Genotype-Specific
Cancer Liabilities. Cell. 2015;163:1515-26.
26. Koike-Yusa H, Li Y, Tan EP, Velasco-Herrera Mdel C, Yusa K. Genome-wide
recessive genetic screening in mammalian cells with a lentiviral CRISPR-guide RNA
library. Nat Biotechnol. 2014;32:267-73.
27. Parnas O, Jovanovic M, Eisenhaure TM, Herbst RH, Dixit A, Ye CJ, et al. A
Genome-wide CRISPR Screen in Primary Immune Cells to Dissect Regulatory
Networks. Cell. 2015;162:675-86.
28. Wang T, Birsoy K, Hughes NW, Krupczak KM, Post Y, Wei JJ, et al. Identification
and characterization of essential genes in the human genome. Science. 2015;350:1096-
101.
29. Sanjana NE, Shalem O, Zhang F. Improved vectors and genome-wide libraries
for CRISPR screening. Nature methods. 2014;11:783-4.
30. Konermann S, Brigham MD, Trevino AE, Joung J, Abudayyeh OO, Barcena C, et
al. Genome-scale transcriptional activation by an engineered CRISPR-Cas9 complex.
Nature. 2015;517:583-8.
31. Gilbert LA, Horlbeck MA, Adamson B, Villalta JE, Chen Y, Whitehead EH, et al.
Genome-Scale CRISPR-Mediated Control of Gene Repression and Activation. Cell.
2014;159:647-61.
32. Chen S, Sanjana NE, Zheng K, Shalem O, Lee K, Shi X, et al. Genome-wide
CRISPR Screen in a Mouse Model of Tumor Growth and Metastasis. Cell.
2015;160:1246-60.
33. Barbie DA, Tamayo P, Boehm JS, Kim SY, Moody SE, Dunn IF, et al. Systematic
RNA interference reveals that oncogenic KRAS-driven cancers require TBK1. Nature.
2009;462:108-12.
Research. on April 17, 2020. © 2016 American Association for Cancercancerdiscovery.aacrjournals.org Downloaded from
Author manuscripts have been peer reviewed and accepted for publication but have not yet been edited. Author Manuscript Published OnlineFirst on June 3, 2016; DOI: 10.1158/2159-8290.CD-16-0154
27
34. Beroukhim R, Mermel CH, Porter D, Wei G, Raychaudhuri S, Donovan J, et al.
The landscape of somatic copy-number alteration across human cancers. Nature.
2010;463:899-905.
35. Barretina J, Caponigro G, Stransky N, Venkatesan K, Margolin AA, Kim S, et al.
The Cancer Cell Line Encyclopedia enables predictive modelling of anticancer drug
sensitivity. Nature. 2012;483:603-7.
36. Carter SL, Cibulskis K, Helman E, McKenna A, Shen H, Zack T, et al. Absolute
quantification of somatic DNA alterations in human cancer. Nat Biotechnol.
2012;30:413-21.
37. Cowley GS, Weir BA, Vazquez F, Tamayo P, Scott JA, Rusin S, et al. Parallel
genome-scale loss of function screens in 216 cancer cell lines for the identification of
context-specific genetic dependencies. Scientific data. 2014;1:140035.
38. Shao DD, Tsherniak A, Gopal S, Weir BA, Tamayo P, Stransky N, et al. ATARiS:
computational quantification of gene suppression phenotypes from multisample RNAi
screens. Genome research. 2013;23:665-78.
39. Tsai SQ, Zheng Z, Nguyen NT, Liebers M, Topkar VV, Thapar V, et al. GUIDE-
seq enables genome-wide profiling of off-target cleavage by CRISPR-Cas nucleases.
Nat Biotechnol. 2015;33:187-97.
40. Massey AJ. Multiparametric Cell Cycle Analysis Using the Operetta High-Content
Imager and Harmony Software with PhenoLOGIC. PloS one. 2015;10:e0134306.
41. Begg AC, Stewart FA, Vens C. Strategies to improve radiotherapy with targeted
drugs. Nat Rev Cancer. 2011;11:239-53.
42. Chabner BA, Roberts TG, Jr. Timeline: Chemotherapy and the war on cancer.
Nat Rev Cancer. 2005;5:65-72.
43. Project Achilles, Broad Institute of Harvard and MIT.
http://wwwbroadinstituteorg/achilles.
44. Doench JG, Hartenian E, Graham DB, Tothova Z, Hegde M, Smith I, et al.
Rational design of highly active sgRNAs for CRISPR-Cas9-mediated gene inactivation.
Nat Biotechnol. 2014;32:1262-7.
45. Huang FW, Hodis E, Xu MJ, Kryukov GV, Chin L, Garraway LA. Highly recurrent
TERT promoter mutations in human melanoma. Science. 2013;339:957-9.
Research. on April 17, 2020. © 2016 American Association for Cancercancerdiscovery.aacrjournals.org Downloaded from
Author manuscripts have been peer reviewed and accepted for publication but have not yet been edited. Author Manuscript Published OnlineFirst on June 3, 2016; DOI: 10.1158/2159-8290.CD-16-0154

28
46. Li H, Durbin R. Fast and accurate short read alignment with Burrows-Wheeler
transform. Bioinformatics. 2009;25:1754-60.
47. Ha G, Roth A, Khattra J, Ho J, Yap D, Prentice LM, et al. TITAN: inference of
copy number architectures in clonal cell populations from tumor whole-genome
sequence data. Genome research. 2014;24:1881-93.
48. Drier Y, Lawrence MS, Carter SL, Stewart C, Gabriel SB, Lander ES, et al.
Somatic rearrangements across cancer reveal classes of samples with distinct patterns
of DNA breakage and rearrangement-induced hypermutability. Genome research.
2013;23:228-35.
49. Li Y, Schwab C, Ryan SL, Papaemmanuil E, Robinson HM, Jacobs P, et al.
Constitutional and somatic rearrangement of chromosome 21 in acute lymphoblastic
leukaemia. Nature. 2014;508:98-102.
Research. on April 17, 2020. © 2016 American Association for Cancercancerdiscovery.aacrjournals.org Downloaded from
Author manuscripts have been peer reviewed and accepted for publication but have not yet been edited. Author Manuscript Published OnlineFirst on June 3, 2016; DOI: 10.1158/2159-8290.CD-16-0154
29
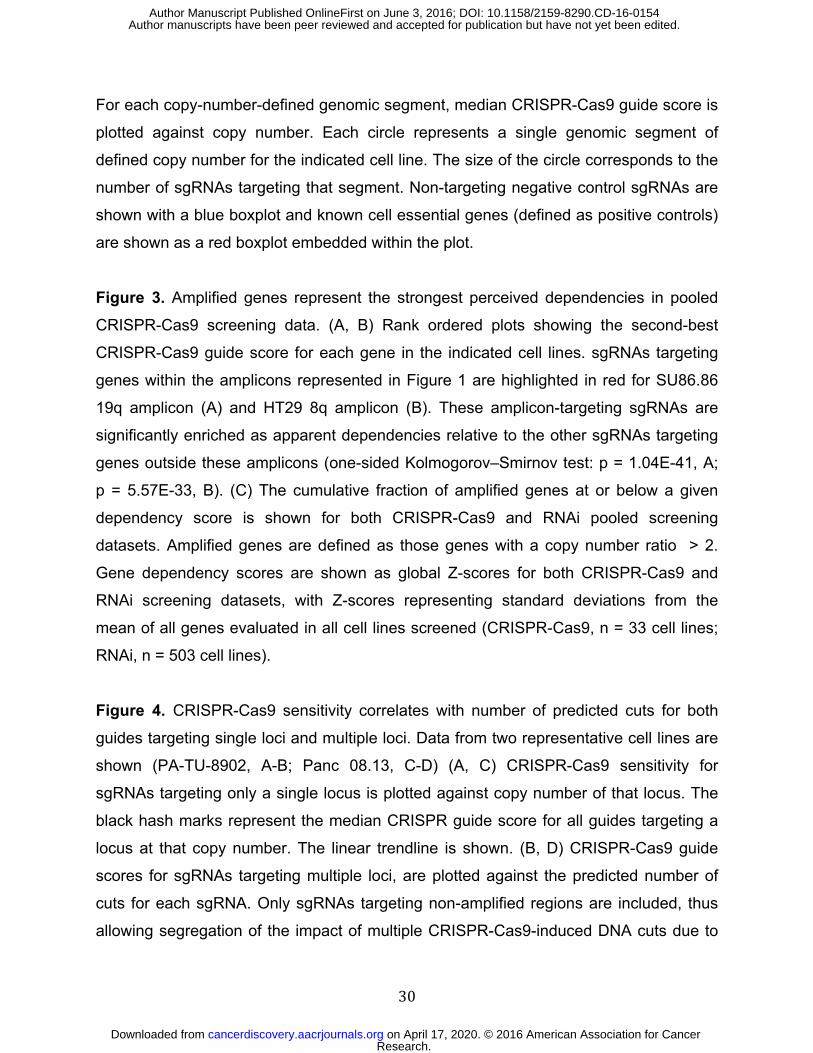
Figure Legends Figure 1. Genome scale loss-of-function CRISPR-Cas9 screening in cancer cell lines.
(A) Schematic of the pooled screening process. (B) Cumulative frequency of log2
normalized read counts per million to 1000 non-targeting sgRNA controls (red) and
sgRNAs targeting 213 positive control genes (KEGG ribosome, proteasome and
spliceosome subsets, Table S2) (blue) in both the initial DNA reference pool (dotted)
and 28 d after transduction in the PANC-1 cell line (solid). (C) A boxplot of Pearson
correlation between replicates (y-axis) plotted for each cell line (x-axis) shows the range
of replicate-replicate correlations after quality control (Methods). (D, E, F) Rank ordered
depiction of second-best CRISPR guide scores for each gene in the Panc 08.13 (D),
T47D (E) and CORL105 (F) cell lines. Hallmark cancer-relevant oncogene and non-
oncogene dependencies are depicted in red for each cell line.
Figure 2. Genome scale CRISPR-Cas9 screening identifies a strong correlation
between copy number and sensitivity to CRISPR-Cas9 genome editing. Two cell lines
are shown: SU86.86 (A, C, E) and HT29 (B, D, F). (A) Chromosome 19q amplicon in
SU86.86 and (B) chromosome 8q amplicon in HT29: Three tracks are plotted along
genomic coordinates within the region defined the red box on the chromosome
schematic. Top: ABSOLUTE genomic copy number from Cancer Cell Line Encyclopedia
(CCLE) SNP arrays with red indicating copy number gain above average ploidy and
blue indicating copy number loss below average ploidy; Middle: CRISPR-Cas9 guide
scores plotted according to the 2nd most dependent sgRNA for each gene with purple
trend line indicating the mean CRISPR guide score for each copy number segment
defined from the above track; Bottom: RNAi gene dependency scores. AKT2 and MYC,
known driver oncogenes at these loci, respectively, are highlighted in orange. For RNAi
data, shRNAs targeting AKT2 used in Project Achilles were not effective in suppressing
AKT2. (C, D) Boxplots of CRISPR guide scores for both expressed and not expressed
genes located on (red) or off (black) of the chromosome 19q amplicon in SU86.86 (C)
and the chromosome 8q amplicon in HT29 (D). For the SU86.86, the amplicon
represented in panel C red box plots ranges from 39.3-41.4 Mb on the corresponding
plot in panel A. The number of represented genes is noted above each box plot. (E, F)
Research. on April 17, 2020. © 2016 American Association for Cancercancerdiscovery.aacrjournals.org Downloaded from
Author manuscripts have been peer reviewed and accepted for publication but have not yet been edited. Author Manuscript Published OnlineFirst on June 3, 2016; DOI: 10.1158/2159-8290.CD-16-0154
30
For each copy-number-defined genomic segment, median CRISPR-Cas9 guide score is
plotted against copy number. Each circle represents a single genomic segment of
defined copy number for the indicated cell line. The size of the circle corresponds to the
number of sgRNAs targeting that segment. Non-targeting negative control sgRNAs are
shown with a blue boxplot and known cell essential genes (defined as positive controls)
are shown as a red boxplot embedded within the plot.
Figure 3. Amplified genes represent the strongest perceived dependencies in pooled
CRISPR-Cas9 screening data. (A, B) Rank ordered plots showing the second-best
CRISPR-Cas9 guide score for each gene in the indicated cell lines. sgRNAs targeting
genes within the amplicons represented in Figure 1 are highlighted in red for SU86.86
19q amplicon (A) and HT29 8q amplicon (B). These amplicon-targeting sgRNAs are
significantly enriched as apparent dependencies relative to the other sgRNAs targeting
genes outside these amplicons (one-sided Kolmogorov–Smirnov test: p = 1.04E-41, A;
p = 5.57E-33, B). (C) The cumulative fraction of amplified genes at or below a given
dependency score is shown for both CRISPR-Cas9 and RNAi pooled screening
datasets. Amplified genes are defined as those genes with a copy number ratio > 2.
Gene dependency scores are shown as global Z-scores for both CRISPR-Cas9 and
RNAi screening datasets, with Z-scores representing standard deviations from the
mean of all genes evaluated in all cell lines screened (CRISPR-Cas9, n = 33 cell lines;
RNAi, n = 503 cell lines).
Figure 4. CRISPR-Cas9 sensitivity correlates with number of predicted cuts for both
guides targeting single loci and multiple loci. Data from two representative cell lines are
shown (PA-TU-8902, A-B; Panc 08.13, C-D) (A, C) CRISPR-Cas9 sensitivity for
sgRNAs targeting only a single locus is plotted against copy number of that locus. The
black hash marks represent the median CRISPR guide score for all guides targeting a
locus at that copy number. The linear trendline is shown. (B, D) CRISPR-Cas9 guide
scores for sgRNAs targeting multiple loci, are plotted against the predicted number of
cuts for each sgRNA. Only sgRNAs targeting non-amplified regions are included, thus
allowing segregation of the impact of multiple CRISPR-Cas9-induced DNA cuts due to
Research. on April 17, 2020. © 2016 American Association for Cancercancerdiscovery.aacrjournals.org Downloaded from
Author manuscripts have been peer reviewed and accepted for publication but have not yet been edited. Author Manuscript Published OnlineFirst on June 3, 2016; DOI: 10.1158/2159-8290.CD-16-0154
31
either copy number or number of target loci. The influence of the number of predicted
DNA cuts on CRISPR-Cas9 guide scores was modeled for each cell line as the slope of
the trend line in A-D and termed the CRISPR-Cut Index (CCI). The CCI was determined
for both copy number-driven (CCI-CN) (A, C) and multiple alignment-driven effects
(CCI-MA) (B, D). (E) Scatter plot of CCI-MA versus CCI-CN showing strong correlation
of the effect on CRISPR-Cas9 guide scores for either multiple alignment driven or copy
number-driven DNA cuts across the cell lines.
Figure 5. sgRNAs targeting multiple chromosomes show greater sensitivity to CRISPR-
Cas9-induced cutting. Data from two representative cell lines are shown (PA-TU-8902,
A, C; Panc 08.13, B, D) (A, B) Boxplots of CRISPR-Cas9 sensitivity to the predicted
number of CRISPR-Cas9-induced DNA cuts. CRISPR-Cas9 guide scores are shown on
the Y-axis and the predicted number of DNA cuts is shown on the X-axis. sgRNAs are
divided into three groups. In red are sgRNAs that target a single locus, and therefore
total number of predicted cuts is based on copy number. In yellow are sgRNAs that
target multiple loci within a single chromosome (intra-chromosomal). In blue are
sgRNAs that target multiple loci across multiple chromosomes (inter-chromosomal). The
analysis demonstrates a more potent detrimental influence on cell viability for multiple
CRISPR-Cas9-induced DNA cuts across multiple chromosomes (inter-chromosomal) as
compared to those restricted to a single chromosome (intra-chromosomal). Multiple
linear regression accounting for difference in total number of cuts for inter-chromosomal
vs. intra-chromosomal: panel A, β = -0.27, p = 2.64e-22; panel C, β = -0.16, p = 4.97e-
22. (C, D) Waterfall plots showing CRISPR guide scores for all sgRNAs in the pooled
screens performed on the indicated cell lines. sgRNAs from the multiple alignment
analysis targeting multiple chromosomes with >10 predicted target sites are shown in
red and are significantly enriched with negative CRISPR-Cas9 guide scores relative to
all other sgRNAs in the library (one-sided Kolmogorov–Smirnov test: p = 2.13E-159, C;
p = 9.17E-88, D) These data highlight the potent detrimental effect that these sgRNAs
have on cell proliferation and viability within the screen.
Research. on April 17, 2020. © 2016 American Association for Cancercancerdiscovery.aacrjournals.org Downloaded from
Author manuscripts have been peer reviewed and accepted for publication but have not yet been edited. Author Manuscript Published OnlineFirst on June 3, 2016; DOI: 10.1158/2159-8290.CD-16-0154
32
Figure 6. CRISPR-Cas9 targeting of amplified regions or multiple genomic loci induces
DNA damage and a G2 cell cycle arrest. (A) Schematic of the PANC-1 19q13 amplicon
demonstrating ABSOLUTE DNA copy number (top panel) and CRISPR guide scores
(middle panel) mapped by genomic position. Schematic and color scheme are similar to
that detailed in Fig. 2. (B) In vitro validation experiment measuring arrayed proliferation
and viability response of PANC-1 cells at 6 d post-infection with sgRNAs targeting
regions inside (red) and outside (blue) of the demonstrated amplicon. sgRNAs targeting
intergenic regions are labeled by chromosomal locus and columns are given a
checkered pattern. Multi-targeted sgRNA’s (MT-1 and MT-2) are indicated by black
bars. sgRNAs targeting an alternative unamplified locus (12q, orange) and known
essential genes (green) are also shown. Non-targeting negative control sgRNAs are
shown in yellow. Dots placed below the copy number panel correspond to the validation
sgRNAs targeting the indicated genes or intergenic regions on the locus, and are
matched by color and left-to-right genomic position. Cell-Titer-Glo was performed at 6-
days post-infection. Error bars indicate SD of biologic replicates (n=3). p < 0.0001 for
two-tailed T-test comparing sgRNAs inside (red) vs outside (blue and orange) the
amplicon. (C) Plot of the percentage of PANC-1 cells in each phase of the cell cycle at
48 hours post-infection with the indicated sgRNAs targeting inside (red) or outside
(blue) the amplicon. Data for a multi-targeted sgRNA (MT-2) and a control sgRNA
targeting an alternative locus (12q-5), as well as for control genes are also shown.
Fraction of cells in each phase of the cell cycle is indicated by a unique pattern within
the column corresponding to each cell cycle phase. Colors scheme is as indicated
above, with coloration of the G2 and S phases for emphasis. Error bars represent the
standard deviation for the mean of three replicates. (D) Plot of the number of γ-H2AX
foci present in PANC-1 cells at 48 hours post-infection with the indicated sgRNAs. Color
scheme is as indicated above, with checkered pattern corresponding to sgRNAs
targeting intergenic regions.
Figure 7. Cell essential genes and copy number. Cumulative distribution function (CDF)
of the correlation coefficient between ABSOLUTE CN and CRISPR-Cas9 sensitivity for
the indicated gene sets across all 33 cell lines screened with pooled CRISPR-Cas9.
Research. on April 17, 2020. © 2016 American Association for Cancercancerdiscovery.aacrjournals.org Downloaded from
Author manuscripts have been peer reviewed and accepted for publication but have not yet been edited. Author Manuscript Published OnlineFirst on June 3, 2016; DOI: 10.1158/2159-8290.CD-16-0154

33
Known cell essential KEGG gene sets are displayed separately (proteasome, red;
ribosome, blue; spliceosome, green, Table S2) from all other genes in the screen
(black). Cell essential genes show a positive shift in CRISPR-CN correlation relative to
the overall distribution (two-sided K-S statistic: spliceosome, p = 2.22e-16; proteasome,
p = 2.067e-06; ribosome, p = 5.402e-11).
Research. on April 17, 2020. © 2016 American Association for Cancercancerdiscovery.aacrjournals.org Downloaded from
Author manuscripts have been peer reviewed and accepted for publication but have not yet been edited. Author Manuscript Published OnlineFirst on June 3, 2016; DOI: 10.1158/2159-8290.CD-16-0154
0.7
0.75
0.8
0.85
0.9
0.95
1
K562
G402
PA
TU
8902
PA
NC
0327
NC
IH1
373
PA
TU
8988T
HS
29
4T
CA
L120
TO
V112D
HC
C44
MH
HE
S1
TC
32
PA
NC
1P
C3
EW
8P
AN
C0813
A375
NC
IH2
009
CA
DO
ES
1E
WS
502
LN
CA
PC
LO
NE
FG
CS
KE
S1
ME
WO
CO
RL
105
CO
LO
741
HT
29
SU
86
86
L33
RD
ES
BX
PC
3T
C71
A673
T47
D
Pea
rso
n c
orr
ela
tio
n
0 1 2 3 4 5 6 70
0.1
0.2
0.3
0.4
0.5
0.6
0.7
0.8
0.9
1
Log2 normalized read counts per million
Cu
mu
lati
ve F
req
uen
cy
Figure 1
A
E T-47D Breast Cancer
ER-positive
Panc 08.13 Pancreatic Cancer
KRAS mutant
COR-L105 Lung Cancer
EGFR mutant
Cell Lines Screened
Pears
on C
orr
ela
tion
Cum
ula
tive F
requency
Log2 normalized read counts per million
C
B
D
F
Research. on April 17, 2020. © 2016 American Association for Cancercancerdiscovery.aacrjournals.org Downloaded from
Author manuscripts have been peer reviewed and accepted for publication but have not yet been edited. Author Manuscript Published OnlineFirst on June 3, 2016; DOI: 10.1158/2159-8290.CD-16-0154
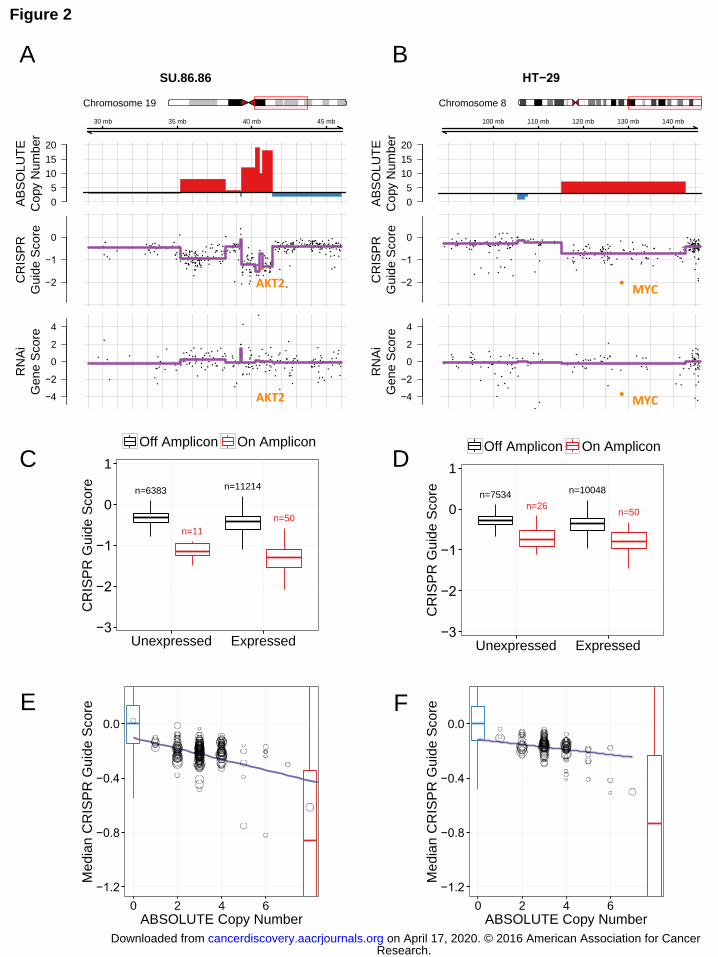
n=7534
n=26
n=10048
n=50
−3
−2
−1
0
1
Unexpressed Expressed
CR
ISP
R G
uid
e S
core
Off Amplicon On Amplicon
n=6383
n=11
n=11214
n=50
−3
−2
−1
0
1
Unexpressed Expressed
CR
ISP
R G
uid
e S
core
Off Amplicon On Amplicon
A
C
Figure 2
B
E
D
F
HT−29
Chromosome 8
100 mb 110 mb 120 mb 130 mb 140 mb
0
5
10
15
20
AB
SO
LU
TE
Copy N
um
ber
−2
−1
0
CR
ISP
R
Guid
e S
core
●
●●
●●
●●
●
● ●●●
●
●
●
● ●
●●
●
●●
●●
●
●●
●
●
●●
●
●
●
●●●
●
●●
●
●
●
●
●●
●
● ●●
●●
●
●
●
●
●
●
●●
●
●●
●
●
●●
●
●●
●●
● ●
●●●
●
●
●●
●●
●
●
●
●
●
●
●●
●
●
●
●●
●
●
●
● ●●
●
●●
●
●
●
●●●●●● ●●
●
●●
●
●●●
●
●
●
●●
●●●
● ●
●
●
●
●
●●
●
●●
●
●●
●
●
●
●
● ●●
●
●
●
●
●
●
●
●●
●●
●
●
●
●
●
●
●
●
●●
●
●●●
●
●
●
●●
●●
●
●
●●
●
●
●
●
●
●
●
●
●
●
●
●
●
●
●
●
●
●
●●
●
●●
●
●
●
●●
●
●●●
●
●
●●
●
●
●
●●
●
●
●
●
●● ●
●●
●
●
●
●
●
●
●
●
●
●
●
●
●●
●●
●●●
●
●
●
●
●
●
●
●
●●
●
●
●●●
●
●
●
●
●
−4
−2
0
2
4
RN
Ai
Gene
Score
●●
●●
●
●
●
●● ●
●
●●
●
●
●
●
●
●
●
●● ●
●
●
●●
●
●
●●
●
●
●
●
●
●
●
●●
●
●●●
● ●
●
●
●
●●
●
●●●
●
●
●
●●
● ●
●
●
●
●●
●
●
●
● ● ●
●
●
●
●
●●
●
●
●
●
●
●
●
●● ●
●
●●
●
●
●●
●
●
●
●
●
●
●
●
●●
●● ●
●●
●●
●
●
●●
●
●●
●
●
●
●
●
●
●
●
●
●
●
●●
●
●
SU.86.86
Chromosome 19
30 mb 35 mb 40 mb 45 mb
0
5
10
15
20
AB
SO
LU
TE
Copy N
um
ber
−2
−1
0
CR
ISP
R
Guid
e S
core
●
●
●
●
●
●
●
●●●
●
●
●
●
●●
●●
●
●●
●
●
●
●
●
●●
●●
●
●
●
●
●
●
●
●
●
●
●●●
●
●●●
●●● ●
●●● ●
●●
●
●
●
●●
●
●
●
●●
●
●●
●
●
●
●
●●
●●
●
●●
●
●●
●
●
●●
●
●
●
●
●
●
●
●
●
●
●
●
●
●
●
●
●
●
●
●
●
●
● ●
●
●
●●
●
●
●
●
●
●
●
●
●
●●
●
●
●
●
●
●●
●
●
●
●
●
● ●
●●
●
●
●
●
●
●
●●
●
●
●●
●
●
●
● ●
●
●
●
●
●
●
●
●
●●
●
●
●●
●
●●
●
●
●
●
●●
●●
●
●
●
●
●
●
●●●● ●
●
●
●
●
●●●
●●●
●●
●
●
●
●●
●
●●
●
●●●
●
●
●
●●
●
●
●
●
●
●●
●●
●
●
●
●●
●
●●
●
●
●●●
●
●●●
●
●
●
●
●
●
●
●
●
●
●●
●
●
●
●
●
●
●●
● ●●
●
●
●
●
●
●
●●
●
●
●●●
●●●●
●●●●
●
●
●
●
●●
●
●
●
●
●●
●
● ●
●
●
●
●
●
●
●
●
●
●
●●
●
●
●
●
●
●
●
●●
●
●●●
●
●
●
●
●
●
●
−4
−2
0
2
4
RN
Ai
Gene
Score
● ●●
●
●
●
● ●
●
● ●
●●
●
●
●
●
●
●
●●
●●
●●
●
●
●●
●
● ●
●
●●
●
●
●●
●
●
●
●●
●
●
●●
●
●
● ●
● ●
●
●●
●
●●●
●
●
●
●
●
●
●●
●
●
●●
●
●●
●
●
●
●
●
●
●
●
●
●
●●
●●
●●
●
●
●
●
●
●
●
●●
●
●
●
●
●
●
●●
● ●●
●
●●●
●
●●●
●
●
●
●
● ●
●●
●
●
●●
●
●
●●
●
●
●
●
●
●●
●
●●
●
●●
●
●●
●
●
●
●
●
●
●
●
●●
●
●●
●
●
●
●●●
●●
●
●
●
●●
●
●
●
●●
●
●
●
●
●
●
●
●
●
● ●●
●
●
●
●
●●
●
●
●
●
●
AKT2
AKT2 MYC
−1.2
−0.8
−0.4
0.0
0 2 4 6ABSOLUTE Copy Number
Me
dia
n C
RIS
PR
Gu
ide
Sco
re
−1.2
−0.8
−0.4
0.0
0 2 4 6ABSOLUTE Copy Number
Me
dia
n C
RIS
PR
Gu
ide
Sco
re
MYC AKT2
Research. on April 17, 2020. © 2016 American Association for Cancercancerdiscovery.aacrjournals.org Downloaded from
Author manuscripts have been peer reviewed and accepted for publication but have not yet been edited. Author Manuscript Published OnlineFirst on June 3, 2016; DOI: 10.1158/2159-8290.CD-16-0154
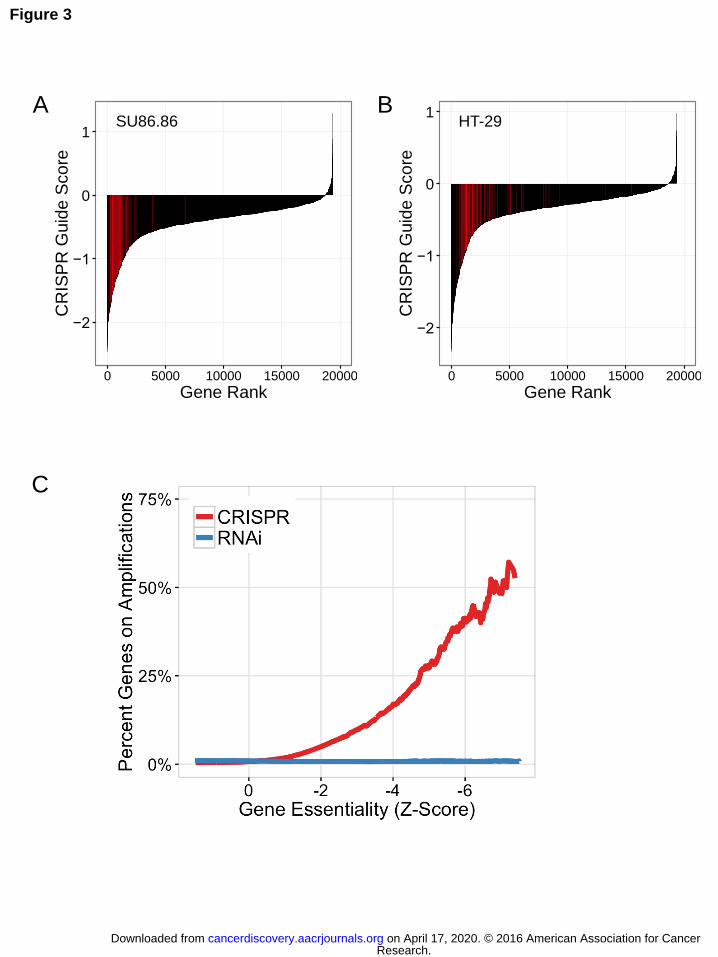
Figure 3
−2
−1
0
1
0 5000 10000 15000 20000
Gene RankC
RIS
PR
Guid
e S
co
re
−2
−1
0
1
0 5000 10000 15000 20000
Gene Rank
CR
ISP
R G
uid
e S
co
re
A B SU86.86 HT-29
C
Research. on April 17, 2020. © 2016 American Association for Cancercancerdiscovery.aacrjournals.org Downloaded from
Author manuscripts have been peer reviewed and accepted for publication but have not yet been edited. Author Manuscript Published OnlineFirst on June 3, 2016; DOI: 10.1158/2159-8290.CD-16-0154
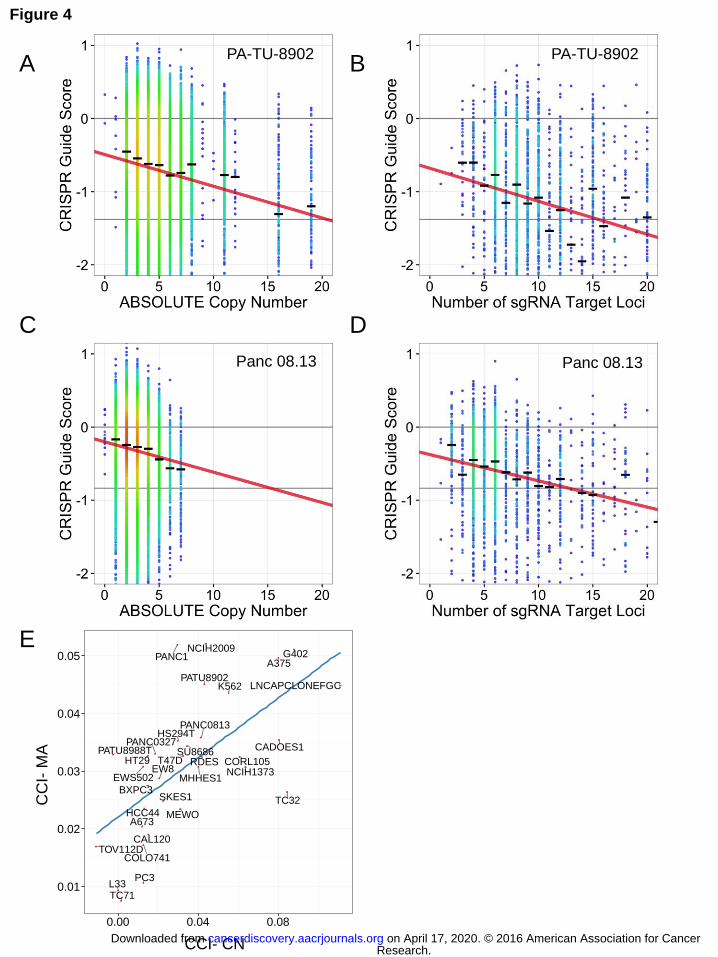
Figure 4
E
B PA-TU-8902
Panc 08.13 Panc 08.13
A
C D
A375
A673
BXPC3
CADOES1
CAL120
COLO741
CORL105EW8
EWS502
G402
HCC44
HS294T
HT29
K562
L33
LNCAPCLONEFGC
MEWO
MHHES1NCIH1373
NCIH2009
PANC0327
PANC0813
PANC1
PATU8902
PATU8988T
PC3
RDES
SKES1
SU8686T47D
TC32
TC71
TOV112D
●
●
●
●
●
●
●
●
●
●
●
●
●
●
●
●
●
● ●
●
●
●
●
●
●
●
●
●
●
●
●
●
●
0.01
0.02
0.03
0.04
0.05
0.00 0.04 0.08CCI−CN
CC
I−M
AC
CI-
MA
CCI- CN
PA-TU-8902
Research. on April 17, 2020. © 2016 American Association for Cancercancerdiscovery.aacrjournals.org Downloaded from
Author manuscripts have been peer reviewed and accepted for publication but have not yet been edited. Author Manuscript Published OnlineFirst on June 3, 2016; DOI: 10.1158/2159-8290.CD-16-0154
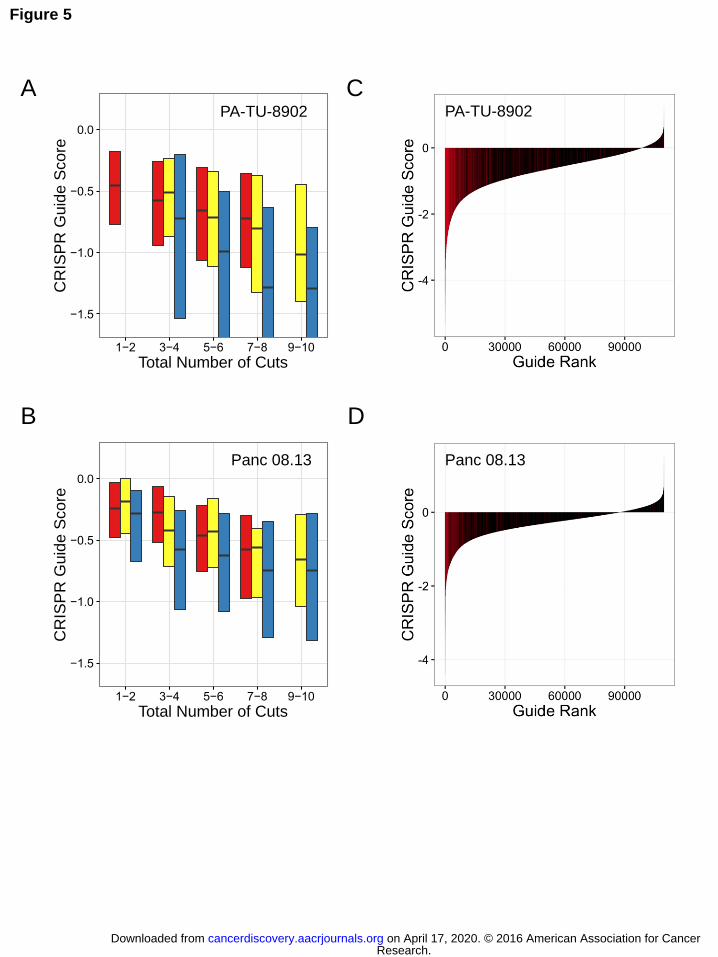
−1.5
−1.0
−0.5
0.0
1−2 3−4 5−6 7−8 9−10
Total Number of Cuts
CR
ISP
R G
uid
e S
co
re
−1.5
−1.0
−0.5
0.0
1−2 3−4 5−6 7−8 9−10
Total Number of Cuts
CR
ISP
R G
uid
e S
co
re
Figure 5
A C
B D
PA-TU-8902
Panc 08.13
PA-TU-8902
Panc 08.13
Research. on April 17, 2020. © 2016 American Association for Cancercancerdiscovery.aacrjournals.org Downloaded from
Author manuscripts have been peer reviewed and accepted for publication but have not yet been edited. Author Manuscript Published OnlineFirst on June 3, 2016; DOI: 10.1158/2159-8290.CD-16-0154
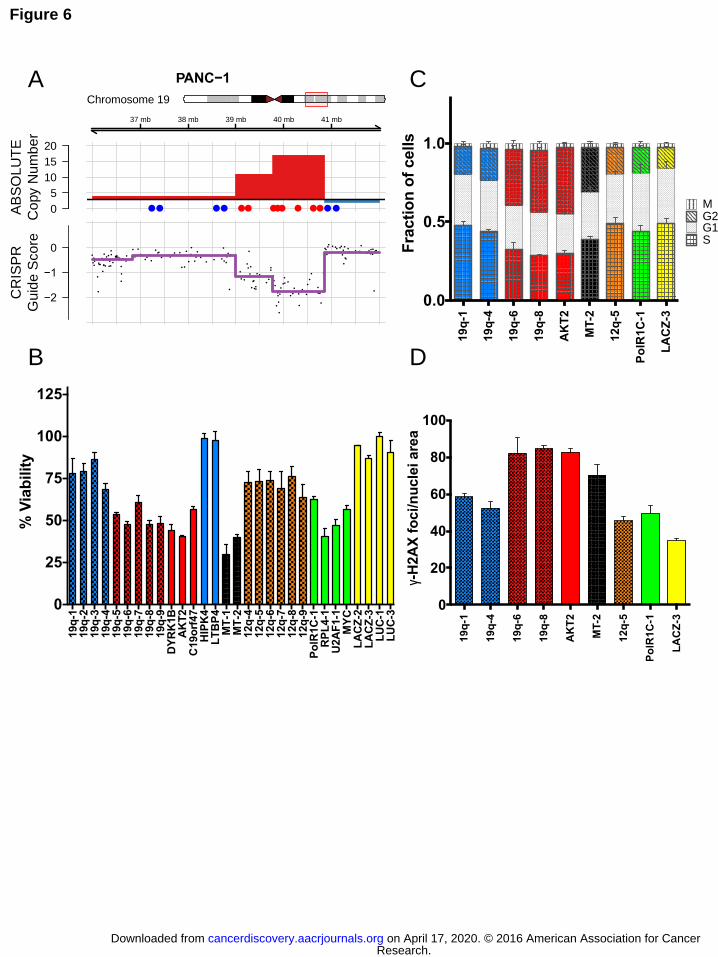
19
q-1
19
q-4
19
q-6
19
q-8
AK
T2
MT
-2
12
q-5
Po
lR1
C-1
LA
CZ
-3
0
20
40
60
80
100g-
H2A
X f
oci/n
ucle
i are
a
19
q-1
19
q-4
19
q-6
19
q-8
AK
T2
MT
-2
12
q-5
Po
lR1
C-1
LA
CZ
-3
0.0
0.5
1.0
Fra
cti
on
of
cells
S
G2G1
M
19q
-119q
-219q
-319q
-419q
-519q
-619q
-719q
-819q
-9D
YR
K1B
AK
T2
C19o
rf47
HIP
K4
LT
BP
4M
T-1
MT
-212q
-412q
-512q
-612q
-712q
-812q
-9P
olR
1C
-1R
PL
4-1
U2A
F1-1
MY
CL
AC
Z-2
LA
CZ
-3L
UC
-1L
UC
-3
0
25
50
75
100
125
% V
iab
ilit
y
PANC−1
Chromosome 19
37 mb 38 mb 39 mb 40 mb 41 mb
0
5
10
15
20
AB
SO
LU
TE
Copy N
um
be
r
−2
−1
0
CR
ISP
R
Guid
e S
co
re
●
●
●
●
●
●
●
●●
●●●●
●
●
●
●
●
● ●
●
●
●
●
●
●
●●● ●
●
●
●
●●
●
●
●
●
●●
●
●
●
●
●●
●
●●
●
●
● ●●
●
●●
●●
●●
●
●●
●
●
●
●●
●
●
●
●
●
●
●
●
●
●
●
●
●
●
●
●
●
●
●
●
●
●
●
●
●
●
●●
●
●
●
●●
●
●
●
●
●
●
●
●
●●
●
●
●
●●
●
●
●
●
●
●
●
●
●
●
●
●
●
●
●
●● ●
●
●
●
●
●● ● ●
●
●●
●
●
●
●
●
●
●
●●
●
●●
●●●
●
●
●
●
●
●
●
●
Figure 6
A C
D B
Research. on April 17, 2020. © 2016 American Association for Cancercancerdiscovery.aacrjournals.org Downloaded from
Author manuscripts have been peer reviewed and accepted for publication but have not yet been edited. Author Manuscript Published OnlineFirst on June 3, 2016; DOI: 10.1158/2159-8290.CD-16-0154
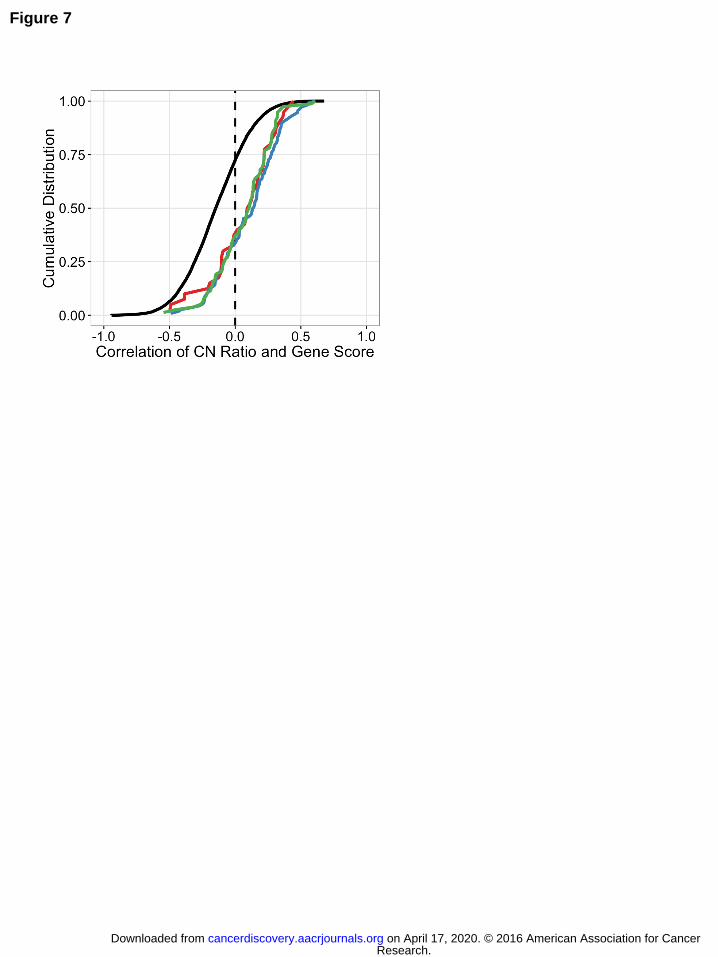
Figure 7
Research. on April 17, 2020. © 2016 American Association for Cancercancerdiscovery.aacrjournals.org Downloaded from
Author manuscripts have been peer reviewed and accepted for publication but have not yet been edited. Author Manuscript Published OnlineFirst on June 3, 2016; DOI: 10.1158/2159-8290.CD-16-0154
Published OnlineFirst June 3, 2016.Cancer Discov Andrew J. Aguirre, Robin M. Meyers, Barbara A. Weir, et al. response to CRISPR-Cas9 targetingGenomic copy number dictates a gene-independent cell
Updated version
10.1158/2159-8290.CD-16-0154doi:
Access the most recent version of this article at:
Material
Supplementary
http://cancerdiscovery.aacrjournals.org/content/suppl/2016/06/03/2159-8290.CD-16-0154.DC1
Access the most recent supplemental material at:
Manuscript
Authoredited. Author manuscripts have been peer reviewed and accepted for publication but have not yet been
E-mail alerts related to this article or journal.Sign up to receive free email-alerts
Subscriptions
Reprints and
To order reprints of this article or to subscribe to the journal, contact the AACR Publications
Permissions
Rightslink site. Click on "Request Permissions" which will take you to the Copyright Clearance Center's (CCC)
.http://cancerdiscovery.aacrjournals.org/content/early/2016/06/03/2159-8290.CD-16-0154To request permission to re-use all or part of this article, use this link
Research. on April 17, 2020. © 2016 American Association for Cancercancerdiscovery.aacrjournals.org Downloaded from
Author manuscripts have been peer reviewed and accepted for publication but have not yet been edited. Author Manuscript Published OnlineFirst on June 3, 2016; DOI: 10.1158/2159-8290.CD-16-0154