Embed Size (px)
Citation preview
ARTICLE
Received 4 Feb 2016 | Accepted 17 Mar 2017 | Published 24 May 2017
Genomic variation associated with local adaptationof weedy rice during de-domesticationJie Qiu1,*, Yongjun Zhou2,*, Lingfeng Mao1, Chuyu Ye1, Weidi Wang1, Jianping Zhang2, Yongyi Yu1, Fei Fu1,
Yunfei Wang3, Feijian Qian3, Ting Qi1, Sanling Wu4, Most Humaira Sultana1, Ya-Nan Cao5, Yu Wang6,
Michael P. Timko6, Song Ge7, Longjiang Fan1 & Yongliang Lu2
De-domestication is a unique evolutionary process by which domesticated crops are
converted into ‘wild predecessor like’ forms. Weedy rice (Oryza sativa f. spontanea) is an
excellent model to dissect the molecular processes underlying de-domestication. Here, we
analyse the genomes of 155 weedy and 76 locally cultivated rice accessions from four
representative regions in China that were sequenced to an average 18.2� coverage.
Phylogenetic and demographic analyses indicate that Chinese weedy rice was
de-domesticated independently from cultivated rice and experienced a strong genetic
bottleneck. Although evolving from multiple origins, critical genes underlying convergent
evolution of different weedy types can be found. Allele frequency analyses suggest that
standing variations and new mutations contribute differently to japonica and indica weedy rice.
We identify a Mb-scale genomic region present in weedy rice but not cultivated rice genomes
that shows evidence of balancing selection, thereby suggesting that there might be more
complexity inherent to the process of de-domestication.
DOI: 10.1038/ncomms15323 OPEN
1 Institutue of Crop Science & Institute of Bioinformatics, College of Agriculture and Biotechnology, Zhejiang University, Hangzhou 310058, China.2 China National Rice Research Institute, Chinese Academy of Agricultural Sciences, Hangzhou 310006, China. 3 Zhejiang Sheng Ting Biotechnology Co., Ltd.,Taizhou 318020, China. 4 Analysis Center of Agrobiology and Environmental Sciences, Faculty of Agriculture, Life and Environmental Sciences,Zhejiang University, Hangzhou 310058, China. 5 Key Laboratory of Conservation Biology for Endangered Wildlife of the Ministry of Education,Zhejiang University, Hangzhou 310058, China. 6 Department of Biology, University of Virginia, Charlottesville, Virginia 22904, USA. 7 State Key Laboratory ofSystematic and Evolutionary Botany, Institute of Botany, Chinese Academy of Sciences, Beijing 100093, China. * These authors contributed equally to thiswork. Correspondence and requests for materials should be addressed to L.F. (email: [email protected]) or to Y.L. (email: [email protected]).
NATURE COMMUNICATIONS | 8:15323 | DOI: 10.1038/ncomms15323 | www.nature.com/naturecommunications 1
Plant domestication is the process during which wild speciesare converted into crop plants through artificial selection.Both conscious and unconscious selections by humans
during this process have brought about significant alterations ofplant traits to meet their desires and benefits1. Domestication canresult in increased fitness of a plant under human cultivation,and often decreases its viability in the natural environment aswell2. Plant de-domestication is a distinct evolutionary processinvolving a loss of traits aggregated under domestication, duringwhich domesticated crops are turned into self-sustainable‘wild-like’ plants mainly driven by natural selection3–5.Ellstrand et al.3 conducted a survey in search of examples ofplants that originated by de-domestication. Based on strict criteriaonly 13 examples of de-domestication could be found, all ofwhich shared the common feature that their descendants wereweedy or invasive plants with intrinsic capacity for rapidadaptation to their living environments. Compared with thewell-studied process of domestication, the mechanism ofde-domestication has not been thoroughly investigated.A recent study on feral chicken populations indicatedthat de-domestication targets different genomic loci todomestication6. The universality of the population geneticprocess during de-domestication needs to be examined. Thedescendants of de-domestication originated from crops withrelatively low genetic diversity7. When returning to the feralenvironment, whether they just employ limited standingvariations or generate new mutations for their survivals stillremains unknown. In addition, human-imposed directionalselection drives the rapid evolution of domesticates duringdomestication. However, when domesticates are back to feralenvironments with more diverse pressures, what other selectionregimes may exist? Therefore, a significant opportunity exists toexamine how evolutionary processes act on the genomic andmolecular level for the rapid adaptation of the decedents ofdomesticated species during de-domestication.
Weedy rice (Oryza sativa f. spontanea), also called ‘red rice’,is a conspecific weed of cultivated rice. Although multiple originsfor weedy rice have been proposed, currently de-domesticationfrom cultivated varieties has been acknowledged as one of themain routes for the origin of weedy rice all over the world8–14.This kind of weed is also one of the plants identified by Ellstrandet al.3 as having originated by de-domestication. Compared withthe other species, domesticated rice genome assembly and itsannotation provide good proxies and facilitate the work on weedyrice15–17. Therefore, weedy rice may serve as one of the bestmodels to investigate the process of crop de-domestication.
It is well established that after following its evolution fromdomesticated rice, weedy rice becomes an invasive plant andpernicious pest in paddy fields18–20. Weedy rice harboursmany growth characters more similar to wild rice forms thandomesticates that enhance its survival abilities. For example,weedy rice has a shattering phenotype that readily releases seedsto the soil where they can persist dormancy for many years18.On the other hand, given its close genetic relationship withcultivated rice, the development of herbicides that can controlweedy rice without injuring commercial rice has proven difficult,resulting in weedy rice being as a continued serious constraint torice production worldwide20.
Up to now, our understanding of the underlying adaptivemechanisms of weedy rice during de-domestication remains quitelimited. Several previous studies have provided helpful insightsinto this process9–14,19,21. For instance, Reagon et al.19 examinedthe SD1 gene and were able to demonstrate a critical role ofintrogressive hybridisation during the divergence of descendantweedy rice from its cultivated progenitor. Qi et al.21 usedgenotyping by sequencing to identify multiple small-to-moderate
effect quantitative trait loci for weediness traits important inweedy rice forms compared with cultivated forms and suggestedthat weedy rice may be a product of parallel evolutionthrough independent genetic mechanisms. However, a broadunderstanding of the genomic scale changes occurring duringde-domestication has yet to be developed.
To address this paucity of information, in this present study wesequenced the genomes of individual weedy rice sample from fourrepresentative populations across China and the contiguouslygrowing cultivated rice forms in these regions. Our resultsindicated that the Chinese weedy rice was de-domesticatedindependently from cultivated rice and suffered a geneticbottleneck during each de-domestication event based onphylogenetic and demographic analyses. Genomic signatures ofweedy rice identified in our work allowed us to (i) define thecritical genes that underlie convergent evolution in differentpopulations given the fact that different weedy groups evolveindependently in local environments; (ii) determine therelative roles of standing variations and new mutations in therapid adaptation of weedy rice during de-domestication; and(iii) determine what kind of selection is occurring during thede-domestication process.
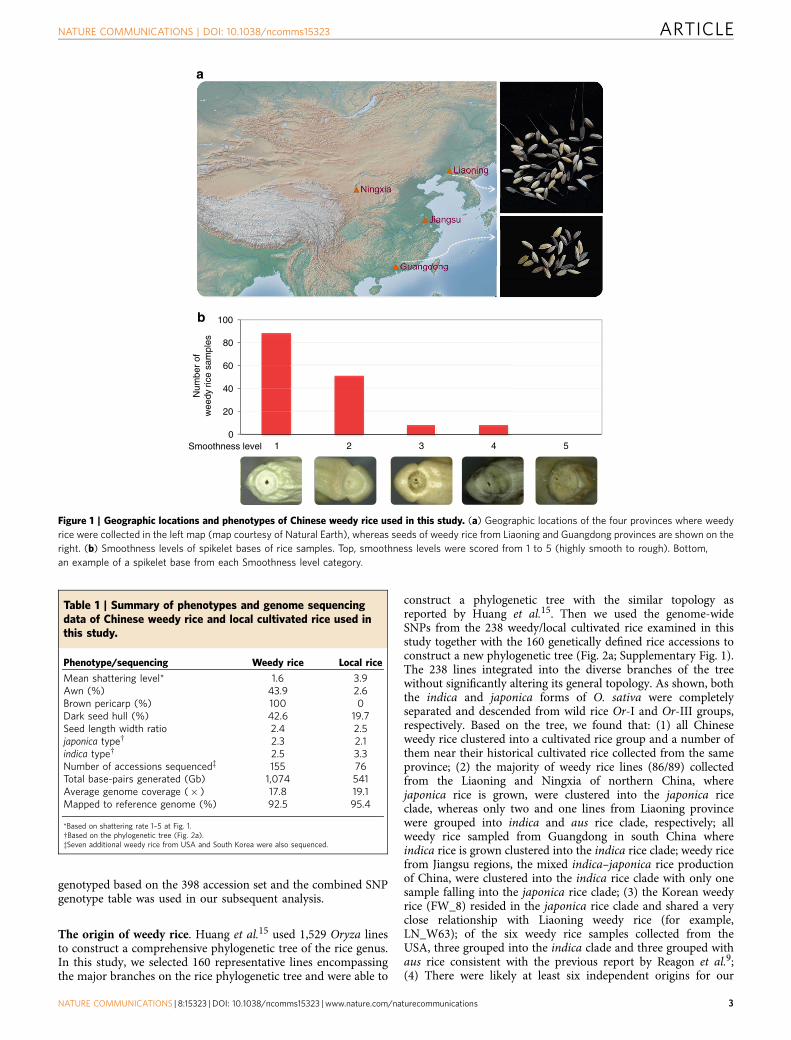
ResultsPhenotypes and genome re-sequencing of weedy rice. In orderto generate a representative population of Chinese weedy riceisolates, 155 samples were collected from multiple fields in fourheavily infested provinces in China (Supplementary Data 1;another seven weedy rice were collected from United Statesand South Korea). The four areas include typical indica riceproduction areas in south China (Guandong), japonica ricegrowing areas in northern China (Liaoning and Ningxia) andmixed indica–japonica production areas in the Yangtze regions(Jiangsu) (Fig. 1a). As comparative partners, we also collected 76cultivars that are historically grown in these same four provinces.In contrast to the cultivated rice samples collected in thisstudy, the majority of weedy rice samples collected have a seedshattering phenotype and brown seed coat (Table 1; Fig. 1b). Theextent or rate of shattering in the various weedy rice samples wasestimated based upon the smoothness of their spikelet bases,which is an indication of the maturity level of the abscission layerthat is responsible for the shattering phenotype22,23. In general,we found that the spikelet bases in the weedy rice bases weresmoother (mean¼ 1.6) compared with those of cultivated rice(mean¼ 3.9), and most of the weedy rice forms (89.7%) had asmooth spikelet phenotype (1–2) (Fig. 1). Among the weedy riceisolates 42.6% had dark hulls and 43.9% had awns (Table 1).
All 238 accessions (162 weedy and 76 local cultivated rice) weresequenced and a total of 1,615 Gb of raw data (in averageB18.2� depth) were generated for the collected samples (weedy:1,074 G; cultivated: 541 G). Cleaned reads of each accession weremapped to the japonica rice reference genome (MSU v6.1), andB93.4% of the reference genome was covered per sample.Genomic data from a representative collection of 160 Oryzaspecies sequenced by Huang et al.15 were integrated in this study(for details see Materials and Methods) to form a combinedgenotype table for the 398 accessions. An imputation approachwas applied to predict the missing genotypes24. We alsosequenced one gene (OsEXP3) in 38 accessions of the Jiangsuindica weedy group using Sanger-based methods in order todetermine the genotype at five single-nucleotide polymorphisms(SNP) locations (see Materials and Methods). These analysesfound that all the genotypes were consistent between thetwo methods if heterozygous genotypes were not considered(Supplementary Table 1). Finally, a total of 7,782,704 SNPs were
ARTICLE NATURE COMMUNICATIONS | DOI: 10.1038/ncomms15323
2 NATURE COMMUNICATIONS | 8:15323 | DOI: 10.1038/ncomms15323 | www.nature.com/naturecommunications
genotyped based on the 398 accession set and the combined SNPgenotype table was used in our subsequent analysis.
The origin of weedy rice. Huang et al.15 used 1,529 Oryza linesto construct a comprehensive phylogenetic tree of the rice genus.In this study, we selected 160 representative lines encompassingthe major branches on the rice phylogenetic tree and were able to
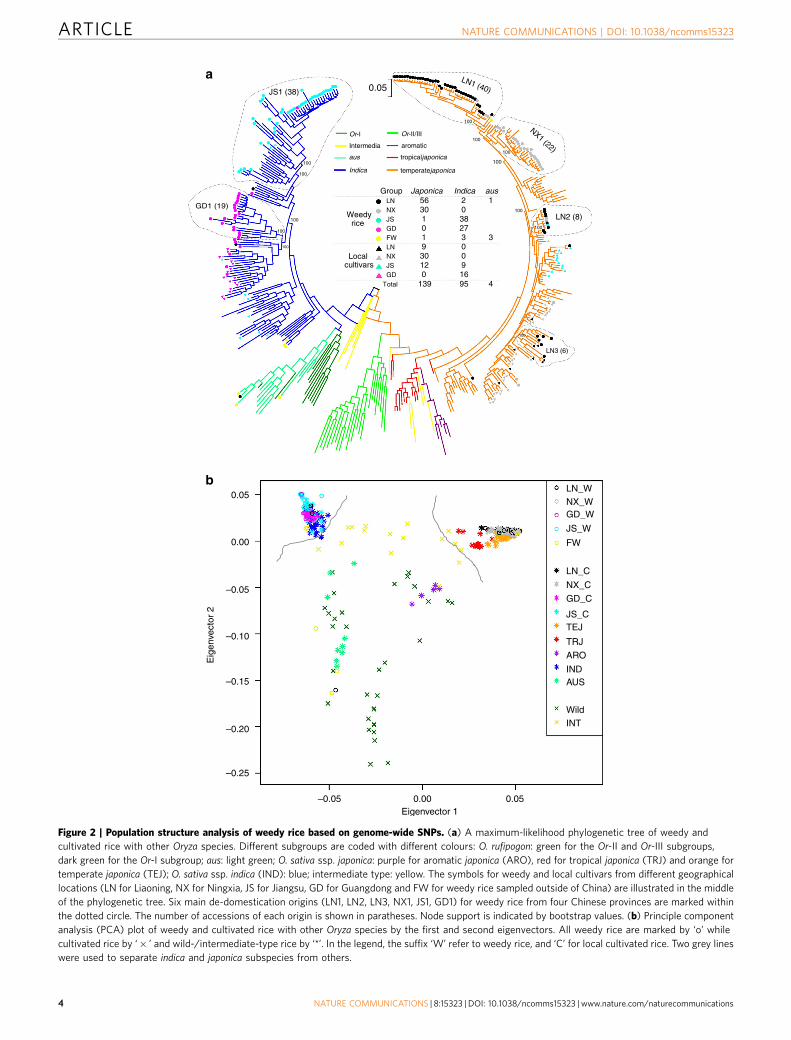
construct a phylogenetic tree with the similar topology asreported by Huang et al.15. Then we used the genome-wideSNPs from the 238 weedy/local cultivated rice examined in thisstudy together with the 160 genetically defined rice accessions toconstruct a new phylogenetic tree (Fig. 2a; Supplementary Fig. 1).The 238 lines integrated into the diverse branches of the treewithout significantly altering its general topology. As shown, boththe indica and japonica forms of O. sativa were completelyseparated and descended from wild rice Or-I and Or-III groups,respectively. Based on the tree, we found that: (1) all Chineseweedy rice clustered into a cultivated rice group and a number ofthem near their historical cultivated rice collected from the sameprovince; (2) the majority of weedy rice lines (86/89) collectedfrom the Liaoning and Ningxia of northern China, wherejaponica rice is grown, were clustered into the japonica riceclade, whereas only two and one lines from Liaoning provincewere grouped into indica and aus rice clade, respectively; allweedy rice sampled from Guangdong in south China whereindica rice is grown clustered into the indica rice clade; weedy ricefrom Jiangsu regions, the mixed indica–japonica rice productionof China, were clustered into the indica rice clade with only onesample falling into the japonica rice clade; (3) the Korean weedyrice (FW_8) resided in the japonica rice clade and shared a veryclose relationship with Liaoning weedy rice (for example,LN_W63); of the six weedy rice samples collected from theUSA, three grouped into the indica clade and three grouped withaus rice consistent with the previous report by Reagon et al.9;(4) There were likely at least six independent origins for our
0
20
40
60
80
100
1 2 3 4 5
Num
ber
ofw
eedy
ric
e sa
mpl
es
Smoothness level
a
b
Figure 1 | Geographic locations and phenotypes of Chinese weedy rice used in this study. (a) Geographic locations of the four provinces where weedy
rice were collected in the left map (map courtesy of Natural Earth), whereas seeds of weedy rice from Liaoning and Guangdong provinces are shown on the
right. (b) Smoothness levels of spikelet bases of rice samples. Top, smoothness levels were scored from 1 to 5 (highly smooth to rough). Bottom,
an example of a spikelet base from each Smoothness level category.
Table 1 | Summary of phenotypes and genome sequencingdata of Chinese weedy rice and local cultivated rice used inthis study.
Phenotype/sequencing Weedy rice Local rice
Mean shattering level* 1.6 3.9Awn (%) 43.9 2.6Brown pericarp (%) 100 0Dark seed hull (%) 42.6 19.7Seed length width ratio 2.4 2.5japonica typew 2.3 2.1indica typew 2.5 3.3Number of accessions sequencedz 155 76Total base-pairs generated (Gb) 1,074 541Average genome coverage (� ) 17.8 19.1Mapped to reference genome (%) 92.5 95.4
*Based on shattering rate 1–5 at Fig. 1.wBased on the phylogenetic tree (Fig. 2a).zSeven additional weedy rice from USA and South Korea were also sequenced.
NATURE COMMUNICATIONS | DOI: 10.1038/ncomms15323 ARTICLE
NATURE COMMUNICATIONS | 8:15323 | DOI: 10.1038/ncomms15323 | www.nature.com/naturecommunications 3
temperatejaponica Indica
aus tropicaljaponica
aromatic
Or-I
Intermedia
Or-II/III
100
100
GD1 (19)
JS1 (38) 0.05
LN2 (8)
LN3 (6)
100
LN1 (40)
NX1 (22)100
100
100
Group Japonica Indica aus
Weedy rice
LN 56 2 1NX 30 0JS 1 38GD 0 27FW 1 3 3
Local cultivars
LN 9 0NX 30 0JS 12 9GD 0 16
Total 139 95 4
100
100
100
100
100 100
LN_W0.05
0.00
–0.05
Eig
enve
ctor
2
–0.10
–0.15
–0.20
–0.25
NX_WGD_W
JS_W
LN_C
NX_C
GD_C
JS_CTEJ
TRJ
ARO
INDAUS
WildINT
0.050.00–0.05Eigenvector 1
FW
a
b
Figure 2 | Population structure analysis of weedy rice based on genome-wide SNPs. (a) A maximum-likelihood phylogenetic tree of weedy and
cultivated rice with other Oryza species. Different subgroups are coded with different colours: O. rufipogon: green for the Or-II and Or-III subgroups,
dark green for the Or-I subgroup; aus: light green; O. sativa ssp. japonica: purple for aromatic japonica (ARO), red for tropical japonica (TRJ) and orange for
temperate japonica (TEJ); O. sativa ssp. indica (IND): blue; intermediate type: yellow. The symbols for weedy and local cultivars from different geographical
locations (LN for Liaoning, NX for Ningxia, JS for Jiangsu, GD for Guangdong and FW for weedy rice sampled outside of China) are illustrated in the middle
of the phylogenetic tree. Six main de-domestication origins (LN1, LN2, LN3, NX1, JS1, GD1) for weedy rice from four Chinese provinces are marked within
the dotted circle. The number of accessions of each origin is shown in paratheses. Node support is indicated by bootstrap values. (b) Principle component
analysis (PCA) plot of weedy and cultivated rice with other Oryza species by the first and second eigenvectors. All weedy rice are marked by ‘o’ while
cultivated rice by ‘� ’ and wild-/intermediate-type rice by ‘*’. In the legend, the suffix ‘W’ refer to weedy rice, and ‘C’ for local cultivated rice. Two grey lines
were used to separate indica and japonica subspecies from others.
ARTICLE NATURE COMMUNICATIONS | DOI: 10.1038/ncomms15323
4 NATURE COMMUNICATIONS | 8:15323 | DOI: 10.1038/ncomms15323 | www.nature.com/naturecommunications
sampled Chinese weedy rice, three for Liaoning (LN1, LN2, LN3)and one for each of three other provinces (NX1, JS1, GD1).The bootstrap confidence values for the topology of all the sixclades are 100% (Fig. 2a). Although LN1 and NX1 appeartogether as a monophyletic group and more data may be neededto conclusively determine their origin, they are fromgeographically distinct regions with distinct climates andenvironments, and are thus treated separately for populationgenetic analysis.
Principle component analysis (PCA) based on the genome-wide SNPs confirmed the population structure evidenced in thephylogenetic tree (Fig. 2b). In the two-dimension PCA plot basedon the first two eigenvectors, indica and japonica cultivated ricewere clearly separated from intermediate rice (as described byHuang et al.15) and wild rice. The PCA also supports ourphylogenetic analysis indicating that all Chinese weedy ricecluster with the cultivated rice forms. Consistent with previousreports10,12,13, our results collectively showed that none of theChinese weedy rice sampled in this study directly originated fromwild rice types, and the weedy forms collected in this studyoriginated by multiple independent de-domestication events,most likely from the historically locally grown cultivars. Based onour phylogenetic analysis, four subpopulations (LN1, NX1,GD1 and JS1) that each likely represents a main singlede-domestication event of one province were used forsubsequent population genetic analyses (Fig. 2a). The samplessize for the four sub-populations were 40, 22, 19 and 38 for LN1,NX1, GD1 and JS1, respectively. Some other minor origins,including the two de-domestication subgroups of Liaoning(LN2, LN3), were not considered for further analyses owing tolimited sample size.
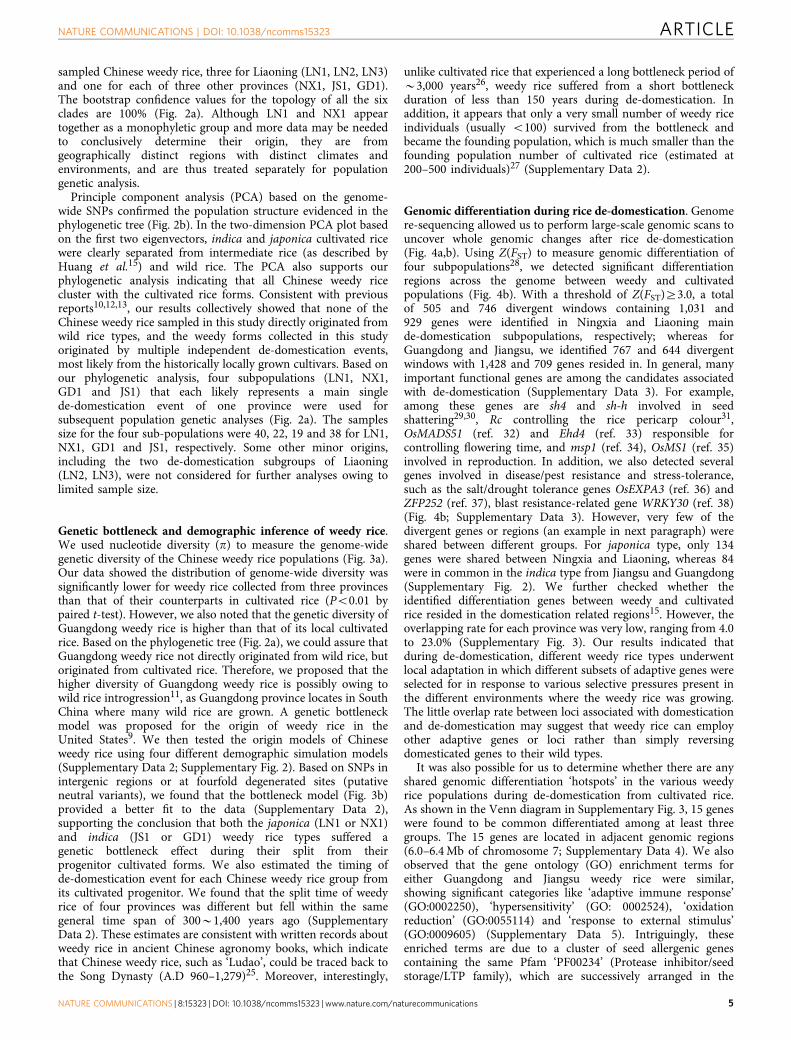
Genetic bottleneck and demographic inference of weedy rice.We used nucleotide diversity (p) to measure the genome-widegenetic diversity of the Chinese weedy rice populations (Fig. 3a).Our data showed the distribution of genome-wide diversity wassignificantly lower for weedy rice collected from three provincesthan that of their counterparts in cultivated rice (Po0.01 bypaired t-test). However, we also noted that the genetic diversity ofGuangdong weedy rice is higher than that of its local cultivatedrice. Based on the phylogenetic tree (Fig. 2a), we could assure thatGuangdong weedy rice not directly originated from wild rice, butoriginated from cultivated rice. Therefore, we proposed that thehigher diversity of Guangdong weedy rice is possibly owing towild rice introgression11, as Guangdong province locates in SouthChina where many wild rice are grown. A genetic bottleneckmodel was proposed for the origin of weedy rice in theUnited States9. We then tested the origin models of Chineseweedy rice using four different demographic simulation models(Supplementary Data 2; Supplementary Fig. 2). Based on SNPs inintergenic regions or at fourfold degenerated sites (putativeneutral variants), we found that the bottleneck model (Fig. 3b)provided a better fit to the data (Supplementary Data 2),supporting the conclusion that both the japonica (LN1 or NX1)and indica (JS1 or GD1) weedy rice types suffered agenetic bottleneck effect during their split from theirprogenitor cultivated forms. We also estimated the timing ofde-domestication event for each Chinese weedy rice group fromits cultivated progenitor. We found that the split time of weedyrice of four provinces was different but fell within the samegeneral time span of 300B1,400 years ago (SupplementaryData 2). These estimates are consistent with written records aboutweedy rice in ancient Chinese agronomy books, which indicatethat Chinese weedy rice, such as ‘Ludao’, could be traced back tothe Song Dynasty (A.D 960–1,279)25. Moreover, interestingly,
unlike cultivated rice that experienced a long bottleneck period ofB3,000 years26, weedy rice suffered from a short bottleneckduration of less than 150 years during de-domestication. Inaddition, it appears that only a very small number of weedy riceindividuals (usually o100) survived from the bottleneck andbecame the founding population, which is much smaller than thefounding population number of cultivated rice (estimated at200–500 individuals)27 (Supplementary Data 2).
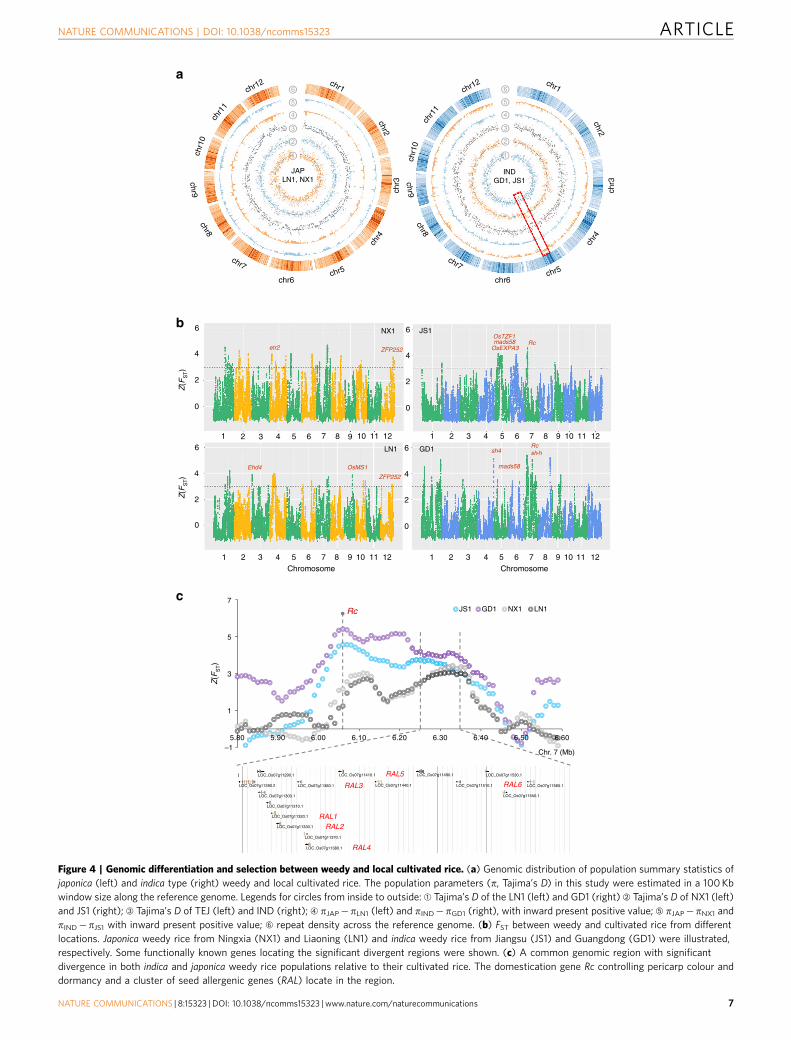
Genomic differentiation during rice de-domestication. Genomere-sequencing allowed us to perform large-scale genomic scans touncover whole genomic changes after rice de-domestication(Fig. 4a,b). Using Z(FST) to measure genomic differentiation offour subpopulations28, we detected significant differentiationregions across the genome between weedy and cultivatedpopulations (Fig. 4b). With a threshold of Z(FST)Z3.0, a totalof 505 and 746 divergent windows containing 1,031 and929 genes were identified in Ningxia and Liaoning mainde-domestication subpopulations, respectively; whereas forGuangdong and Jiangsu, we identified 767 and 644 divergentwindows with 1,428 and 709 genes resided in. In general, manyimportant functional genes are among the candidates associatedwith de-domestication (Supplementary Data 3). For example,among these genes are sh4 and sh-h involved in seedshattering29,30, Rc controlling the rice pericarp colour31,OsMADS51 (ref. 32) and Ehd4 (ref. 33) responsible forcontrolling flowering time, and msp1 (ref. 34), OsMS1 (ref. 35)involved in reproduction. In addition, we also detected severalgenes involved in disease/pest resistance and stress-tolerance,such as the salt/drought tolerance genes OsEXPA3 (ref. 36) andZFP252 (ref. 37), blast resistance-related gene WRKY30 (ref. 38)(Fig. 4b; Supplementary Data 3). However, very few of thedivergent genes or regions (an example in next paragraph) wereshared between different groups. For japonica type, only 134genes were shared between Ningxia and Liaoning, whereas 84were in common in the indica type from Jiangsu and Guangdong(Supplementary Fig. 2). We further checked whether theidentified differentiation genes between weedy and cultivatedrice resided in the domestication related regions15. However, theoverlapping rate for each province was very low, ranging from 4.0to 23.0% (Supplementary Fig. 3). Our results indicated thatduring de-domestication, different weedy rice types underwentlocal adaptation in which different subsets of adaptive genes wereselected for in response to various selective pressures present inthe different environments where the weedy rice was growing.The little overlap rate between loci associated with domesticationand de-domestication may suggest that weedy rice can employother adaptive genes or loci rather than simply reversingdomesticated genes to their wild types.
It was also possible for us to determine whether there are anyshared genomic differentiation ‘hotspots’ in the various weedyrice populations during de-domestication from cultivated rice.As shown in the Venn diagram in Supplementary Fig. 3, 15 geneswere found to be common differentiated among at least threegroups. The 15 genes are located in adjacent genomic regions(6.0–6.4 Mb of chromosome 7; Supplementary Data 4). We alsoobserved that the gene ontology (GO) enrichment terms foreither Guangdong and Jiangsu weedy rice were similar,showing significant categories like ‘adaptive immune response’(GO:0002250), ‘hypersensitivity’ (GO: 0002524), ‘oxidationreduction’ (GO:0055114) and ‘response to external stimulus’(GO:0009605) (Supplementary Data 5). Intriguingly, theseenriched terms are due to a cluster of seed allergenic genescontaining the same Pfam ‘PF00234’ (Protease inhibitor/seedstorage/LTP family), which are successively arranged in the
NATURE COMMUNICATIONS | DOI: 10.1038/ncomms15323 ARTICLE
NATURE COMMUNICATIONS | 8:15323 | DOI: 10.1038/ncomms15323 | www.nature.com/naturecommunications 5
shared highly divergent region of the 0.4 Mb regions onchromosome 7 (Fig. 4c). Notably, Rc is also in that region andadjacent to the gene cluster. These results suggest that thegenomic region covering the seed allergenic gene cluster and Rcmay be indispensable for rice de-domestication. Thus we wouldexpect that these genes in different weedy populations may beunder intense natural selection and the product of convergentevolution for similar critical functions.
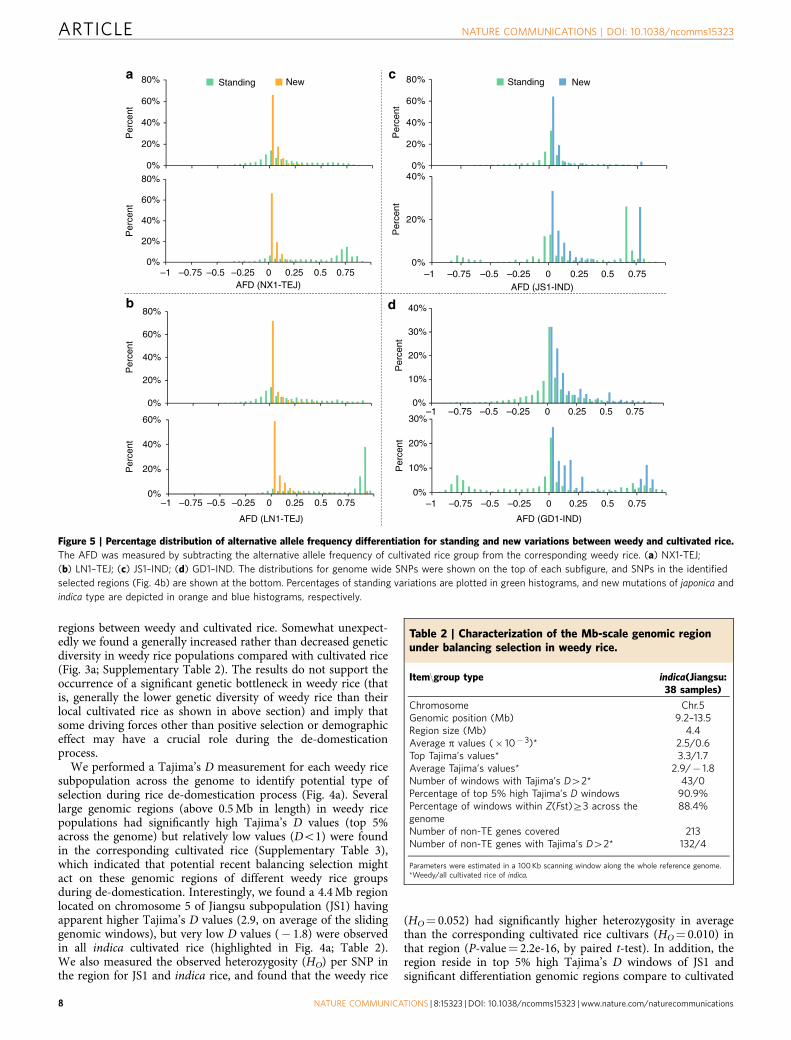
Roles of standing variations and new mutations. Based on thegenome-wide identified SNPs and population classification,we found most SNPs of weedy rice (NX1: 95.7%; LN1: 92.3%;JS1: 97.2%; GD1: 97.9%) were shared with cultivated rice. Thissuggested that the majority of variations of weedy rice werepre-existing or standing and likely originating from cultivated rice(Supplementary Fig. 4). We further explored the extent to whichthe allele frequency of standing variations and putatively newmutations differed in each of the four weedy rice populationscompared with its progenitor population, separately. Usingcultivated rice (Nipponbare) as the reference genome and thecultivated rice population as background, we calculated the
alternative allele frequency differentiation (AFD) between weedyand cultivated rice for each SNP in the whole weedy rice genomeand also the identified selected regions. With a threshold ofAFD40.7, we found a much higher percentage of SNPs with highAFD for standing variations in comparison to new mutations forjaponica type weedy rice (LN1 or NX1). However, a differenttrend was observed for indica type (GD1 or JS1). When thethreshold of AFD was set above 0.7, we found the percentage ofnew mutations that have high AFD is unexpectedly greater thanthat of standing variations, but standing variations still havehigher percentage of SNPs with AFD40.9 (Fig. 5; SupplementaryData 6; Supplementary Data 7). These findings suggest thatstanding variations have a more rapid allele fixation rate than newmutations during de-domestication, and thus may have a criticalrole for rapid adaptation. In addition, variations that are notpre-existing in cultivated rice also contribute greatly to theadaptation of weedy rice. This appears to be particularly true forChinese indica type weedy rice.
A Mb-scale genomic region under balancing selection.We measured nucleotide diversity (p) in the identified divergent
** ****0.012
0.010
0.008
0.006
0.004
0.002
0.000
NX
_JA
P_C
NX
_JA
P_W
NX
1_JA
P_W
NX
1_JA
P_C
_S
NX
1_JA
P_W
_S
LN_J
AP
_C
LN_J
AP
_W
LN1_
JAP
_W
LN1_
JAP
_C_S
LN1_
JAP
_W_S
JS_I
ND
_C
JS_I
ND
_W
GD
_IN
D_W
GD
1_IN
D_W
GD
1_IN
D_C
_S
GD
1_IN
D_W
_S
JS1_
IND
_W
JS1_
IND
_C_S
JS1_
IND
_W_S
JS1_
IND
_C
Na
Na Nw
NbTb
T
a
b
�
Figure 3 | Genetic diversity and demographic model for weedy rice. (a) Boxplots of genetic diversity (p) for weedy and cultivated rice. Boxes with orange
colour are japonica type (JAP), and blue for indica type (IND). Cultivated rice is labeled with ‘_C’, whereas weedy rice with ‘_W’. Genetic diversity for
significant divergent windows of weedy from cultivated rice are marked in light orange or blue colour with the suffix ‘_S’. The prefixes ‘NX’, ‘LN’, ‘JS’, ‘GD’
are short for Ningxia, Liaoning, Jiangsu and Guangdong provinces, respectively. The prefixes ‘NX1’, ‘LN1’, ‘JS1’, ‘GD1’ are short for main de-domestication
origin of Ningxia, Liaoning, Jiangsu and Guangdong provinces, respectively. The ‘**’ is marked if the genetic diversity of weedy rice is significantly lower than
that of local cultivated rice (Po0.01 by paired t-test). (b) Demographic model for weedy rice. The model assumes that the initiate weedy rice founders split
from cultivated rice (effective population size Na) and then suffered a genetic bottleneck in a Tb duration. After the bottleneck, the weedy rice founder
population (effective population size Nb) recovered to the present effective population size (Nw) at time T.
ARTICLE NATURE COMMUNICATIONS | DOI: 10.1038/ncomms15323
6 NATURE COMMUNICATIONS | 8:15323 | DOI: 10.1038/ncomms15323 | www.nature.com/naturecommunications
JAPLN1, NX1
INDGD1, JS1
NX1 JS1
LN1 GD1
ZFP252 OsEXPA3Rc
Rcsh-h
Ehd4 OsMS1
ZFP252
sh4
Z(F
ST)
Z(F
ST)
Z(F
ST)
mads58
mads58OsTZF1
etr2
Chromosome Chromosome
RAL1RAL2
RAL3
RAL4
RAL5
RAL6
Rc
Chr. 7 (Mb)–1
1
3
5
7
5.80 5.90 6.00 6.10 6.20 6.30 6.40 6.50 6.60
JS1 GD1 NX1 LN1
LOC_Os07g11290.1
LOC_Os07g11280.2 LOC_Os07g11360.1
LOC_Os07g11410.1
1
0
2
4
6
0
2
4
6
chr6
chr7
chr8
chr9
chr1
0
chr1
0
chr1
1
chr1
1
chr12 chr1
chr2
chr5
chr4
chr3
chr6
chr7
chr8
chr9
chr12 chr1
chr2
chr5
chr4
chr3
0
2
4
6
0
2
4
6
2 3 4 5 6 7 8 9 10 11 12 1 2 3 4 5 6 7 8 9 10 11 12
1 2 3 4 5 6 7 8 9 10 11 121 2 3 4 5 6 7 8 9 10 11 12
LOC_Os07g11440.1
LOC_Os07g11490.1
LOC_Os07g11510.1
LOC_Os07g11530.1
LOC_Os07g11560.1
LOC_Os07g11550.1LOC_Os07g11300.1
LOC_Os07g11310.1
LOC_Os07g11320.1
LOC_Os07g11330.1
LOC_Os07g11370.1
LOC_Os07g11380.1
6
5
4
3
2
1
6
5
4
3
2
1
a
b
c
Figure 4 | Genomic differentiation and selection between weedy and local cultivated rice. (a) Genomic distribution of population summary statistics of
japonica (left) and indica type (right) weedy and local cultivated rice. The population parameters (p, Tajima’s D) in this study were estimated in a 100 Kb
window size along the reference genome. Legends for circles from inside to outside: A Tajima’s D of the LN1 (left) and GD1 (right) B Tajima’s D of NX1 (left)
and JS1 (right); C Tajima’s D of TEJ (left) and IND (right); D pJAP�pLN1 (left) and pIND� pGD1 (right), with inward present positive value; E pJAP�pNX1 and
pIND�pJS1 with inward present positive value; F repeat density across the reference genome. (b) FST between weedy and cultivated rice from different
locations. Japonica weedy rice from Ningxia (NX1) and Liaoning (LN1) and indica weedy rice from Jiangsu (JS1) and Guangdong (GD1) were illustrated,
respectively. Some functionally known genes locating the significant divergent regions were shown. (c) A common genomic region with significant
divergence in both indica and japonica weedy rice populations relative to their cultivated rice. The domestication gene Rc controlling pericarp colour and
dormancy and a cluster of seed allergenic genes (RAL) locate in the region.
NATURE COMMUNICATIONS | DOI: 10.1038/ncomms15323 ARTICLE
NATURE COMMUNICATIONS | 8:15323 | DOI: 10.1038/ncomms15323 | www.nature.com/naturecommunications 7
regions between weedy and cultivated rice. Somewhat unexpect-edly we found a generally increased rather than decreased geneticdiversity in weedy rice populations compared with cultivated rice(Fig. 3a; Supplementary Table 2). The results do not support theoccurrence of a significant genetic bottleneck in weedy rice (thatis, generally the lower genetic diversity of weedy rice than theirlocal cultivated rice as shown in above section) and imply thatsome driving forces other than positive selection or demographiceffect may have a crucial role during the de-domesticationprocess.
We performed a Tajima’s D measurement for each weedy ricesubpopulation across the genome to identify potential type ofselection during rice de-domestication process (Fig. 4a). Severallarge genomic regions (above 0.5 Mb in length) in weedy ricepopulations had significantly high Tajima’s D values (top 5%across the genome) but relatively low values (Do1) were foundin the corresponding cultivated rice (Supplementary Table 3),which indicated that potential recent balancing selection mightact on these genomic regions of different weedy rice groupsduring de-domestication. Interestingly, we found a 4.4 Mb regionlocated on chromosome 5 of Jiangsu subpopulation (JS1) havingapparent higher Tajima’s D values (2.9, on average of the slidinggenomic windows), but very low D values (� 1.8) were observedin all indica cultivated rice (highlighted in Fig. 4a; Table 2).We also measured the observed heterozygosity (HO) per SNP inthe region for JS1 and indica rice, and found that the weedy rice
(HO¼ 0.052) had significantly higher heterozygosity in averagethan the corresponding cultivated rice cultivars (HO¼ 0.010) inthat region (P-value¼ 2.2e-16, by paired t-test). In addition, theregion reside in top 5% high Tajima’s D windows of JS1 andsignificant differentiation genomic regions compare to cultivated
0%
20%
40%
Per
cent
AFD (JS1-IND)
0%
20%
40%
60%
80%
Per
cent
a c
b d
0%
20%
40%
60%
80%
Per
cent
Standing New Standing New
0%
20%
40%
60%
80%
–1 –0.75 –0.5 –0.25 0 0.25 0.5 0.75
–1 –0.75 –0.5 –0.25 0 0.25 0.5 0.75
–1 –0.75 –0.5 –0.25 0 0.25 0.5 0.75
–1 –0.75 –0.5 –0.25 0 0.25 0.5 0.75
–1 –0.75 –0.5 –0.25 0 0.25 0.5 0.75
Per
cent
AFD (NX1-TEJ)
0%
20%
40%
60%
80%
Per
cent
0%
20%
40%
60%
Per
cent
AFD (LN1-TEJ)
0%
10%
20%
30%
Per
cent
AFD (GD1-IND)
0%
10%
20%
30%
40%
Per
cent
Figure 5 | Percentage distribution of alternative allele frequency differentiation for standing and new variations between weedy and cultivated rice.
The AFD was measured by subtracting the alternative allele frequency of cultivated rice group from the corresponding weedy rice. (a) NX1-TEJ;
(b) LN1–TEJ; (c) JS1–IND; (d) GD1–IND. The distributions for genome wide SNPs were shown on the top of each subfigure, and SNPs in the identified
selected regions (Fig. 4b) are shown at the bottom. Percentages of standing variations are plotted in green histograms, and new mutations of japonica and
indica type are depicted in orange and blue histograms, respectively.
Table 2 | Characterization of the Mb-scale genomic regionunder balancing selection in weedy rice.
Item\group type indica(Jiangsu:38 samples)
Chromosome Chr.5Genomic position (Mb) 9.2–13.5Region size (Mb) 4.4Average p values (� 10� 3)* 2.5/0.6Top Tajima’s values* 3.3/1.7Average Tajima’s values* 2.9/� 1.8Number of windows with Tajima’s D42* 43/0Percentage of top 5% high Tajima’s D windows 90.9%Percentage of windows within Z(Fst)Z3 across thegenome
88.4%
Number of non-TE genes covered 213Number of non-TE genes with Tajima’s D42* 132/4
Parameters were estimated in a 100 Kb scanning window along the whole reference genome.*Weedy/all cultivated rice of indica.
ARTICLE NATURE COMMUNICATIONS | DOI: 10.1038/ncomms15323
8 NATURE COMMUNICATIONS | 8:15323 | DOI: 10.1038/ncomms15323 | www.nature.com/naturecommunications
rice (Z(FST)Z3), suggesting a low possibility of bias owing togenetic drift. The region is located in a relatively repeat-richportion of the chromosome and covered the centromeric area ofthe chromosome (Fig. 4a). To confirm novel genomic structure inthe region was not caused by repetitive elements, we calculatedthe Tajima’s D of non-transposable element (non-TE) geneswithin the region and we consistently observed much highernumbers of non-TE genes with Tajima’s D42 in the region of JS1subpopulation but low in cultivated rice (Table 2; SupplementaryData 8). Furthermore, we also sequenced a abiotic stress-relatedgene (OsEXPA3) in the gene set in the Jiangsu indica weedy ricepopulations by Sanger approach (Supplementary Fig. 5) andconfirmed a significant high Tajima’s D for this gene in JS1 weedyrice (P-value¼ 0.029, tested by 10,000 coalescent simulations).Taken together, we believe that the Mb-scale regions of Jiangsuweedy rice experienced strong balancing selection since theirde-domestication from cultivated rice populations.
DiscussionThe genome-based study carried out here indicates that Chineseweedy rice were de-domesticated from cultivated rice and are agood model to uncover signature changes in genome architectureassociated with crop de-domestication. To our knowledge, this isthe first attempt to examine crop de-domestication at wholegenomic level. Our findings not only facilitate a better under-standing of this unique evolutionary process, but also havepractical implications for paddy weed management.
Many long-standing questions regarding rapid adaptationin plants remain to be answered39,40. One of the issues is therelative roles standing (pre-existing) variations and newlyarisen mutations play for environmental adaptation duringde-domestication. The roles of standing and new variations inthe de-domestication system were investigated in this study froma whole genomic view. We found a much more rapid allelefrequency change rate for standing variations, suggesting thestanding variations play important role in local adaption of weedyrice. Previous studies have suggested that standing variation couldfacilitate more rapid adaptation than through new mutations,because an initially higher frequency of beneficial alleles isimmediately available for standing variation, which reduces theaverage fixation time40. On the other hand, we observed thatmany SNPs that were not pre-existing in the progenitor cultivatedrice also have a high allele frequency in weedy rice, which isparticularly the case for indica type weedy rice. The newmutations or variations introgressed from wild rice11 shouldalso contribute to play critical roles and provide a sustainablesupply to the species adaptation during de-domestication process.
Another question is the selection regime involved in thede-domestication process. For domestication, the rapid evolutionof crops is mainly driven by human-imposed directionalselection. However, de-domesticated plants are subject to morediverse pressures and may require more capabilities to survive inan agro-ecosystem, such as the capacity to escape from humanweeding, to persist in the seed bank, and to compete for light andnutrients with crops nearby. In our genome-wide investigation,some genomic regions were found to have undergone potentialbalancing selection. However, most of them were only observedin one subpopulation, which is consistent with the feweroverlapping results of the numbers of selected genes. We believeit is also due to local adaptation, during which different subsets ofloci were targets of balancing selection in response to variousselective pressures present in the different environment where theweedy rice was growing. A Mb-scale region was found to beunder balancing selection. This region resides near the centro-mere where re-combination is relatively rare. This may in part
explain the large width of the signature. The region also hassignificantly higher heterozygosity compared with its counterpartin cultivated rice type indicating that heterozygous advantagecould be one of the mechanisms for the balancing selection inweedy rice. On the other hand, the Tajima’s D values of theseregions in cultivated rice were very low, indicating alleles with lowfrequency in cultivated rice evolved to medium frequency inweedy rice during de-domestication. Therefore, the mechanism ofnegative frequency dependence could not be neglected. Prior toour analysis, the best-known examples of genes under balancingselection in plants were those involved in self-incompatibilityand pathogen resistance41. Several genes related to resistance andself-incompatibility reside in these regions, including the salttolerance gene OsEXPA3 and the reproduction related genes,‘LOC_Os05g18730’ and ‘LOC_Os05g18940’ containing thedomains ‘Male gamete fusion factor’ and ‘Stigma-specificprotein, Stig1’, respectively (Supplementary Data 8). Thesegenes have very high Tajima’s D in weedy rice but quite lowvalues in its progenitor cultivated population indicating strongbalancing selection. Craig et al.42 have reported that geneticallybased postzygotic barriers to hybridisation between weedy andcultivated rice are not strong, and they indicated a greaterpotential than expected for crop-weed hybridisation in UScultivated rice fields. Consistently, adaptive introgression fromlocal cultivated or wild rice has played a critical role in theadaptation of weedy rice11,19. Balancing selection would thereforebe expected to help maintain a high polymorphism in theadaptation-related genomic regions and provide an evolutionarymechanism for adaptations during crop de-domestication.
During de-domestication, the genomic pattern under balancingselection is quite distinct to what is observed in crop domestica-tion, which is usually with a reduction of genetic diversity byartificial selection. Based on our whole genomic analyses, manyregions under genomic differentiation have evolved to have ahigher genetic diversity and heterozygosity relative to theirprogenitor cultivated rice during de-domestication (Fig. 3a).Within these regions are located many genes that may beimportant in environmental adaptation including genes control-ling flowering time, reproduction, disease/pest resistance, andother stress responses (Supplementary Data 3). This could helpexplain part of the extensive morphological diversity that exists inweedy rice populations despite their generally lower genome-widegenetic diversity9. The observed phenotypic heterogeneity, suchas multiple flowering strategies, can be regarded as an indicator ofbetter adaptive flexibility11,43. As weedy rice likely diverged fromcultivated rice hundreds of years ago, the two rice types are underdistinct selection pressures driving their genomes to evolve. Thegenomic differentiation scan between weedy and moderncultivated rice may be compounded by both artificial selectionand natural selections. In our study, 4–23% of de-domesticationgenes overlapped with the regions under artificial selection. Webelieve that some of these genes or loci probably crucial for bothdomestication and de-domestication (for example, Rc). However,there could also be some genomic differentiation regions betweenweedy and cultivated rice only due to artificial selection oncultivated rice. Therefore, it is indeed difficult to clearly separatethe complex effects of the two genetic processes in thoseoverlapping regions.
This study also provides some practical implications for thepaddy weed control. Our analyses indicate that different weedyrice populations have independent origins and employ differentgenomic loci for their adaptation and weediness traits. Therefore,it may be not easy to develop a universally efficient weedy ricemanagement approach. More likely different strategies will beneeded to tackle the problems of weedy rice in different regions.Rice breeders have long sought after a greater genetic
NATURE COMMUNICATIONS | DOI: 10.1038/ncomms15323 ARTICLE
NATURE COMMUNICATIONS | 8:15323 | DOI: 10.1038/ncomms15323 | www.nature.com/naturecommunications 9
resource pool to incorporate in their genetic improvement work.As evidenced in this study, genetic diversity of some importantenvironmental adaptation genes has increased in weedy ricedriven by balancing selection during de-domestication. Thus,locally generated weedy rice could supply a valuable geneticresource for fitness genes to local environments, contributing tothe more rapid improvement of tolerance and resistance traits incultivated rice.
MethodsPlant materials and DNA sequencing. A total of 155 weedy and 76 localcultivated rice samples were collected from China and with seven weedy samplesfrom the USA and South Korea used in this study (Supplementary Data 1). The 155Chinese weedy rice accessions were collected from multiple rice planting fields offour representative geographically locations or provinces in China (Liaoning,Ningxia, Jiangsu and Guangdong) where rice fields are seriously harmed by weedyrice. The geographic map was plotted using GenGIS v2 (ref. 44). The 76 cultivatedrice including local landraces and cultivars planted in recent 30 years in the fourregions. Liaoning and Ningxia locate in northern China which temperate japonicais widely cultivated, whereas Guangdong in Southern China primarily cultivatesindica rice. Jiangsu province locates in the low Yangtze region, where both indicaand japonica rice types were cultivated in history, and in recent 20 years, japonicavarieties have become the dominant type. After collecting the seeds of weedy andcultivated rice accessions, they were stored in China National Rice ResearchInstitute. Seeds were germinated and planted together in the experiment field(Chinese Academy of Agricultural Sciences in Fuyang, China). The seeds of eachaccession were harvested when grains ripened (B30 days after flowering) tominimize bias owing to different seed maturity level. Five seed traits (shattering,presence of awn, pericarp colour, hull colour, seed length width ratio) wereevaluated. The extent of shattering was estimated based on the smoothness of theirspikelet bases, which is an indication of the maturity level of the abscission layerthat is responsible for the shattering phenotype22,23. The entire DNAs of the 238samples were extracted from green leaves using routine protocol. A total 1,615 Gbpaired-end sequence data were generated by Illumina Hiseq2500 and Hiseq4000,covering approximately an average depth of 18.2� for each sample. Theshort-read sequence data by this study have been deposited into the GenBankunder the bioproject accession number PRJNA295802.
Other genomic data from 160 Oryza species (including 34 indica varities;50 and 14 temperate and tropical japonica varities; 5 aromatic; 32 O. rufipogon;9 aus and 16 intermediate accessions) (Supplementary Data 1) were obtained fromprevious study15.
Variants detection and genotyping. The raw paired-end reads were first filteredinto clean data using NGSQCtookit v2.3.3 (ref. 45). The cutoff value for PHREDquality score was set to 20 and the percentage of read length that met the givenquality was 70. Clean reads of each accession were mapped to japonica ricereference genome MSU v6.1 (ftp://ftp.plantbiology.msu.edu/pub/data/Eukaryotic_Projects/o_sativa/annotation_dbs/pseudomolecules/version_6.1/all.dir/) usingBOWTIE2 v2.2.1 (ref. 46) with default settings. Consecutive steps using Samtoolsv0.1.19 (ref. 47) and GATK v2.3 (ref. 48) were applied for variants detection.Potential PCR duplicates were removed by ‘Samtools rmdup’. Alignments aroundsmall indels were remapped with ‘IndelRealigner’, and raw variants were calledbased on the realigned bam file. Using the called variants as known sites,‘BaseRecalibrator’ and ‘PrintReads’ in the GATK were applied for base-pair scoresrecalibration. The proceeded BAM files of each sample were used for the multi-sample variant genotyping. ‘UnifiedGenotyper’ in GATK was applied to generatethe raw variant calls with parameters ‘-stand_call_conf 30, -stand_emit_conf 10’.To reduce the variants discovery rate, the SNP calls were filtered accordingto the following threshold: QUALo30, DPo5, QDo2, MQo20, FS460,HaplotypeScore413 and ReadPosRankSumo� 8. Potential variant annotationand effect were predicted by SnpEff v3.6 (ref. 49). Imputation was performed byBEAGLE v4.0 (ref. 24) using the genotype likelihoods, and specified the number ofiterations for estimation genotypes at genotyped markers to 10.
SNP validation by Sanger sequencing. For genotyping validation, approximatelyan 850 bp portion of one gene (LOC_Os05g19570, OsEXPA3) in the potentialbalancing selection Mega-base region was selected to sequence by Sanger methodin all 38 Jiangsu indica type weedy rice sampled in this study. The PCR-amplifiedsegment includes 5 SNPs based on our next generation sequencing SNP calling.The Primers were listed in Supplementary Table 1.
Population structure inference. Based on the genome-wide SNPs among the238 lines by this study and the 160 public samples15, phylogenetic tree wasconstructed using Fasttree50 with 1,000 replicates for bootstrap confidence analysis.MEGA v5.1 (ref. 51) was applied to draw the constructed tree. PCA was performedby SNPRelate v0.9.19 (ref. 52).
Demographic analysis. To minimize bias in demographic analyses due toselection, SNPs in intergenic regions or at four-fold degenerate sites were used.The best parameters for fitting model were estimated by qaqi v1.6.3 (ref. 53). Fourweedy rice sub-populations were independently subjected to demographicinferences (that is, LN1, NX1 de-domesticated from TEJ, respectively; JS1, GD1de-domesticated from IND, respectively). The alleles were downsampled viahypergeometric projection for each group (LN1: 70; NX1: 40; GD1: 36; JS1: 70; TEJ:100; IND: 70). Folded spectrum was used and singletons were masked for eachpool. Four demographic models were considered for each type: weedy rice splitfrom cultivated rice with bottleneck, and can/cannot migrate with cultivated riceafter bottleneck duration; weedy rice split from cultivated rice without bottleneckand allow/does not allow migration (Supplementary Fig. 2). Different demographicmodels were compared on the basis of the relative log likelihoods of the modelsgiven the observed site frequency spectrum. Two hundred independent runs withrandomized starting points were executed for each candidate model, and medianvalue was chosen based on the best fitting parameters. Among the inferred para-meters, the population size was scaled by Ne (ancestral effective population size),whereas migration rate and time was scaled by 2Ne (ref. 53). The ancestralpopulation size was estimated for indica type and temperate japonica type by theformula y¼ 4�Ne� m� L, where the genetic diversity (y) is set to 2.2e-3 and 1e-3for indica and temperate japonica cultivars according to Caicedo et al.54, theneutral mutation rate (m) is set to be 6.5e-9 (ref. 55), and the generation time (L)was assumed to be 1 year. Therefore, Ne was estimated as 84,615 and 38,461 forindica and temperate japonica type, respectively.
Population parameters estimation. The genome was scanned in a 100 Kbwindow size and the population parameters (p, FST, Tajima’s D and heterozygosityrate) were estimated for each window by VCFtools56. Nucleotide diversity (p) wasmeasured with parameters ‘--window-pi 100,000 --window-pi-step 10,000’. Theaverage 100 k window size p value was taken as the genetic diversity. Formeasurement of population differentiation, FST was calculated with the setting‘--fst-window-size 100,000 --fst-window-step 10,000’. Heterozygosity rate wasmeasured by the HO for each SNP by an in-house script. The parameters across thegenome were plotted by Circos v0.62 (ref. 57). To minimize the bias foridentification of genes under balancing selection, we further performed Tajima’sD calculation for all genes in the reference genome (MSU v6.1) using PopGenomev2.16 (ref. 58).
Summary statistics for the portions of the gene (OsASR3) sequenced by Sangermethod were performed by DnaSP v5 (ref. 59). Significance was tested with 10,000coalescent simulations.
Standing and new variations analysis. As weedy rice derived from cultivatedrice, we can generally classify the SNPs of weedy rice into pre-existing SNPsoriginated from cultivated rice and new SNPs raised during the de-domesticationprocess. Here, the shared SNPs between them were regarded as standing variations,whereas unique SNPs of weedy compared with cultivated rice were taken as newmutations. The numbers of the standing and new variations of weedy rice fromfour regions (NX1, LN1, JS1 and GD1) were calculated separately. All wild riceaccessions (including Or-I, Or-II and Or-III) were taken as the wild pool. Weestimated the allele frequency differing rate of standing and new SNPs betweenweedy and cultivated rice by AFD16. Given the genome reference is cultivated rice(Nipponbare), we first calculated alternative allele frequency of each SNP for eachrice group, and calculated AFD between weedy and its counterpart cultivated riceby alternative allele frequency (weedy)—alternative allele frequency (cultivated).The percentages of SNPs (across the whole genome and within the selectedregions) with high AFD (Z0.7) were calculated for each weedy rice group.
Genomic differentiations detection. In the genomic differentiation analysesbased on population differentiation index (FST), we compared weedy rice of oneprovince against the totality of its potential ancestors (for example,, LN1 versus alljaponica cultivars). Z-transformation was applied to locate divergent regionsbetween weedy rice and cultivated rice from the extreme tails by applying athreshold of three s.d.s28 The non-reductant genes residing in these regions weretaken as putatively selected de-domestication genes. To examine whether thedivergent genes between weedy and cultivated rice residing in the domesticatedregions, we mapped our identified de-domestication related genes to the ricereference genome (IRGSP Build 4.0) used by Huang et al.15, and checked thepercentage of genes overlapping with the domestication-related regions (forjaponica and indica, separately) identified by them15. For the detection for genomicregions with potential balancing selection for weedy rice, the genomic windowswith top 5% high Tajima’s D were found for each weedy rice group, that is,Tajima’s D value threshold for JS1, GD1, LN1 and NX1 were 2.46, 2.55, 3.09 and2.50, respectively. Large genomic regions (40.5 Mb) with continuous highTajima’s D windows were selected. As we want to detect genomic regions withbalancing selection acting during de-domestication, the regions have an averageTajima’s D41 or with high Tajima’s D (42.0) window in corresponding cultivatedrice were further filtered.
ARTICLE NATURE COMMUNICATIONS | DOI: 10.1038/ncomms15323
10 NATURE COMMUNICATIONS | 8:15323 | DOI: 10.1038/ncomms15323 | www.nature.com/naturecommunications
GO and metabolic pathway enrichment analysis. GO enrichment analysis wascarried out using AgriGO60 with ‘Oryza sativa MSU6.1 non-TE’ set as speciesbackground (http://bioinfo.cau.edu.cn/agriGO/). The P-value (hypergeometric)and false discovery rate (FDR) (Yekutieli) criteria of o0.0001 ando0.05,respectively, were used for the considered enrichment GO terms.
Data availability. The short-read sequence data by this study have been depositedinto the GenBank under the bioproject accession number PRJNA295802. The SRAaccession numbers are SRR5337182-SRR5337186, SRR5337192-SRR5337424. Allrelevant data contained within the paper are available from the correspondingauthor on request.
References1. Olsen, K. M. & Wendel, J. F. A bountiful harvest: genomic insights into crop
domestication phenotypes. Annu. Rev. Plant Biol. 64, 47–70 (2013).2. Meyer, R. S. & Purugganan, M. D. Evolution of crop species: genetics of
domestication and diversification. Nat. Rev. Genet. 14, 840–852 (2013).3. Ellstrand, N. C. et al. Crops gone wild: evolution of weeds and invasives from
domesticated ancestors. Evol. Appl. 3, 494–504 (2010).4. Gamborg, C., Gremmen, B., Christiansen, S. B. & Sandoe, P. De-domestication:
ethics at the intersection of landscape restoration and animal welfare. Environ.Values 19, 57–78 (2010).
5. Gressel, J. Crop ferality and volunteerism (CRC Press, 2005).6. Johnsson, M. et al. Feralisation targets different genomic loci to domestication
in the chicken. Nat. Commun 7, 12950 (2016).7. Vigueira, C. C., Olsen, K. M. & Caicedo, A. L. The red queen in the corn:
agricultural weeds as models of rapid adaptive evolution. Heredity 110,303–311 (2012).
8. Ishikawa, R. et al. Origin of weedy rice grown in Bhutan and the force ofgenetic diversity. Genet. Resour. Crop. Evol. 52, 395–403 (2005).
9. Reagon, M. et al. Genomic patterns of nucleotide diversity in divergentpopulations of US weedy rice. BMC Evol. Biol. 10, 180 (2010).
10. Sun, J. et al. Introgression and selection shaping the genome and adaptive lociof weedy rice in northern China. New Phytol. 197, 290–299 (2013).
11. Song, B. K., Chuah, T. S., Tam, S. M. & Olsen, K. M. Malaysian weedy riceshows its true stripes: wild Oryza and elite rice cultivars shape agricultural weedevolution in Southeast Asia. Mol. Ecol. 23, 5003–5017 (2014).
12. Qiu, J. et al. Genome re-sequencing suggested a weedy rice origin fromdomesticated indica-japonica hybridization: a case study from southern China.Planta 240, 1353–1363 (2014).
13. Zhang, J. et al. Cytoplasmic-genetic male sterility gene provides direct evidencefor some hybrid rice recently evolving into weedy rice. Sci. Rep. 5, 10591 (2015).
14. He, Q., Kim, K. & Park, Y. Population genomics identifies the origin andsignatures of selection of Korean weedy rice. Plant Biotechnol. J. 15, 357–366(2017).
15. Huang, X. et al. A map of rice genome variation reveals the origin of cultivatedrice. Nature 490, 497–501 (2012).
16. Xie, W. et al. Breeding signatures of rice improvement revealed by a genomicvariation map from a large germplasm collection. Proc. Natl Acad. Sci. USA112, E5411–E5419 (2015).
17. Yamamoto, E., Yonemaru, J., Yamamoto, T. & Yano, M. OGRO: the overviewof functionally characterized Genes in Rice online database. Rice 5, 26 (2012).
18. Delouche, J. C. & Labrada, R. Weedy rices: origin, biology, ecology and controlVol. 188 (Food & Agriculture Org., 2007).
19. Reagon, M., Thurber, C. S., Olsen, K. M., Jia, Y. & Caicedo, A. L. The long andthe short of it: SD1 polymorphism and the evolution of growth trait divergencein US weedy rice. Mol. Ecol. 20, 3743–3756 (2011).
20. Ziska, L. H. et al. Chapter Three-weedy (Red) rice: an emerging constraint toglobal rice production. Adv. Agron. 129, 181–228 (2015).
21. Qi, X. et al. More than one way to evolve a weed: parallel evolution of US weedyrice through independent genetic mechanisms. Mol. Ecol. 24, 3329–3344(2015).
22. Fuller, D. Q. et al. The domestication process and domestication rate in rice:spikelet bases from the Lower Yangtze. Science 323, 1607–1610 (2009).
23. Zheng, Y., Crawford, G. W., Jiang, L. & Chen, X. Rice domestication revealedby reduced shattering of archaeological rice from the lower yangtze valley. Sci.Rep. 6, 28136 (2016).
24. Browning, S. R. & Browning, B. L. Rapid and accurate haplotype phasing andmissing-data inference for whole-genome association studies by use of localizedhaplotype clustering. Am. J. Hum. Genet. 81, 1084–1097 (2007).
25. You, X. & Zeng, X. Chinese rice Cultural History P2 (Chinese Edition) (ShanghaiPeople’s Publishing House, 2010).
26. Lu, H. et al. Rice domestication and climatic change: phytolith evidence fromEast China. Boreas 31, 378–385 (2002).
27. Zhu, Q., Zheng, X., Luo, J., Gaut, B. S. & Ge, S. Multilocus analysis of nucleotidevariation of Oryza sativa and its wild relatives: severe bottleneck duringdomestication of rice. Mol. Biol. Evol. 24, 875–888 (2007).
28. Axelsson, E. et al. The genomic signature of dog domestication revealsadaptation to a starch-rich diet. Nature 495, 360–364 (2013).
29. Zhang, L. B. et al. Selection on grain shattering genes and rates of ricedomestication. New Phytol. 184, 708–720 (2009).
30. Ji, H. et al. Inactivation of the CTD phosphatase-like gene OsCPL1 enhancesthe development of the abscission layer and seed shattering in rice. Plant J. 61,96–106 (2010).
31. Sweeney, M. T., Thomson, M. J., Pfeil, B. E. & McCouch, S. Caught red-handed:Rc encodes a basic helix-loop-helix protein conditioning red pericarp in rice.Plant Cell 18, 283–294 (2006).
32. Kim, S. L., Lee, S., Kim, H. J., Nam, H. G. & An, G. OsMADS51 is a short-dayflowering promoter that functions upstream of Ehd1, OsMADS14, and Hd3a.Plant Physiol. 145, 1484–1494 (2007).
33. Gao, H. et al. Ehd4 encodes a novel and Oryza-genus-specific regulator ofphotoperiodic flowering in rice. PLoS Genet. 9, e1003281 (2013).
34. Nonomura, K. I. et al. The MSP1 gene is necessary to restrict the number ofcells entering into male and female sporogenesis and to initiate anther wallformation in rice. Plant Cell 15, 1728–1739 (2003).
35. Qi, Y. et al. Fine mapping and candidate gene analysis of the novelthermo-sensitive genic male sterility tms9-1 gene in rice. Theor. Appl. Genet.127, 1173–1182 (2014).
36. Qiu, S. et al. Repression of expression leads to root system growth suppressionin rice. Crop. Sci. 54, 2201–2213 (2014).
37. Xu, D. Q. et al. Overexpression of a TFIIIA-type zinc finger protein geneZFP252 enhances drought and salt tolerance in rice (Oryza sativa L.). FEBSLett. 582, 1037–1043 (2008).
38. Peng, X. et al. Constitutive expression of rice WRKY30 gene increases theendogenous jasmonic acid accumulation, PR gene expression and resistance tofungal pathogens in rice. Planta 236, 1485–1498 (2012).
39. Barrett, R. D. & Schluter, D. Adaptation from standing genetic variation. TrendsEcol. Evol. 23, 38–44 (2008).
40. Hermisson, J. & Pennings, P. S. Soft sweeps: molecular population genetics ofadaptation from standing genetic variation. Genetics 169, 2335–2352 (2005).
41. Fijarczyk, A. & Babik, W. Detecting balancing selection in genomes: limits andprospects. Mol. Ecol. 24, 3529–3545 (2015).
42. Craig, S. M., Reagon, M., Resnick, L. E. & Caicedo, A. L. Allele distributions athybrid incompatibility loci facilitate the potential for gene flow betweencultivated and weedy rice in the US. PLoS ONE 9, e86647 (2014).
43. Thurber, C. S., Reagon, M., Olsen, K. M., Jia, Y. L. & Caicedo, A. L. Theevolution of flowering strategies in Us weedy rice. Am. J. Bot. 101, 1737–1747(2014).
44. Parks, D. H. et al. GenGIS 2: geospatial analysis of traditional and geneticbiodiversity, with new gradient algorithms and an extensible plugin framework.PLoS ONE 8, 69885 (2013).
45. Patel, R. K. & Jain, M. NGS QC Toolkit: a toolkit for quality control of nextgeneration sequencing data. PloS ONE 7, e30619 (2012).
46. Langmead, B. & Salzberg, S. L. Fast gapped-read alignment with Bowtie 2. Nat.Methods 9, 357–359 (2012).
47. Li, H. et al. The sequence alignment/map format and SAMtools. Bioinformatics25, 2078–2079 (2009).
48. McKenna, A. et al. The Genome Analysis Toolkit: a MapReduce framework foranalyzing next-generation DNA sequencing data. Genome Res. 20, 1297–1303(2010).
49. Cingolani, P. et al. A program for annotating and predicting the effects of singlenucleotide polymorphisms, SnpEff: SNPs in the genome of Drosophilamelanogaster strain w1118; iso-2; iso-3. Fly 6, 80–92 (2012).
50. Price, M. N., Dehal, P. S. & Arkin, A. P. FastTree: computing large minimumevolution trees with profiles instead of a distance matrix. Mol. Biol. Evol. 26,1641–1650 (2009).
51. Tamura, K. et al. MEGA5: molecular evolutionary genetics analysis usingmaximum likelihood, evolutionary distance, and maximum parsimonymethods. Mol. Biol. Evol. 28, 2731–2739 (2011).
52. Zheng, X. et al. A high-performance computing toolset for relatedness andprincipal component analysis of SNP data. Bioinformatics 28, 3326–3328 (2012).
53. Gutenkunst, R. N., Hernandez, R. D., Williamson, S. H. & Bustamante, C. D.Inferring the joint demographic history of multiple populations frommultidimensional SNP frequency data. PLoS Genet. 5, e1000695 (2009).
54. Caicedo, A. L. et al. Genome-wide patterns of nucleotide polymorphism indomesticated rice. PLoS Genet. 3, 1745–1756 (2007).
55. Molina, J. et al. Molecular evidence for a single evolutionary origin ofdomesticated rice. Proc. Natl Acad. Sci. USA 108, 8351–8356 (2011).
56. Danecek, P. et al. The variant call format and VCFtools. Bioinformatics 27,2156–2158 (2011).
57. Krzywinski, M. et al. Circos: an information aesthetic for comparativegenomics. Genome Res. 19, 1639–1645 (2009).
58. Pfeifer, B., Wittelsburger, U., Ramos-Onsins, S. E. & Lercher, M. J. PopGenome:an efficient Swiss army knife for population genomic analyses in R. Mol. Biol.Evol. 31, 1929–1936 (2014).
NATURE COMMUNICATIONS | DOI: 10.1038/ncomms15323 ARTICLE
NATURE COMMUNICATIONS | 8:15323 | DOI: 10.1038/ncomms15323 | www.nature.com/naturecommunications 11
59. Librado, P. & Rozas, J. DnaSP v5: a software for comprehensive analysis ofDNA polymorphism data. Bioinformatics 25, 1451–1452 (2009).
60. Du, Z., Zhou, X., Ling, Y., Zhang, Z. & Su, Z. agriGO: a GO analysistoolkit for the agricultural community. Nucleic Acids Res. 38, W64–W70(2010).
AcknowledgementsThis work was financially supported in part by grants from the China AgricultureResearch System (CARS-01-02A), National Science Foundation of China (91435111) andJiangsu Collaborative Innovation Center for Modern Crop Production (JCIC-MCP). Wealso acknowledge funding support from Rice Pest Management Research Group of theAgricultural Science and Technology Innovation Program of China Academy of Agri-cultural Science. MPT and WY were supported by funds from the NSF IOS-1213059. Wethank Prof Yunfei Zheng (Zhejiang Provincial Institute of Cultural Relics and Archae-ology) and Doc. Yan Pan (University of Fudan) for providing information about therelationship between spikelet bases and seed shattering. We also thank Prof Douglas R.Taylor (University of Virginia) for his insightful suggestions on how to improve thispaper. We gratefully acknowledge the support of the IBM high performance computingcluster of Analysis Center of Agrobiology and Environmental Sciences, ZhejiangUniversity.
Author contributionsL.F. and Y.L. managed and organized the project. J.Q., L.M., Y.Y., W.W., T.Q., S.W.,M.H.S., Y.-N.C., Y.W. and L.F. performed the bioinformatic analyses. Y.Z., J.Z. andF.F. collected the samples and carried out the phenotypic analyses. Y.F.W. and F.Q.
performed the DNA sequencing. S.G., C.Y. and Y.L. gave insightful suggestions andcomments on the manuscript. J.Q., L.F. and M.P.T. wrote the manuscript.
Additional informationSupplementary Information accompanies this paper at http://www.nature.com/naturecommunications
Competing interests: The authors declare no competing financial interests.
Reprints and permission information is available online at http://npg.nature.com/reprintsandpermissions/
How to cite this article: Qiu, J. et al. Genomic variation associated withlocal adaptation of weedy rice during de-domestication. Nat. Commun. 8, 15323doi: 10.1038/ncomms15323 (2017).
Publisher’s note: Springer Nature remains neutral with regard to jurisdictional claims inpublished maps and institutional affiliations.
This work is licensed under a Creative Commons Attribution 4.0International License. The images or other third party material in this
article are included in the article’s Creative Commons license, unless indicated otherwisein the credit line; if the material is not included under the Creative Commons license,users will need to obtain permission from the license holder to reproduce the material.To view a copy of this license, visit http://creativecommons.org/licenses/by/4.0/
r The Author(s) 2017
ARTICLE NATURE COMMUNICATIONS | DOI: 10.1038/ncomms15323
12 NATURE COMMUNICATIONS | 8:15323 | DOI: 10.1038/ncomms15323 | www.nature.com/naturecommunications