Embed Size (px)
Citation preview
QTL-IM, AM & GS FOR MOLECULAR
BREEDING: AN APPRAISAL
P K Gupta
CCS University, Meerut, India
To use any of the contents in this presentation
please contact the author
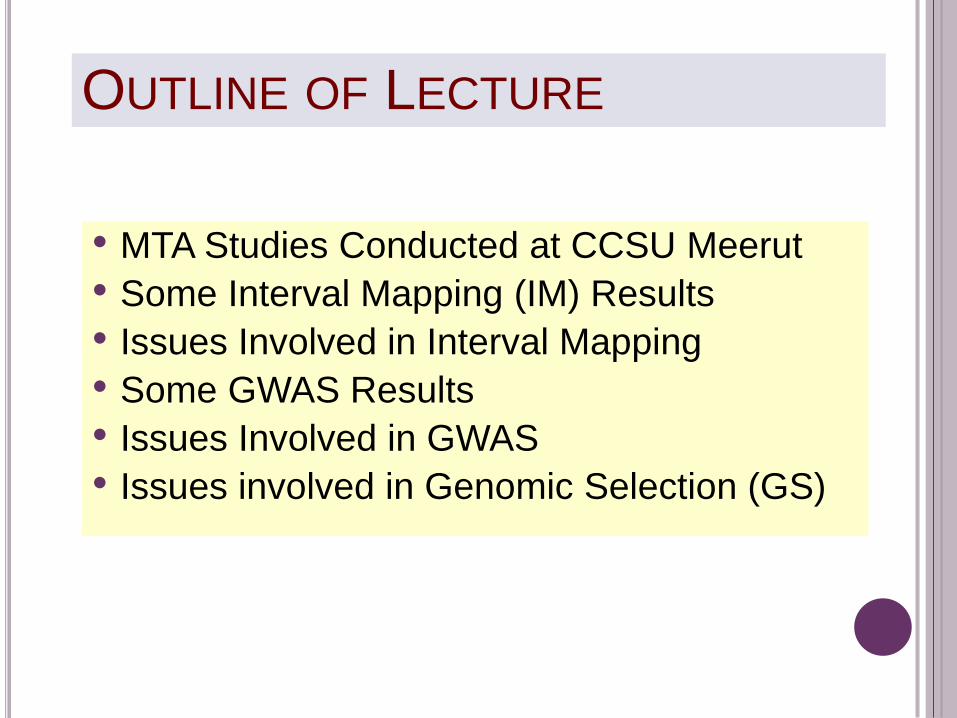
OUTLINE OF LECTURE
• MTA Studies Conducted at CCSU Meerut
• Some Interval Mapping (IM) Results
• Issues Involved in Interval Mapping
• Some GWAS Results
• Issues Involved in GWAS
• Issues involved in Genomic Selection (GS)
MARKER-TRAIT ASSOCIATION (MTA)
STUDIES IN WHEAT AT CCSU, MEERUT
BSA; Chi-square test; t-test, etc. (1999-2003)
QTL Interval Mapping (2003-Contd.)
Association Mapping (2004-Contd)
During this process, lessons were learnt; experimental
designs and methods of analysis were modified to
improve precision of detecting MTAs.
MAS studies were also conducted for PHST and GPC
& published (Plant Breeding, and Field Crops Res)
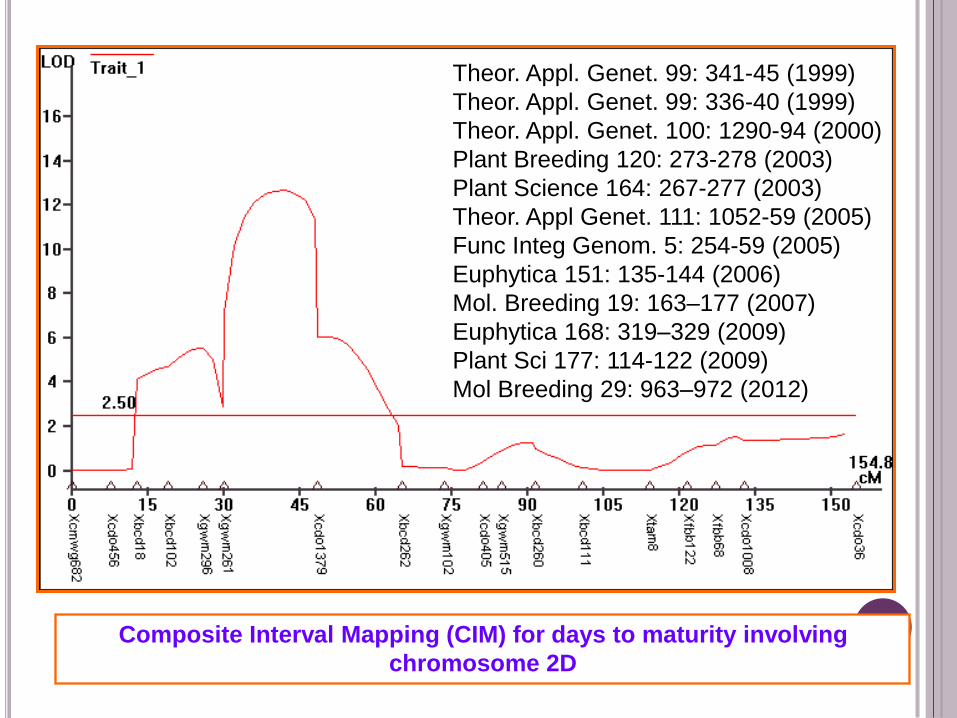
Composite Interval Mapping (CIM) for days to maturity involving
chromosome 2D
Theor. Appl. Genet. 99: 341-45 (1999)
Theor. Appl. Genet. 99: 336-40 (1999)
Theor. Appl. Genet. 100: 1290-94 (2000)
Plant Breeding 120: 273-278 (2003)
Plant Science 164: 267-277 (2003)
Theor. Appl Genet. 111: 1052-59 (2005)
Func Integ Genom. 5: 254-59 (2005)
Euphytica 151: 135-144 (2006)
Mol. Breeding 19: 163–177 (2007)
Euphytica 168: 319–329 (2009)
Plant Sci 177: 114-122 (2009)
Mol Breeding 29: 963–972 (2012)
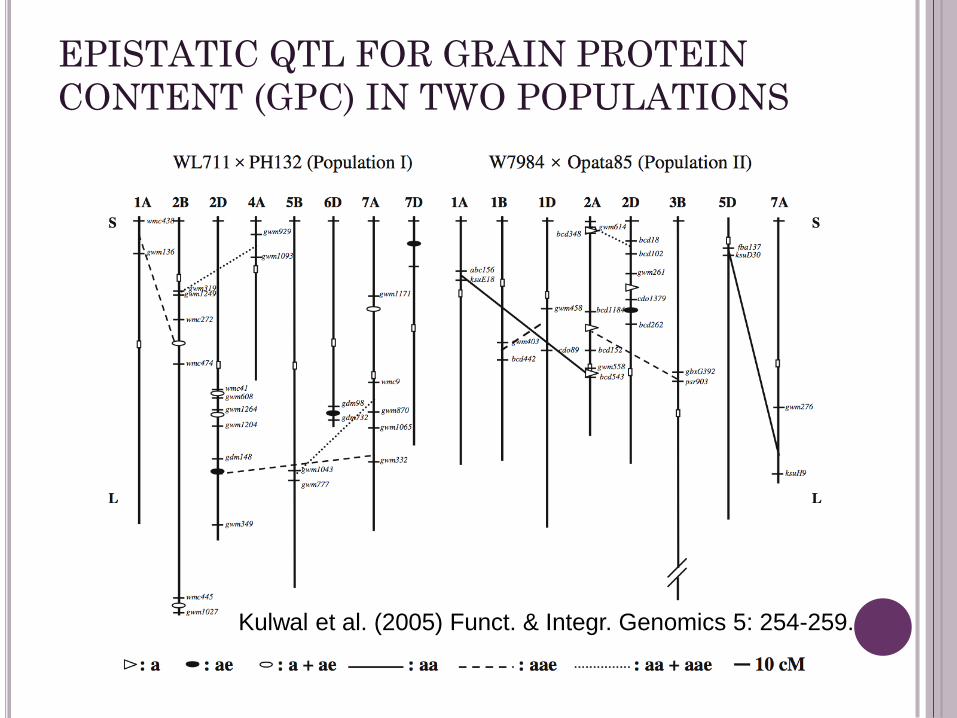
EPISTATIC QTL FOR GRAIN PROTEIN
CONTENT (GPC) IN TWO POPULATIONS
Kulwal et al. (2005) Funct. & Integr. Genomics 5: 254-259.
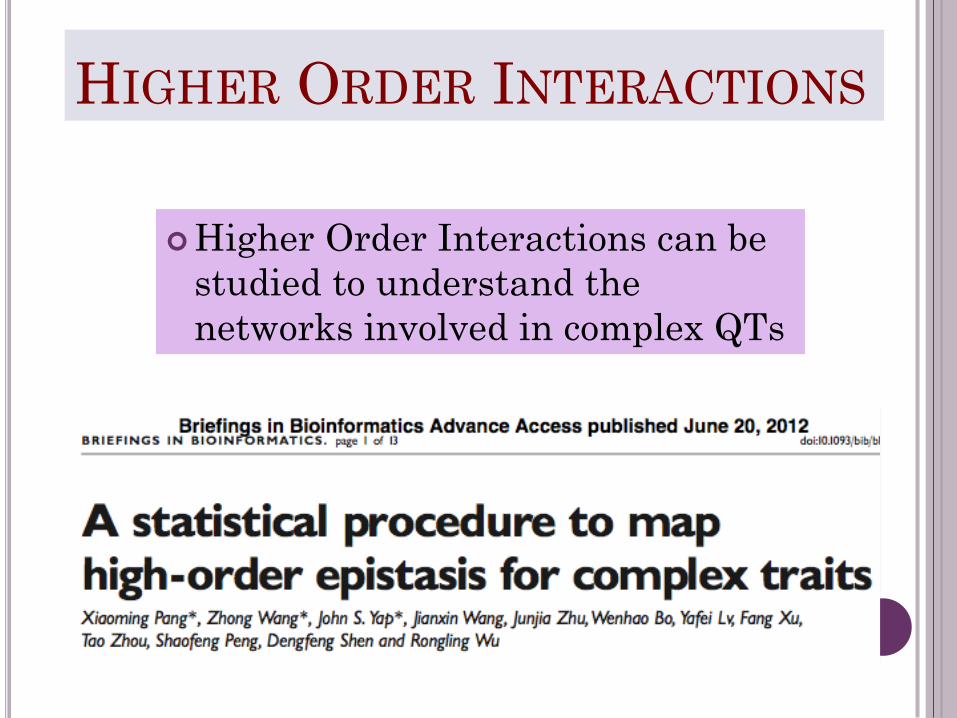
HIGHER ORDER INTERACTIONS
Higher Order Interactions can be
studied to understand the
networks involved in complex QTs
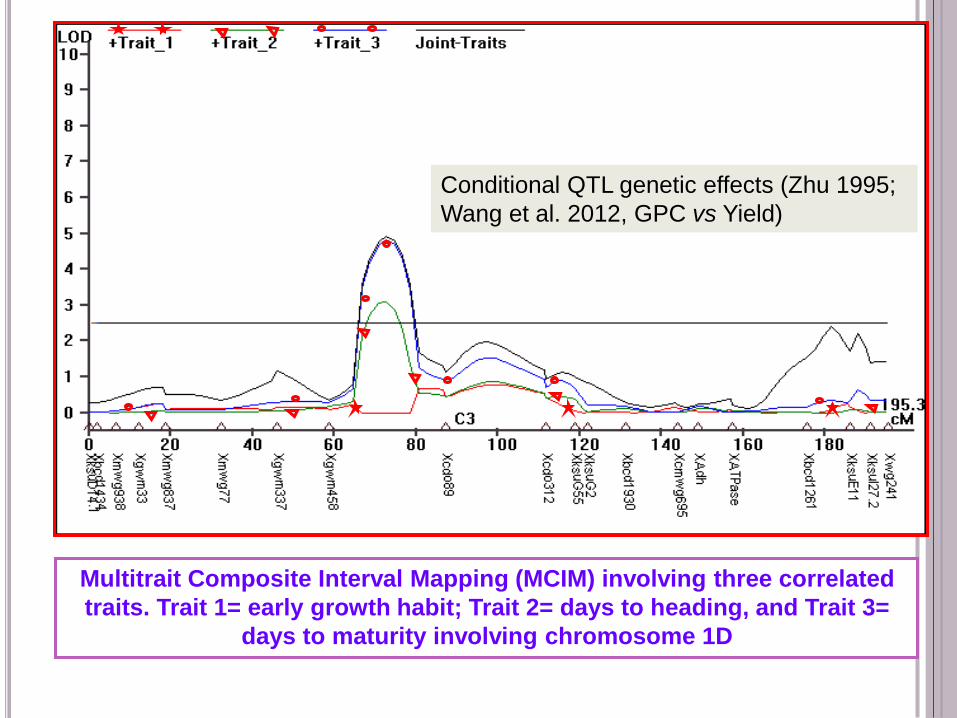
Multitrait Composite Interval Mapping (MCIM) involving three correlated
traits. Trait 1= early growth habit; Trait 2= days to heading, and Trait 3=
days to maturity involving chromosome 1D
Conditional QTL genetic effects (Zhu 1995;
Wang et al. 2012, GPC vs Yield)
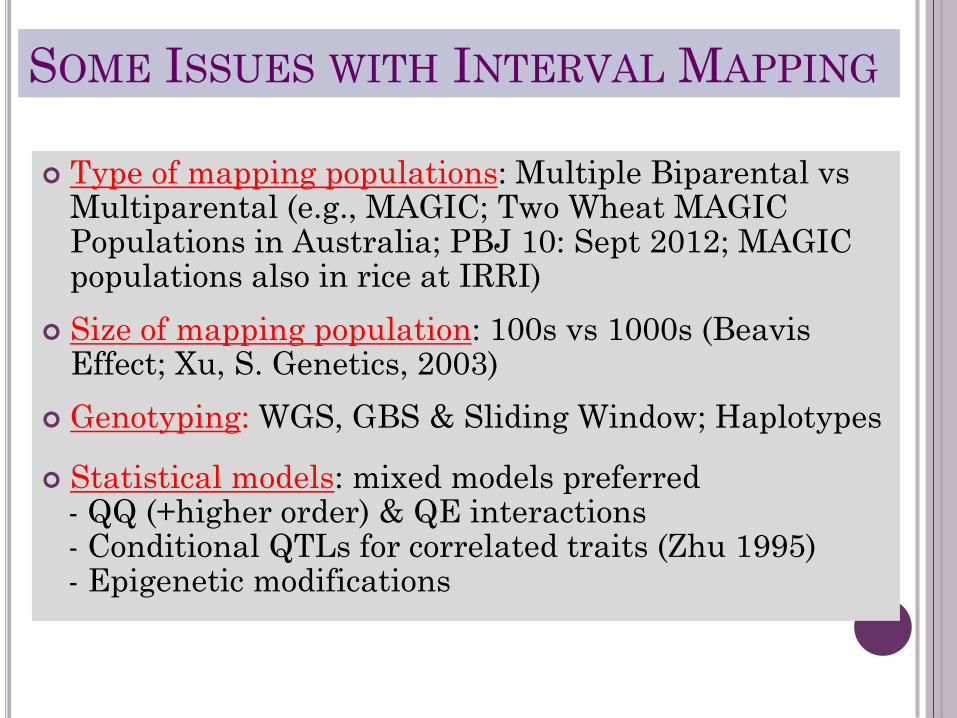
SOME ISSUES WITH INTERVAL MAPPING
Type of mapping populations: Multiple Biparental vs Multiparental (e.g., MAGIC; Two Wheat MAGIC Populations in Australia; PBJ 10: Sept 2012; MAGIC populations also in rice at IRRI)
Size of mapping population: 100s vs 1000s (Beavis Effect; Xu, S. Genetics, 2003)
Genotyping: WGS, GBS & Sliding Window; Haplotypes
Statistical models: mixed models preferred - QQ (+higher order) & QE interactions - Conditional QTLs for correlated traits (Zhu 1995) - Epigenetic modifications
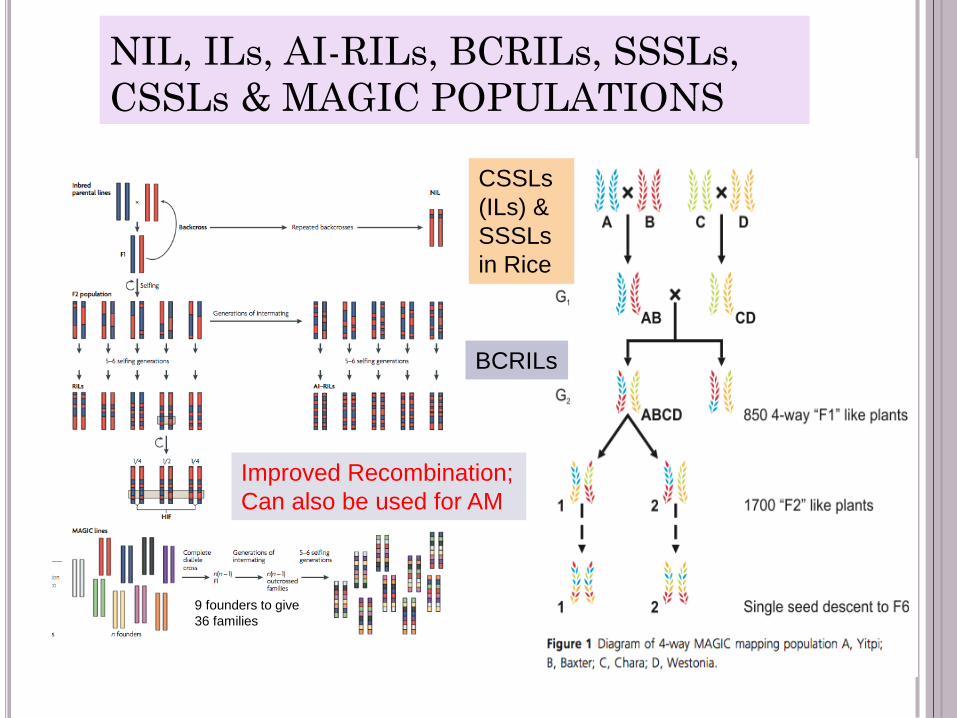
NIL, ILs, AI-RILs, BCRILs, SSSLs,
CSSLs & MAGIC POPULATIONS
Improved Recombination;
Can also be used for AM
CSSLs
(ILs) &
SSSLs
in Rice
9 founders to give
36 families
BCRILs
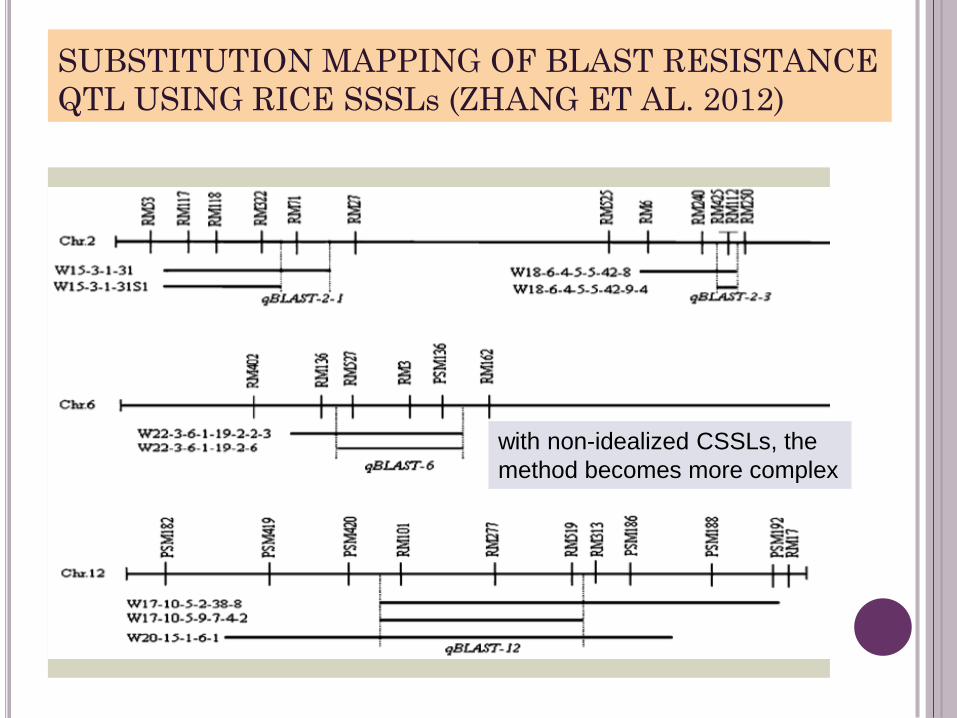
SUBSTITUTION MAPPING OF BLAST RESISTANCE
QTL USING RICE SSSLs (ZHANG ET AL. 2012)
with non-idealized CSSLs, the
method becomes more complex
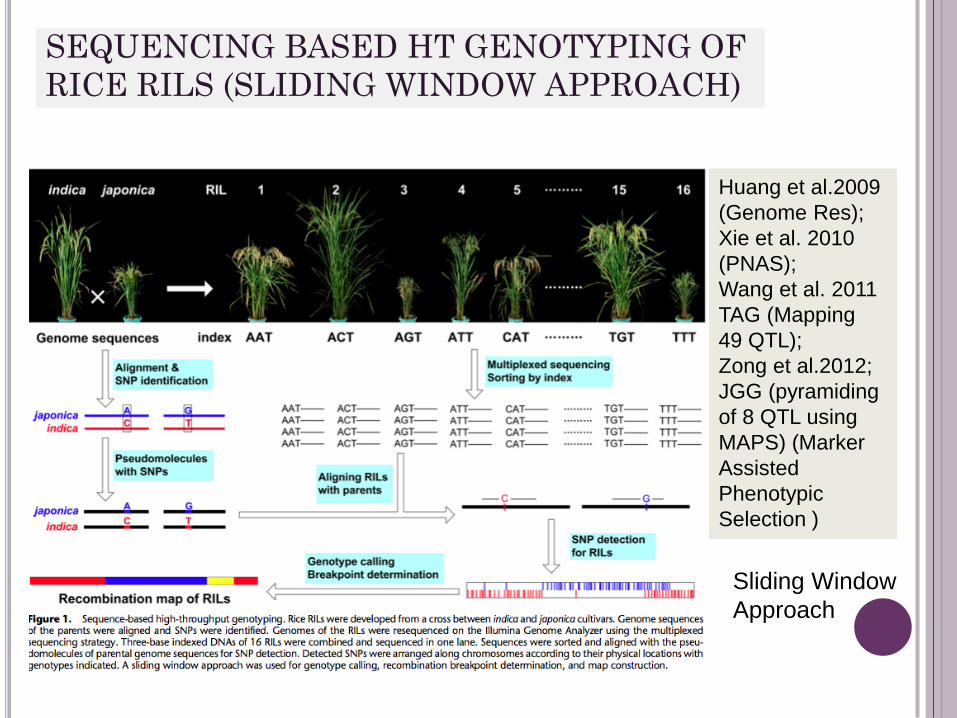
SEQUENCING BASED HT GENOTYPING OF
RICE RILS (SLIDING WINDOW APPROACH)
Huang et al.2009
(Genome Res);
Xie et al. 2010
(PNAS);
Wang et al. 2011
TAG (Mapping
49 QTL);
Zong et al.2012;
JGG (pyramiding
of 8 QTL using
MAPS) (Marker
Assisted
Phenotypic
Selection )
Sliding Window
Approach
Genotyping Using NGS
(QTL Interval & Assoc Mapping)
Recombination Bins as Markers Rice 150 RILs Sequenced (bar-coding &
multiplexing)using Illumina: Recombination Bins
Identified using Sliding Window Approach were used as
Markers: Huang et al, 2009; Xie et al., 2010; Wang et
al., 2011)
Genotyping by Sequencing (GBS) Bar-coded multiplexing for genotyping (GBS)
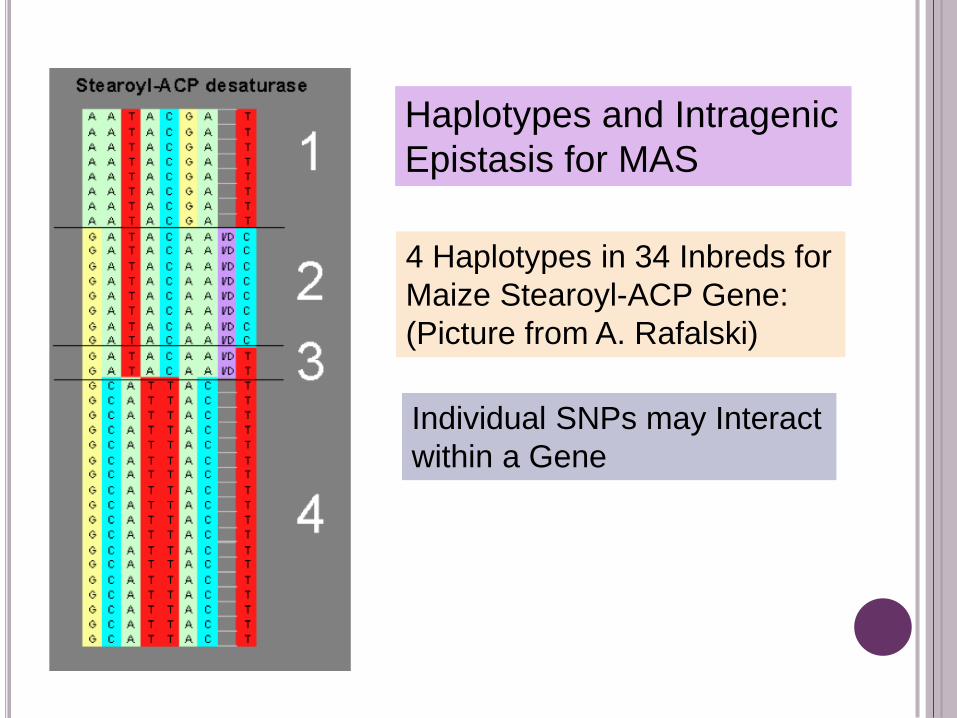
4 Haplotypes in 34 Inbreds for
Maize Stearoyl-ACP Gene:
(Picture from A. Rafalski)
Haplotypes and Intragenic
Epistasis for MAS
Individual SNPs may Interact
within a Gene
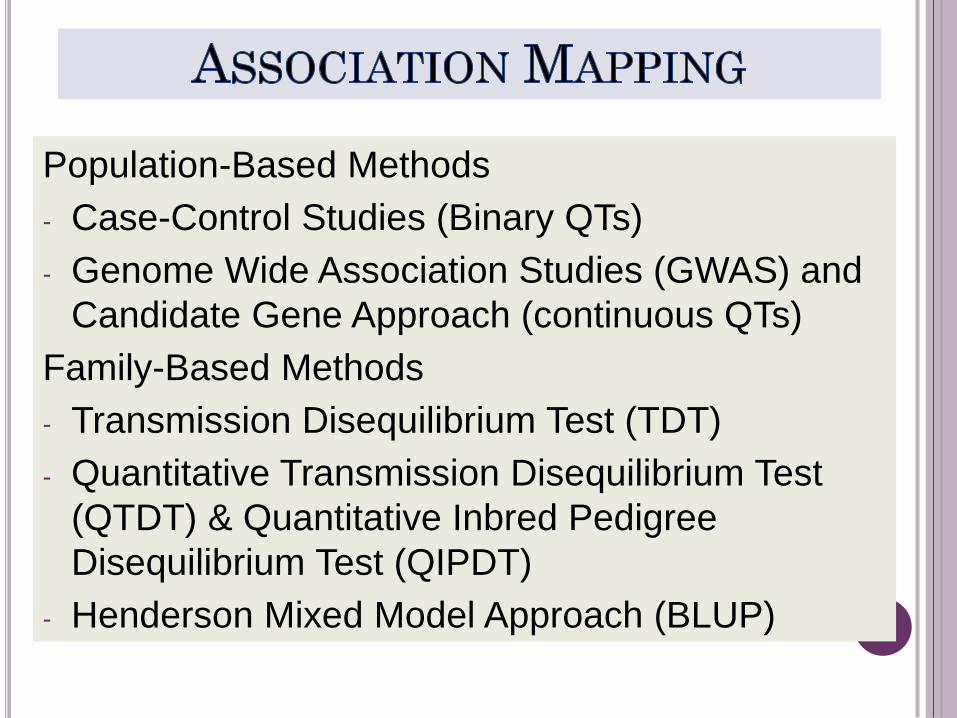
Population-Based Methods
- Case-Control Studies (Binary QTs)
- Genome Wide Association Studies (GWAS) and
Candidate Gene Approach (continuous QTs)
Family-Based Methods
- Transmission Disequilibrium Test (TDT)
- Quantitative Transmission Disequilibrium Test
(QTDT) & Quantitative Inbred Pedigree
Disequilibrium Test (QIPDT)
- Henderson Mixed Model Approach (BLUP)
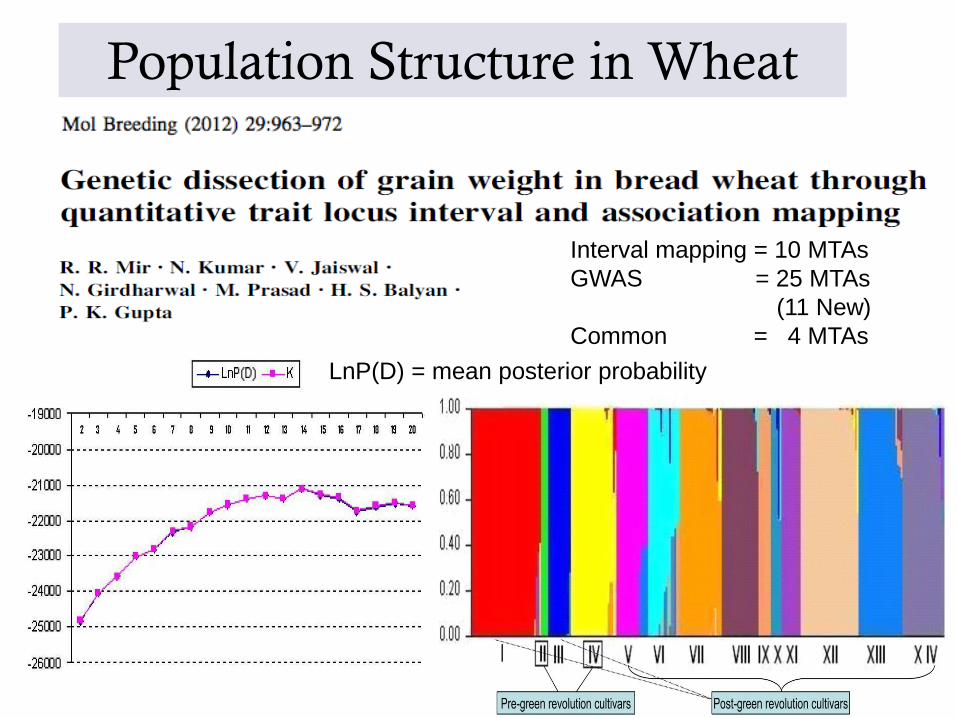
Population Structure in Wheat
LnP(D) = mean posterior probability
Interval mapping = 10 MTAs
GWAS = 25 MTAs
(11 New)
Common = 4 MTAs
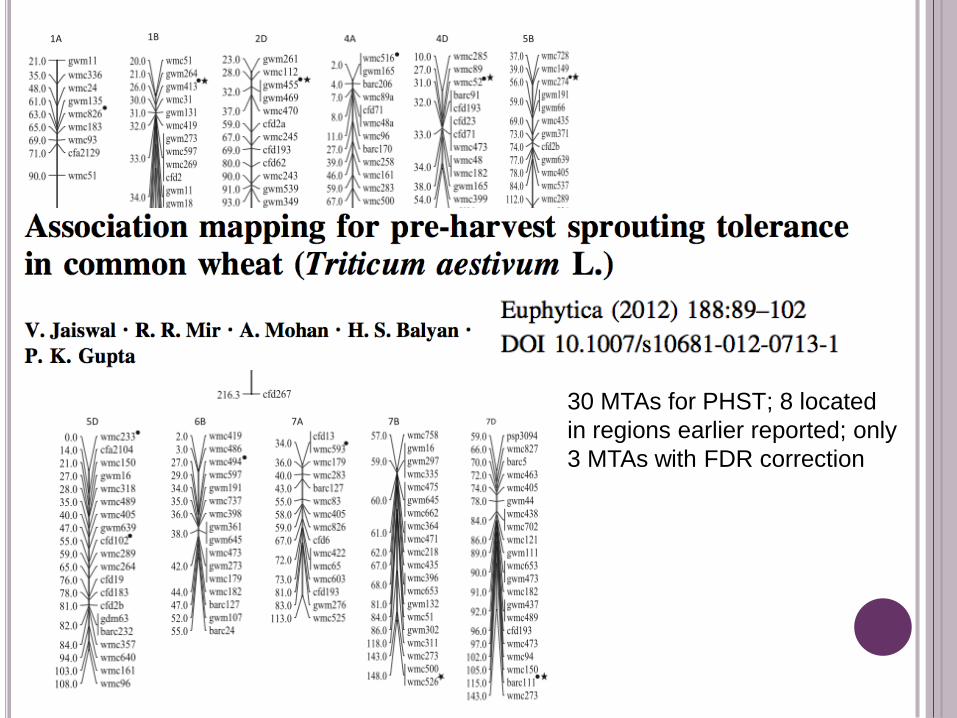
30 MTAs for PHST; 8 located
in regions earlier reported; only
3 MTAs with FDR correction
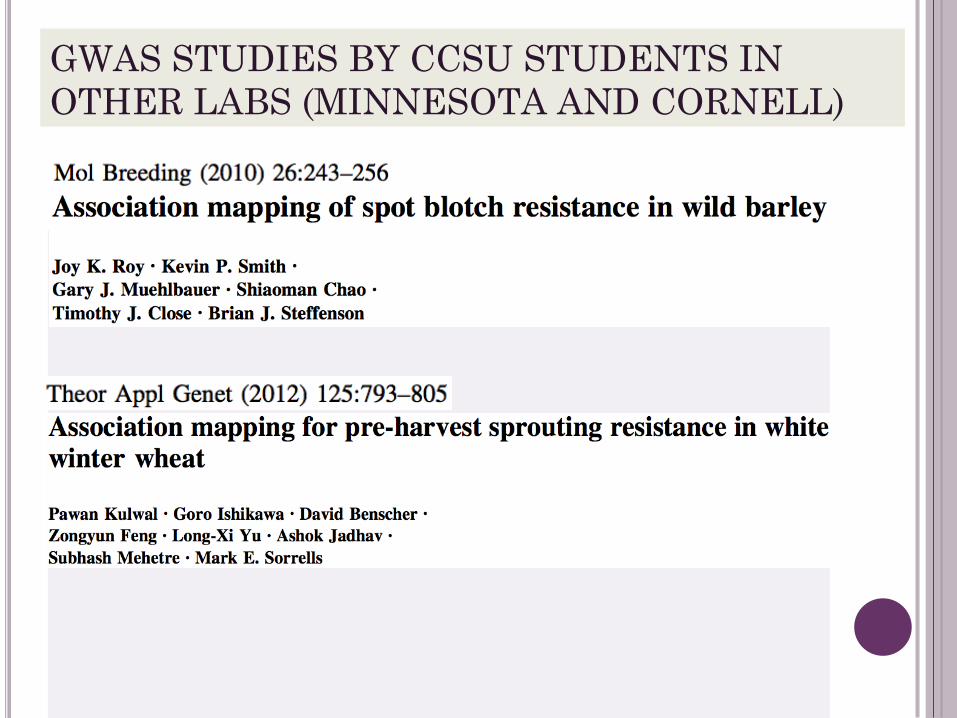
GWAS STUDIES BY CCSU STUDENTS IN
OTHER LABS (MINNESOTA AND CORNELL)
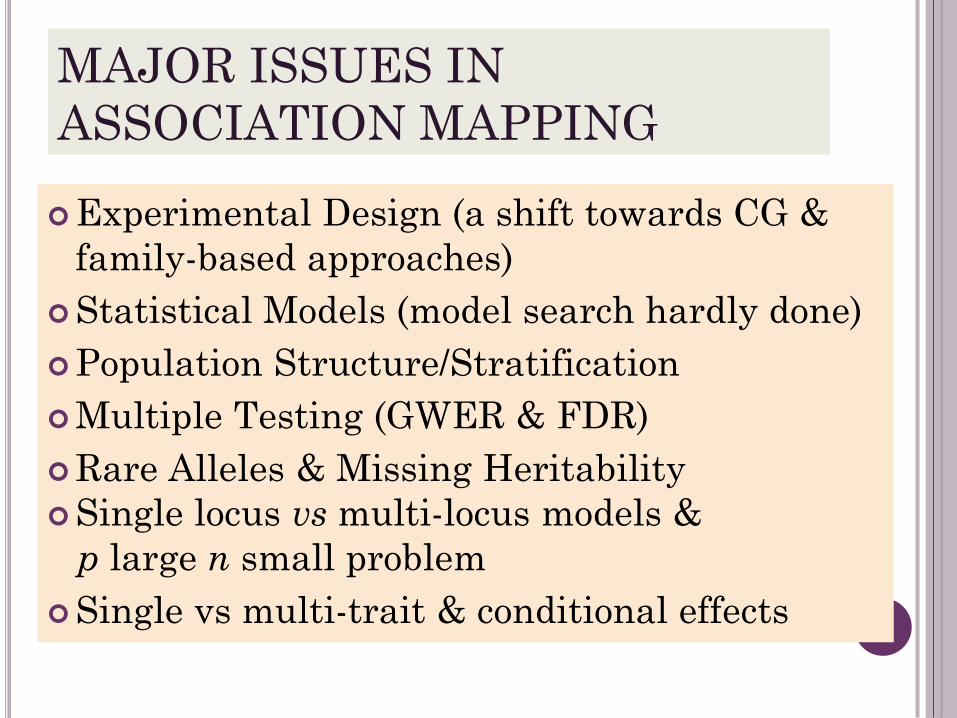
MAJOR ISSUES IN
ASSOCIATION MAPPING
Experimental Design (a shift towards CG &
family-based approaches)
Statistical Models (model search hardly done)
Population Structure/Stratification
Multiple Testing (GWER & FDR)
Rare Alleles & Missing Heritability
Single locus vs multi-locus models &
p large n small problem
Single vs multi-trait & conditional effects
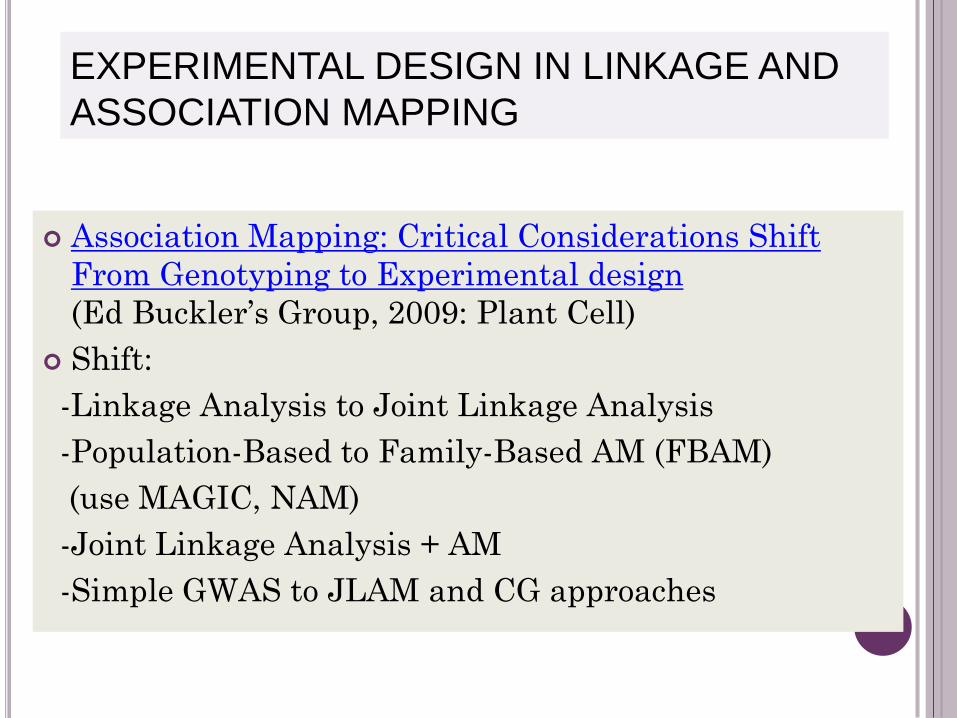
EXPERIMENTAL DESIGN IN LINKAGE AND
ASSOCIATION MAPPING
Association Mapping: Critical Considerations Shift
From Genotyping to Experimental design
(Ed Buckler’s Group, 2009: Plant Cell)
Shift:
-Linkage Analysis to Joint Linkage Analysis
-Population-Based to Family-Based AM (FBAM)
(use MAGIC, NAM)
-Joint Linkage Analysis + AM
-Simple GWAS to JLAM and CG approaches
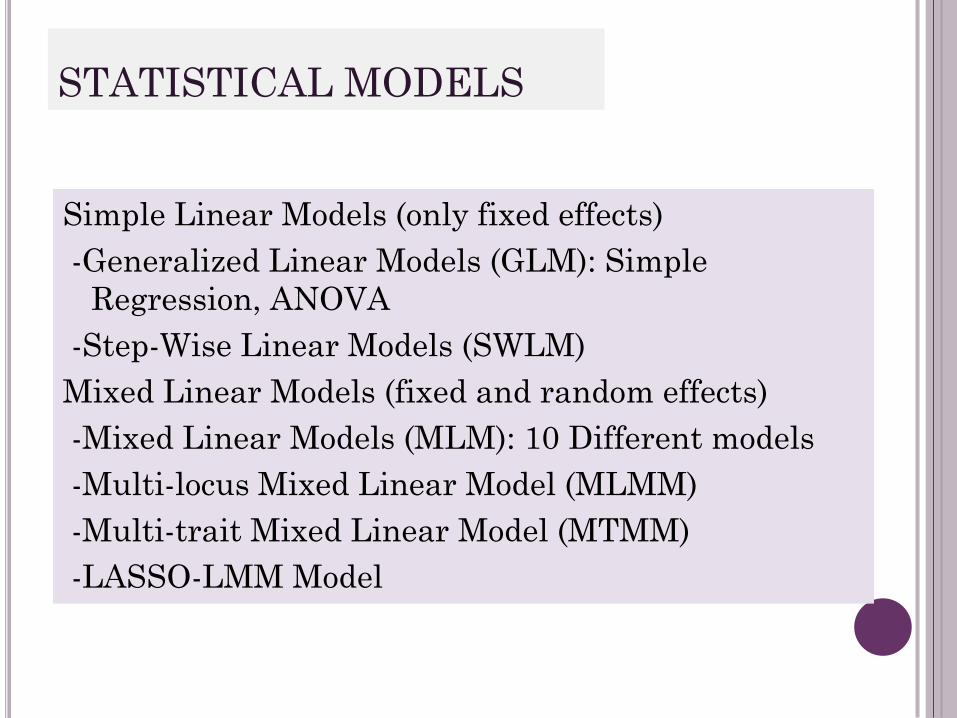
STATISTICAL MODELS
Simple Linear Models (only fixed effects)
-Generalized Linear Models (GLM): Simple
Regression, ANOVA
-Step-Wise Linear Models (SWLM)
Mixed Linear Models (fixed and random effects)
-Mixed Linear Models (MLM): 10 Different models
-Multi-locus Mixed Linear Model (MLMM)
-Multi-trait Mixed Linear Model (MTMM)
-LASSO-LMM Model
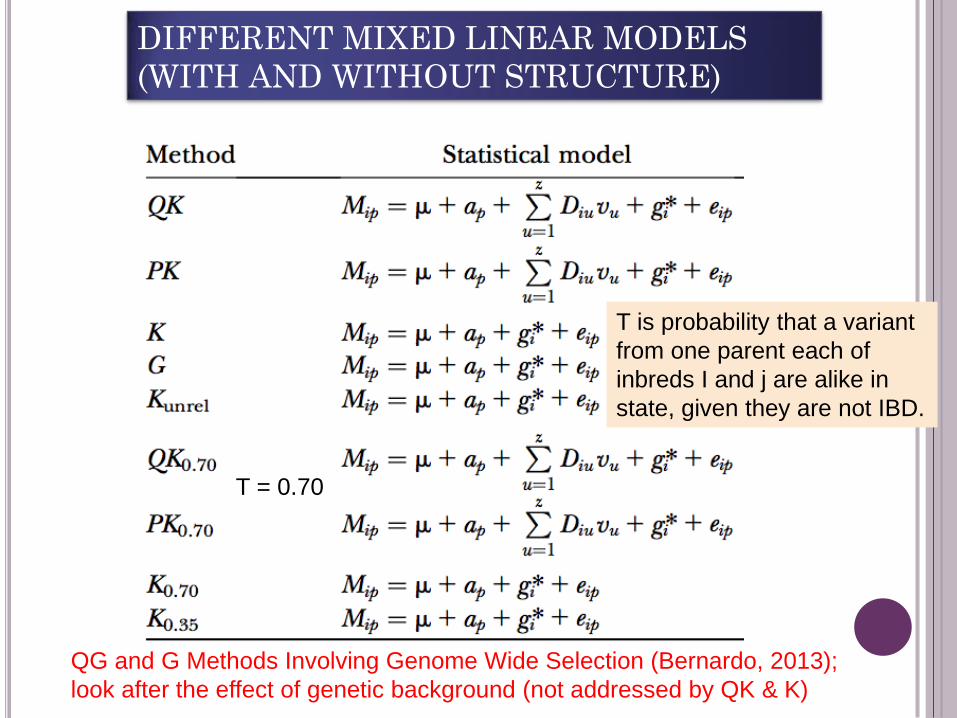
DIFFERENT MIXED LINEAR MODELS
(WITH AND WITHOUT STRUCTURE)
QG and G Methods Involving Genome Wide Selection (Bernardo, 2013);
look after the effect of genetic background (not addressed by QK & K)
T is probability that a variant
from one parent each of
inbreds I and j are alike in
state, given they are not IBD.
T = 0.70
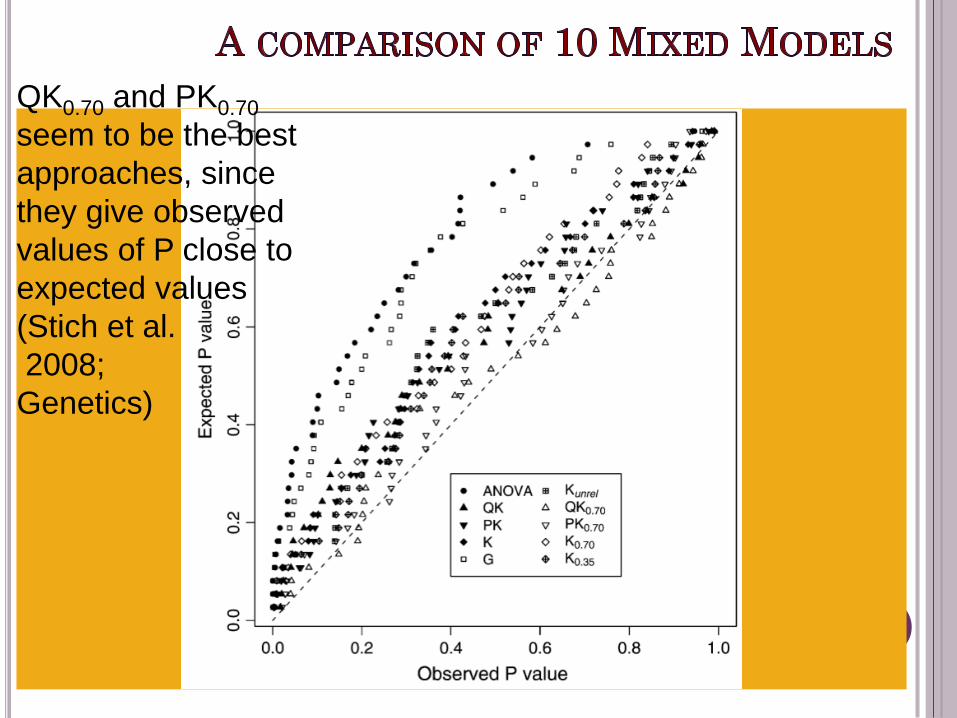
QK0.70 and PK0.70
seem to be the best
approaches, since
they give observed
values of P close to
expected values
(Stich et al.
2008;
Genetics)
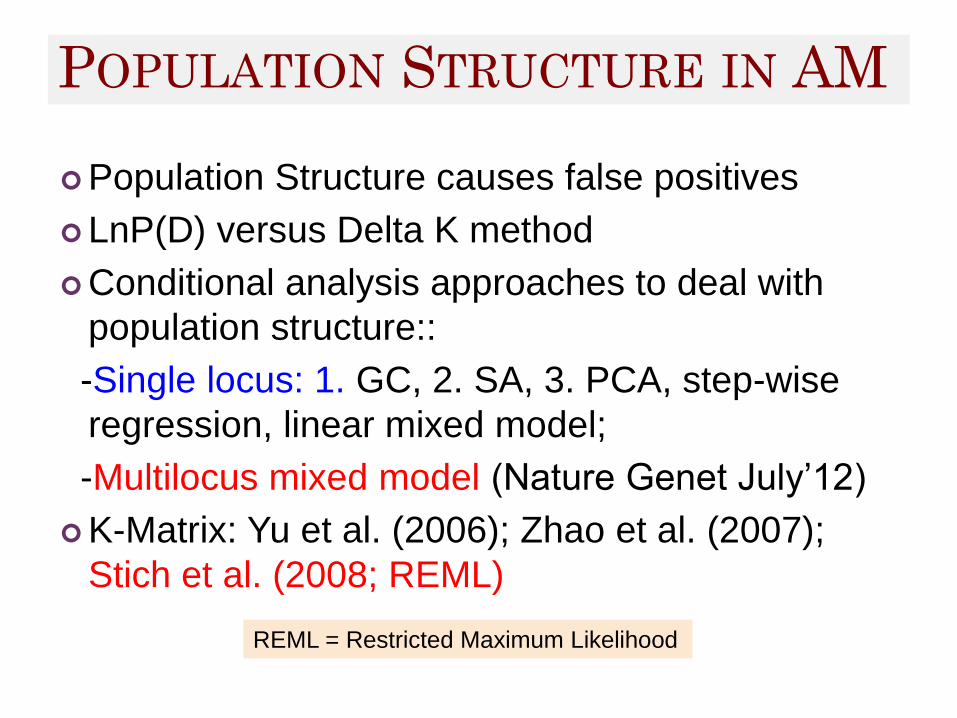
POPULATION STRUCTURE IN AM
Population Structure causes false positives
LnP(D) versus Delta K method
Conditional analysis approaches to deal with
population structure::
-Single locus: 1. GC, 2. SA, 3. PCA, step-wise
regression, linear mixed model;
-Multilocus mixed model (Nature Genet July’12)
K-Matrix: Yu et al. (2006); Zhao et al. (2007);
Stich et al. (2008; REML)
REML = Restricted Maximum Likelihood
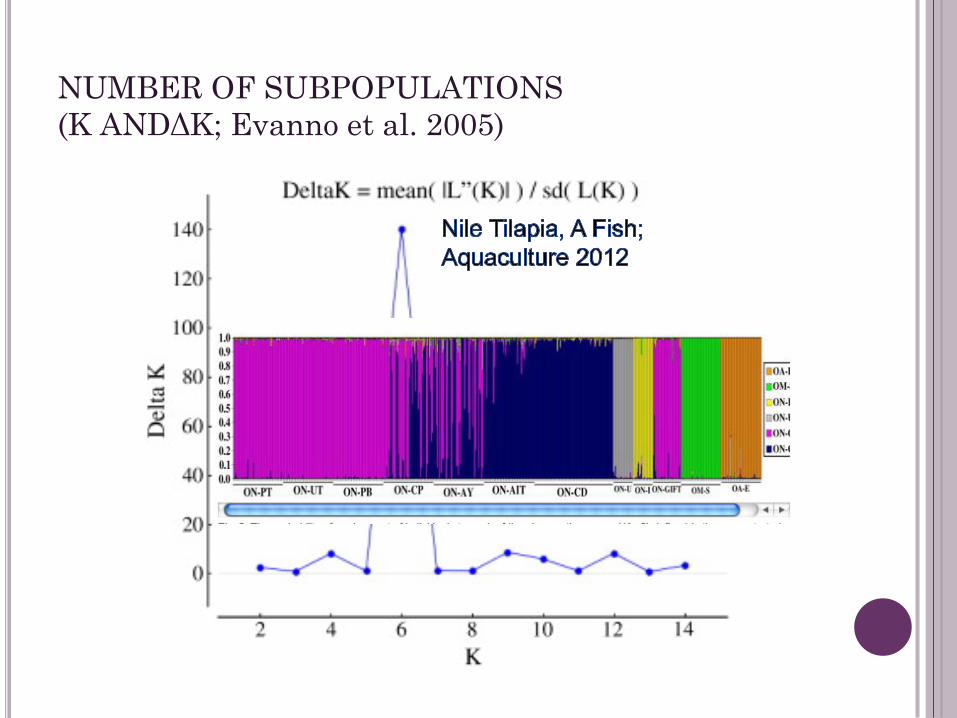
NUMBER OF SUBPOPULATIONS
(K ANDΔK; Evanno et al. 2005)
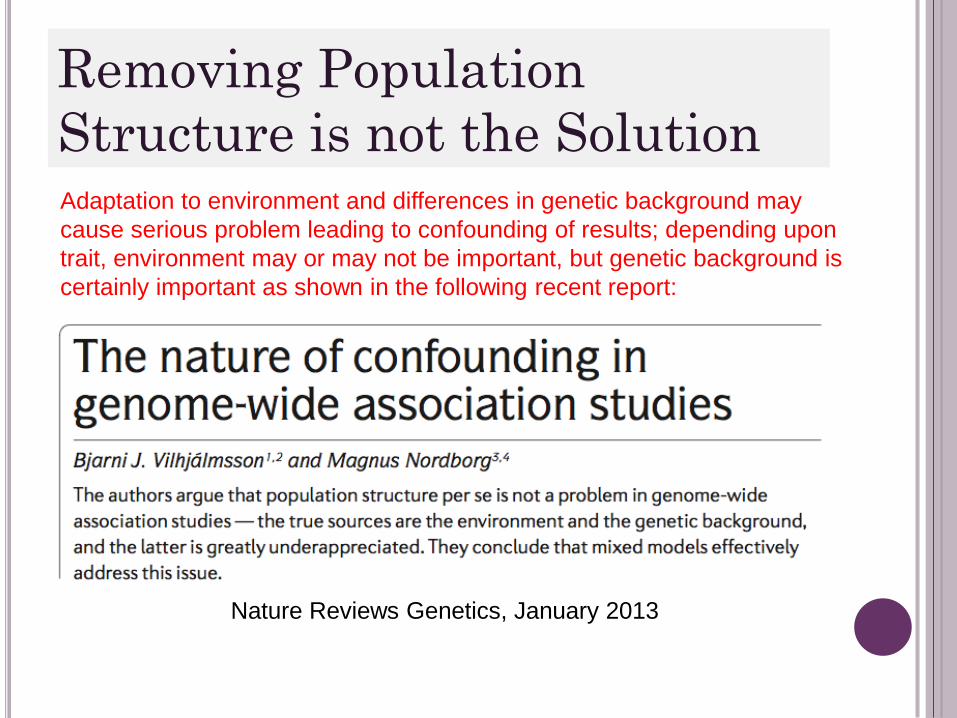
Removing Population
Structure is not the Solution
Nature Reviews Genetics, January 2013
Adaptation to environment and differences in genetic background may
cause serious problem leading to confounding of results; depending upon
trait, environment may or may not be important, but genetic background is
certainly important as shown in the following recent report:
PROBLEM OF COMPUTATIONAL DEMAND
Computing time in MLM increases as n3 so that with
increase in number of genotypes, which is desirable,
computation demands becomes a bottleneck
Efficient mixed model association (EMMA) improves
computation speed; but this method also becomes
impractical with increased number of data points
A number of other improved methods include
GRAMMAR, EMMAX, P3D, CMLM & GEMMA
Compressed MLM (CMLM) clusters individuals into
fewer groups on the basis of kinship, thus reducing
the computation work
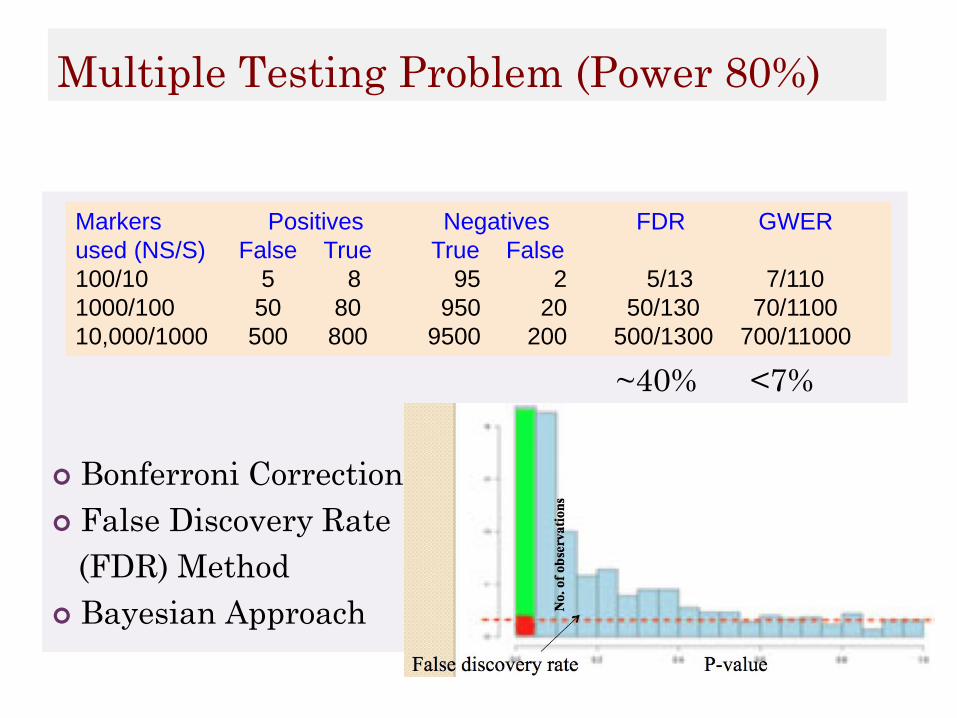
Multiple Testing Problem (Power 80%)
~40% <7%
Bonferroni Corrections
False Discovery Rate
(FDR) Method
Bayesian Approach
Markers Positives Negatives FDR GWER
used (NS/S) False True True False
100/10 5 8 95 2 5/13 7/110
1000/100 50 80 950 20 50/130 70/1100
10,000/1000 500 800 9500 200 500/1300 700/11000
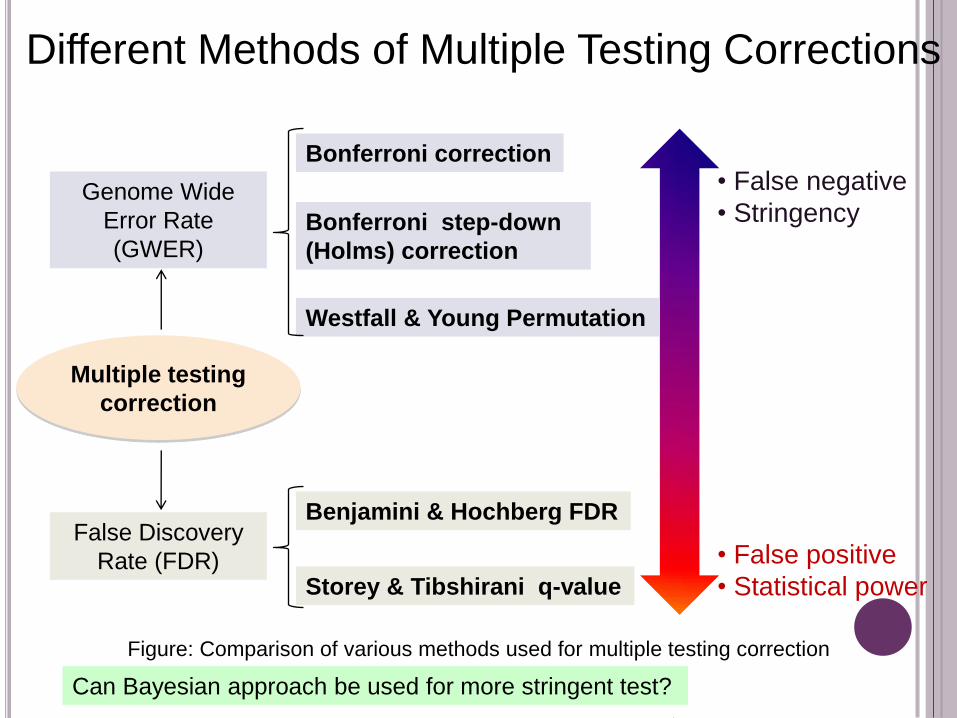
Bonferroni correction
Bonferroni step-down
(Holms) correction
Westfall & Young Permutation
Genome Wide
Error Rate
(GWER)
Benjamini & Hochberg FDR
Storey & Tibshirani q-value
False Discovery
Rate (FDR)
• False negative
• Stringency
• False positive
• Statistical power
Multiple testing
correction
Figure: Comparison of various methods used for multiple testing correction
Different Methods of Multiple Testing Corrections
Can Bayesian approach be used for more stringent test?
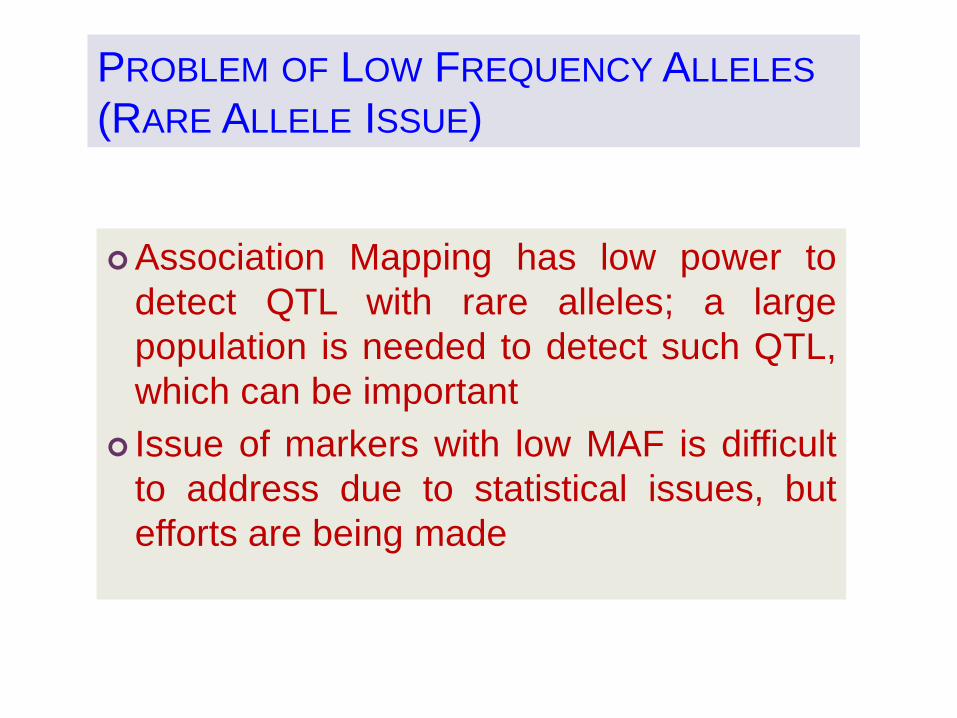
PROBLEM OF LOW FREQUENCY ALLELES
(RARE ALLELE ISSUE)
Association Mapping has low power to
detect QTL with rare alleles; a large
population is needed to detect such QTL,
which can be important
Issue of markers with low MAF is difficult
to address due to statistical issues, but
efforts are being made
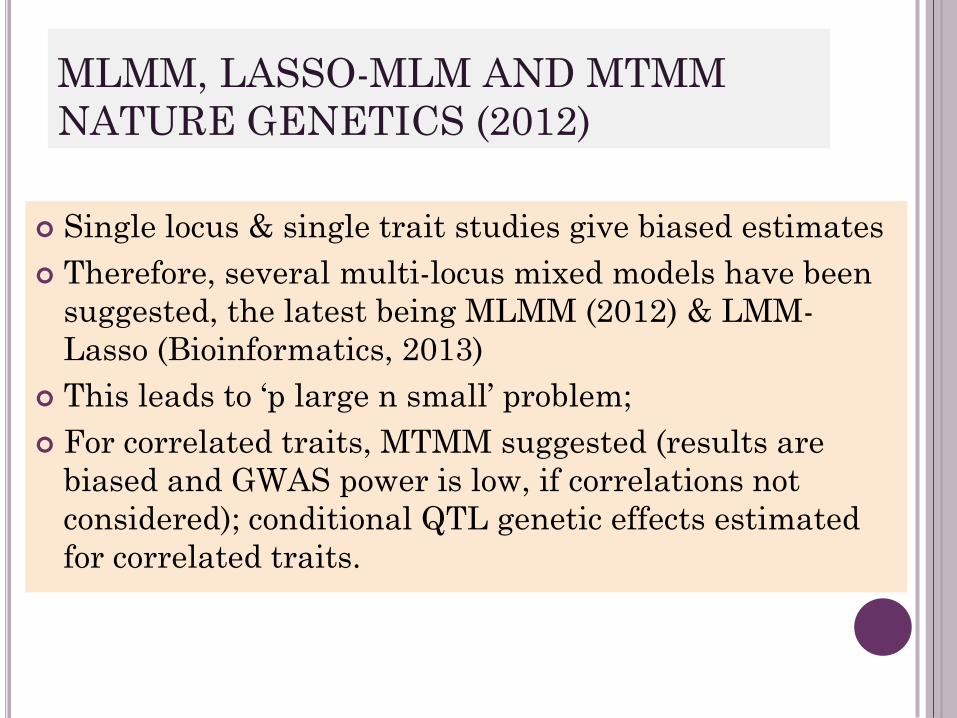
MLMM, LASSO-MLM AND MTMM
NATURE GENETICS (2012)
Single locus & single trait studies give biased estimates
Therefore, several multi-locus mixed models have been
suggested, the latest being MLMM (2012) & LMM-
Lasso (Bioinformatics, 2013)
This leads to ‘p large n small’ problem;
For correlated traits, MTMM suggested (results are
biased and GWAS power is low, if correlations not
considered); conditional QTL genetic effects estimated
for correlated traits.
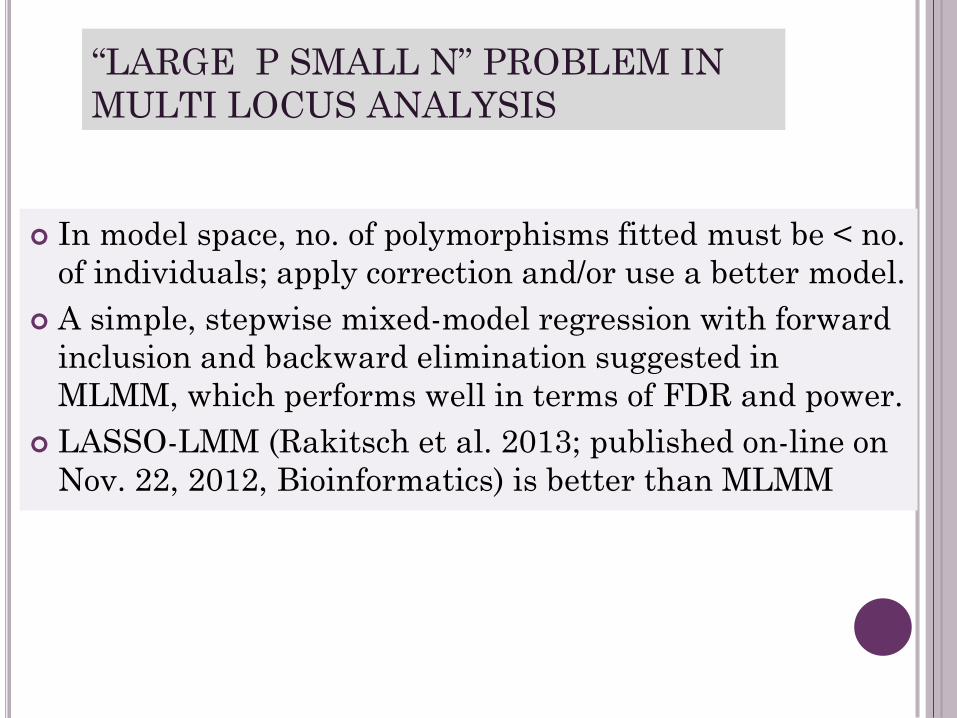
“LARGE P SMALL N” PROBLEM IN
MULTI LOCUS ANALYSIS
In model space, no. of polymorphisms fitted must be < no.
of individuals; apply correction and/or use a better model.
A simple, stepwise mixed-model regression with forward
inclusion and backward elimination suggested in
MLMM, which performs well in terms of FDR and power.
LASSO-LMM (Rakitsch et al. 2013; published on-line on
Nov. 22, 2012, Bioinformatics) is better than MLMM
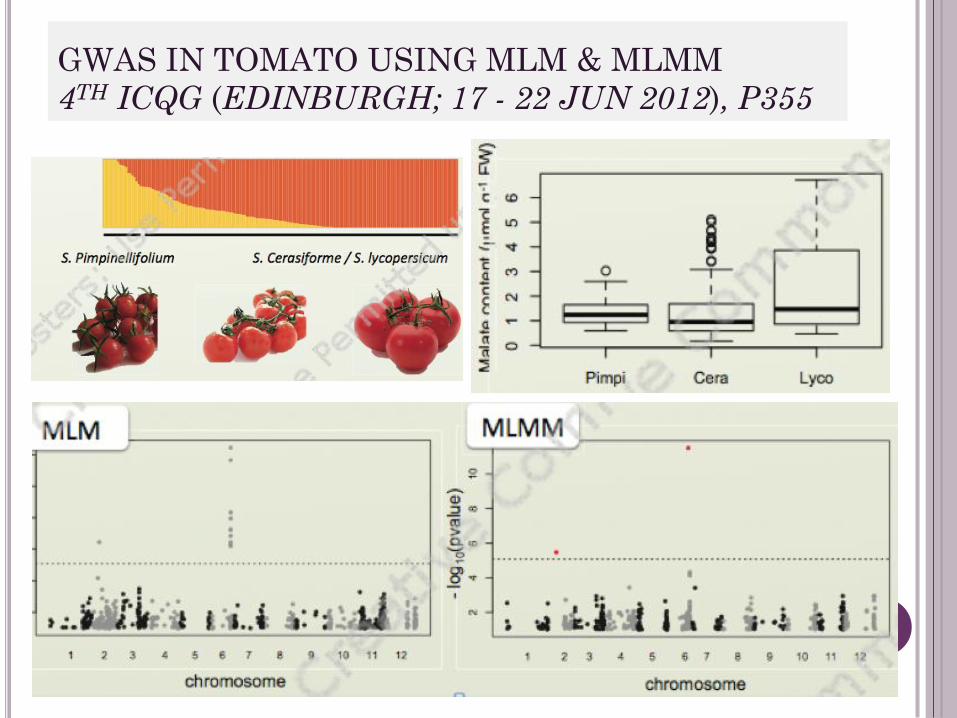
GWAS IN TOMATO USING MLM & MLMM
4TH ICQG (EDINBURGH; 17 - 22 JUN 2012), P355
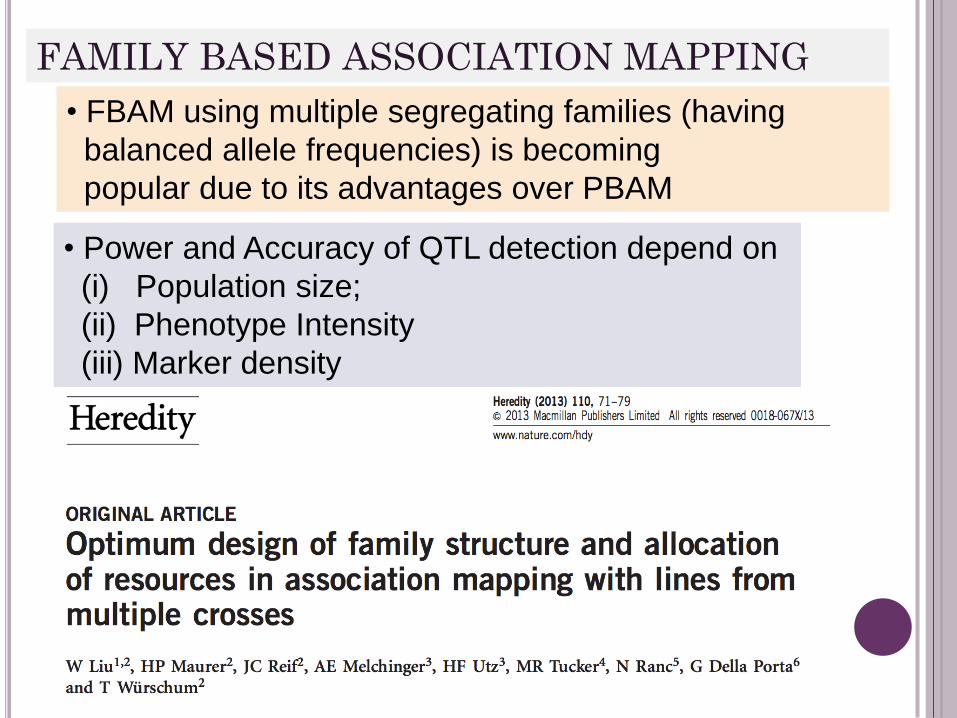
FAMILY BASED ASSOCIATION MAPPING
• Power and Accuracy of QTL detection depend on
(i) Population size;
(ii) Phenotype Intensity
(iii) Marker density
• FBAM using multiple segregating families (having
balanced allele frequencies) is becoming
popular due to its advantages over PBAM
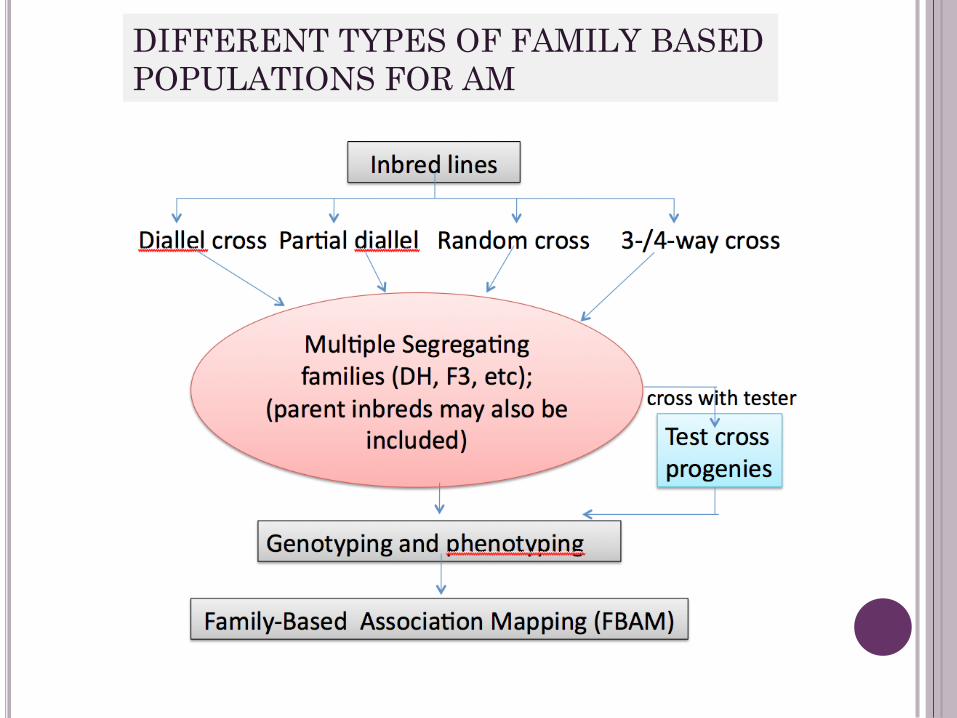
DIFFERENT TYPES OF FAMILY BASED
POPULATIONS FOR AM
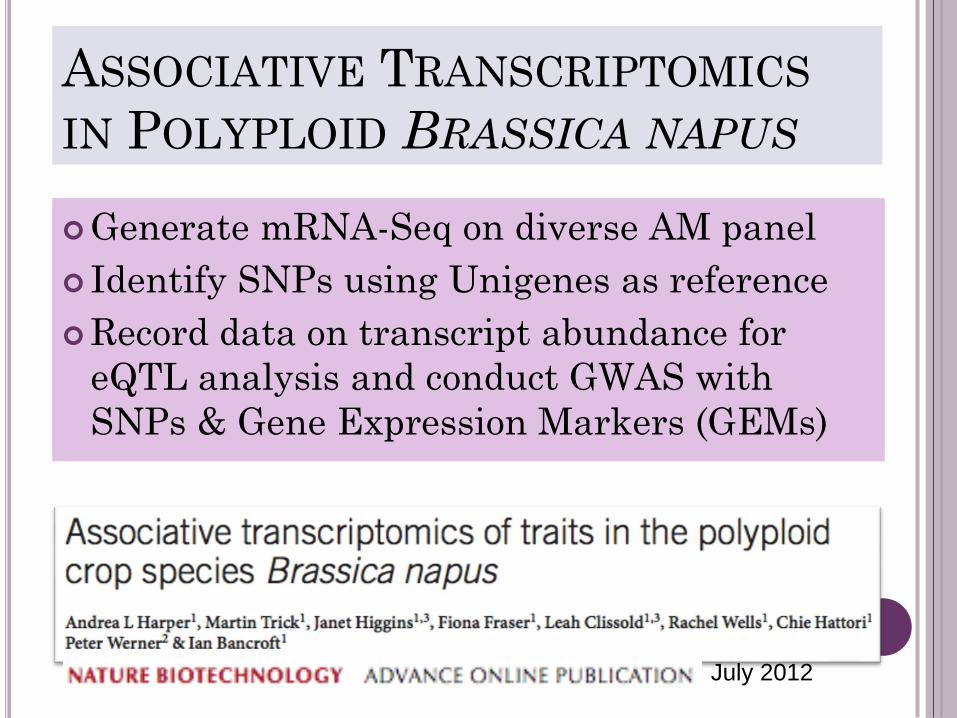
ASSOCIATIVE TRANSCRIPTOMICS
IN POLYPLOID BRASSICA NAPUS
Generate mRNA-Seq on diverse AM panel
Identify SNPs using Unigenes as reference
Record data on transcript abundance for
eQTL analysis and conduct GWAS with
SNPs & Gene Expression Markers (GEMs)
July 2012
Testing Reliability of GWAS Results
Enrichment ratio using known candidate genes
(Atwell et al., 2010)
Candidate gene (CG) AM
- Dwarf8 and flowering time in maize
(Thornsberry et al., 2001)
- >50 genes for flowering time in Arabidopsis
(Ehrenreich et al., 2009)
- Candidate genes for drought tolerance (Xu et al.
Feb 5, 2013; JEB)
-
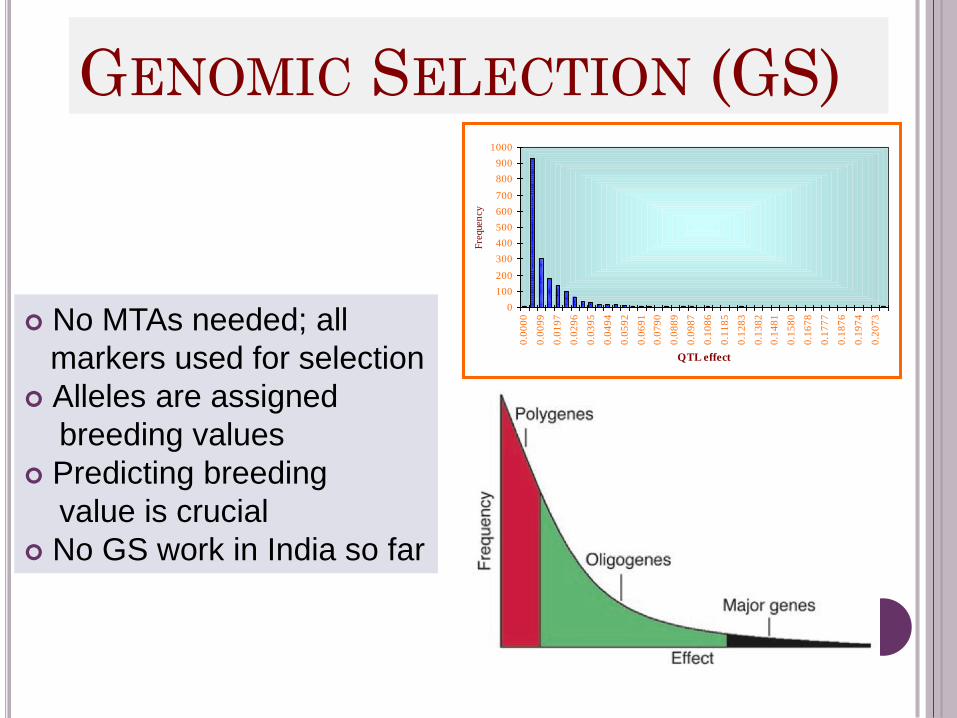
GENOMIC SELECTION (GS)
No MTAs needed; all
markers used for selection
Alleles are assigned
breeding values
Predicting breeding
value is crucial
No GS work in India so far
0
100
200
300
400
500
600
700
800
900
1000
0.0
000
0.0
099
0.0
197
0.0
296
0.0
395
0.0
494
0.0
592
0.0
691
0.0
790
0.0
889
0.0
987
0.1
086
0.1
185
0.1
283
0.1
382
0.1
481
0.1
580
0.1
678
0.1
777
0.1
876
0.1
974
0.2
073
QTL effect
Fre
quen
cy
Criteria for Genomic Selection
Genome-wide genotypic data used to predict the trait
with a high level of accuracy to allow selection.
Accuracy of prediction is crucial, and models are being
developed to improve prediction
Select markers that are most predictive of genomic
breeding values
Compute adjusted genotype means across environments
of a target region and then use these means in GS
Single stage and two stage GS
SUMMARY &
CONCLUSIONS
Commonly used methods of genetic dissection of
QTs suffer with limitations and are still evolving
Limited genetic variation and low resolution in
interval mapping, problems of false positives,
multiple testing, and rare alleles in AM and that of
prediction models in GS need to be addressed
Geneticists and plant breeders need to equip
themselves with skill of a statistician to be able to
make the best use of available tools


![Rice Molecular Breeding Laboratories in the Genomics Era ...downloads.hindawi.com/journals/ijpg/2008/524847.pdf · plant breeding” or “genomics-assisted breeding” [14]. However,](https://img.pdfslide.net/doc/110x75/601839f33688bf08b23767ac/rice-molecular-breeding-laboratories-in-the-genomics-era-plant-breedinga-or.jpg)