Embed Size (px)
Citation preview
Genomics as part of an integrated study of smallholder sheep
farming systems in the Western Cape, South Africa
by
Annelin Henriehetta Molotsi
December 2017
Thesis presented in fulfilment of the requirements for the degree of
Doctor of Philosophy in the Faculty of Agrisciences at Stellenbosch
University
Supervisor: Prof. Kennedy Dzama
Co-supervisor: Prof. Schalk Cloete
Co-supervisor: Dr. Simon Oosting
i
Declaration
By submitting this thesis electronically, I declare that the entirety of the work contained therein is my
own, original work, that I am the sole author thereof (save to the extent explicitly otherwise stated),
that reproduction and publication thereof by Stellenbosch University will not infringe any third party
rights and that I have not previously in its entirety or in part submitted it for obtaining any
qualification.
December 2017
Copyright © 2017 Stellenbosch University
All rights reserved
Stellenbosch University https://scholar.sun.ac.za
ii
Abstract
The aim of this study was to evaluate the productivity of smallholder sheep farming systems in the
Western Cape, South Africa, using an interdisciplinary approach, combining socio-economic factors
and genomics. The objectives were firstly to investigate sheep breeding practices followed in
smallholder sheep farming systems and to determine socio-economic factors that influence offtake
rate of flocks in the Western Cape, South Africa. Secondly, to compare genetic diversity and
population structure of smallholder sheep flocks to Western Cape resource flocks. Thirdly, to identify
single nucleotide polymorphisms associated with causal variants for the wet-dry phenotype using the
ovine 50K SNP bead chip. The final objective was to determine selection signatures within South
African sheep populations. To achieve the first objective interviews were conducted with 72
smallholder farmers in three districts of the Western Cape, namely the West Coast, Karoo and Eden.
Phenotypic measurements of body weight, body condition score and reproduction (wet and dry
phenotype) were obtained from a sample of ewes from the West Coast district from 2011 until 2014.
Range condition scores were estimated for two farms in the Karoo and four farms in West Coast
district. SURVEYMEANS and SURVEYFREQ in SAS were used to obtain means and frequencies
for qualitative data. The production systems were largely small-scale (43-85%) and communal (10-
57%). Sheep were mainly kept for consumption purposes. The Dorper was the prominent breed used
in all the farming systems and selection emphasis was different for farming systems. Traits selected
for by communal farmers included temperament, control of flies, meat taste, growth rate, fertility and
foraging ability; whereas small-scale farmers selected for conformation, mothering ability, disease
tolerance, heat tolerance and temperament. Lucerne was the predominant source of feed in addition
to natural grazing of rangeland. The major constraints mentioned were land availability, drought and
water availability. Average range condition scores were low for both districts and grazed vs. rested
camps, implicating overgrazing. Carrying capacity was higher than the recommended carrying
capacity in the Eden district (both communal and small-scale farmers, 0.26 and 18.5 ha/LSU
respectively) and in West Coast for small-scale farmers. The flock structure showed variation
Stellenbosch University https://scholar.sun.ac.za
iii
between farming systems with mature ewes (39-86%) and young replacement ewes (0.41-46%),
young rams (0.41-15%), rams (0-5%) and lambs (0-2%). The wet-dry phenotype was recorded as a
measurement of reproductive success over the three year period. The chi-square test indicated
significant differences between reproductive performances over the different years with a
repeatability of 0.399. Information on the socio-economic status of the farmers, their production
system and reason for keeping sheep was obtained. Information on the average numbers of lambs
sold and offtake rate was obtained as an economic indicator. A general linear model was fitted on
average number of lambs sold and offtake with district, sources of income, participation in
government programs and flock size as fixed effects. The majority of smallholder farmers were above
40 years of age and only 32% ranked their wealth status as poor. The smallholder sheep farming
systems in the Western Cape were male dominated. District significantly influenced average number
of lambs sold and offtake rate. The Karoo district sold a higher average number of lambs per year (41
± 8.8), with West Coast and Eden selling the same average number of lambs per year at 7 ± 2.2 and
7 ± 2.6, respectively. Offtake rate for the respective districts were not significantly different and were
17 ± 17% for Eden, 48 ± 20% for the Karoo and 46 ± 20% for West Coast. To achieve the second
objective blood samples were obtained from 295 sheep of which 172 had been identified as
smallholder Dorpers, 4 smallholder White Dorpers, 46 purebred Dorpers, 26 purebred South African
Mutton Merinos and 47 purebred Namaqua Afrikaners. Genetic diversity was estimated using allelic
richness (Ar), observed heterozygosity (Ho), expected heterozygosity (He) and inbreeding coefficient
(F). Population structure analysis was performed using fastSTRUCTURE to determine the breed
composition of each genotyped individual. The Namaqua Afrikaner had the lowest He of 0.280 ±
0.18 while the He of smallholder Dorper, Dorper and South African Mutton Merino did not differ
and were respectively 0.364 ± 0.13, 0.332 ± 0.16 and 0.329 ± 0.17. The inbreeding coefficient was
highest for the pure breeds, Namaqua Afrikaner, Dorper and South African Mutton Merino compared
to the average inbreeding coefficient for the smallholder Dorper population. There was evidence of
introgression with Namaqua Afrikaner, South African Mutton Merino and White Dorpers in the
Stellenbosch University https://scholar.sun.ac.za
iv
smallholder Dorper population. Similarly, the latter population was more genetically diverse than the
purebred Dorper, South African Mutton Merino and Namaqua Afrikaner breeds from the resource
flock. To achieve the third objective wet-dry records were obtained from smallholder farmers (n =
176) and the Nortier Research Farm (n = 131) for the 2014 breeding season. A logistic regression
model was fitted to adjust the data for the fixed effects of farm, breed, and age of the ewe and mating
weight as a covariate. Linkage disequilibrium (LD) and inbreeding coefficient were estimated using
PLINK. Association analysis was performed using the genome-wide efficient mixed-model
association package (GEMMA) to determine whether any significant SNPs were associated with the
wet-dry reproductive trait. The wet-dry phenotype differed significantly between the smallholder
(0.63 ± 0.04) and research farm flocks (0.79 ± 0.04). Genome-wide linkage disequilibrium (LD)
across all populations amounted to r2 = 0.36. Dorpers from the smallholder flock exhibited rapid LD
decay versus the resource ovine populations. Inbreeding levels were also lower for the smallholder
flock (4 ± 0.003%) versus the research flock (13 ± 0.008%). No significant SNPs were identified after
correction for false discovery rate. The heritability estimate for the wet-dry trait, using SNP
information, was 0.24. To achieve the last objective a study was done to obtain selection signatures
in the three purebred sheep breeds using HAPFLK and Bayescan methods. Selection signatures
obtained from HAPFLK included 26 significant SNP loci which were associated with genes that play
a role in the physiological pathways of the immune system, nervous system and pigmentation. Using
Bayescan, 92 SNP loci were under selection and some were associated with genes influencing the
immune system and polledness. Candidate genes obtained from this study included genes that play a
role in the immune system, the nervous system, reproduction (GNRH1), pigmentation (MREG,
KITLG), muscle growth (GDF11) and heat shock protein (DNAJC28). Smallholder sheep farming
systems on a socio-economic scale were unsustainable. However, on an environmental scale using
genetic diversity as an indicator, smallholder sheep were more sustainable. Selection signatures
linked to fitness and robustness may to contribute to literature investigating the adaptation of South
African ovine genetic resources to variability in ambient temperature.
Stellenbosch University https://scholar.sun.ac.za
v
Opsomming
Die doel van hierdie studie was om die produktiwiteit van klein-skaapboerderystelsels in die Wes-
Kaap, Suid-Afrika, te evalueer deur 'n interdissiplinêre benadering te gebruik deur sosio-ekonomie
en genomika te kombineer. Die doelwitte was eerstens om skaap teelpraktyke te ondersoek wat
gevolg word in klein-skaapboerderystelsels en om sosio-ekonomiese faktore te bepaal wat die
produksie van skaapkuddes in die Wes-Kaap, Suid-Afrika beïnvloed. Tweedens, was die genetiese
diversiteit en populasie struktuur van klein-skaapkuddes met Wes-Kaapse Department van Landbou
se navorsing kuddes vergelyk. Derdens was enkel nukleotied polimorfismes identifiseer wat verband
hou met oorsaaklike variante vir die nat-droog fenotipe met behulp van die ‘50K SNP beadchip’. Die
finale doel was om seleksie patrone binne Suid-Afrikaanse skaap populasies te bepaal. Om die eerste
doelwit te behaal, is onderhoude met 72 kleinboere in drie distrikte van die Wes-Kaap, naamlik die
Weskus, Karoo en Eden, uitgevoer. Fenotipiese metings van liggaamsgewig, liggaamskondisie
telling en reproduksie (nat en droog fenotipe) is van 2011 tot 2014 verkry uit ooie van die Weskus
distrik. Veld kondisie beramings is gedoen vir twee plase in die Karoo en vier plase in die Weskus.
‘SURVEYMEANS’ en ‘SURVEYFREQ’ in SAS is gebruik om gemiddeldes en frekwensies vir
kwalitatiewe data te verkry. Die produksiestelsels was grootliks kleinskaals (43-85%) en kommunale
(10-57%). Skape is hoofsaaklik vir verbruiksdoeleindes gehou. Die Dorper was die prominente ras
wat in al die boerderystelsels gebruik is en die seleksie keuse het verskil vir boerderystelsels.
Eienskappe wat deur kommunale boere geselekteer is, sluit in temperament, beheer van vlieë, vleis
smaak, groei tempo, vrugbaarheid en weidingsvermoë; terwyl kleinskaalse boere geselekteer het vir
konformasie, moederskapvermoë, siekteverdraagsaamheid, hitteverdraagsaamheid en temperament.
Lusern was die oorheersende bron van voer, bo en behalwe natuurlike weiding van land. Die
belangrikste beperkings was die beskikbaarheid van grond, droogte en water beskikbaarheid.
Gemiddelde veld kondisie was laag vir beide distrikte en wat impliseer oorbeweiding. Die dravermoë
was hoër as die aanbevole dravermoë in die Eden-distrik (beide kommunale en kleinboere,
onderskeidelik 0.26 en 18.5 ha / LSU) en in die Weskus vir kleinskaalse boere. Die kudde-struktuur
Stellenbosch University https://scholar.sun.ac.za
vi
het variasie getoon vir die verskillende boerderystelsels met volwasse ooie (39-86%) en jong
vervangings ooie (0,41-46%), jong ramme (0,41-15%), ramme (0-5%) en lammers (0-2 %). Die nat-
droog fenotipe is aangeteken as 'n meting van reproduksiesukses oor drie jaar. Die chi-kwadraat toets
dui op beduidende verskille tussen reproduktiewe prestasie oor die verskillende jare met 'n
herhaalbaarheid van 0.399. Inligting oor die sosio-ekonomiese status van die boere, hul
produksiestelsel en rede om skape te behou, is verkry. Inligting oor die gemiddelde aantal lammers
wat verkoop is en die afkoopkoers is as 'n ekonomiese aanwyser verkry. ‘n Algemene lineêre model
is toegepas vir gemiddelde aantal lammers verkoop met distrik, inkomstebronne, deelname aan
regeringsprogramme en kuddegrootte as vaste effekte in die model. Die meerderheid kleinboere was
bo 40 jaar en slegs 32% het hul rykdomstatus as arm beskou. Die klein -skaapboerdery stelsels in die
Wes-Kaap was deur die manlike geslag oorheers. Distrik het 'n aansienlike invloed gehad op die
gemiddelde aantal lammers wat verkoop is en die afkoopkoers. Die Karoo-distrik het 'n hoër
gemiddelde aantal lammers per jaar (41 ± 8.8) verkoop, met Weskus en Eden wat dieselfde
gemiddelde aantal lammers per jaar teen onderskeidelik 7 ± 2,2 en 7 ± 2,6 verkoop. Afkoopkoers vir
die onderskeie distrikte was nie beduidend anders nie en was 17 ± 17% vir Eden, 48 ± 20% vir die
Karoo en 46 ± 20% vir die Weskus. Om die tweede doelwit te bereik, is bloedmonsters verkry van
295 skape waarvan 172 geïdentifiseer is as kleinboere Dorpers, 4 kleinboere Witdorpers, 46 suiwer
Dorpers, 26 suiwer Suid-Afrikaanse Vleis Merinos en 47 suiwer Namakwa-Afrikaners. Genetiese
diversiteit is beraam deur gebruik te maak van alleliese rykdom (Ar), waargenome heterosigotisiteit
(Ho), verwagte heterosigotisiteit (He) en intelings koëffisiënt (F). Populasie struktuuranalise is
uitgevoer met behulp van fastSTRUCTURE om die rassamestelling van elke genotipeerde individu
te bepaal. Die Namakwa-Afrikaner het die laagste He van 0.280 ± 0.18 gehad terwyl die He van
kleinboer Dorper, Dorper en Suid-Afrikaanse Vleis Merino nie verskil het nie en was onderskeidelik
0.364 ± 0.13, 0.332 ± 0.16 en 0.329 ± 0.17. Die intelingskoëffisiënt was die hoogste vir die suiwer
rasse, Namakwa-Afrikaner, Dorper en Suid-Afrikaanse Vleis Merino in vergelyking met die
gemiddelde intelingskoëffisiënt vir die kleinboer Dorper-bevolking. Daar was bewyse van
Stellenbosch University https://scholar.sun.ac.za
vii
introgressie met Namakwa-Afrikaner, Suid-Afrikaanse Vleis Merino en Witdorpers in die kleinboer
Dorper-populasie. Net so, was die laasgenoemde populasie meer geneties diverse as die suiwer
Dorper, Suid-Afrikaanse Vleis Merino en Namakwa-Afrikaner rasse van die hulpbron-kudde. Om
die derde doelwit te bereik, is nat-droog rekords van kleinboere (n = 176) en die Nortier-
navorsingsplaas (n = 131) vir die 2014-teelseisoen verkry. ‘n Logistieke regressiemodel is toegepas
om die data vir die vaste effekte van plaas, ras en ouderdom van die ooi en paringsgewig as 'n
kovariaat aan te pas. Koppeling onewewigtigheid (LD) en intelingskoëffisiënt is beraam deur gebruik
te maak van PLINK. Assosiasie analise is uitgevoer met behulp van die genoom-wye doeltreffende
gemengde-model assosiasie pakket om te bepaal of enige beduidende SNP's geassosieer word met
die nat droog reproduksie eienskap. Die nat-droog fenotipe het beduidend verskil tussen die kleinboer
(0.63 ± 0.04) en die navorsingsplaaskudde (0.79 ± 0.04). Genoom-wye koppeling-onewewigtigheid
oor alle populasies beloop r2 = 0.36. Dorpers van die kleinboer kudde het vinnige LD-verval teenoor
die navorsings kudde getoon. Intelings vlakke was laer vir die kleinboer kudde (4 ± 0,003%) teenoor
die navorsings kudde (13 ± 0,008%). Geen beduidende SNP's is geïdentifiseer na regstelling vir vals
ontdekkingskoers nie. Die oorerflikheidsberaming vir die nat-droog eienskap, met behulp van SNP-
inligting, was 0,24. Om die laaste doelwit te bereik, is 'n studie gedoen om seleksie patrone in die
drie suiwer skaaprasse te verkry met behulp van HAPFLK- en Bayescan-metodes. Seleksie patrone
wat van HAPFLK verkry is, het 26 belangrike SNP lokusse ingesluit wat geassosieer was met gene
wat 'n rol speel in die fisiologiese weë van die reproduksie, teenwoordigheid van horing en
pigmentasie. Met behulp van Bayescan was 92 SNP loci onder seleksie en sommige is geassosieer
met gene wat die immuunstelsel beïnvloed en die teenwoordigheid van horings. Kandidaatgene wat
uit hierdie studie verkry is, sluit in gene wat 'n rol speel in die reproduksie (GNRH1), pigmentasie
(MREG, KITGL), spiergroei (GDF11) en hitte skok proteïene (DNAJC28). Klein-skaapboerdery
stelsels was op ‘n sosio-ekonomiese skaal onvolhoubaar. Op 'n omgewingsskaal wat genetiese
diversiteit as 'n aanwyser gebruik, was kleinboere egter volhoubaar. Seleksie patrone wat gekoppel
Stellenbosch University https://scholar.sun.ac.za

viii
is aan fiksheid en robuustheid, mag bydra tot literatuur wat die aanpassing van Suid-Afrikaanse skape
genetiese bronne aan veranderlikes in omgewings temperatuur ondersoek.
Stellenbosch University https://scholar.sun.ac.za
ix
Acknowledgements
Firstly I want to acknowledge Abba Father for the guiding me and giving me strength to complete
my PhD. I am nothing without You; You are my source of life.
My greatest appreciation to my main supervisor Prof. Kennedy Dzama who believed in me when I
approached him with my research idea amidst adversary to interdisciplinary research projects. I also
want to thank Prof. Schalk Cloete for all his guidance and insights concerning the implementation of
my project and for seeding the idea to work with smallholder sheep farmers. Thank you Prof for being
the link between the Western Cape Department of Agriculture and Stellenbosch University. I also
want to thank Dr. Simon Oosting from Wageningen University for his insights and supervision on
sustainable farming systems. I am grateful to Prof. Jerry Taylor and his research group at Missouri
University for assisting me with the analysis of my genotypic data.
I want to thank the smallholder farmers from Ebenheaser, Eden and Karoo for their willingness to
participate in the surveys and for the availability of their sheep for blood sampling. In memory of
Lilian Izaks, I also want to acknowledge her contribution in connecting me to the smallholder farmers
in Ebenheaser. Thanks to Manie Grobler and Vianca Erasmus from Farmer Support and Development
who went out of their way to accommodate me in Beaufort West.
Also thank you to my family and friends for supporting me in the writing up of my thesis. Thanks to
my husband David for encouraging me and sacrificing our family time for me to write my thesis. I
love you. Thanks to my son Abishai for being the light that always brighten up my day after a long
day at work.
Stellenbosch University https://scholar.sun.ac.za
x
Table of Contents
Declaration ........................................................................................................................................ i
Abstract ............................................................................................................................................ ii
Opsomming ...................................................................................................................................... v
Acknowledgements ......................................................................................................................... ix
Table of Contents ............................................................................................................................. x
List of Figures ............................................................................................................................... xvi
List of Tables ............................................................................................................................... xvii
List of Abbreviations ................................................................................................................. xviii
.............................................................................................................................................. 1
General introduction ........................................................................................................................ 1
1.1 Background ................................................................................................................................ 1
1.2 Problem statement ...................................................................................................................... 3
1.3 Justification ................................................................................................................................ 6
1.4 Objectives of the study ............................................................................................................... 7
1.5 Thesis overview and layout........................................................................................................ 8
References ........................................................................................................................................ 9
Chapter 2 ............................................................................................................................................ 13
Literature review ............................................................................................................................ 13
2.1. Introduction ............................................................................................................................. 13
2.2. Indicators of sustainable productivity for sheep farmers in South Africa .............................. 16
2.2.1. Social indicators .............................................................................................................. 16
Stellenbosch University https://scholar.sun.ac.za
xi
2.2.2 Economic indicators .......................................................................................................... 18
2.2.3 Environmental indicators ................................................................................................. 18
2.3. Limitations for productivity of sheep farming systems in South Africa ............................. 20
2.4. The importance of genetic diversity for sustainable genetic improvement ............................ 25
2.4.1. Genetic variability for adaptability and robustness .............................................................. 25
2.4.2. Genetic diversity of indigenous breeds ............................................................................ 26
2.4.3. Genetic diversity of commercial breeds in South Africa ................................................. 27
2.4.4. Is fitness always good if genetic diversity is high? .......................................................... 27
2.5. Genetic traits important for sustainable production performance ........................................... 28
2.6. Indigenous breeds in smallholder sheep farming systems ...................................................... 32
2.7. Applying genomics to improve traits important for sustainable farming systems ................. 33
2.7.1. Identifying causal variants ............................................................................................... 33
2.7.1.1 Genome-wide association analysis ............................................................................ 33
2.7.1.2. Selection sweeps ....................................................................................................... 37
2.7.2. Genomic selection ............................................................................................................ 37
2.7.3. Willingness and means for recording of phenotypes ....................................................... 38
2.8. Summary ................................................................................................................................. 39
2.9 References ................................................................................................................................ 40
............................................................................................................................................ 55
Characterisation of sheep farming and breeding practices of smallholder sheep farmers in the Western
Cape, South Africa ............................................................................................................................. 55
Abstract .......................................................................................................................................... 55
Stellenbosch University https://scholar.sun.ac.za
xii
3.1. Introduction ............................................................................................................................. 56
3.2. Materials and methods ............................................................................................................ 59
3.2.1. Description of the study site............................................................................................. 59
3.2.2. Household surveys ........................................................................................................... 60
3.2.3. Rangeland condition scores ............................................................................................. 61
3.2.4 Phenotypic measurements ................................................................................................. 62
3.3. Statistical analysis ................................................................................................................... 63
3.4. Results ..................................................................................................................................... 64
3.4.1 Sheep farming systems...................................................................................................... 64
3.4.2. Purposes for keeping sheep .............................................................................................. 67
3.4.3. Sheep breeding ................................................................................................................. 68
3.4.4. Feed resources .................................................................................................................. 70
3.4.5. Health ............................................................................................................................... 71
3.4.6. Constraints ....................................................................................................................... 72
3.4.7. Phenotypic measurements ................................................................................................ 73
Growth characteristics of sheep of smallholder farmers ........................................................ 73
Wet and dry phenotype .......................................................................................................... 74
3.5. Discussion ............................................................................................................................... 76
3.6. Conclusions ............................................................................................................................. 81
3.7. References ............................................................................................................................... 82
Chapter 4 ........................................................................................................................................ 89
Stellenbosch University https://scholar.sun.ac.za
xiii
Factors influencing offtake in smallholder sheep farming systems in the Western Cape, South
Africa ............................................................................................................................................. 89
Abstract .......................................................................................................................................... 89
4.1. Introduction ............................................................................................................................. 90
4.2. Material and methods .............................................................................................................. 93
4.2.1. Description of the study site............................................................................................. 93
4.2.3. Statistical analysis ............................................................................................................ 93
4.3. Results ..................................................................................................................................... 94
4.3.1. Farmers socio-economic profile....................................................................................... 94
4.3.2. Average number of lambs sold ........................................................................................ 98
4.3.3. Offtake rate ...................................................................................................................... 99
4.4. Discussion ............................................................................................................................... 99
4.5. Conclusions ........................................................................................................................... 103
4.6. References ............................................................................................................................. 103
Chapter 5 Genetic diversity and population structure of South African smallholder farmer sheep
breeds determined using the OvineSNP50 beadchip ................................................................... 107
Abstract .................................................................................................................................... 107
5.1. Introduction ....................................................................................................................... 108
5.2. Materials and Methods ...................................................................................................... 110
5.3. Results ............................................................................................................................... 112
5.4. Discussion ......................................................................................................................... 116
5.5. Conclusions ....................................................................................................................... 118
5.6. References ......................................................................................................................... 119
Stellenbosch University https://scholar.sun.ac.za
xiv
Chapter 6 .......................................................................................................................................... 124
Genome-wide association study for wet-dry phenotype in smallholder ovine populations in South
Africa ........................................................................................................................................... 124
Abstract .................................................................................................................................... 124
6.1. Introduction ....................................................................................................................... 125
6.2. Materials and methods ...................................................................................................... 126
6.3. Results ............................................................................................................................... 129
6.4. Discussion ......................................................................................................................... 130
6.5. Conclusions ....................................................................................................................... 132
6.5. References ......................................................................................................................... 132
Chapter 7 Identification of selection signatures related to traits of robustness in South
African sheep populations using the Bayesian Fst and HAPFLK approaches .......... 136
Abstract ........................................................................................................................................ 136
7.1. Introduction....................................................................................................................... 136
7.2. Materials and Methods ................................................................................................... 138
7.3. Statistical analysis .......................................................................................................... 138
7.3.1. Quality control .......................................................................................................... 138
7.4. Results ............................................................................................................................... 139
7.5. Discussion......................................................................................................................... 144
7.6. Conclusions ...................................................................................................................... 146
7.7. References ........................................................................................................................ 147
Chapter 8 Conclusions and recommendations ................................................................................. 151
8.1 Conclusions ............................................................................................................................ 151
Stellenbosch University https://scholar.sun.ac.za
xv
8.2 Recommendations .................................................................................................................. 154
8.3. Research Outputs .................................................................................................................. 157
8.3.1. Peer-reviewed publications ............................................................................................ 157
8.3.2. Conference outputs ........................................................................................................ 158
8.4 References .............................................................................................................................. 158
Addendum A ................................................................................................................................ 159
Stellenbosch University https://scholar.sun.ac.za
xvi
List of Figures
Figure 2:1 Diagram indicating the different sheep farming systems in South Africa and productivity constraints 24
Map 3.1 Map of the Western Cape Province in South Africa with the site where data were obtained. 62
Figure 3.1 Percentages of different farming systems observed in three districts, namely Eden, Karoo and West Coast.67
Figure 3.2 Ranking values for reasons provided by smallholder farmers using different farming systems 70
Figure 3.3 Breed composition of communal and small-scale farming systems. 71
Figure 3.4 Ranking values for selection objectives by smallholder farmers implementing different farming systems. 72
Figure 3.5 Percentage of supplementation sources employed by smallholder sheep farmers in the three different farming
systems 73
Figure 3.6 Predominant diseases that smallholder sheep farmers treat for within the two different farming systems. 74
Figure 3.7 Growth curve of smallholder sheep, body weight (kg ± SD) in relation to age in months. 74
Figure 3.8 Body condition score for smallholder ewes in relation to body weight (kg ± SD). 74
Figure 5.1. Scatter-plots depicting A) Principal component 1 vs. Principal component 2 and B) Principal component 1 vs.
Principal component 2 for the Dorper (resource flock), South African Mutton Merino (SAMM - resource flock), Namaqua
Afrikaner (Namafr – resource flock), Dorpersm (smallholder flock), White Dorper (WhiteDorper-smallholder flock). 116
Figure 5.2. FastStructure plots depicting the proportion of ancestry for ovine populations from K=3 until K=4 ancestral
genepools inferred with the FastStructure program. 117
Figure 6.1 Linkage disequilibrium (r2) decay with LD pruning within each breed 131
Figure 6.2 Manhattan plot indicating –log10 (P) values for single nucleotide polymorphisms associated with wet-dry
phenotype 132
Figure 7.1 A) DNAJC28 OAR1, 120.1-121 Mb, B) GNRH1 OAR2, 40.0-41.3Mb C) MREG OAR2 -216.9-217.0 Mb
143
Figure 7.2 Manhattan plot of HAPFLK selection signatures, -log10 (p) against the chromosome. 144
Stellenbosch University https://scholar.sun.ac.za
xvii
List of Tables
Table 2.1 Heritability estimates for traits important for enhanced productivity 32
Table 2.2 Examples of causal variants for traits important for productivity as determined using genomics 38
Table 3.1 Description of smallholder farmers in Ebenheaser where phenotypic measurement were derived from 65
Table 3.2 Average livestock numbers per household in the different farming systems across districts (mean ± standard
errors) 68
Table 3.3 Range condition scores for different farming systems communal vs small-scale 69
Table 3.4 Average flock sizes per household given in Livestock Units (LSU) and percentage composition for smallholder
sheep production units studied per farming systems across all three districts. 71
Table 3.5 Constraints experienced by smallholder sheep farmers in the Western Cape. 75
Table 3.6 Fixed effects of age of the ewe, farm, year and body condition score on wet-dry phenotype. 77
Table 3.7 Chi-square results for proportion of ewes lactating for 2011, 2012 and 2014 and repeatability estimate. 77
Table 4.1 Socio-economic description of farmers in the Western Cape. 96
Table 4.2 Odds estimate ratio for sale outlets, private vs abattoir for smallholder sheep farmers. 98
Table 4.3 Analysis of maximum likelihood estimates for sale outlets. 98
Table 4.4 Description of the farming systems and sale outlets per district in the Western Cape, South Africa. 99
Table 4.5 Odds estimate ratio for sources of income for smallholder sheep farmers. 100
Table 4.6 Analysis of maximum likelihood estimates for sources of income. 100
Table 4.7 Average number of lambs sold per year per district. 101
Table 5.1 Genetic diversity statistics (±SD) for the sheep in the smallholders flock(s) (Dorpersm) relative to pure breeds
from the Nortier resource flock (Dorper, SAMM and Namafr). 115
Table 5.2 fastSTRUCTURE results for average breed composition per sampled group. 118
Table 7.1 Significant SNP under selection using HAPFLK method 143
Table 7.2 Significant loci under selection using the BayeScan method 145
Stellenbosch University https://scholar.sun.ac.za
xviii
List of Abbreviations
AFLP – Amplified Fragment Length Polymorphism
BEE –Black Economic Empowerment
BLUP - Best linear unbiased prediction
CH4 - Methane
CO2 –Carbon dioxide
CASP – Comprehensive Agricultural Support Program
DNA – Deoxyribonucleic Acid
FEC – Faecal Egg Counts
FecB – Booroola gene mutation
GBLUP – Genomic Best Linear unbiased prediction
GDF9 – Growth Differentiation Factor
GEBV – Genomic Estimated Breeding Value
GWAS – Genome Wide Association Study
h2 – Heritability
ICT – Information and communication technologies
KIF16B- kinesin family member 16B
KRTCAP3 – Keratinocyte associated protein 3
LD – Linkage Disequilibrium
LRAD –Land Redistribution for Agricultural Development
Ne – effective population size
NSIS - National Smallstock Improvement Scheme
PCR – Polymerase chain reaction
PO – Posterior Odds
QTL – Quantitative Trait Loci
Stellenbosch University https://scholar.sun.ac.za
xix
RAPD – Random Amplified Polymorphic DNA
RFLP – Restriction Fragment Length Polymorphism
SAMM – South African Mutton Merino
SNP – Single nucleotide polymorphism
TSPEAR – thrombospondin-type laminin G domain and EAR repeat
Stellenbosch University https://scholar.sun.ac.za
1
General introduction
1.1 Background
Sustainable agriculture infers to natural systems that can be sustained over the long term, and
achieve optimal production with using low inputs, the profitability of a farming unit, ensuring
food security, and provision for the demands and necessities of households and communities.
To have a sustainable and efficient farming operation, three dimensions i.e. economic, social
and environmental should be considered. To incorporate all of these dimensions into finding
solutions for unsustainability requires an interdisciplinary approach. An interdisciplinary
approach is defined by Rosenfield (1992) as “researchers that work jointly but still form
disciplinary–specific basis to address a common problem”. This study will integrate two
disciplines i.e. social sciences and agricultural sciences, to address the problem of low
production performance of smallholder sheep farms in South Africa.
It important to look at the improvement of smallholder sheep farming systems in South Africa
because livestock production is one of the major role players in providing food security,
particularly for protein foods. Small stock is mainly kept for socio-economic benefits like
household food security, capital, direct income as well as the spreading of risk (Moyo &
Swanepoel, 2010). Smallholder farmers are not necessarily able to exploit the full potential of
their livestock because of constraints such as a lack of education, a lack of infrastructure, poor
management, inadequate resources, as well as inadequate strategies for genetic improvement
(Rege et al., 2011). Added to the aforementioned challenges for smallholder farmers are the
effects of climate change. Smallholder livestock production systems must be investigated
economically, environmentally, and socially. This calls for adaptation in farming systems and
Stellenbosch University https://scholar.sun.ac.za
2
strategies by using an interdisciplinary approach to address this problem. For the context of
this study, the issue will be addressed on two levels, socio-economically and environmentally.
Socio-economic sciences will be linked to the offtake rate and environmental sciences will be
linked to genetic diversity of the animal genetic resources.
Offtake rate is defined as the percentage of sold or slaughtered animals at the end or during a
production cycle to the initial stock (Otte &Chilonde). It can also be linked to the number of
lambs marketed per year expressed relative to the breeding flock maintained. Smallholder cattle
farming systems have low offtake rates (Musemwa et al., 2010) and low lamb marketing
percentages have been reported in sheep smallholder systems (Grobler, 2008, Spies & Cloete,
2013). This can be linked to the social-context of the farmers, having little or limited financial
resources, land available for farming and whether they are participating in land reform projects
or not. Lamb marketing percentage is also influenced by the breed (genetics), nutrition,
management practices and environmental factors like extreme droughts.
The environmental concern for smallholder farmers is the ability of animals to adapt and
produce in changing and challenging environments. Environmental sustainability can be
assessed by determining the genetic structure of the animal resources used by smallholders.
Obtaining information on animal performance mainly through phenotypic information is
important and allows linkage of quantitative production traits to genetics. It is assumed that a
genetically diverse population will contain a combination of alleles able to adapt to the
changing environment (Frankham, 2005). It is important to determine the levels of genetic
diversity, since high levels of homozygosity (can lead to inbreeding) compromises
economically important traits such as reproduction and fertility (Erkanbrack & Knight, 1991).
Genomic tools can be used to determine genetic diversity as well as to identify causal variants
for quantitative traits related to robustness through employing genome wide association studies
(GWAS) (Kijas et al., 2012; Demars et al., 2013; Qwabe et al., 2013). The most common
Stellenbosch University https://scholar.sun.ac.za
3
molecular markers used in genetic diversity studies include microsatellites and single
nucleotide polymorphisms (SNP’s). Microsatellites have been used to genetically characterise
sheep breeds in South Africa (Soma et al., 2012). This work has been primarily on breeds
important for commercial sheep enterprises and there is no information on genetic diversity
within and between sheep populations managed by smallholder farmers. In the absence of
formal recordkeeping in smallholder farming systems, it may be more efficient to obtain
genetic information using molecular markers compared to traditional performance records.
However, a suitable reference population with extended phenotypes as well as genomic
information is needed to predict accurate genomic breeding in such populations (Daetwyler et
al., 2012; Legarra et al., 2014).
1.2 Problem statement
The central and western parts of South Africa, as predominantly a semi-arid area, are more
suitable for small stock farming than alternative land-use systems. Enhanced production
performance in commercial sheep flocks has been achieved by manipulating genetic diversity
of the breeding flock using various breeding techniques. However, low production performance
and offtake rates are observed in smallholder sheep farming systems (Grobler, 2008; Spies &
Cloete, 2013). Literature indicates that there have been several breeding strategies implemented
to improve production of smallholder production systems which included: i) selection between
breeds, ii) crossbreeding iii) selection within breeds, iv) marker assisted introgression (Kosgey
et al., 2006; Marshall et al., 2011). Selection between breeds has led to breed substitution in
smallholder production systems. Several studies have been published, where exotic breeds with
high performance levels (under adequate environment) have been introduced in smallholder
flocks where inadequate nutrition and management are prevalent (Madalena et al., 1990;
Workneth et al., 2002). These exotic breeds are likely to underperform and struggle to adapt to
different temperatures and exposure to parasites and diseases. Genotype and environment
Stellenbosch University https://scholar.sun.ac.za
4
interaction is where a breed performs well under optimal conditions (receiving optimal
nutrition and efficient management practices) but when located under extreme conditions
where limited nutrition and management is available that breed exhibits mediocre performance
or similar performance to that of the indigenous breed (Okeyo & Baker, 2005).
The use of crossbreeding has been both successful (Metawi et al., 1999) and unsuccessful in
smallholder flocks (Ayalew et al., 2003). A study done by Metawi et al., (1999) in Egypt,
compared two different farming systems, namely a transhuman herding system (THS) and
mixed crop/livestock farming system (MCLFS) to monitor ewe productivity and lamb
production. The MCLFS had higher ewe productivity and a higher number of lambs born than
the THS even though the THS had a lower feed input cost and had advantage in the feed
costs/kg of lamb weaned in comparison to MCLFS farmers. The THS had a lower mortality
rate than the MCLFS. They concluded that low pre-weaning average daily gain and high lamb
losses were the main limiting factors that affected flock productivity under the THS and
MCLFS respectively. It can be seen from this study, when comparing feed input cost, that the
THS sheep were more profitable to their owners than the sheep in the MCLFS system, even
though the latter system resulted in a higher productivity. The breeds used by Metawi et al.
(1999) were crossbred Egyptian breeds which were adapted to their environment and were able
to be profitable to their producers although receiving inadequate nutrition in the THS system.
The study by Ayalew et al. (2003) indicated that net benefits obtained from using indigenous
goats were higher in comparison to using crossbreds. The latter study included both tangible
value (benefits derived from meat, manure and milk) and intangible value (benefits derived
from saved interest/premium on credit/insurance) of goats in the calculation of net benefits.
Kosgey et al. (2006) pointed out that constraints to selection within breeds are due to
limitations in flock sizes, single sire flocks, inadequate animal identification and recording of
pedigree, as well as low level of literacy. Successful marker-assisted introgression of the FecB
Stellenbosch University https://scholar.sun.ac.za
5
mutation in smallholder sheep flocks in India have been reported which resulted in increased
number of live born lambs and lamb survival (Nimbkar et al., 2003).
Marshall et al. (2011) indicated that most breeding programmes fail due to insufficient
attention given to system requirements such as infrastructure, external funding, organisation at
farming level and recognition by stakeholders. The latter authors argued that the use of
genomics could only be successful if all the system requirements are met. The use of genomics
does have limitations in terms of the lack of availability of phenotypic data. Obtaining reliable
records for traits of economic relevance of an appropriate reference population needs to be
addressed. Efforts should be concerted in the development of breeding schemes that allows the
recording of traits important for both tangible and intangible benefits. Another limitation with
the use of genomics is the genotyping costs involved. Genotyping costs per individual using
the 50K SNP chip are 73 Euro (Geneseek, 2015). However, these costs have been predicted to
decrease in the future (Cloete et al., 2014). Genomics can play a role in obtaining pedigree
information for smallholder flocks and decreasing generation interval. However, when
designing a breeding plan a holistic approach should be taken that will address socio-economic
issues as well as production issues of smallholder farmers.
Limited interdisciplinary studies are available for the evaluation of productivity of smallholder
sheep farming systems in the Western Cape, South Africa. Multi-disciplinary studies have been
done in Kwa-Zulu Natal (Mahlobo, 2016) and in the Eastern Cape (Marandure et al., 2016)
regions of South Africa. Neither of the two studies had a particular focus on productivity of
smallholder sheep production system. The former focused on the sustainability of the overall
smallholder farming systems in communities that did not keep sheep; while the latter assessed
the sustainability of smallholder beef production systems. Livestock offtake rates and animal
genetic diversity were not explicitly considered as indicators in either study. Interdisciplinary
approaches have been done in Spain (Ripoll-Bosch et al., 2012) where the Framework for
Stellenbosch University https://scholar.sun.ac.za
6
Assessing the Sustainability of Natural Resource Management Systems (MESMIS) was used
to evaluate the sustainability of different sheep farming systems. The study observed trade-offs
between economic and environmental pillars, thus the higher the economic sustainability the
lower the environmental sustainability.
As the production systems and constraints to production efficiency of Western Cape
smallholder farmers have not been quantified adequately, further research on this topic is
needed. It is anticipated that smallholder sheep farmers in South Africa will be experiencing
similar problems as smallholder farmers in other developing countries (Rege et al., 2011). It is
therefore necessary to conduct a study to investigate smallholder sheep farming systems in
South Africa and to apply an integrated approach to managerial strategies that will include
socio-economics and genomics to aid in the overall enhancement of production and economic
viability of smallholder farmers.
1.3 Justification
Sheep production in the smallholder sector contributes significantly to the livelihoods of many
farmers in the Western Cape. It is therefore important to elucidate factors that influence offtake
rates and genetic diversity of the sheep farming systems. Once these are mapped they can be
used to improve the productivity of smallholder sheep farming systems. The study will focus
on socio-economic factors and flock size as determinants of the offtake rate of smallholder
sheep farmers in the Western Cape, South Africa. This is important since smallholder sheep
farmers in this sector have been reported to have low offtake rates compared to commercial
farmers (Grobler, 2008, Spies & Cloete, 2013). The latter could be linked to their management
of animal genetic resources, as well as to other factors, which include social or political
constraints. No previous studies have focused on biodiversity on a gene level in sheep and its
impact on production and reproduction traits. Genetic diversity of smallholder sheep
Stellenbosch University https://scholar.sun.ac.za
7
populations in South Africa is poorly described and indigenous breeds utilized by smallholder
farmers are mostly uncharacterized in terms of their production and reproduction performance.
An interdisciplinary approach will thus be taken to determine the social-economic constraints
of smallholder sheep farmers, to determine their offtake rate, and to study the genetic structure
of their animal resources (sheep) used.
The aim of this study was to evaluate the production performance of smallholder sheep farming
systems in the Western Cape, South Africa, using an interdisciplinary approach. The socio-
economic aspects encompassed the reasons why smallholders farm with small stock, their
constraints and the influence thereof on offtake rate. The environmental aspect investigated the
animal genetic resources utilised in smallholder sheep farming systems, quantifying genetic
diversity and identifying selection signatures for robustness traits.
1.4 Objectives of the study
The specific objectives of the study were to:
i) Ascertain sheep farming characteristics and breeding practices utilised by
smallholder sheep farmers and determine growth and reproduction of smallholder
ewes.
ii) Investigate different socio-economic factors that influence offtake rate of
smallholder sheep flocks in the Western Cape, South Africa.
iii) Determine genetic diversity and population structure of smallholder sheep flocks in
comparison to resource population flocks in the Western Cape, South Africa.
iv) Identify single nucleotide polymorphisms associated with causal variants for the
wet-dry phenotype using the ovine 50K SNP bead chip.
v) Determine selection signatures within South African sheep populations using
different methods, namely Bayescan and HAPFLK.
Stellenbosch University https://scholar.sun.ac.za
8
1.5 Thesis overview and layout
The aim of this study was to investigate the production performance of smallholder sheep
farming systems in the Western Cape, South Africa, using an interdisciplinary approach. This
was achieved through a socio-economic and genomic approach. The thesis is divided into eight
chapters consisting of the general introduction, literature review, five research chapters and a
conclusion. Each chapter, except chapters 1 and 8, is structured as a manuscript for publication,
complete with abstract and list of references.
Chapter 1 is the general introduction and provides a background and motivation for the study.
Chapter 2 is the literature review and discusses issues of sheep farming systems in South
Africa, and the role of genomics in addressing some of these limitations. This manuscript has
been published in Sustainability (07/07/2017).
Chapter 3 is a research chapter investigating sheep breeding systems of smallholder sheep
farmers in the Western Cape. This manuscript is in preparation for submission to Small
Ruminant Research.
Chapter 4 is a research chapter investigating socio-economic factors influencing offtake rate.
This manuscript is in preparation for submission to Small Ruminant Research.
Chapter 5 investigated the population structure and genetic diversity of smallholder sheep
flocks and pure breed Dorper, Namaqua Afrikaner and South African Mutton Merino obtained
from a governmental resource farm. This manuscript has been published in Tropical Animal
Health and Production 49, 1771-1777.
Chapter 6 is a preliminary genome wide association study using the ovine 50K SNP bead chip
to identify single nucleotide polymorphisms associated with the wet-dry phenotype in sheep.
Stellenbosch University https://scholar.sun.ac.za
9
This manuscript was published in the South African Journal of Animal Science 2017, 47, 327-
331.
Chapter 7 explored selection signatures in smallholder and resource sheep flocks using two
different methods, Bayescan and HAPFLK. This manuscript is in preparation for publication
in the South African Journal of Science.
Chapter 8 concludes the thesis and presents further comments and recommendations.
References
Ayalew, W., Rischkowsky, B., King, J.M. & Bruns, E., 2003. Crossbreds did not generate more
net benefits than indigenous goats in Ethiopian smallholdings. Agric. Sys. 76, 1137-
1156.
Demars, J., S. Fabre, J. Sarry, R. Rossetti, H. Gilbert, L. Persani, G. Tosser-Klopp, et al. 2013.
Genome-Wide Association Studies Identify Two Novel BMP15 Mutations Responsible
for an Atypical Hyperprolificacy Phenotype in Sheep. PLoS Genetics 9, no. 4.
Daetwyler, H.D., Bolormaa, S., Brown, D.J., Van der Werf, J.H.J. & Hayes, B.J. 2012. A
Genomic Prediction Cross-Validation Approach Combining Ewe Repeated Phenotypes
and Ram Daughter Trait Deviations. In: Proc. Assoc. Advmt. Anim. Breed. Genet. 360–
363.
Ercanbrack, S.K. & Knight, A.D., 1991. Effects of inbreeding on reproduction and wool
production of Rambouillet, Targhee, and Columbian ewes. J. Anim. Sci. 69, 4734-4744.
Frankham R., 2005. Genetics and extinction. Biol. Conserv. 126, 131–140.
Grobler, H.J.F., 2008. How are our LRAD farmers doing? Agriprobe 5, pp. 4-5.
Grobler, H.J.F., 2010. Evaluation survey at extensive farms in the Central Karoo 2009.
Agriprobe June, pp. 6-9.
Stellenbosch University https://scholar.sun.ac.za
10
Heaton M.P., Leymaster K.A., Kalbfleisch T.S., Kijas J.W., Clarke S.M., McEwan J., Maddox
J.F., Basnayake V., Petrik D.T., Simpson B., Smith T.P.L., Chitko-McKown C.G. & the
International Sheep Genomics Consortium, 2014. SNPs for parentage testing and
traceability in globally diverse breeds of sheep. Public Library of Science ONE: e94851
Kijas, J.W., Townley, D., Dalrymple, B.P., Heaton, M.P., Maddox, J.F., McGrath, A., Wilson,
P., Ingersoll, R.G., McCulloch, R., McWilliam, S., Tang, D., McEwan, J., Cockett, N.,
Oddy, V.H., Nicholas, F.W. & Raadsma, H., 2009. A Genome wide survey of SNP
variation reveals the genetic structure of sheep breeds. PLoS ONE 4, e4668, doi:
10.1371/journal.pone.0004668
Kijas, J.W., Lenstra, J.A., Hayes, B., Boitard, S., Porto Neto, L.R, San Cristobal, M., Servin,
B., McCulloch, R., Whan, V., Gietzen, K., Paiva, S., Barendse, W., Ciani, E., Raadsma,
H., McEwan, J., Dalrymple, B. & the International Sheep Genomics Consortium
Members. 2012. Genome-wide analysis of the world’s sheep breeds reveals high levels
of historic mixture and strong recent selection. PLoS Biol 10, e1001258.
Kosgey, I.S., Baker, R.L., Udo, H.M.J. & Van Arendonk, J.A.M., 2006. Successes and failures
of small ruminant breeding programmes in the tropics: a review. Small Rumin. Res. 61,
12-28.
Legarra, A., Baloche, G., Barillet, F., Astruc, J.M., Soulas, C., Aguerre, X., Arrese, F., et al.
2014. Within- and across-Breed Genomic Predictions and Genomic Relationships for
Western Pyrenees Dairy Sheep Breeds Latxa, Manech, and Basco-Béarnaise. J. Dairy Sci.
97, 3200–3212. http://www.ncbi.nlm.nih.gov/pubmed/24630656.
Madalena, F.E., Lemos, A.M., Teodoro, R.L., Barbosa, R.T. & Monteiro, J.B.N. 1990. Dairy
production and reproduction in Holstein-Freisan and Guzura crosses. J. Dairy Sci. 73,
1872-1886.
Stellenbosch University https://scholar.sun.ac.za
11
Mahlobo, B.T., 2016. Multi-criteria livestock assessment of sustainability of smallholder farms
in Kwa-Zulu Natal. M.Sc thesis, Stellenbosch University.
Marais, P.G., King, B.R. & Stannard, C.G., 2006. Evaluation of the genetic potential for growth
and wool production of sheep in the communal areas of the Eastern Cape. Research report
of the Grootfontein Agricultural Development Institute, 2007. Private Bag X529,
Middelburg 5900, South Africa. pp. 33-34.
Marandure, T., Mapiye, C., Makombe, G. & Dzama, K., 2016. Indicator-based sustainability
assessment of the smallholder beef cattle production in South Africa. Agroecol. Sust.
Food Syst. DOI: 10.1080/216835652016:1231152.
Marshall, K., Quiros-Lompos, C., van der Werf, J.H.J. & Kinghorn, B., 2011. Marker-based
selection within smallholder production systems in developing countries. Livest. Sci.
136, 45-54.
Metawi, H.R., Kandil, H.M. & El Shear, H.M., 1999. Sheep productivity under extensive and
semi-intensive production systems in Egypt. In: Systems of sheep and goat production:
Organization of husbandry and role of extension services. Eds. Rubino, R. & Mohrand-
Fehr, P. CIHEAM IAMZ, 239-243.
Moyo, S. & Swanepoel, F.J.C., 2010. Multifunctionality of livestock in developing
communities. In: The role of livestock in developing communities: enhancing
multifunctionality. Eds. Swanepoel, F.J.C., Stroebel, A., Moyo, S. publ. UFS & CTA.
pp. 1-12.
Musemwa, L., Mushunje, A., Chimonyo, M. & Mapiye, C., 2010. Low cattle market offtake
rates in communal production systems of South Africa: Causes and migration strategies.
J. Sustain. Dev. Africa, 12, 209–226.
Stellenbosch University https://scholar.sun.ac.za
12
Nimbkar, C., Ghalsasi, P.M., Maddox, J.F., Pardeshi, V.C., Sainani, M.N., Gupta, V., &
Walkden-Brown, S.W., 2003. Expression of the FecB gene in the Garole and crossbred
ewes in Maharashtra, India. Proc. Assoc. Advmnt. Anim. Breed. Genet. 15, 111-114
Okeyo, A.M. & Baker, R.L., 2005. Methodological illustration of genotype x environment
interaction (GXE) phenomenom and its implications: A comparative productivity
performance study on Red Massai and Dorper sheep breeds under contrasting
environments in Kenya. Training module, published by the ILRI in the CGIAR database.
http://hdl.handle.net/10568/3597
Otte, M.J. & Chilonde, P., 2002. ‘Cattle and small ruminant production systems in Sub-Saharan
Africa. A systematic review’, FAO publishing Rome.
Rege, J.E.O., Marshall, K., Notenbeart, A., Ojango, J.M.K. & Okeyo, A.M., 2011. Pro-poor
animal improvement and breeding – What can science do? Livest. Sci. 136, 15-28.
Ripoll-Bosch, R., Diez-Unquera, B., Ruiz, R., Villalba, D., Molina, E., Joy, M., Olaizila, A. &
Bernues, A. 2012. An integrated sustainability assessment of mediterranean sheep farm
with different degrees of intensificiation. Agricul. Sys. 105, 46-56.
Rosenfield, P.L., 1992. The potential of transdisciplinary research for sustaining and extending
linkages between the health and social sciences. Sos. Sci. Med. 35, 1343-1357.
Soma, P., Kotze, A., Grobler, J.P. & Van Wyk, J.B., 2012. South African sheep breeds:
Population genetic structure and conservation implications. Small Rumin. Res. 103,
112–119.
Spies, D.C. & Cloete, P.C., 2013. Performance and marketing options for red meat in the
formal and informal value chains in the Free State Province. 19th International Farm
Management Congress, SGGW, Warsaw, Poland.
Stellenbosch University https://scholar.sun.ac.za
13
Chapter 2
Literature review
2.1. Introduction
Smallholder livestock production plays a pivotal role in the economies of developing countries.
Smallholder farmers are the primary producers of food and account for 80% of all the farms in
sub-Saharan Africa (World Resources Institute [WRI], 2014). Livestock are important for
income generation and supplying basic animal protein products; however, poor reproduction
and growth performance are a common feature of these production systems. Most of the surface
area in South Africa is semi-arid which makes it unsuitable for anything but extensive ruminant
livestock farming (Cloete et al., 2014). In South Africa the sheep industry is divided into
commercial, emerging (i.e. farms transitioning from small-scale or communal to commercial
farms), small-scale farmers and communal farmers (a group of farmers farming on communal
land). There are an estimated 28.8 million sheep in South Africa, of which 21.4 million are
owned by commercial farmers (Directorate Statistics and Economic analysis, 2013). The
industry is dominated by the commercial sheep sector that supplies meat products locally and
wool products for export. The emerging and small-scale sheep farmers supply meat and wool
products to the informal and formal market, whereas the communal farmers are supplying meat
for informal markets. Sheep also fulfil multiple socio-economic roles to small-scale and
communal farmers, including the production of meat for consumption, wool, income, manure,
draught power and for religious and cultural rituals. The Dohne Merino, Merino and Dorper
breeds are the most prominent breeds of sheep in South Africa. Other sheep breeds found in
the South African sheep industry include Dormer, Ile de France, Meatmaster, Namaqua
Afrikaner, Afrino, Merino Landsheep and South African Mutton Merino (Cloete et al., 2014).
The number of sheep owned by smallholder farmers is inadequately documented. Sheep raised
Stellenbosch University https://scholar.sun.ac.za
14
by most communal farmers in South Africa include the Nguni, Damara, Pedi, Namaqua
Afrikaner and the Dorper. However, the Dorper is the breed of choice for farmers in the semi-
arid and arid environments of South Africa, because of its ability to grow and reproduce in
harsh environments. Some of these breeds are indigenous to South Africa and have
characteristics that make them well-adapted to local conditions (Kunene et al., 2007; Almeida,
2011; Snyman et al., 2013; Zishiri et al., 2013). Commercial farmers achieve high production
due to selection of these breeds for improved growth, reproduction, meat and wool traits in
exotic breeds (Schoeman et al., 2010). Minimal or no selection took place in the
abovementioned traits in smallholder sheep production systems resulting in low production
performance (Grobler, 2010). Indigenous breeds used in smallholder systems such as the
Damara (Almeida, 2011) and Namaqua Afrikaner (Cloete et al., 2013), however, outperform
commercial breeds for fitness traits, survival and tick resistance. Fitness traits can be described
as a group of traits enabling animals to adapt and include several reproduction and survival
traits (Goddard, 2009). Selection in commercial flocks has been achieved using traditional
breeding methods. However, with the advent of genomics it is possible to accelerate genetic
progress for traits important in smallholder production through more accurate selection, by
including molecular markers into traditional breeding values and obtaining genomic breeding
values for individuals (Van der Werf, 2009).
Sustainable agriculture implies long-term maintenance of natural systems, to produce in
harmony with the available resources without over exploitation, adequate income per farming
unit, fulfilment of basic food needs, as well as provision for both existing and emerging
demands and necessities of rural families and communities (Brown et al., 1987). The ability of
smallholder farmers to exploit the full potential of their livestock is limited by infrastructure,
limitations in management, inadequate feed resources, as well as inadequate strategies for
genetic improvement of their livestock (Rege et al., 2011). These constraints are further
Stellenbosch University https://scholar.sun.ac.za
15
aggravated by issues like climate change and its impact on the future availability of natural
resources like water, land, plant and animal species integral to the survival of future generations
(World Resources Institute [WRI], 2014). It is therefore necessary to have livestock farming
systems that are resilient to the effects of climate change. Resilience focuses on the adaptive
capacity of an ecosystem (Anderies et al., 2013) and therefore the focus of this review will be
to discuss robustness at animal level.
This calls for adaptation in farming systems and strategies using interdisciplinary and
participatory approaches to address the constraints for sustainable production of smallholder
farmers. One such approach is to investigate productivity on three different dimensions namely,
socially, economically and environmentally (Oudshoorn et al., 2012). Interdisciplinary studies
addressing the constraints of smallholder livestock farming systems in South Africa are limited.
Studies done have covered all three dimensions of sustainability, but they have rather focused
on sustainability indicators in relation to specific environments and production systems
(Mahlobo, 2016; Marandure et al., 2016). Indicators covered in such studies include education
levels, gender roles, cost-benefit analyses, market access, rangeland condition as well as the
influence of crop rotation on soil quality (Mahlobo, 2016; Marandure et al., 2016).
Environmental indicators in other literature mainly focus on water derived from precipitation,
ground water pollution, CH4 and CO2 emissions, eutrophication, acidification, change in land
use patterns as well as soil erosion (Van Calker et al., 2008; Lebacq et al., 2013). Even though
biodiversity is mentioned as an indicator, no studies have been done focusing on how to
measure biodiversity on the gene level in animals (which will be further referred to as genetic
diversity) and its impact on production and reproduction traits. Genetic diversity serves as the
raw material to ensure optimum production and reproduction in livestock. The genetic diversity
of smallholder sheep populations in Africa is generally unknown, but is directly related to their
potential for genetic improvement, and indigenous breeds utilized by smallholder farmers are
Stellenbosch University https://scholar.sun.ac.za
16
mostly uncharacterized in terms of their production and reproduction performance. This is due
to the absence of recordkeeping and formal breeding strategies in smallholder farming systems.
Genetic improvement using traditional breeding strategies thus has limited application and the
use of genomic tools can aid in obtaining pedigree information for smallholder sheep flocks.
Genomic tools can also be used to determine genetic diversity as well as to identify causal
variants for traits related to robustness and important for sustainability through employing
genome wide association analyses (GWAS) (Kijas et al., 2012; Demars et al., 2013; Qwabe et
al., 2013).
The objective of this review is to give a brief overview of the indicators important for
sustainable production in ovine resources maintained by smallholder farmers in South Africa
and the constraints to sustainable sheep farming in smallholder production systems. The review
also provides an overview of the genetic traits important for productivity, the role of genomics
in improving these traits and the linkage of these genetic traits to different farming systems in
South Africa.
2.2. Indicators of sustainable productivity of sheep farmers in South
Africa
Most sustainability assessment methods follow a hierarchy where dimensions are at the highest
level. These dimensions can be classified as social, economic and environmental (Oudshoorn
et al., 2012) and indicators can be used to measure them. Sustainability indicators are defined
as variables that provides information on another less accessible variable (Zahm et al., 2007).
2.2.1. Social indicators
The social dimension is often ranked lower than environmental and economic dimensions in
sustainability assessment operations (Omann & Spangenberg, 2002). This could be due the
lack of conceptual clarification of social indicators and how to measure it. Omann and
Stellenbosch University https://scholar.sun.ac.za
17
Spangenberg, (2002) reported that “social scientists had bad experiences in the 1960’s
receiving limited public resonance and been rejected as ideological strait jackets. “The social
dimension also poses questions to the current European development model which is fordistic
in nature (Omann & Spangenberg, 2002). The social dimension however is included as a
framework for more effective environmental strategies (Omann & Spangenberg, 2002). This
dimension has to be considered on the same footing as the other dimensions to avoid bias in
assessments. To date, no consensus exists on what constitutes social sustainability. Various
studies have derived different social sustainability indicators as based on their research
questions. Examples of indicators used to reflect social sustainability in previous studies
include; education level, working conditions and quality of life (Lebacq et al., 2013). Social
sustainability indicators relevant to South Africa’s smallholder livestock production are not
known and warrant investigation. The geo-location of most smallholder farmers was influenced
by the colonial apartheid regime while, their current socio-economic conditions are a result of
policies of both the apartheid government and the new democratic government (Cousins,
2010). Therefore, historic and current events markedly influence the social status of
smallholder farmers. Indicators such as food access, family health status, education level,
access to information and gender equality in decision making were used to assess the
sustainability of the smallholder cattle production system in the Eastern Cape Province of South
Africa (Marandure et al., 2016). It was concluded that the social dimension of the system was
partially sustainable. Other indicators relevant to the social dimension of sustainability include
household well-being, access to clean water and sanitation, participation and belonging in
social organizations and animal welfare among other indicators (Vandamme et al., 2010).
Certain social indicators will only be applicable to specific farming systems, for instance access
to clean water and sanitation might not be a priority in commercial farming systems as this
hurdle is already overcome in these systems. In contrast, such indicators would be of greater
Stellenbosch University https://scholar.sun.ac.za
18
importance for smallholder farming systems in rural communities. It is thus important to first
characterize the farming system before deciding which social indicators are suitable to measure
sustainability.
2.2.2 Economic indicators
Economics refers to the short and long term profitability of a farming system. Indicators used
for this includes net farm income, resource use efficiency and productivity (Lebacq et al.,
2013). Other studies also used total agricultural offtake as an economic indicator (Atanga et
al., 2013). The role of livestock as a direct income source is overridden by socio-cultural roles
for most subsistence farmers (Musemwa et al., 2010). For example, to most resource poor
subsistence farmers without access to formal financial institutions, livestock are maintained as
a form of capital, providing them with savings and offering opportunities for farmers to
accumulate wealth (Coetzee et al., 2005). Swanepoel et al. (2008) also stated that livestock
guarantees financial security and help to finance planned and unplanned expenditure of
smallholder farmers. The latter is more applicable for smallholder cattle farmers, whereas for
smallholder sheep farmers, profit derived from sheep plays an important role. This is true for
the situation in Eastern Cape, Kwa-Zulu Natal and Lesotho where smallholder sheep farmers
mainly farm with Merino type sheep for financial income (Mkhabela, 2013). In the Western
Cape sheep are kept for the production of meat for consumption and for income. Sustainability
indicators based on input-output systems or cost-benefit analyses may thus not directly reflect
subsistence livestock production systems as they do in the profit oriented commercial livestock
sector (Hoffmann, 2011).
2.2.3 Environmental indicators
Indicators used to measure environmental sustainability include CH4 and CO2 emissions,
eutrophication, acidification, groundwater pollution, dehydration of soil and biodiversity, and
Stellenbosch University https://scholar.sun.ac.za
19
the extent of rangeland degradation (Van Calker et al., 2008; Lebacq et al., 2013). These
indicators are widely covered in literature and will not be explicitly covered in this review. In
the literature, biodiversity is used in the broad sense and includes all components of biological
diversity: the variation between animals, plants and micro-organisms including those hosted
by livestock species. South Africa’s landscapes have a diverse biomes including grasslands,
Nama-Karoo and Karoo vegetation types, which are suitable for livestock grazing. However,
these landscape have been reported as overgrazed (Scholtz et al., 2008). Overgrazing results in
a decline in biodiversity of the plant species. This resulted in the grazing of all the palatable
plant species by livestock and the domination of unpalatable plant species(Herrero et al., 2009;
Mahlobo, 2016). A reduction in palatable grass species will compromise the production of
livestock. Low livestock production is linked to reduced income and thus the livelihood of
farmers are compromised.
The biodiversity of livestock breeds are under question as 8% of livestock breeds are extinct
and 21% of livestock breeds are classified as being at risk of extinction (Hoffman, 2011).
Studies on livestock biodiversity as an indicator of sustainability are limited (Hoffmann, 2011).
Attaining genetic diversity within and between livestock species are essential for the
sustainability of life on earth. Considering the potential economic role that indigenous breeds
may have in the future as well as their current cultural value it is crucial to characterise their
genetic diversity. A number of studies have, however, mapped the genetic diversity of major
livestock species in South Africa using molecular markers, including work by Halimani et al.
(2012) on pigs, Mtileni et al. (2011) on poultry and Soma et al. (2012) on sheep. High levels
of genetic diversity have been observed for indigenous sheep genetic resources in South Africa
(Kunene et al., 2007; Hlophe, 2011), thus implicating the potential to use these breeds to
develop sustainable breeding programs for smallholders using genomic tools.
Stellenbosch University https://scholar.sun.ac.za
20
The three dimensions of sustainability are closely interlinked. The environmental dimension,
in this context animal genetic diversity, will influence animal production and thus the economic
dimension. The economic dimension will in turn influence the social dimension. If
reproduction and production is high, income obtained from sheep will be high. This will
positively affect the social dimension of sustainability; where an increased income from
livestock will lead to increased food security and well-being of the farmer. There could
however be negative trade-offs between the dimensions, improved animal production through
intensification can lead to negative impact on the environment as seen in commercial livestock
practices (Vitousek et al., 1997). It is necessary to describe the different sheep farming systems
in South Africa. The suitable indicators for each system to measure sustainability should also
be described. These farming systems have unique problems of sustainability that need to be
addressed.
2.3. Limitations for productivity of sheep farming systems in South Africa
The limitations to productivity for sheep farming systems are driven by the climate, vegetation,
topography and husbandry practices and the political dispensation in which it is found, i.e.
socialism, communism, capitalism or free-market. In South Africa smallholder farmers were
excluded from supplying food to the market prior to 1980 under the Marketing act 1968
(Dzivakwi, 2010). This has led to commercial farmers dominating the market. Often the
influence of the social dimension on the outcome of the farming system is overlooked
(Boogaard et al., 2011).
Due to the political history of South Africa there are different types of smallholder farming
enterprises. Prior to the colonial administration in the 19th century most of the land in South
Africa belonged to black people, this changed in 1913 when 87% of the land were redistributed
to white people and only 13% to black people staying in the homelands (Percival & Homer-
Stellenbosch University https://scholar.sun.ac.za
21
Dixon, 1995). This had a dramatic effect on agriculture in South Africa, which consists of a
relatively small number of commercial farms (though with high output), co-existing with large
numbers of smallholder farms (Organisation for economic co-operation and development
[OECD], 2006). This system has led to many smallholder farmers ending up with marginal
land and resources to farm.
After the 1994 election, black economic empowerment (BEE) actions have been implemented
to further support employment equity. Since then, programs like the Land Redistribution for
Agricultural Development (LRAD) and the Comprehensive Agricultural Support Program
(CASP) have been initiated by the Department of Agriculture, Forestry and Fisheries to assist
in the agricultural development of underprivileged communities. These programs have been
successful in settling 61% of land claims. However, problems have occurred in the land
redistribution process. These problems are linked to farmers receiving land without adequate
training in livestock production, institutional capacity, financial resources and a lack of
agricultural support services to allow these farmers to start up viable farming enterprises.
The socio-political situation in South Africa led to the development of the following farming
systems: 1. Commercial sheep farming system, 2. Emerging sheep farming systems, 3.
Smallholder (small-scale and communal) sheep farming systems. The different farming
systems and their constraints are described in Figure 2.1. To determine the productivity of
smallholder sheep farmers in South Africa, it is necessary to determine which indicators are
relevant to the specific farming system to address these constraints.
Problems of intensive commercial sheep farming systems are related to the effects of
intensification. For commercial farmers the economic dimension is determined by their
profitability which depends on income, efficiency and productivity (Lebacq et al., 2013). To
achieve high profitability, high input and thus high output system is necessary. Sheep breeds
selected for this production system are important, as breeds are required that have high
Stellenbosch University https://scholar.sun.ac.za
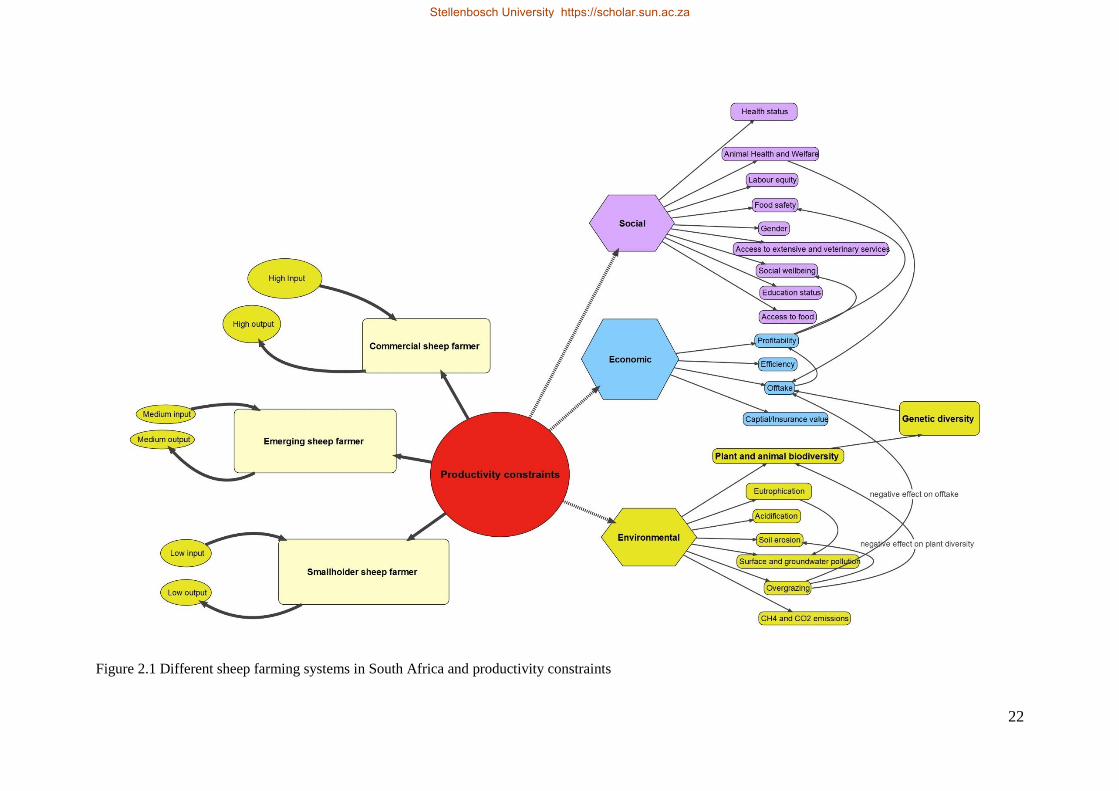
22
Figure 2.1 Different sheep farming systems in South Africa and productivity constraints
Stellenbosch University https://scholar.sun.ac.za
Stellenbosch University https://scholar.sun.ac.za
23
reproduction performance and fast growth rate. Exotic breeds like the Merino type breeds
(Merino, Dohne Merino, South African Mutton Merino and Merino Landsheep) are commonly
used in these systems due to their high prolificacy (Cloete et al., 2003; Cloete et al., 2014).
High stocking rates are maintained to achieve high production levels and have resulted in
overgrazing of land thus resulting in a decrease of plant and animal biodiversity (Vitousek et
al., 1997). The planting of irrigated pastures has led to the use of pesticides and fertilizers
which has affected chemical and physical soil quality as well as added to eutrophication and
acidification of soil and water bodies (Vitousek et al., 1997). Social aspects of commercial
farming systems can be divided into internal social aspects and external social aspects (Lebacq
et al., 2013). The internal social aspects includes gender equality and labour inequity, whereas
the external social aspects include animal health and welfare. For extensive commercial sheep
farmers the economic and social sustainability problems will be similar to those of intensive
sheep enterprises. The environmental problems will be different in terms of the effects of
eutrophication and acidification which will be less in extensive systems due to the use of natural
grazing with little additional planted crops or pastures. The problem of overgrazing and
resultant decrease in plant biodiversity is, however, more applicable to extensive commercial
and smallholder communal sheep farming systems.
Smallholder sheep farmers in South Africa depend on low-input systems. Smallholder-
commercial farmers are in a transition phase between subsistence and commercial farming
operations and are commonly referred to as emerging farmers in South Africa. The economic
problems for communal (smallholder subsistence) farmers include offtake rate and income
derived from offtake. Offtake rate can be defined as the proportion of animals sold or consumed
within a year (Otte & Chilonde, 2002). Smallholder farmers also depend on the capital
value/insurance value of their sheep as well as on offtake. Therefore owning a large flock of
mainly adult sheep may serve as an indicator of wealth and liquid asset for use to meet family
Stellenbosch University https://scholar.sun.ac.za
24
emergencies. Offtake rate for smallholder farmers has been reported to be low (Motiang &
Webb, 2016). Low offtake rate can be linked to the low production performance (Grobler,
2010). Internal social issues are for smallholder farmers includes social wellbeing, education
levels, health status (which can be compromised through contact with zoonotic diseases),
gender equity, access to food, food safety and access to information, extension and veterinary
services. Environmental problems include water resources and land available for grazing, sheep
resources used (animal biodiversity) and plant biodiversity. Smallholder sheep farmers have
sheep genetic resources that are highly genetically diverse (Hlophe, 2011; Soma et al., 2012).
These resources, however, exhibit low production performance levels.
Enhancing production performance in commercial sheep flocks has been achieved by altering
genetic diversity of the breeding flock using various breeding techniques, including
linebreeding (decreasing genetic diversity in a flock) and crossbreeding (increasing genetic
diversity in a flock) as well as selection for traits of economic importance. Formulation of feeds
that have a high feed conversion ratio to improve growth rate has also been used to enhance
production. The use of vaccinations and antibiotics to treat diseases, as well as the use of
reproductive technology such as synchronisation of ewes and superovulation to increase
number of lambs born per ewe. Low production performance of sheep kept by smallholder
farmers in low input farming systems can be improved using similar genetic strategies as in the
commercial set-up. It is, however, important to ensure that the accumulation of deleterious loci
through the effect of genetic erosion and inbreeding is limited.
Stellenbosch University https://scholar.sun.ac.za
25
2.4. The importance of genetic diversity for sustainable genetic
improvement
2.4.1. Genetic variability for adaptability and robustness
Genetic diversity can be defined as the genetic variation at neutral or adaptive loci of a
population or species (Holderegger et al., 2006). Neutral genetic diversity is gene variants
detected that do not have a direct effect on fitness. This is measured by molecular techniques
using neutral markers for instance random amplified polymorphic DNA (RAPDs), amplified
fragment length polymorphism (AFLP) and microsatellites to estimate parameters such as
heterozygosity and homozygosity (Holderegger et al., 2006). Adaptive genetic diversity refers
to genes that have an effect on fitness; this can be measured using quantitative genetic
experiments to estimate parameters such as heritability (h2) and genetic variance. In the context
of this study genetic diversity studied will focus on using neutral genetic variation in
combination with adaptive genetic diversity at breed level.
Genetic diversity within a gene pool is linked to the robustness of the animals (Goddard, 2009;
Bijlsma & Loeschcke, 2012). Robustness can be defined as the ability of an animal to adapt to
challenging environmental conditions (Goddard, 2009). This entails the ability of the animal
to survive, reproduce and maintain homeostasis without losing body condition when exposed
to adverse conditions (Knap, 2005; Star et al., 2008). Robustness encompass a group of traits
enabling animals to adapt and includes several reproduction and survival traits such as disease
and parasite resistance, heat tolerance and drought tolerance (Knap, 2005). Reproduction and
survival traits in livestock are known to be lowly heritable and in spite of this genetic progress
have been possible over 20 years of selection in South African sheep flocks (Schoeman et al.,
2010). This indicates the possibility of using adaptive genetic variation to improve robustness
traits in South African sheep flocks.
Stellenbosch University https://scholar.sun.ac.za
26
2.4.2. Genetic diversity of indigenous breeds
Smallholder subsistence farmers make use of indigenous breeds that are more hardy or robust
(Snyman et al., 2005; Cloete et al., 2013; Cloete et al., 2016). Indigenous breeds are sometimes
crossed randomly without prior knowledge of pedigree or selection for specific traits.
Indigenous Nguni sheep breeds have been shown to have a higher genetic diversity than
Merinos using RAPD markers (Hlophe, 2011). Studies done on the indigenous Namaqua
Afrikaner proves them more tick resistant than the South African Mutton Merino (SAMM) and
Dorper (Cloete et al., 2013). The indigenous Namaqua Afrikaner achieved higher survival from
birth to weaning (91%) in comparison to the Dorper (88%) (Snyman et al., 2005). A recent
study reported that the number of lambs weaned was highest for indigenous Namaqua
Afrikaner compared to the Dorper and South African Mutton Merino (Cloete et al., 2016).
These results imply robustness in terms of survival, reproduction and disease/parasite
resistance of indigenous breeds. The trade-off with indigenous breeds are that their carcass
yield is inferior to those of commercial breeds. This was proven true for the indigenous
Namaqua Afrikaner breed (Burger et al., 2013). Genetic diversity studies have reported low
heterozygosity levels within the indigenous Namaqua Afrikaner breed (Sandenbergh et al.,
2016). The low levels of heterozygosity for this breed could be linked to its small effective
population size (Ne). Effective population size can be defined as the number of individuals
who contribute to the next generation. Low levels of heterozygosity have also been reported in
other indigenous fat rumped sheep (Black headed Persian and Red head Speckled Persian)
whereas other indigenous fat tailed sheep (Pedi, Swazi and Zulu) sheep obtained higher levels
of genetic diversity (Soma et al., 2012). The reason for these higher levels of diversity could
be resultant of some level of crossbreeding in these populations. It is, however, interesting to
note that even though the Namaqua Afrikaner have high inbreeding levels their robustness
Stellenbosch University https://scholar.sun.ac.za
27
traits have not been negatively affected. This could be due to the impact of natural selection on
adaptation traits.
2.4.3. Genetic diversity of commercial breeds in South Africa
Commercial sheep enterprises utilize exotic and synthetic breeds that have been purebred and
selected for certain phenotypic traits, like colour and size, for example, in the Dorper breed
(Olivier & Cloete, 2006). These purebreds may accumulate homozygous loci for deleterious
genes over time and become inbred, which can result in reduced fitness, poor survival and low
reproduction (Goddard, 2009). Commercial breeds are known to have a lower genetic diversity
than smallholder populations. Inbreeding in the Danish Texel population has led to a reduction
in birthweight, average daily gain and litter size (Norberg & Sørensen, 2007). The use of
artificial insemination or the use of one ram of high genetic merit, resulted in a reduced
effective population size (Ne), leading to higher inbreeding rates and resulted in a loss of
genetic diversity and reproductive fitness. A decrease of genetic diversity through linebreeding
and artificial selection has, however, resulted in increased growth and production traits in
exotic sheep breeds (Swanepoel et al., 2007; Van Wyk et al., 2009). Inbreeding percentage
should be kept below 20-25% in sheep flocks to prevent inbreeding depression. Higher
inbreeding rates have led to economic losses of $17 per ewe and where inbreeding approached
50% up to $36 per ewe (Erkanbrack & Knight, 1991).
2.4.4. Is fitness always good if genetic diversity is high?
The fact that the Namaqua Afrikaner, Black headed Persian and Red head Speckled Persian
have low genetic diversity and still are more robust than exotic breeds (Soma et al., 2012) is a
paradox to the notion that higher levels of genetic diversity are linked to robustness and fitness
(Goddard, 2009). The reason for this paradox is unclear and leaves us with the question: ‘Is
fitness always good if genetic diversity is high?’ Reed & Frankham (2003) postulated that
Stellenbosch University https://scholar.sun.ac.za
28
selection can purge a population of deleterious recessive alleles and in theory can create inbred
populations with a higher fitness. This phenomena of the Namaqua Afrikaner sheep breed
could also be explained by the fact that the neutral genetic diversity measures were used to
estimate heterozygosity levels within these breeds and thus only refer to gene variants that do
not have a direct effect on fitness.
Characterization of traits relevant for sustainability of the specific sheep farming systems is the
next step.
2.5. Genetic traits important for sustainable production performance
Traits of importance to ensure enhanced production includes reproduction, survival and
production traits (Table 2.1). Reproduction is a composite traits and can be measured by
component traits such as number of lambs born per ewe’s lifetime, or number of lambs weaned
per ewe lifetime, litter size, conception rate, lamb survival and mothering ability (Zishiri et al.,
2013). The wet-dry phenotype (Fourie & Cloete, 1993) is recorded from an udder examination
performed during the marking of recently born lambs or at the weaning of lambs. Wet-dry
refers to whether a ewe is lactating or not, and can be used as an indicator of reproductive
performance of ewes in low-input farming systems. Heritabilities estimated in Australian
Merino flocks ranged from 0.09 to 0.17 for wet-dry at weaning and 0.04 to 0.11 when at lamb
marking (Lee et al., 2010). The wet-dry phenotype is a composite trait and includes both
conception rate and mothering ability. Heritability estimates for the component trait conception
rate ranges from 0.01 to 0.30 (Iniguez et al., 1986; Tosh et al., 2002; Piwczyński &
Kowaliszyn, 2013). Estimates for number of lambs born and number of lambs weaned were
0.05 to 0.10 and 0.05 to 0.07, respectively (Safari et al., 2005; Safari et al., 2007). Survival
traits in sheep can be measured by survival from birth to weaning. Heritability estimates
reported for lamb survival were 0.03 to 0.07 (Safari et al., 2005; Bunter & Brown, 2015).
Stellenbosch University https://scholar.sun.ac.za
29
Weaning of lambs occurs at approximately 100 days of age in commercial intensive sheep
farming systems. Survival in exotic breeds under harsh conditions are known to be lower than
in indigenous breeds. Disease and pathogen resistance are other important traits to consider for
sustainability. Studies reported on traits linked to disease resistance in sheep include faecal egg
worm count (FEC) as an indicator for resistance to helminth nematodes (Safari et al., 2005;
Huisman & Brown, 2009), resilience to nematodes, foot rot and pneumonia (Morris, 2009) as
well as tick resistance (Cloete et al., 2016). Heritability estimates for FEC were in the range of
0.25-0.28 (Huisman & Brown, 2009) and ranged between 0.07-0.59 for tick resistance (Grova
et al., 2014; Cloete et al., 2016). Estimates depended on the model used to estimate heritability
as well as the body location from which ticks were sampled.
Important growth related traits to select for include birth weight, weaning weight, body
condition score (BCS), average daily gain, feed conversion efficiency and adult weight (Safari
et al., 2005) as well as carcass traits such as fat depth and eye muscle depth (Huisman & Brown,
2009). Heritability estimates for growth and carcass traits are moderate to high, with estimates
of 0.30-0.41 for adult weight and 0.20 for carcass traits (Huisman & Brown, 2009). Heritability
estimates for BCS ranged from 0.16 for BCS during mid-pregnancy and 0.18 for BCS two
weeks before lambing (Everett-Hincks & Dodds, 2008). Early growth traits like birth weight
and whether or not a lamb was born as single, twin or multiple are important for survival and
future growth of an animal, as they are correlated to survival and post-weaning growth
performance (Matika et al., 2003). Research has shown that birth weight affects survival of
lambs, where low birth weight (<3kg) leads to high mortalities because of starvation and
exposure (Everett-Hincks & Dodds, 2008) and high birth weight (>6kg) leads to high
mortalities because of dystocia (Brand et al., 1985). Dystocia is defined as difficulty in giving
birth due to a large fetus. To obtain maximal survival of lambs, optimum birth weights should
be targeted, ranging between 3 and 6 kg. The abovementioned research was done on
Stellenbosch University https://scholar.sun.ac.za
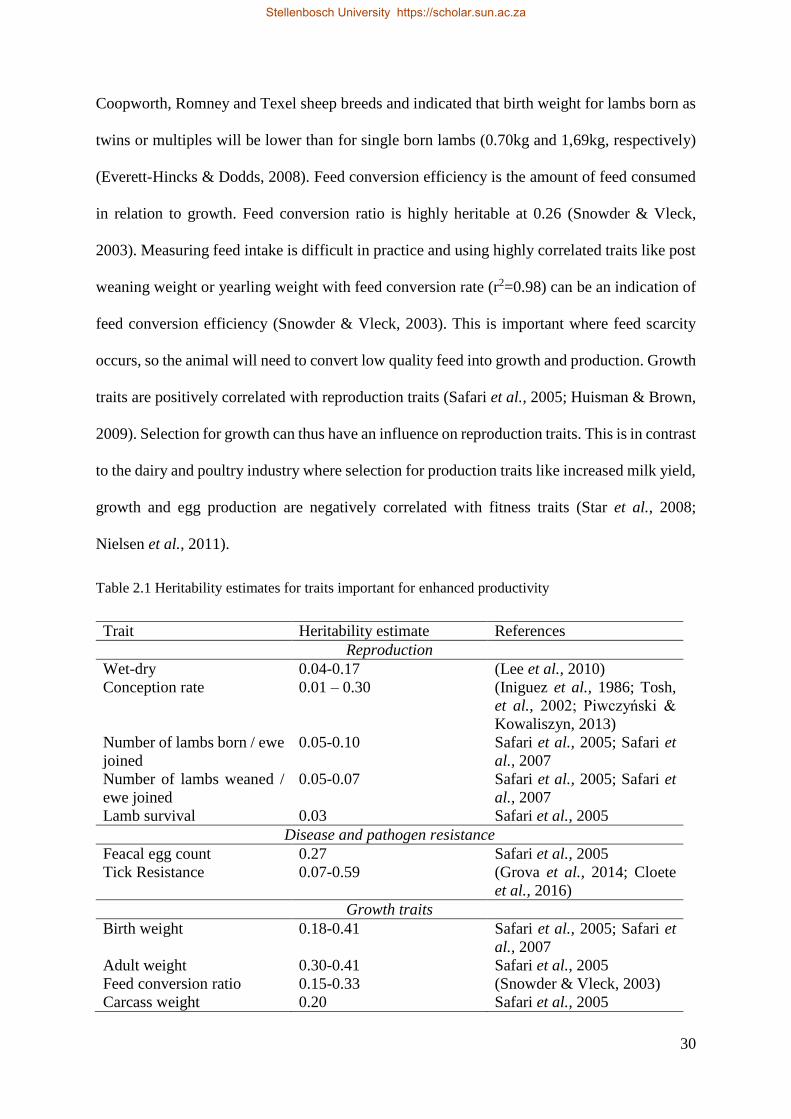
30
Coopworth, Romney and Texel sheep breeds and indicated that birth weight for lambs born as
twins or multiples will be lower than for single born lambs (0.70kg and 1,69kg, respectively)
(Everett-Hincks & Dodds, 2008). Feed conversion efficiency is the amount of feed consumed
in relation to growth. Feed conversion ratio is highly heritable at 0.26 (Snowder & Vleck,
2003). Measuring feed intake is difficult in practice and using highly correlated traits like post
weaning weight or yearling weight with feed conversion rate (r2=0.98) can be an indication of
feed conversion efficiency (Snowder & Vleck, 2003). This is important where feed scarcity
occurs, so the animal will need to convert low quality feed into growth and production. Growth
traits are positively correlated with reproduction traits (Safari et al., 2005; Huisman & Brown,
2009). Selection for growth can thus have an influence on reproduction traits. This is in contrast
to the dairy and poultry industry where selection for production traits like increased milk yield,
growth and egg production are negatively correlated with fitness traits (Star et al., 2008;
Nielsen et al., 2011).
Table 2.1 Heritability estimates for traits important for enhanced productivity
Trait Heritability estimate References
Reproduction
Wet-dry 0.04-0.17 (Lee et al., 2010)
Conception rate 0.01 – 0.30 (Iniguez et al., 1986; Tosh,
et al., 2002; Piwczyński &
Kowaliszyn, 2013)
Number of lambs born / ewe
joined
0.05-0.10 Safari et al., 2005; Safari et
al., 2007
Number of lambs weaned /
ewe joined
0.05-0.07 Safari et al., 2005; Safari et
al., 2007
Lamb survival 0.03 Safari et al., 2005
Disease and pathogen resistance
Feacal egg count 0.27 Safari et al., 2005
Tick Resistance 0.07-0.59 (Grova et al., 2014; Cloete
et al., 2016)
Growth traits
Birth weight 0.18-0.41 Safari et al., 2005; Safari et
al., 2007
Adult weight 0.30-0.41 Safari et al., 2005
Feed conversion ratio 0.15-0.33 (Snowder & Vleck, 2003)
Carcass weight 0.20 Safari et al., 2005
Stellenbosch University https://scholar.sun.ac.za
31
Quantifying and measuring fitness traits in smallholder production systems can be challenging
due to lack of recordkeeping. It is therefore necessary to measure indicator traits that involve
minimal recordkeeping and input costs for example “wet and dry” phenotype as in indicator of
reproduction in smallholder sheep farming systems. Smallholder farmers can also implement
body condition scoring as a management tool to improve ovulation rate and hence reproduction
performance in flocks. However, all of the abovementioned traits are important for sustainable
sheep production for both smallholder and commercial producers and emphasis of selection for
traits to include in the breeding objective would need to be different for different farming
systems. Emphasis could be placed according to the input-output of the farming system, as well
as the geographical location of the farm. For high input-high output farming systems located
in high rainfall geographical regions of South Africa; growth, carcass and reproduction traits
could be the main emphasis. In low input- low output farming systems located in drier arid
regions of South Africa; survival, disease/pathogen resistance, reproduction and adaptability
could be of higher importance. Farmers should include traits for sustainability applicable to
their sheep farming system in their breeding objectives to enable genetic improvement. Gizaw
et al., (2010) used a desired-gain selection index to derive relative weights for traits resulting
in gains desired by subsistence sheep farmers in Ethiopia. Another means of prioritizing traits
of importance could be by adding non market value to the market value of traits (Nielsen &
Christensen, 2006). Non market value entails a value given to a trait that is not reflected in the
current market economy or that is partly transferred by the market (Nielsen & Christensen,
2006). No studies have been done in South Africa to identify traits of preference for smallholder
sheep farmers to include in breeding objectives. The first step will be to start with identifying
traits of sustainability for smallholder farmers, and secondly to set up a recordkeeping system
for these traits. Once phenotyping has been established the use of genomics can be combined
Stellenbosch University https://scholar.sun.ac.za
32
with traditional selection and crossbreeding strategies to increase genetic gain. The
contribution of indigenous breeds in smallholder sheep farming systems also need to be
investigated.
2.6. Indigenous breeds in smallholder sheep farming systems
Using indigenous breeds in smallholder sheep farming systems can decrease the costs of input
related to additional feed or medicine. Meat output and thus income received per kg will be
less because of their inferior growth and carcass traits. The trade-offs between robustness and
carcass traits of indigenous breeds needs to be considered when suggesting these breeds to
improve economic sustainability of the smallholder sheep farming systems. Structured
breeding programs can be developed where indigenous breeds are crossed with exotic breeds
to improve genetic diversity. Examples of this being achieved include composites like the
Meatmaster and Van Rooy which were derived from crosses between the indigenous breeds
like the Damara / Ronderib Afrikaner and exotic breeds like the Ile de France, Dorper, and SA
Mutton Merino (Peters et al., 2010; Soma et al., 2012). A terminal crossbreeding system can
be an option, where all the F1 offspring are sold as slaughter lamb (Cloete et al., 2003). The
benefits of a terminal crossbreeding arise through the effects of F1 hybrid vigour and
complementarity, which can lead to an immediate improvement in the desired growth and
reproduction traits (Roux, 1992). Sexual dimorphism is when large offspring is obtained from
small breeding animals (Roux, 1992). This could be of benefit to the smallholder farmer as
more carcass yield can be obtained from F1 offspring. This can thus add value in ensuring a
higher income to the farmer. Studies of crossbreeding Red Massai (indigenous breed to Kenya)
with a Dorper has shown the possible effects of improving resistance to gastro-intestinal
parasites (Baker et al., 2003). Another option to improve production performance of indigenous
breeds would be increase selection for desired traits using genomic selection. Selection for
improved robustness or production traits will reduce genetic diversity in a population.
Stellenbosch University https://scholar.sun.ac.za
33
However, the reduction in diversity will be gradual over a number of generations (Schoeman
et al., 2010). This is due to the additive effect of genes using traditional selection methods,
where the effect will be cumulative. Crossbreeding on the other hand is using non-additive
genetic effects to produce immediate desirable results in terms of production performance.
2.7. Applying genomics to improve traits important for sustainable
farming systems
2.7.1. Identifying causal variants
2.7.1.1 Genome-wide association analysis
Before the advent of high throughput technology, marker assisted selection were explored with
the study of markers and their linkage to specific quantitative trait loci (QTL) responsible for
phenotypic expression (Williams, 2005). These markers were used to construct genetic and
physical maps of genomes of livestock species (Williams, 2005). Different genetic markers
were used for marker assisted selection; includes RAPD, AFLP, restriction fragment length
polymorphism (RFLP), microsatellites and single nucleotide polymorphism (SNP). Single
nucleotide polymorphisms have become the marker of choice for genotyping and genotyping
platforms are available for ovine species. This includes the 12K SNP chip for parentage
determination (Heaton et al., 2014) and genotyping replacements at a low cost, 50K SNP chip
(Kijas et al., 2009, Kijas et al., 2012) and recently the 600K SNP chip (Anderson et al., 2014).
The heritability estimates for reproduction and survival traits range from low to medium,
whereas estimates for production traits range from medium to high. The use of genomics will
be of benefit to the traits that are lowly heritable and expressed later in an animal’s life (Kijas
et al., 2012). This will enable the ability to predict a ram/ewes performance for a specific trait
at an early age and so increase genetic gain (Kijas et al., 2012). Genomic tools can help to
further elucidate differences between indigenous breeds and exotic breeds in term of
Stellenbosch University https://scholar.sun.ac.za
34
reproduction and production traits. This can be done using different methods, for example,
studying the genetic diversity and population structure of sheep. This serves as a backbone for
genome wide association studies (GWAS) that can be used to associate phenotypes with causal
variants (Liandris et al., 2012; Demars et al., 2013). Causal variants have been identified for
various traits important for sustainability including reproduction (Demars et al., 2013),
gastrointestinal parasite resistance (Riggio et al., 2013), growth and meat production (Zhang
et al., 2013, 2016), wool traits (Wang et al., 2014) and adaptation in extreme environments
(Yang et al., 2016) (Table 2.2). Causal variants linked to litter size (prolificacy) were growth
differential factor (GDF9), bone morphogenetic protein 15 (BMP15), bone morphogenetic
protein receptor 1B (BMPR1B) (FecB allele) and beta-1,4-N-acetyl-galactosaminyl-
transferase 2 (B4GALNT2) (Abdoli et al., 2016). GDF 9 is an autosomal gene and is located
on chromosome 5 and BMP15 is located on the X-chromosome. BMPR1B is located on
chromosome 6 and have six different mutations for this gene, whereas B4GALNT2 is located
on chromosome 11. Faecal egg count (FEC) is used to measure resistance to gastrointestinal
parasites in sheep, and the causal variants for FEC using a genome wide association study were
found on chromosome 14 (linked to Nematodrius average animal effect) and chromosome 6
(Strongyles FEC at 16 weeks) (Riggio et al., 2013). Various other genes have been linked to
host resistance to different gastrointestinal parasites (Haemonchos contortus, Teladorsagia
circumcinta and Trichostrongylus colubriformis) (Benavides et al., 2016). These genes were
found on chromosomes, 1, 3, 6 and 20 and were linked to the immune system, mucosal
protection and haemostasis. Genes that have been reported to influence carcass traits, include
callipage, myostatin and carwell (Cockett et al., 2005; Miar et al., 2014). Another study using
three different sheep breeds to determine causal variants for growth and meat traits observed
significant loci within chromosome 3, 5 and 9 linked to post weaning gain (Zhang et al., 2013)
(Table 2). Causal variants TSPEAR (thrombospondin-type laminin G domain and EAR repeat),
Stellenbosch University https://scholar.sun.ac.za
35
KRTCAP3 (expressed in the skin keratinocytes) and KIF16B (kinesin family member 16B)
influencing wool traits such as fiber diameter, fiber diameter CV and fineness dispersion were
confirmed in Chinese Merino sheep breeds (Wang et al., 2014). Whole genome sequencing has
been used to identify genes related to adaptation traits in sheep adapted to different
environments in Tibetan plateau and Taklimakan desert region in Asia (Yang et al., 2016). The
abovementioned causal variants are only examples of the abundances of genes already
identified in literature.
Sheep can be screened for causal variants using assays consisting of primers of genes related
to specific traits of interest. This was done in the study of Liandris et al. (2012) using PCR-
RFLP to verify the presence of the GDF9 and FecB within two Greek sheep breeds. Following
screening for causal variants, introgression of individuals carrying favorable loci into sheep
flocks lacking these loci can occur. Successful introgression of the FecB mutation in
smallholder sheep flocks in India has been reported which resulted in increased number of live
born lambs and lamb survival (Nimbkar et al., 2003).
The issue to bear in mind with GWAS studies is that quantitative traits are more likely to be
influenced by many loci of small to medium effect acting on the expression of one trait, than
few loci of major effect. Another issue is that the SNPs included on a chip for GWAS are not
the causal variants for the phenotype but are associated with the phenotype because they are in
linkage disequilibrium (LD) with the causal variant (Wray et al., 2013). Thus the variation
explained by causal variants is not completely explained by the genotyped SNPs. Causal
variants identified will be different in terms of breeds studied and their environment they have
adapted to, as seen in a recent study in South African Merino where the major genes for
reproduction (GDF9, BMP15, BMPR1B and B4GALNT2) have not been confirmed. Therefore
in attempt to create SNP panels for genetic improvement in smallholder sheep flocks it is
important to first verify the presence of the causal variants for relevant traits within that flock.
Stellenbosch University https://scholar.sun.ac.za
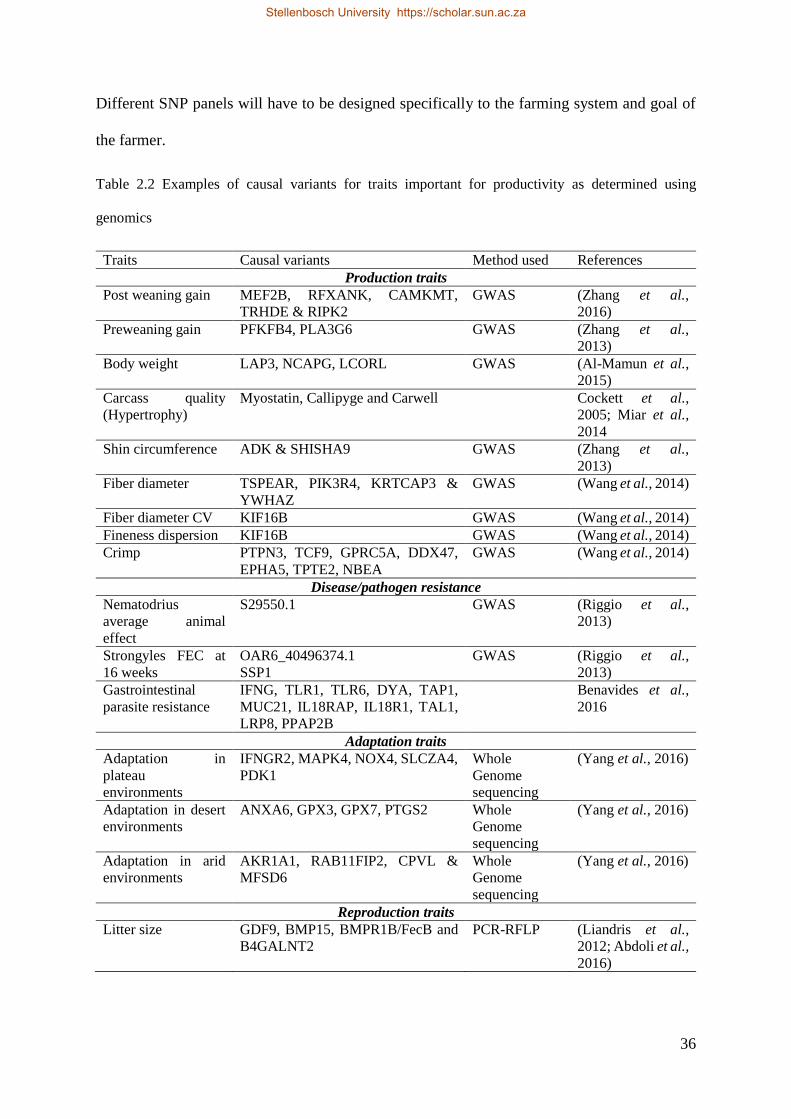
36
Different SNP panels will have to be designed specifically to the farming system and goal of
the farmer.
Table 2.2 Examples of causal variants for traits important for productivity as determined using
genomics
Traits Causal variants Method used References
Production traits
Post weaning gain MEF2B, RFXANK, CAMKMT,
TRHDE & RIPK2
GWAS (Zhang et al.,
2016)
Preweaning gain PFKFB4, PLA3G6 GWAS (Zhang et al.,
2013)
Body weight LAP3, NCAPG, LCORL GWAS (Al-Mamun et al.,
2015)
Carcass quality
(Hypertrophy)
Myostatin, Callipyge and Carwell Cockett et al.,
2005; Miar et al.,
2014
Shin circumference ADK & SHISHA9 GWAS (Zhang et al.,
2013)
Fiber diameter TSPEAR, PIK3R4, KRTCAP3 &
YWHAZ
GWAS (Wang et al., 2014)
Fiber diameter CV KIF16B GWAS (Wang et al., 2014)
Fineness dispersion KIF16B GWAS (Wang et al., 2014)
Crimp PTPN3, TCF9, GPRC5A, DDX47,
EPHA5, TPTE2, NBEA
GWAS (Wang et al., 2014)
Disease/pathogen resistance
Nematodrius
average animal
effect
S29550.1 GWAS (Riggio et al.,
2013)
Strongyles FEC at
16 weeks
OAR6_40496374.1
SSP1
GWAS (Riggio et al.,
2013)
Gastrointestinal
parasite resistance
IFNG, TLR1, TLR6, DYA, TAP1,
MUC21, IL18RAP, IL18R1, TAL1,
LRP8, PPAP2B
Benavides et al.,
2016
Adaptation traits
Adaptation in
plateau
environments
IFNGR2, MAPK4, NOX4, SLCZA4,
PDK1
Whole
Genome
sequencing
(Yang et al., 2016)
Adaptation in desert
environments
ANXA6, GPX3, GPX7, PTGS2 Whole
Genome
sequencing
(Yang et al., 2016)
Adaptation in arid
environments
AKR1A1, RAB11FIP2, CPVL &
MFSD6
Whole
Genome
sequencing
(Yang et al., 2016)
Reproduction traits
Litter size GDF9, BMP15, BMPR1B/FecB and
B4GALNT2
PCR-RFLP (Liandris et al.,
2012; Abdoli et al.,
2016)
Stellenbosch University https://scholar.sun.ac.za
37
2.7.1.2. Selection sweeps
Another approach to identify causal variants for phenotypes is the technique selections
signatures. Selection signatures are used to determine selection patterns in populations. It is a
backward approach inferring selected mutations with their associated phenotypes (Ross-Ibarra
et al., 2007). Different methods are used to detect selection signatures in populations, which
includes the Fst and more recently FLK approach (Fariello et al., 2013). Kijas et al., 2012 used
the Fst approach to determine selection signatures in sheep populations and found 31 genomic
regions under selection. These regions were associated with coat pigmentation, skeletal
morphology, body size, growth and reproduction. A study using HAPFLK using the same
HAPMAP dataset observed 41 selection signatures with only 10 regions overlapping with the
study of Kijas et al., 2012 (Fariello et al., 2014). Selection signature studies are thus important
to determine selection for traits of economic importance in livestock. It has also been widely
used in several studies to determine regions under selection in different livestock species
including beef, goats and pigs (Ramey et al., 2013; Ai et al., 2013; Ma et al., 2015; Kim et al.,
2016).
2.7.2. Genomic selection
Genomic selection is another tool that can be used to improve genetic gain in sheep flocks. The
inclusion of genotypic data based on genetic markers and specifically SNP’s can allow the
estimation of genomically enhanced estimated breeding values (GEBV’s). Genomic selection
involves the use of phenotypic and genotype records to derive GEBV’s for traits of economic
importance. Studies have shown that using genomic best linear unbiased prediction (GBLUP)
for the number of lambs weaned in sheep is more accurate than only using best linear unbiased
prediction (BLUP) (Daetwyler et al., 2012). For this to be possible an appropriate reference
population must be established (Daetwyler et al., 2012). A reference population must be fully
phenotyped, genotyped, and representative of the population herds/flocks to be predicted.
Stellenbosch University https://scholar.sun.ac.za
38
Genomic prediction can be advantageous over pedigree selection when individuals are less
related as well as if multi-breed populations are used as reference populations (Daetwyler et
al., 2012). It was established recently that the use of a multi-breed reference population results
in less accurate GEBV’s than using smaller single-breed populations (Legarra et al., 2014).
Studies on genomic selection in sheep indicated molecular markers can be used to improve
selection accuracy (Van der Werf, 2009; Duchemin et al., 2012). Thus, combining traditional
animal breeding and genomics may increase productivity, sustainability and economic viability
achieved by animal improvement. There is scope to apply genomic selection to smallholder
conditions, where no pedigree information is available and where reference populations are
small. Phenotypic information on the trait of economic importance, whether it be reproduction
or growth traits is necessary to successfully achieve this. This could enable the estimation of
SNP heritabilities for traits related to sustainability for smallholder farmers such as number of
lambs weaned, disease/pathogen resistance, survival, feed conversion efficiency and growth.
SNP heritabilities have been estimated for “wet-dry” trait for smallholder sheep farmers in
South Africa. The challenges of implementing this approach for genetic improvement in
smallholder systems is the availability of phenotypic data. Obtaining reliable records for traits
of economic relevance of an appropriate reference population needs to be addressed. Efforts
should be concerted in the development of breeding schemes that allows the recording of traits
important for sustainability. Another challenge would be the genotyping costs involved.
Genotyping costs per individual using the 50K SNP chip are 73 Euro (Geneseek, 2015).
However, these costs have been predicted to decrease in the future (Cloete et al., 2014).
2.7.3. Willingness and means for recording of phenotypes
Recording of phenotypes to include in selection indices and genomic selection is of importance
for genetic improvement. This is one of the major challenges for smallholder and even
commercial sheep farmers in South Africa due to the extensive nature of sheep farming
Stellenbosch University https://scholar.sun.ac.za
39
systems. The availability of the national small stock improvement scheme (NSIS) makes it
possible for registered stud farmers and commercial sheep farmers to participate in genetic
improvement programs (Schoeman et al., 2010; Cloete et al., 2014). The question, however, is
how do we encourage the smallholder farmer to participate in recordkeeping? A study done in
Malawi indicated that smallholder farmers’ main three reasons for not participating in record
keeping were, ‘busy with other activities’, ‘lack of knowledge’ and ‘lack of education’
(Chagunda et al., 2006). The study also indicated that recordkeeping were influenced by
recording equipment available and herd/flock size. This could be circumvented by the wide
availability and usage of smartphones to use as recording equipment. A recent study done in
Limpopo, South Africa, indicated that smallholder farmers regularly use smart phones to share
information and that a recording application could be developed for use on smart phones
(Mapiye, 2017). Recordkeeping systems have been developed using information and
communication (ICT) technologies in Kenya (Irungu et al., 2015).
2.8. Summary
Addressing sustainability issues of smallholder sheep systems is complex and indicators should
be chosen based on the farming goals and the intensity of input-output in the system. A system
sustainable for a subsistence smallholder farmer may not be equally sustainable for a
commercial smallholder sheep farmer. The type of genetic resources used in a farming system
plays an important role in sustainability. Maintaining genetic diversity while selecting for
genetic improvement in smallholder flocks is, however, crucial. Indigenous breeds as an
important genetic resource is poorly benchmarked for growth and reproduction performance
against commercial breeds thus requiring further research. Choosing the relevant fitness traits
to select for is dependent on the geographical location and farming system. Breeding objectives
can be developed based on farmers’ preference for traits using it as weight to add non market
value in the selection index. It is possible to use genomics to improve genetic traits important
Stellenbosch University https://scholar.sun.ac.za
40
for sustainability. For commercial sheep farmers emphasis will be on improving adaptation
traits of exotic breeds, whereas for smallholder subsistence farmers the emphasis would be to
improve production traits. This can, in theory, be achieved once successful genotyping or
whole genome sequencing have been completed on all sheep resources (both commercial and
indigenous) in South Africa. Then this information can be used to screen both smallholder and
commercial sheep flocks for the presence/absence of causal variants related to specific traits of
interest to sustainability. Sheep that are positive for the causal variants can then be introgressed
into sheep flocks that lack those specific genes necessary to improve both production and
robustness through crossbreeding strategies. Genomic selection can also be used to increase
genetic gain in smallholder sheep flocks. The limitation, however, is lack of recordkeeping
systems and breeding schemes in smallholder sheep farming systems and the costs of
genotyping smallholder farming genetic resources. This can potentially be overcome by the
collaboration of government, research institutions, higher education and private companies to
act as funding bodies for sustainability projects.
2.9 References
Abdoli, R., Zamani, P., Mirhoseini, S.Z., Ghavi Hossein-Zadeh, N. & Nadri, S., 2016. A
Review on Prolificacy Genes in Sheep. Reprod. Domest. Anim. 51, 631–637.
Ai, H., Huang, L. & Ren, J., 2013. Genetic diversity, linkage disequilibrium and selection
signatures in Chinese and Western pigs revealed by genome-wide SNP markers. PLoS
ONE, 8, e56001.
Al-Mamun, H.A., Clark, S., Kwan, P. & Gondro, C., 2015. ‘Genome-wide linkage
disequilibrium and genetic diversity in five populations of Australian domestic sheep.’,
Genet. Sel. Evol. 47, 90–104. doi: 10.1186/s12711-015-0169-6.
Stellenbosch University https://scholar.sun.ac.za
41
Almeida, A.M., 2011. The Damara in the context of Southern Africa fat-tailed sheep breeds.
Trop. Anim. Health Prod. 43, 1427–1441. doi: 10.1007/s11250-011-9868-3.
Anderies, J.M., Folke, C., Walker, B. & Ostrom, E., 2013. Aligning Key Concepts for Global
Change Policy: Robustness, Resilience and Sustainability. Ecol. Soc. 18, 8–24. doi:
10.5751/es-05178-180208.
Atanga, N.L.;Treydte, A.C. & Birner, R., 2013. Assessing the sustainability of different small-
scale livestock production systems in the Afar Region, Ethiopia. Land 2,726–755.
Baker, R., Nagda, S., Rodriguez-Zas, S., Southey, B., Audho, J., Aduda, E. & Thorpe, W.,
2003. Resistance and resilience to gastro-intestinal nematode parasites and
relationships with productivity of Red Maasai, Dorper and Red Maasai ✕ Dorper
crossbred lambs in the sub-humid tropics. Anim. Sci. 76,119–136.
Bijlsma, R. & Loeschcke, V., 2012. Genetic erosion impedes adaptive responses to stressful
environments. Evol. Appl. 5, 117–129.
Boogaard, B.K., Oosting, S.J., Bock, B.B. & Wiskerke, J.S.C., 2011. The sociocultural
sustainability of livestock farming: an inquiry into social perceptions of dairy farming.
Animal: an international journal of animal bioscience, 5, 1458–1466.
Brand, A.A., Cloete, S.W.P. & De Villiers, T.T., 1985. Factors that influence mortality
amongst lambs in the Elsenburg Dormer and SA Mutton Merino flocks. S. Afr. J. Anim.
Sci. 15, 155–161.
Brown, B., Hanson, M., Liverman, D. & Merideth, R., 1987. Global sustainability: Toward
definition, Environ. Managem. 11, 713–719.
Bunter, K.L. & Brown, D.J., 2015. Yearling and Adult Expression of Reproduction in Maternal
Stellenbosch University https://scholar.sun.ac.za
42
Sheep Breeds are Genetically Diffferent Traits. Proc. Assoc. Adv. Anim. Breed. Genet.
20, 82–85.
Burger, A., Hoffman, L.C., Cloete, J.J.E., Muller, M. & Cloete, S.W.P., 2013. Carcass
composition of Namaqua Afrikaner, Dorper and SA mutton merino ram lambs reared
under extensive conditions. S. Afr. J. Anim. Sci. 43, S27-S32
Chagunda, M.G.G., Msiska, A.C.M., Wollny, C.B.A., Tchale, H. & Banda, J.W., 2006. An
analysis of smallholder farmers’ willingness to adopt dairy performance recording in
Malawi. Livest. Res. Rural Develop. 18, p. Article #66. Available at:
http://www.lrrd.org/lrrd18/5/chag18066.htm.
Cloete, J.J.E., Cloete; S.W.P., Scholtz, A.J. & Matthee, S., 2013. The effect of breed, ewe age
and season on tick counts of indigenous and commercial sheep in South Africa. Proc.
Assoc. Advmt Anim. Breed. Genet. 20, 187–190.
Cloete, S.W.P., Cloete, J.J.E., Durand, A. & Hoffman, L. C., 2003. Relative performance and
efficiency of five Merino and Merino-type dam lines in a terminal crossbreeding system
with Dormer or Suffolk sires. S. Afr. J. Anim. Sci. 33, 223–232.
Cloete, S.W.P., Olivier, J.J., Sandenbergh, L. & Snyman, M.A., 2014. The adaption of the
South Africa sheep industry to new trends in animal breeding and genetics: A review.
S. Afr. J. Anim. Sci. 44, 307–321.
Cloete, S.W.P., Cloete, J.J.E. & Scholtz, A.J., 2016. Genetic parameters for tick count and
udder health in commercial and indigenous ewes in South Africa. Vet. Parasit. 230, 33–
42.
Cockett, N.E., Smit, M.A., Bidwell, C.A., Segers, K., Hadfield, T.L., Snowder, G.D., Georges,
Stellenbosch University https://scholar.sun.ac.za
43
M. & Charlier, C., 2005. The Callipyge Mutation and other Genes that Affect Muscle
Hypertrophy in Sheep. Genet. Sel. Evol. 37, S65.
Coetzee, L., Montshwe, B.D. & Jooste, A., 2005. The marketing of livestock on communal
lands in the Eastern Cape Province: Constraints, Challenges and Implications for the
extension services. S. Afr. J. Agric. Ext. 34, 81–103.
Cousins, B., 2010. What is a “Smallholder”? Class analytic perspective on small-scale farming
and agrarian reform in South Africa, in Reforming Land and Resource Use in South
Africa: Impact on livelihoods.
Daetwyler, H.D., Bolormaa, S., Brown, D.J., Van der Werf, J.H. & Hayes, B.J., 2012. A
genomic prediction cross-validation approach combining ewe repeated phenotypes and
ram daughter trait deviations. Proc. Assoc. Advmt Anim. Breed. Genet, 360–363.
Demars, J., Fabre, S., Sarry, J., Rossetti, R., Gilbert, H., Persani, L., Tosser-Klopp, G., Mulsant,
P., Nowak, Z., Drobik, W., Martyniuk, E. & Bodin, L., 2013. Genome-Wide
Association Studies Identify Two Novel BMP15 Mutations Responsible for an Atypical
Hyperprolificacy Phenotype in Sheep, PLoS Genetics, 9(4).
Directorate Statistics and economic analysis. 2013. Abstract of Agricultural statistics. Pretoria
South Africa.
Duchemin, S.I., Colombani, C., Legarra, A., Baloche, G., Larroque, H., Astruc, J.M., Barillet,
F., Robert-Granie, C. & Manfredi, E., 2012. Genomic selection in the French Lacaune
dairy sheep breed. J. Dairy Sci. 95, 2723–2733.
Dzivakwi, R., 2010. Determinants of output prices formation in local sheep markets. M.Sc
thesis, University of Western Cape.
Stellenbosch University https://scholar.sun.ac.za
44
Erkanbrack, S.K. & Knight, A.D., 1991. Effects of inbreeding on reproduction and wool
production of Rambouillet, Targhee, and Columbia ewes. J. Anim. Sci. 4734–4744.
Everett-Hincks, J.M. & Dodds, K.G., 2008. Management of maternal-offspring behavior to
improve lamb survival in easy care sheep systems. J. Anim. Sci. 86
Everett-Hincks, J.M. & Cullen, N.G., 2009. Genetic Parameters for Ewe Rearing Performance.
J. Anim. Sci. 87, 2753–2758.
Fariello, M.I., Servin, B., Tosser-Klopp, G., Rupp, R., Moreno, C., the International Sheep
Genomics Consortium, SanCristobal, M. & Boitard, S., 2014. Selection signatures in
worldwide sheep populations. PLos ONE 9, e10381
Fourie, A.J. & Cloete, S.W.P., 1993. Reproductive performance of commercial Merino, Dohne
Merino and SA Mutton Merino flocks in the Southern Cape. S. Afr. J. Anim. Sci. 23,
104–110.
Gizaw, S., Komen, J. & Van Arendonk, J.A.M., 2010. Participatory definition of breeding
objectives and selection indexes for sheep breeding in traditional systems. Livest. Sci.
128, 67-74.
Goddard, M., 2009. Fitness traits in animal breeding programs. in Adaptation and fitness in
farm animal populations. Eds. Van der Werf, J.H.J.; Graser, H-U.;Frankham, R.;
Gondro, C. (ed.) Springer Science & Business Media.
Grobler, H., 2010. Evaluation survey at extensive farms in the Central Karoo 2009. Agriprobe,
pp. 6–9.
Grova, L., Sae-Lim, P. & Olesen, I., 2014. Genetic parameters of tick-infestation on lambs of
the Norwegian White Sheep. 10th World Cong.Genet. Appl. Livest. Prod.
Stellenbosch University https://scholar.sun.ac.za
45
Halimani, T.E., Muchadeyi, F.C., Chimonyo, M. & Dzama, K. 2012. Some insights into the
phenotypic and genetic diversity of indigenous pigs in Southern Africa. S. Afr. J. Anim.
Sci. 42, 507–510.
Herrero, M., Thornton, P.K., Gerber, P. & Reid, R.S. 2009. Livestock, livelihoods and the
environment: understanding the trade-offs. Current Opin. Environ. Sustain. 1, 111–120.
Hlophe, S.R., 2011. Genetic Variation Between and Within Six Selected South African sheep
breeds using random amplified polymorphic DNA and protein markers. Masters thesis,
University of Zululand.
Hoffmann, I., 2011. Livestock biodiversity and sustainability. Livest. Sci. 139, 69–79.
Holderegger, R., Kamm, U. & Gugerli, F., 2006. Adaptive vs. neutral genetic diversity:
Implications for landscape genetics. Landsc. Ecol. 21, 797–807.
Huisman, A.E. & Brown, D.J., 2009. Genetic parameters for bodyweight, wool, and disease
resistance and reproduction traits in Merino sheep. 3. Genetic relationships between
ultrasound scan traits and other traits. Anim. Prod. Sci. 49, 283–288.
Iniguez, L.C., Quaas, R.L. & Van Vleck, L.D., 1986. Lambing performance of Morlam and
Dorset ewes under accelerated lambing systems. J. Anim. Sci. 63,1769–1778.
Irungu, K.R.G., Mbugua, D. & Muia, J., 2015. Information and Communication Technologies
( ICTs ) Attract Youth into Profitable Agriculture in Kenya. East Afr. Agric. Forest. J.
81, 24–33.
Kijas, J.W., Lenstra, J.A., Hayes, B., Boitard, S., Neto, L.R., Cristobal, M.S., Servin, B.,
McCulloch, R., Whan, V., Gietzen, K., Paiva, S., Barendse, W., Ciani, E., Raadsma,
H., McEwan, J. & Dalrymple, B., 2012. Genome-wide analysis of the world’s sheep
Stellenbosch University https://scholar.sun.ac.za
46
breeds reveals high levels of historic mixture and strong recent selection. PLoS Biology
10(2).
Kim, E-S., Elbeltagy, A.R., Aboul-Naga, A.M., Rischkowsky, B., Sayre, B., Mwacharo, J.M.
& Rothschild, M.F., 2016. Multiple genomic signatures of selection in goats and sheep
indigenous to a hot arid environment. Heredity, 1-10.
Knap, P.W., 2005. Breeding robust pigs. Aus. J. Experim. Agric. 45, 763–773.
Kunene, N., Nesamvuni, E.A. & Fossey, A., 2007. Characterisation of Zulu (Nguni) sheep
using linear body measurements and some environmental factors affecting these
measurements. S. Afr. J. Anim. Sci. 37, 11–20.
Lebacq, T., Baret, P.V. & Stilmant, D., 2013. Sustainability indicators for livestock farming.
A review. Agron. Sustain. Develop. 33, 311–327. doi: 10.1007/s13593-012-0121-x.
Lee, G.J., Sladek, M.A. & Atkins, K.D. 2010. Selection criteria for within flock selection to
improve reproduction efficiency. Available at:
http://www.livestocklibrary.com.au/bitstream/handle/1234/33711/SheepCRC_2_87.p
df?sequence=1.
Legarra, A., Baloche, G., Barillet, F., Astruc, J. M., Soulas, C., Aguerre, X., Arrese, F.,
Mintegi, L., Lasarte, M., Maeztu, F., Beltrán de Heredia, I. & Ugarte, E., 2014. Within-
and across-breed genomic predictions and genomic relationships for Western Pyrenees
dairy sheep breeds Latxa, Manech, and Basco-Béarnaise. J. Dairy Sci. 97, 3200–3212.
Liandris, E., Kominakis, A., Andreadou, M., Kapeoldassi, K., Chadio, S., Tsiligianni, T.,
Gazouli, M. & Ikonomopoulos, I., 2012. Associations between single nucleotide
polymorphisms of GDF9 and BMP15 genes and litter size in two dairy sheep breeds of
Stellenbosch University https://scholar.sun.ac.za
47
Greece. Small Rumin. Res. 107, 16–21.
Ma, Y.,Wei, J., Zhang, Q., Chen, L., Wang, J., Liu, J. & Ding, X., 2015. A genome scan for
selection signatures in pigs. PLoS ONE 10, e0116850.
Mahlobo, B., 2016. Multi-criteria livestock assessment for sustainability of smallholder farms
in Kwa-Zulu Natal. Masters thesis, Stellenbosch University.
Mapiye, O., 2017. Towards a management database to improve the sustainability of cattle
production and its contribution to food security : A case of emerging beef farmers in
Limpopo Province , South Africa. Masters thesis, Stellenbosch University.
Marandure, T., Mapiye, C., Makombe, G. & Dzama, K., 2016. Indicator-Based Sustainability
Assessment of the Smallholder Beef Cattle Production System in South Africa.
Agroecol. Sustain. Food Syst. 41, 3–29.
Matika, O., Van Wyk, J.B., Erasmus, G.J. & Baker, R.L., 2003. Genetic parameter estimates
in Sabi sheep. Livest. Prod. Sci. 79, 17–28.
Miar, Y., Salehi, A., Kolbehdari, D. & Aleyasin, S.A., 2014 Application of Myostatin in Sheep
Breeding Programs: A review. Mol. Biol. Res. Commun. 3, 33–43.
Mkhabela, T., 2013. Linking farmers with markets in rural South Africa: Rural development
and poverty alleviation through supply chain management. National Agricultural
Marketmdpoing Council, pp. 1–13. Available at: http://www.namc.co.za/upload/all
reports/Linking farmers to markets in Rural SA.pdf.
Morris, C.A., 2009. Review of genetic parameters for disease resistance in sheep in New
Zealand and Australia, Matching genetics and environment: a new look at an old topic.
Proc. Assoc. Advmt Anim. Breed. Genet. pp. 263–271.
Stellenbosch University https://scholar.sun.ac.za
48
Motiang, D.M. & Webb, E.C., 2016. Herd mortality and cattle off-take rates among small-
holder producers in the North West Province of South Africa. Afr. J. Agric. Res. 11,
930–934.
Mtileni, B.J., Muchadeyi, F.C., Maiwashe, A., Groeneveld, E., Groeneveld, L.F., Dzama, K.
& Weigend, S., 2011. Genetic diversity and conservation of South African indigenous
chicken populations. J. Anim. Breed. Genet. 128, 209–218.
Musemwa, L., Mushunje, A., Chimonyo, M. & Mapiye, C., 2010. Low cattle market offtake
rates in communal production systems of South Africa: Causes and migration
strategies. J. Sustain. Develop. Afr. 12, 209–226.
Neogen Corporation., 2017. GeneSeek Genomic Sheep (Ovine) and Goat OvineSNP50chip
Genotyping Beadchip. Available online: http://genomics.neogen.com/en/sheep-and-
goat#ovinesnp50-genotyping-beadchip (accessed on 3 July 2017).
Nielsen, H.M. & Christensen, L.G., 2006. A Method to Define Breeding Goals for Sustainable.
J. Dairy Sci. 89, 3615–3625.
Nielsen, H.M., Olesen, I., Navrud, S., Kolstad, K. & Amer, P., 2011. How to Consider the
Value of Farm Animals in Breeding Goals . A Review of Current Status and Future
Challenges. J. Agric. Environ. Ethics. 24, 309–330.
Nimbkar, C., Ghalsasi, P.M., Maddox, J.F., Pardeshi, V.C., Sainani, M.N., Gupta, V., &
Walkden-Brown, S.W., 2003. Expression of the FecB gene in the Garole and crossbred
ewes in Maharashtra, India. Proc. Assoc. Advmnt. Anim. Breed. Genet. 15, 111-114
Norberg, E. & Sørensen, A. C., 2007. Inbreeding trend and inbreeding depression in the Danish
populations of Texel, Shropshire, and Oxford Down. J. Anim. Sci. 85, 299–304.
Stellenbosch University https://scholar.sun.ac.za
49
Olivier, J.J. & Cloete, S.W.P., 2006. Genetic analysis of the South African Dorper Sheep.
World Cong. Genet. Appl. Livest. Prod. Belo Horizonte, MG, Brazil, pp. 26–28.
Omann, I. & Spangenberg, J.H., 2002. Assessing Social Sustainability : The Social Dimension
of Sustainability in a Socio-Economic Scenario. in Presented at the 7th Biennial
Conference of the International Society for Ecological Economics“ in Sousse (Tunisia),
6-9 March 2002 Ab, pp. 1–20.
Organisation for economic co-operation and development [OECD]., 2006. South Africa,
Highlights and policy recommendations. OECD Review of Agricultural Policies.
Otte, M.J. & Chilonde, P., 2002. ‘Cattle and small ruminant production systems in Sub-Saharan
Africa. A systematic review’, FAO publishing Rome.
Oudshoorn, F.W., Kristensen, T., Van Der Zijpp, A.J. & De Boer, I.J.M., 2012. Sustainability
evaluation of automatic and conventional milking systems on organic dairy farms in
Denmark, NJAS - Wagenin. J. Life Sci. Royal Netherlands Society for Agriculture
Sciences, 59(1–2), pp. 25–33.
Percival, V. & Homer-Dixon, T., 1995. Environmental scarcity and violent conflict: The case
of South Africa.
Peters, F.W., Kotze, A., Van der Bank, F.H., Soma, P. & Grobler, J.P., 2010. Genetic profile
of the locally developed Meatmaster sheep breed in South Africa based on
microsatellite analysis. Small Rumin. Res. 90, 101–108
Piwczyński, D. & Kowaliszyn, B., 2013. Heritability and breeding value of sheep fertility
estimated by means of the GIBBS sampling method using the linear and threshold
models. J. Centr. Euro. Agric. 14, 23–32.
Stellenbosch University https://scholar.sun.ac.za
50
Qwabe, S.O., Van Marle-Köster, E. & Visser, C., 2013. Genetic diversity and population
structure of the endangered Namaqua Afrikaner sheep. Trop. Anim. Health Prod. 45,
511–516.
Ramey H.R., Decker J.E., McKay S.D., Rolf M.M., Schnabel R.D. & Taylor J.F., 2013.
Detection of selective sweeps in cattle using genome-wide SNP data. BMC Genomics.
14, 382-10.
Rege, J.E.O., Marshall, K., Notenbaert, A., Ojango, J.M.K. & Okeyo, A.M., 2011. ‘Pro-poor
animal improvement and breeding - What can science do?’, Livest. Sci. 136, 15–28.
Riggio, V., Matika, O., Pong-Wong, R., Stear, M.J. & Bishop, S.C., 2013. Genome-wide
association and regional heritability mapping to identify loci underlying variation in
nematode resistance and body weight in Scottish Blackface lambs. Heredity. 110, 420–
429.
Ross-Ibarra, J., Morrel, P.L & Gaut, B.S., 2007. Plant domestication, a unique opportunity to
identify the genetic basis of adaptation. PNAS 104, 8641-8648.
Roux, C.Z., 1992. Maximum herd efficiency in meat production III . Feeder - breeder
dimorphism. S. Afr. J. Anim. Sci. 22, 11–15.
Safari, E., Fogarty, N.M. & Gilmour, A.R., 2005. A review of genetic parameter estimates for
wool, growth, meat and reproduction traits in sheep. Livest. Prod. Sci. 92, 271–289.
Safari, E., Fogarty, N.M., Gilmour, A.R., Atkins, K.D., Mortimer, S.I., Swan, A.A., Brien,
F.D., Greeff, J.C. & Van Der Werf, J.H.J., 2007. Across Population Genetic Parameters
for Wool, Growth, and Reproduction Traits in Australian Merino Sheep. 1. Data
Structure and Non-Genetic Effects. Aust. J. Agric. Res. 58, 169–175.
Stellenbosch University https://scholar.sun.ac.za
51
Schoeman, S.J., Cloete, S.W.P. & Olivier, J.J., 2010. Returns on investment in sheep and goat
breeding in South Africa. Livest. Sci.130, 70–82.
Scholtz, M.M., Bester, J., Mamabolo, J.M. & Ramsay, K., 2008. Results of the national cattle
survey undertaken in South Africa , with emphasis on beef. Appl. Anim. Husb. Rural
Develop. 1, 1–9.
Snowder, G.D. & Van Vleck, L.D., 2003. Estimates of genetic parameters and selection
strategies to improve the economic efficiency of postweaning growth in lambs. J. Anim.
Sci. 81, 2704–2713.
Snowder, G.D. & Fogarty, N.M., 2009. Composite Trait Selection to Improve Reproduction
and Ewe Productivity : A Review. Anim. Prod. Sci. 49, 9–16.
Snyman, M.A., Buys, T. & Jonker, M.L., 2005. Production and reproduction performance of
Namaqua Afrikaner sheep. in 6th Global Conference on the Conservation of Domestic
Animal Genetic Resources. Magalies Park, South Africa.
Snyman, M.A., Van Marle-Koster, E, Qwabe, S.Q. & Visser, C., 2013. Genetic and phenotypic
profile of three South African Namaqua Afrikaner sheep flocks. Grootfontein Agric,
13. Available at: http:/gadi.agric.za/Agric/Vol13No1_2013/namaqua.php.
Soma, P., Kotze, A .,Grobler, J.P. & Van Wyk, J.B., 2012. South African sheep breeds:
Population genetic structure and conservation implications. Small Rumin. Res.103,
112–119.
Star, L., Ellen, E.D., Uitdehaag, K. & Brom, F.W.A., 2008. A plea to implement robustness
into a breeding goal: Poultry as an example. J. Agric. Environ. Ethics, 21, 109–125.
Swanepoel, B.J., Erasmus, B.J. & Schenk, H.W., 2008. South African Human Resources
Stellenbosch University https://scholar.sun.ac.za
52
Management. Theory and Practice. Cape Town, South Africa: Juta & Co. Ltd.
Swanepoel, J.W., Van Wyk, J.B., Cloete, S.W.P. & Delport, G.J., 2007. Inbreeding in the
Dohne Merino breed in South Africa. S. Afr. J. Anim. Sci. 37, 176–179.
Tosh, J.J., Wilton, J.W. & Kennedy, D., 2002. Heritability of Fertility in Four Seasons’, in 7th
World Cong. Genet. Appl. Livest. Prod. Montpellier, France, pp. 23–26.
Van Calker, K.J., Berentsen, P.B.M., Giesen, G.W.J. & Huirne, R.B.M., 2008. Maximising
sustainability of Dutch dairy farming systems for different stakeholders: A modelling
approach. Ecol. Econ. 65, 407–419.
Vandamme, M., D’Hease, M., Speelman, M., & D’Hease, L., 2010. Livestock against risk and
vulnerability: Multifunctionality of livestock keeping in Burundi. In: The role of
livestock in developing communities: Enhancing Multifunctionality. Eds. Swanepoel,
F., Stroebel, A., Moyo, S. The Netherlands, CTA, pp. 107–122.
Vitousek, P.M., Mooney, H., Lubchenco, J. & Melillo, J.M., 1997. Human Domination of
Earth’ s Ecosystems. Science 277, 494–499.
Wang, Z., Zhang, H., Yang, H., Wang, S., Rong, E., Pei, W., Li, H. & Wang, N., 2014.
Genome-wide association study for wool production traits in a Chinese merino sheep
population. PLoS ONE, 9, 3–10.
Van der Werf, J.H.J., 2009. Potential benefit of genomic selection in sheep. Proc. Assoc.
Advmt Anim. Breed. Genet. 18, 38–41. Available at:
http://www.aaabg.org/livestocklibrary/2009/vanderwerf038.pdf.
Van Wyk, J.B., Fair, M.D. & Cloete, S.W.P., 2009. ‘Case study: The effect of inbreeding on
the production and reproduction traits in the Elsenburg Dormer sheep stud’, Livestock
Stellenbosch University https://scholar.sun.ac.za
53
Science. Elsevier B.V., 120(3), pp. 218–224. doi: 10.1016/j.livsci.2006.10.005.
Williams, J.L., 2005. The use of marker-assisted selection in animal breeding and
biotechnology. Revue scientifique et technique (International Office of Epizootics), 24,
379–91.
World Resources Institute [WRI] 2014. Creating a sustainable food future. A menu of solutions
to sustainably feed more than 9 billion people by 2050.
Wray, N.R., Yang, J., Hayes, B.J., Price, A.L., Goddard, M.E. & Visscher, P.M., 2013. A
commentary on Pitfalls of predicting complex traits from SNPs. Nature 14, 894–894.
Yang, J., Li, W.R., Lv, F.H., He, S.G., Tian, S.L., Peng, W.F., Sun, Y.W., Zhao, Y.X., Tu, X.
L., Zhang, M., Xie, X.L., Wang, Y.T., Li, J.Q., Liu, Y.G., Shen, Z.Q., Wang, F., Liu,
G.J., Lu, H.F., Kantanen, J., Han, J.L., Li, M.H. & Liu, M.J., 2016. Whole-Genome
Sequencing of Native Sheep Provides Insights into Rapid Adaptations to Extreme
Environments. Mol. Biol. Evol. 33, 2576–2592.
Zahm, F., Viaux, P., Vilain, L., Girardin, P. & Mouchet, C., 2007. Farm Sustainability
Assessment using the IDEA Method : from the concept of farm sustainability to case
studies on French farms. Sustainable agriculture: from common principles to common
pratices. Proc. Outputs first Symp. Int. Forum Assess Sustain. Agric. (INFASA), March
16, 2006, Bern, CHE, 14(4), pp. 77–110.
Zhang, L., Liu, J., Zhao, F., Ren, H., Xu, L., Lu, J., Zhang, S., Zhang, X., Wei, C., Lu, G.,
Zheng, Y. & Du, L., 2013. Genome-Wide Association Studies for Growth and Meat
Production Traits in Sheep. PLoS ONE, 8(6).
Zhang, L., Ma, X., Xuan, J., Wang, H., Yuan, Z., Wu, M., Liu, R., Zhu, C., Wei, C., Zhao, F.
Stellenbosch University https://scholar.sun.ac.za
54
& Du, L., 2016. ‘Identification of MEF2B and TRHDE Gene Polymorphisms Related
to Growth Traits in a New Ujumqin Sheep Population’, PLoS ONE, 11(7), p. e0159504.
Zishiri, O.T., Cloete, S.W.P., Olivier, J.J. & Dzama, K., 2013. ‘Genetic parameter estimates
for subjectively assessed and objectively measured traits in South African Dorper
sheep’, Small Rumin. Res. 109, 84–93.
Stellenbosch University https://scholar.sun.ac.za
55
Chapter 3
Characterisation of sheep farming and breeding practices of
smallholder sheep farmers in the Western Cape, South Africa
Abstract
The aim of this study was to characterise the sheep farming systems and breeding practices
employed by smallholder sheep farmers in South Africa. Interviews were conducted with 72
farmers, 21 in the West Coast, 26 in Central Karoo and 25 in the Eden district using a structured
questionnaire. Information was obtained on the production system, flock structure, the purpose
of sheep farming, the sheep breeds and selection objectives of smallholder farmers. Nutrition
and disease management practices were also recorded, as well as constraints experienced by
smallholder farmers. Phenotypic measurements of body weight, body condition score and
reproduction (wet and dry phenotype) were obtained from a sample of ewes from the West
Coast district from 2011 until 2014. Range condition scores were estimated for two farms in
the Karoo and four farms in West Coast district. SURVEYMEANS and SURVEYFREQ in
SAS were used to obtain means and frequencies for qualitative data. The production systems
were largely small-scale (43-85%) and communal (10-57%). Sheep were mainly kept for
consumption purposes. The Dorper was the prominent breed used in all the farming systems
and selection emphasis was different among farming systems. Traits selected for by communal
farmers included temperament, control of flies, meat taste, growth rate, fertility and foraging
ability; whereas small-scale farmers selected for conformation, mothering ability, disease
tolerance, heat tolerance and temperament. Lucerne was the predominant source of
supplementation in addition to natural grazing of rangeland. The major constraints mentioned
were land availability, drought and water availability. Average range condition scores were
low (135-166) for both farming systems implicating overgrazing. Stocking rate was higher than
Stellenbosch University https://scholar.sun.ac.za
56
the recommended carrying capacity in the Eden district (both communal and small-scale
farmers) and in West Coast for small-scale farmers. The flock structure showed variation
between farming systems with mature ewes (39-86%) and young replacement ewes (0.41-
46%), young rams (0.41-15%), rams (0-5%) and lambs (0-2%). The wet-dry phenotype was
recorded as a measurement of reproductive success over the three year period. The chi-square
test indicated significant differences between reproductive performances over the different
years with a repeatability of 0.399. This indicates that it is possible to make genetic
improvement if selection is made for wet-dry in smallholder sheep flocks. This study indicates
that there were differences in sheep management and breeding practices by communal and
small-scale farmers in the Western Cape. Implementation of breeding and management plans
should therefore be farm-specific and the impacts of climate change on production should be
considered.
3.1. Introduction
Twenty % of the world population are smallholder livestock farmers based in developing
countries (McDermott et al., 2010). Livestock fulfil multiple socio-economic roles for small-
scale and communal farmers, including the production of meat for home consumption, wool,
income, manure, draught power and material for religious and cultural rituals. In South Africa
the sheep industry is divided into commercial, emerging and smallholder farmers. There are an
estimated 28.8 million sheep in South Africa, of which 21.4 million are owned by commercial
farmers (Directorate Statistics and Economic analysis, 2013). The industry is dominated by the
commercial sheep sector that supplies meat products locally and wool products for export.
Emerging sheep farmers also supply meat and wool products to the informal and formal market,
whereas the communal farmers are supplying meat for informal markets. The Dohne Merino,
Stellenbosch University https://scholar.sun.ac.za
57
Merino, South African Mutton Merino and Dorper breeds are the most prominent breeds of
sheep in South Africa (Cloete et al., 2014). Other sheep breeds in the industry include Dormer,
Ile de France, Meatmaster, Namaqua Afrikaner, Afrino and Merino Landsheep.
The number of sheep owned by smallholder farmers is inadequately documented. Sheep used
by most smallholder farmers in South Africa include the Nguni, Damara, Pedi, Namaqua
Afrikaner and the Dorper. Some of these breeds are indigenous to South Africa and have
characteristics that make them well-adapted to local conditions (Kunene et al., 2007; Almeida,
2011; Snyman et al., 2013; Zishiri et al., 2013). However, the Dorper is the breed of choice for
farmers in the semi-arid and arid environments of South Africa. Indigenous breeds used in
smallholder systems such as the Damara (Almeida, 2011) and Namaqua Afrikaner (Cloete et
al., 2013), however, outperform commercial breeds for fitness traits, survival and
disease/pathogen resistance. Fitness traits can be described as a group of traits enabling animals
to adapt and includes several reproduction, survival traits including disease tolerance and heat
tolerance (Goddard, 2009). It is important to incorporate fitness traits into breeding and
selection objectives to ensure resilient breeding programs, especially in the light of climate
change. Projections made by the Intergovernmental Panel of Climate Change (IPCC) for the
Southern African Development Community (SADC) shows that mean annual temperature will
increase by 2 ºC in the mid-21st century and beyond 6 ºC in the late 21st century (Niang et al.,
2014). Heat tolerance is relevant to select for considering that sheep are raised in the Karoo
environments which are known for extreme heat. Heat tolerance can be defined as the ability
of an animal to adapt to increases in ambient temperature. It can be measured through various
traits, including sweating rate, heart rate, breathing rate, rectal temperature and skin
temperature (McManus et al., 2009). Coat colour can also be used to determine the degree of
heat tolerance, animal with lighter coats was found to be more heat tolerant than those with
darker coats (McManus et al., 2011). An animal that is heat intolerant will experience heat
Stellenbosch University https://scholar.sun.ac.za
58
stress that can lead to a loss of appetite and thus body weight, less resistance to diseases and
reproduction inefficiency (McManus et al., 2009). Temperature humidity index (THI) has been
used in dairy cattle and sheep to estimate response for selection to heat stress (Carabaño et al.,
2017).
Commercial farmers achieve high production due to selection of exotic breeds for improved
growth and reproduction (Schoeman et al., 2010). The use of improved nutritional and grazing
management strategies have allowed commercial farmers to excel. Minimal or no selection
took place of any of the abovementioned traits in smallholder sheep production systems which
could explain the observed low production performance (Grobler, 2010). There has also been
reports of overgrazing in smallholder sheep farming systems which could also limit
smallholder sheep production (Palmer & Bennett, 2013).
Important traits selected for to enhance production are growth related, like birth weight,
weaning weight, body condition score (BCS), and adult weight (Safari et al., 2005). Heritability
estimates for growth are moderate to high, with estimates of 0.30-0.41 for adult weight
(Huisman & Brown, 2009). Heritability estimates for BCS ranged from 0.16 for BCS during
mid-pregnancy and 0.18 for BCS two weeks before lambing (Everett-Hincks & Dodds, 2008).
Reproduction is a composite traits and can be measured by component traits such as number
of lambs born per ewe’s lifetime, or number of lambs weaned per ewe lifetime, litter size,
conception rate, lamb survival and mothering ability (Zishiri et al., 2013). The wet-dry
phenotype (Fourie & Cloete, 1993) is recorded from an udder examination performed during
the marking of recently born lambs or at the weaning of lambs. Wet-dry refers to whether a
ewe is lactating or not, and can be used as an indicator of reproductive performance of ewes in
low-input farming systems. Heritabilities estimated in Australian Merino flocks ranged from
0.09 to 0.17 for wet-dry at weaning and 0.04 to 0.11 when at lamb marking (Lee et al., 2010).
The wet-dry phenotype is a composite trait and includes both conception rate and mothering
Stellenbosch University https://scholar.sun.ac.za
59
ability. Heritability estimates for the component trait conception rate ranges from 0.01 to 0.30
(Iniguez et al., 1986; Tosh et al., 2002; Piwczyński & Kowaliszyn, 2013). Estimates for
number of lambs born and number of lambs weaned were 0.05 to 0.10 and 0.05 to 0.07,
respectively (Safari et al., 2005; Safari et al., 2007). In smallholder systems, easy to measure
traits such as body weight and body condition score can be used as a proxy for growth, and
wet-dry can be used as a proxy for reproduction.
There is no formal recordkeeping system in place for smallholder sheep farmers in South
Africa. This inhibits genetic improvement of sheep utilised in smallholder sheep systems. It is
therefore, important to obtain records of growth and reproduction of sheep kept by smallholders
for the development of sustainable breeding plans to improve their production performance.
Therefore the first objective of this study was to characterise sheep management and breeding
practices employed in smallholder sheep farming systems in the Western Cape Province. The
second objective was to determine rangeland condition score as indicative of overgrazing in
smallholder sheep farming systems. The third objective was to determine growth and
reproduction (wet-dry) performance of smallholder sheep.
3.2. Materials and methods
3.2.1. Description of the study site
The study incorporated three districts in the Western Cape, namely the West Coast
(Ebenheaser) municipality in the West Coast, the Central Karoo and the Eden district (Map 1).
These districts were chosen because they are situated in arid environments according to Köppen
–Geiger (2006) as sheep are mostly farmed extensively in these areas. The vegetation of the
West Coast district is classified under the Succulent Karoo Biome, while the Karoo and Eden
are classified as the Nama Karoo Biome (Acocks, 1988). The succulent Karoo mainly consists
of succulent plants and is a winter rainfall area. The altitude ranges from sea level to 1500m
Stellenbosch University https://scholar.sun.ac.za
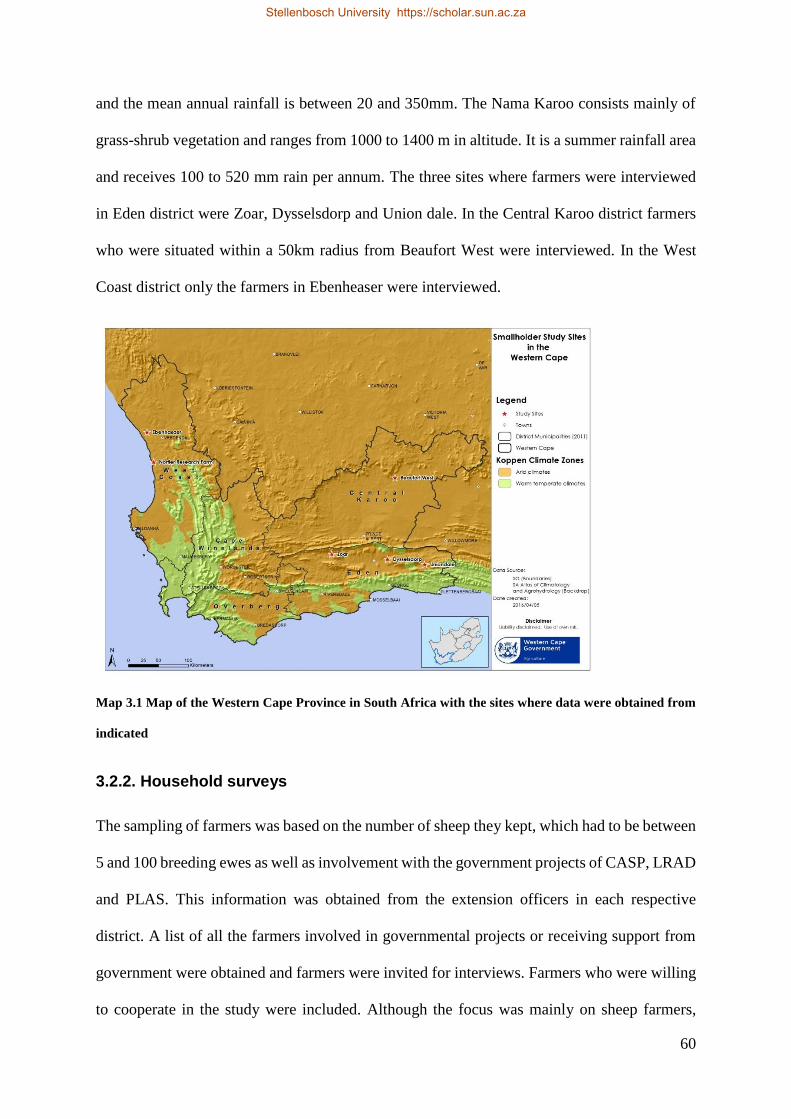
60
and the mean annual rainfall is between 20 and 350mm. The Nama Karoo consists mainly of
grass-shrub vegetation and ranges from 1000 to 1400 m in altitude. It is a summer rainfall area
and receives 100 to 520 mm rain per annum. The three sites where farmers were interviewed
in Eden district were Zoar, Dysselsdorp and Union dale. In the Central Karoo district farmers
who were situated within a 50km radius from Beaufort West were interviewed. In the West
Coast district only the farmers in Ebenheaser were interviewed.
Map 3.1 Map of the Western Cape Province in South Africa with the sites where data were obtained from
indicated
3.2.2. Household surveys
The sampling of farmers was based on the number of sheep they kept, which had to be between
5 and 100 breeding ewes as well as involvement with the government projects of CASP, LRAD
and PLAS. This information was obtained from the extension officers in each respective
district. A list of all the farmers involved in governmental projects or receiving support from
government were obtained and farmers were invited for interviews. Farmers who were willing
to cooperate in the study were included. Although the focus was mainly on sheep farmers,
Stellenbosch University https://scholar.sun.ac.za
61
farmers having both sheep and crops as farming activity were also included to increase the
sample numbers.
Husbandry practices and flock structure information were collected. Interviews were
conducted with 72 smallholder farmers in total, namely 21 in the West Coast, 26 in the Central
Karoo and 25 in the Eden district (Map 3.1). The different issues surveyed were the farming
system employed, reasons for keeping livestock as well as flock structure and -size. Flock
structure is important to consider for a sheep farmer. A commercial flock structure normally
consists out of 2% mature rams and 1% young rams, 1% castrated rams, 11% young
replacement ewes and 44% mature ewes, 41% lambs (Spies & Cloete, 2013). Flock structure
is known to profoundly influence the product output and annual genetic gain of a sheep flock
(Turner & Young, 1969).
3.2.3. Rangeland condition scores
Rangeland condition scores were obtained to determine the level of overgrazing or not on veld
utilised by smallholder sheep farmers in the Western Cape. Range condition scores were
carried out in the wet-season in 2014 on four sites in the Nama Karoo. These four sites were
selected from two smallholder farms in the Karoo who participated in the survey. The first farm
was located 50km outside of town, whereas the other farm was located 5km outside of town
on communal lands. Rangeland condition scores were carried out during the dry season in 2014
on eight sites in the Succulent Karoo biomes (Tainton, 1999). These 8 sites were selected from
four smallholder farmers who participated in the survey in Ebenheaser. Two camps were
identified of each farmer for rangeland condition scoring. See the sampling sites in Table 1 in
the Addendum A.
Recording of vegetation composition was done along transects using a line-point intercept
method (Du Toit, 1997). This was done using 1000 points over one transect, spaced at 1m
Stellenbosch University https://scholar.sun.ac.za
62
intervals to determine canopy cover of species based on canopy hits. The number of hits on a
given species was calculated as a percentage of the total number of point observations. The
total number of hits is an indication of canopy cover of the site. The percentage values obtained
for individual species were multiplied by their grazing-index values (Du Toit et al., 1995).
Grazing index values were developed for plants based on 6 agronomic attributes which
includes; the ability of a plant to produce forage, the forage value during growing season,
forage value during the dormant season, the relative ease with which a species is grazed,
perenniality and the ability of species to protect soil against surface erosion (Du Toit et al.,
1995). The products were summed and the index of the range-condition was obtained.
3.2.4 Phenotypic measurements
The following phenotypic measurements were done only on interview participants from the
West Coast district. These farmers shared farms where sheep grazed, see Table 3.1 below for
information on the group of farmers. The number of ewes present in the flocks from 2011, 2012
and 2014. Data were not collected in 2013. Age of ewes was determined based on dentition
(Wilson & Durkin, 1984). Body weight and body condition of ewes were recorded during the
lambing season. Body condition score (BCS) was determined on a scale from 1 to 5, with 1
being extremely emaciated and 5 obese (Thompson & Meyer, 1994). The ‘wet and dry’
technique was used to assess reproduction of ewes (Hatcher et al., 2013). The system identifies
ewes that were dry, ewes that lambed and lost all progeny and ewes that lambed and suckled
at least one lamb at each visit.
Stellenbosch University https://scholar.sun.ac.za
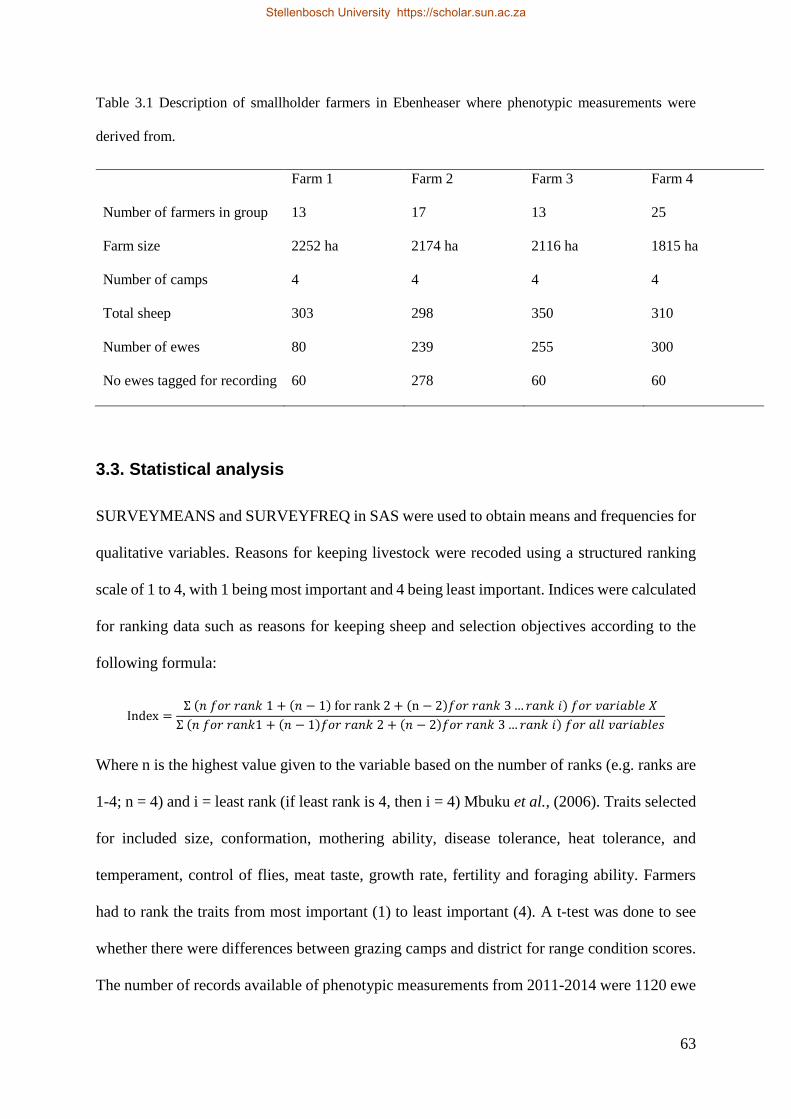
63
Table 3.1 Description of smallholder farmers in Ebenheaser where phenotypic measurements were
derived from.
Farm 1 Farm 2 Farm 3 Farm 4
Number of farmers in group 13 17 13 25
Farm size 2252 ha 2174 ha 2116 ha 1815 ha
Number of camps 4 4 4 4
Total sheep 303 298 350 310
Number of ewes 80 239 255 300
No ewes tagged for recording 60 278 60 60
3.3. Statistical analysis
SURVEYMEANS and SURVEYFREQ in SAS were used to obtain means and frequencies for
qualitative variables. Reasons for keeping livestock were recoded using a structured ranking
scale of 1 to 4, with 1 being most important and 4 being least important. Indices were calculated
for ranking data such as reasons for keeping sheep and selection objectives according to the
following formula:
Index =Ʃ (𝑛 𝑓𝑜𝑟 𝑟𝑎𝑛𝑘 1 + (𝑛 − 1) for rank 2 + (n − 2)𝑓𝑜𝑟 𝑟𝑎𝑛𝑘 3 … 𝑟𝑎𝑛𝑘 𝑖) 𝑓𝑜𝑟 𝑣𝑎𝑟𝑖𝑎𝑏𝑙𝑒 𝑋
Ʃ (𝑛 𝑓𝑜𝑟 𝑟𝑎𝑛𝑘1 + (𝑛 − 1)𝑓𝑜𝑟 𝑟𝑎𝑛𝑘 2 + (𝑛 − 2)𝑓𝑜𝑟 𝑟𝑎𝑛𝑘 3 … 𝑟𝑎𝑛𝑘 𝑖) 𝑓𝑜𝑟 𝑎𝑙𝑙 𝑣𝑎𝑟𝑖𝑎𝑏𝑙𝑒𝑠
Where n is the highest value given to the variable based on the number of ranks (e.g. ranks are
1-4; n = 4) and i = least rank (if least rank is 4, then i = 4) Mbuku et al., (2006). Traits selected
for included size, conformation, mothering ability, disease tolerance, heat tolerance, and
temperament, control of flies, meat taste, growth rate, fertility and foraging ability. Farmers
had to rank the traits from most important (1) to least important (4). A t-test was done to see
whether there were differences between grazing camps and district for range condition scores.
The number of records available of phenotypic measurements from 2011-2014 were 1120 ewe
Stellenbosch University https://scholar.sun.ac.za
64
records for the different variables. A General Linear Model (GLM) in SAS was used to analyse
phenotypic measurements of body weight, body condition score, and wet-dry phenotype. Least
square means were obtained for body weight and body condition score and used to plot growth
curves in relation to age in Excel (2010). Fixed effects fitted for wet-dry phenotype were the
age of the ewe, body condition score, farm and year. Body weight was fitted as a covariate for
the wet-dry phenotype. Chi-square was calculated in Excel®, 2010. The repeatability estimate
was calculated using the rptR package in R software that used a Generalised Linear Mixed-
Effects Model (GLMM) method and logit link to estimate repeatability for binary data (Stoffel
et al., 2017).
3.4. Results
3.4.1 Sheep farming systems
Figure 3.1 indicates the different farming types indicated by the survey information in the three
districts of the Western Cape. The West Coast district constitutes 57% communal and 43%
small-scale sheep farming systems. The Karoo has 84% small-scale, 12% communal and 4%
large-scale. Only one farmer indicated his farming system to be large scale. This farmer,
however, recently acquired land in 2014 from the PLAS project when the surveys were
administered and have not actively farmed for one year. This data point was therefore excluded
from further analysis. Eden district constitutes 86% small-scale and 10% communal sheep
farming systems and 4% were unclassified as this information was not completed in the
questionnaire.
Stellenbosch University https://scholar.sun.ac.za
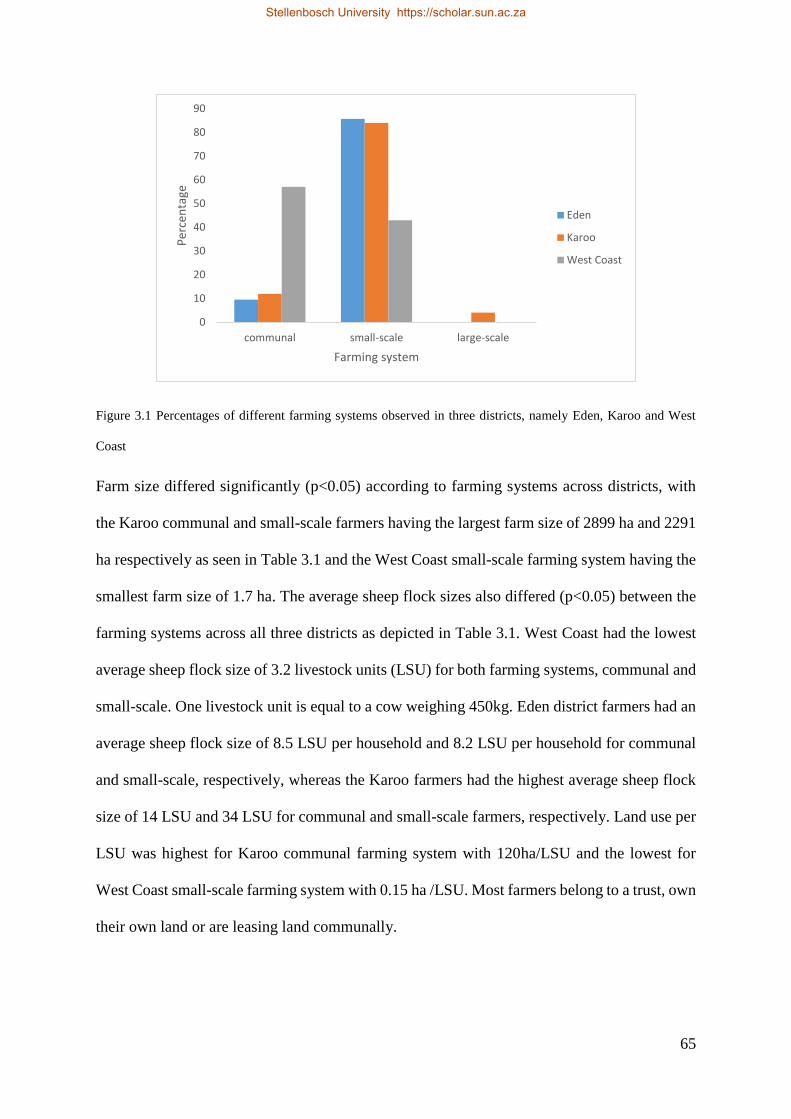
65
Figure 3.1 Percentages of different farming systems observed in three districts, namely Eden, Karoo and West
Coast
Farm size differed significantly (p<0.05) according to farming systems across districts, with
the Karoo communal and small-scale farmers having the largest farm size of 2899 ha and 2291
ha respectively as seen in Table 3.1 and the West Coast small-scale farming system having the
smallest farm size of 1.7 ha. The average sheep flock sizes also differed (p<0.05) between the
farming systems across all three districts as depicted in Table 3.1. West Coast had the lowest
average sheep flock size of 3.2 livestock units (LSU) for both farming systems, communal and
small-scale. One livestock unit is equal to a cow weighing 450kg. Eden district farmers had an
average sheep flock size of 8.5 LSU per household and 8.2 LSU per household for communal
and small-scale, respectively, whereas the Karoo farmers had the highest average sheep flock
size of 14 LSU and 34 LSU for communal and small-scale farmers, respectively. Land use per
LSU was highest for Karoo communal farming system with 120ha/LSU and the lowest for
West Coast small-scale farming system with 0.15 ha /LSU. Most farmers belong to a trust, own
their own land or are leasing land communally.
0
10
20
30
40
50
60
70
80
90
communal small-scale large-scale
Per
cen
tage
Farming system
Eden
Karoo
West Coast
Stellenbosch University https://scholar.sun.ac.za
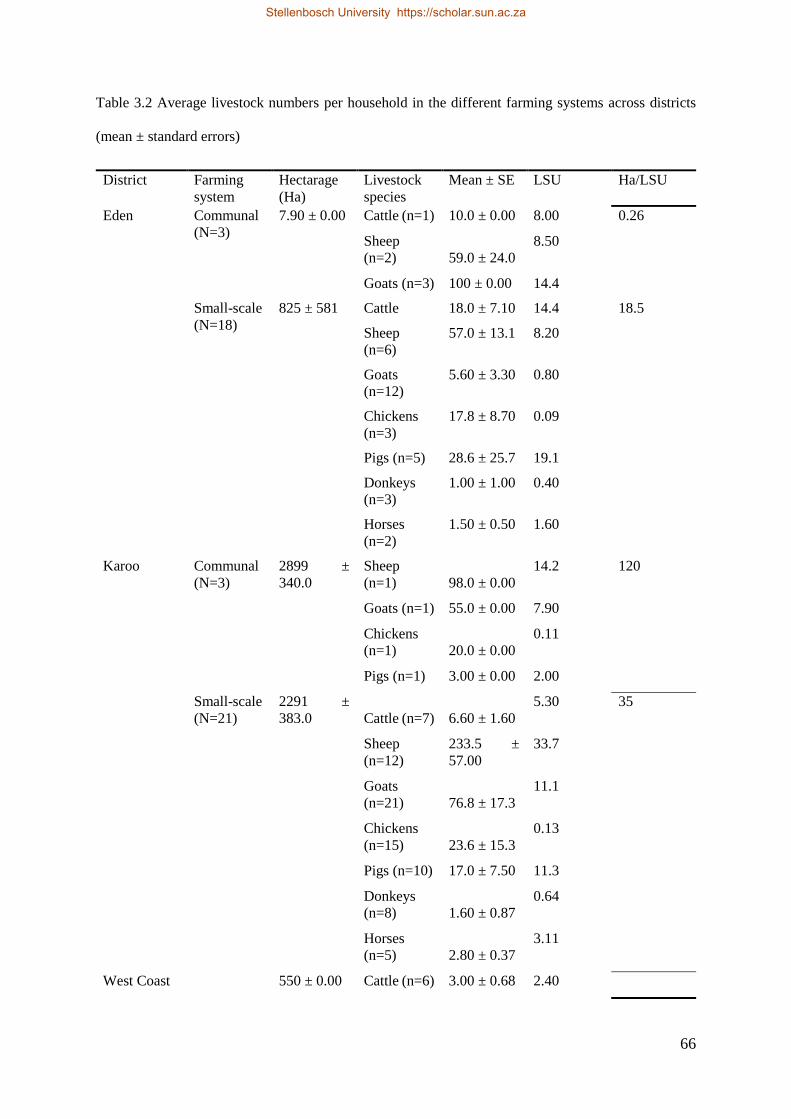
66
Table 3.2 Average livestock numbers per household in the different farming systems across districts
(mean ± standard errors)
District Farming
system
Hectarage
(Ha)
Livestock
species
Mean ± SE LSU Ha/LSU
Eden Communal
(N=3)
7.90 ± 0.00 Cattle (n=1) 10.0 ± 0.00 8.00 0.26
Sheep
(n=2) 59.0 ± 24.0
8.50
Goats (n=3) 100 ± 0.00 14.4
Small-scale
(N=18)
825 ± 581 Cattle 18.0 ± 7.10 14.4 18.5
Sheep
(n=6)
57.0 ± 13.1 8.20
Goats
(n=12)
5.60 ± 3.30 0.80
Chickens
(n=3)
17.8 ± 8.70 0.09
Pigs (n=5) 28.6 ± 25.7 19.1
Donkeys
(n=3)
1.00 ± 1.00 0.40
Horses
(n=2)
1.50 ± 0.50 1.60
Karoo Communal
(N=3)
2899 ±
340.0
Sheep
(n=1) 98.0 ± 0.00
14.2 120
Goats (n=1) 55.0 ± 0.00 7.90
Chickens
(n=1) 20.0 ± 0.00
0.11
Pigs (n=1) 3.00 ± 0.00 2.00
Small-scale
(N=21)
2291 ±
383.0 Cattle (n=7) 6.60 ± 1.60
5.30 35
Sheep
(n=12)
233.5 ±
57.00
33.7
Goats
(n=21) 76.8 ± 17.3
11.1
Chickens
(n=15) 23.6 ± 15.3
0.13
Pigs (n=10) 17.0 ± 7.50 11.3
Donkeys
(n=8) 1.60 ± 0.87
0.64
Horses
(n=5) 2.80 ± 0.37
3.11
West Coast 550 ± 0.00 Cattle (n=6) 3.00 ± 0.68 2.40
Stellenbosch University https://scholar.sun.ac.za
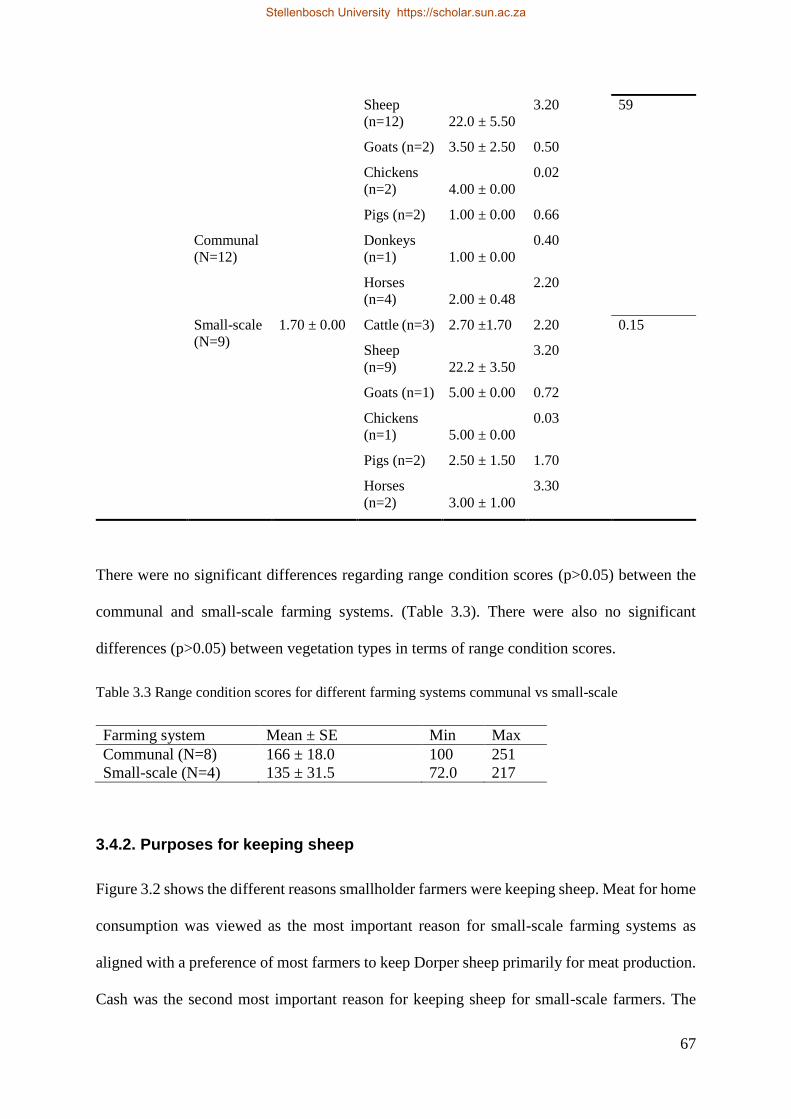
67
Communal
(N=12)
Sheep
(n=12) 22.0 ± 5.50
3.20 59
Goats (n=2) 3.50 ± 2.50 0.50
Chickens
(n=2) 4.00 ± 0.00
0.02
Pigs (n=2) 1.00 ± 0.00 0.66
Donkeys
(n=1) 1.00 ± 0.00
0.40
Horses
(n=4) 2.00 ± 0.48
2.20
Small-scale
(N=9)
1.70 ± 0.00 Cattle (n=3) 2.70 ±1.70 2.20 0.15
Sheep
(n=9) 22.2 ± 3.50
3.20
Goats (n=1) 5.00 ± 0.00 0.72
Chickens
(n=1) 5.00 ± 0.00
0.03
Pigs (n=2) 2.50 ± 1.50 1.70
Horses
(n=2) 3.00 ± 1.00
3.30
There were no significant differences regarding range condition scores (p>0.05) between the
communal and small-scale farming systems. (Table 3.3). There were also no significant
differences (p>0.05) between vegetation types in terms of range condition scores.
Table 3.3 Range condition scores for different farming systems communal vs small-scale
Farming system Mean ± SE Min Max
Communal (N=8) 166 ± 18.0 100 251
Small-scale (N=4) 135 ± 31.5 72.0 217
3.4.2. Purposes for keeping sheep
Figure 3.2 shows the different reasons smallholder farmers were keeping sheep. Meat for home
consumption was viewed as the most important reason for small-scale farming systems as
aligned with a preference of most farmers to keep Dorper sheep primarily for meat production.
Cash was the second most important reason for keeping sheep for small-scale farmers. The
Stellenbosch University https://scholar.sun.ac.za
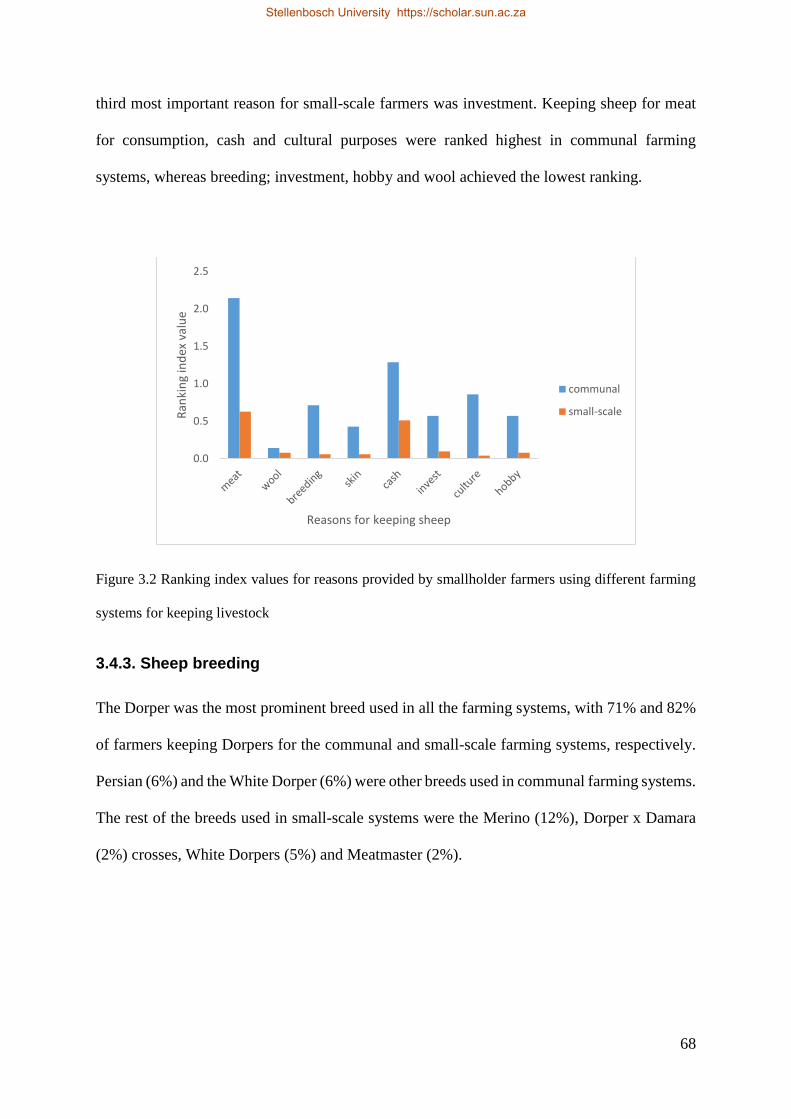
68
third most important reason for small-scale farmers was investment. Keeping sheep for meat
for consumption, cash and cultural purposes were ranked highest in communal farming
systems, whereas breeding; investment, hobby and wool achieved the lowest ranking.
Figure 3.2 Ranking index values for reasons provided by smallholder farmers using different farming
systems for keeping livestock
3.4.3. Sheep breeding
The Dorper was the most prominent breed used in all the farming systems, with 71% and 82%
of farmers keeping Dorpers for the communal and small-scale farming systems, respectively.
Persian (6%) and the White Dorper (6%) were other breeds used in communal farming systems.
The rest of the breeds used in small-scale systems were the Merino (12%), Dorper x Damara
(2%) crosses, White Dorpers (5%) and Meatmaster (2%).
0.0
0.5
1.0
1.5
2.0
2.5
Ran
kin
g in
dex
val
ue
Reasons for keeping sheep
communal
small-scale
Stellenbosch University https://scholar.sun.ac.za
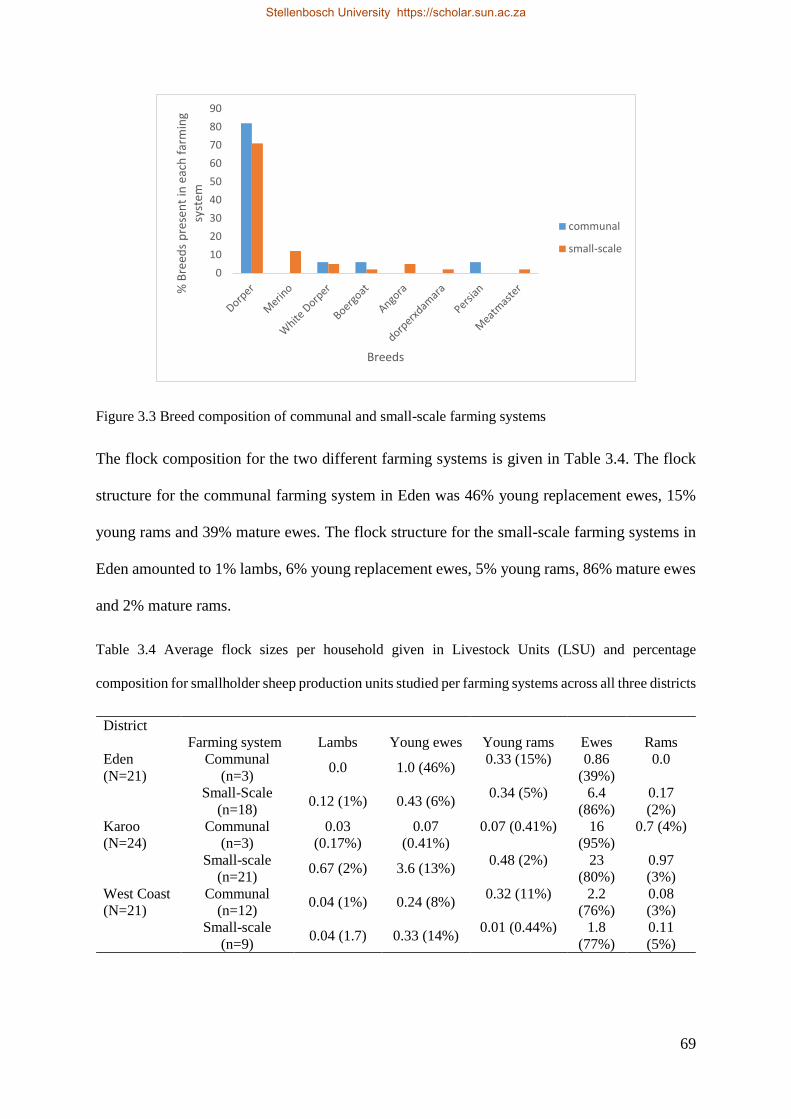
69
Figure 3.3 Breed composition of communal and small-scale farming systems
The flock composition for the two different farming systems is given in Table 3.4. The flock
structure for the communal farming system in Eden was 46% young replacement ewes, 15%
young rams and 39% mature ewes. The flock structure for the small-scale farming systems in
Eden amounted to 1% lambs, 6% young replacement ewes, 5% young rams, 86% mature ewes
and 2% mature rams.
Table 3.4 Average flock sizes per household given in Livestock Units (LSU) and percentage
composition for smallholder sheep production units studied per farming systems across all three districts
District
Farming system Lambs Young ewes Young rams Ewes Rams
Eden
(N=21)
Communal
(n=3) 0.0 1.0 (46%)
0.33 (15%) 0.86
(39%)
0.0
Small-Scale
(n=18) 0.12 (1%) 0.43 (6%)
0.34 (5%) 6.4
(86%)
0.17
(2%)
Karoo
(N=24)
Communal
(n=3)
0.03
(0.17%)
0.07
(0.41%)
0.07 (0.41%) 16
(95%)
0.7 (4%)
Small-scale
(n=21) 0.67 (2%) 3.6 (13%)
0.48 (2%) 23
(80%)
0.97
(3%)
West Coast
(N=21)
Communal
(n=12) 0.04 (1%) 0.24 (8%)
0.32 (11%) 2.2
(76%)
0.08
(3%)
Small-scale
(n=9) 0.04 (1.7) 0.33 (14%)
0.01 (0.44%) 1.8
(77%)
0.11
(5%)
0
10
20
30
40
50
60
70
80
90
% B
reed
s p
rese
nt
in e
ach
far
min
g sy
stem
Breeds
communal
small-scale
Stellenbosch University https://scholar.sun.ac.za
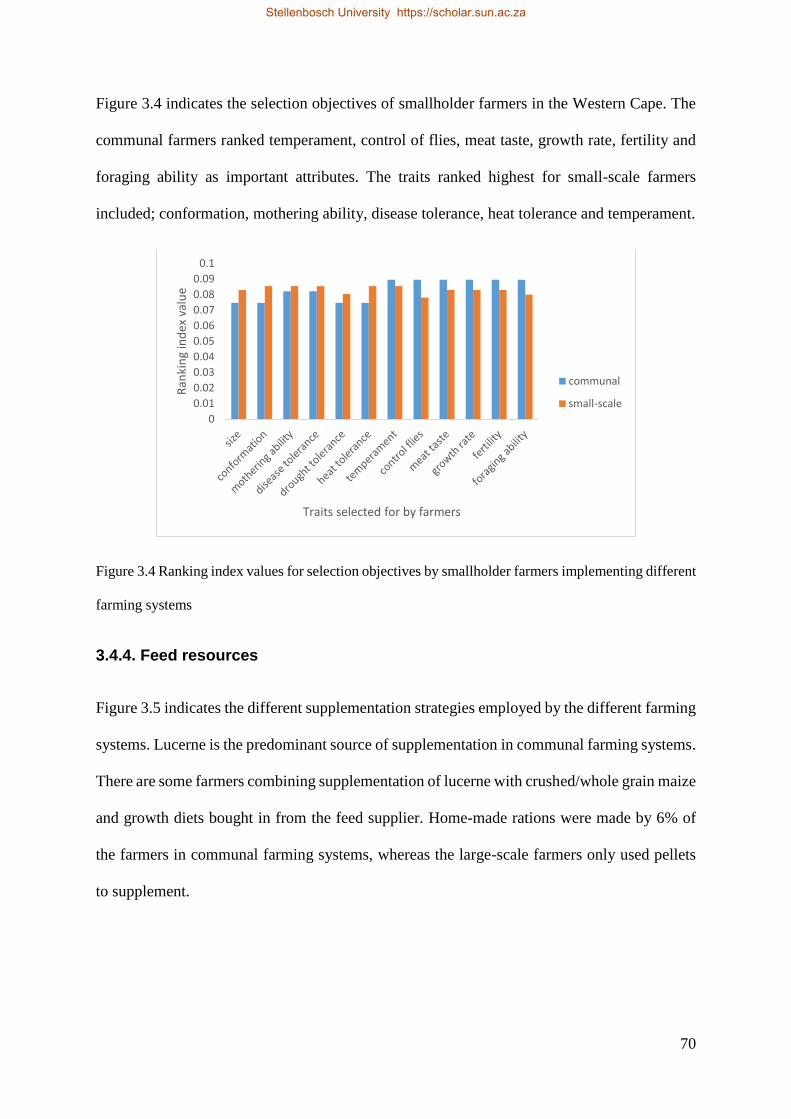
70
Figure 3.4 indicates the selection objectives of smallholder farmers in the Western Cape. The
communal farmers ranked temperament, control of flies, meat taste, growth rate, fertility and
foraging ability as important attributes. The traits ranked highest for small-scale farmers
included; conformation, mothering ability, disease tolerance, heat tolerance and temperament.
Figure 3.4 Ranking index values for selection objectives by smallholder farmers implementing different
farming systems
3.4.4. Feed resources
Figure 3.5 indicates the different supplementation strategies employed by the different farming
systems. Lucerne is the predominant source of supplementation in communal farming systems.
There are some farmers combining supplementation of lucerne with crushed/whole grain maize
and growth diets bought in from the feed supplier. Home-made rations were made by 6% of
the farmers in communal farming systems, whereas the large-scale farmers only used pellets
to supplement.
0
0.01
0.02
0.03
0.04
0.05
0.06
0.07
0.08
0.09
0.1
Ran
kin
g in
dex
val
ue
Traits selected for by farmers
communal
small-scale
Stellenbosch University https://scholar.sun.ac.za
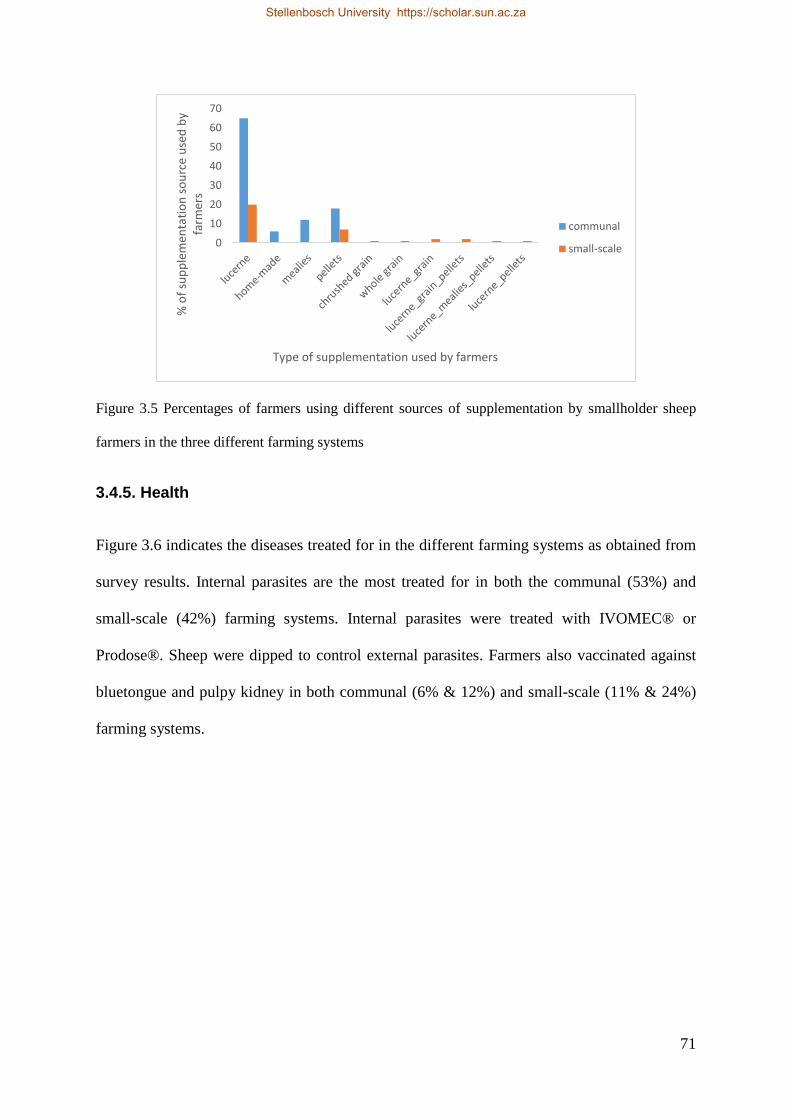
71
Figure 3.5 Percentages of farmers using different sources of supplementation by smallholder sheep
farmers in the three different farming systems
3.4.5. Health
Figure 3.6 indicates the diseases treated for in the different farming systems as obtained from
survey results. Internal parasites are the most treated for in both the communal (53%) and
small-scale (42%) farming systems. Internal parasites were treated with IVOMEC® or
Prodose®. Sheep were dipped to control external parasites. Farmers also vaccinated against
bluetongue and pulpy kidney in both communal (6% & 12%) and small-scale (11% & 24%)
farming systems.
0
10
20
30
40
50
60
70
% o
f su
pp
lem
enta
tio
n s
ou
rce
use
d b
y fa
rmer
s
Type of supplementation used by farmers
communal
small-scale
Stellenbosch University https://scholar.sun.ac.za
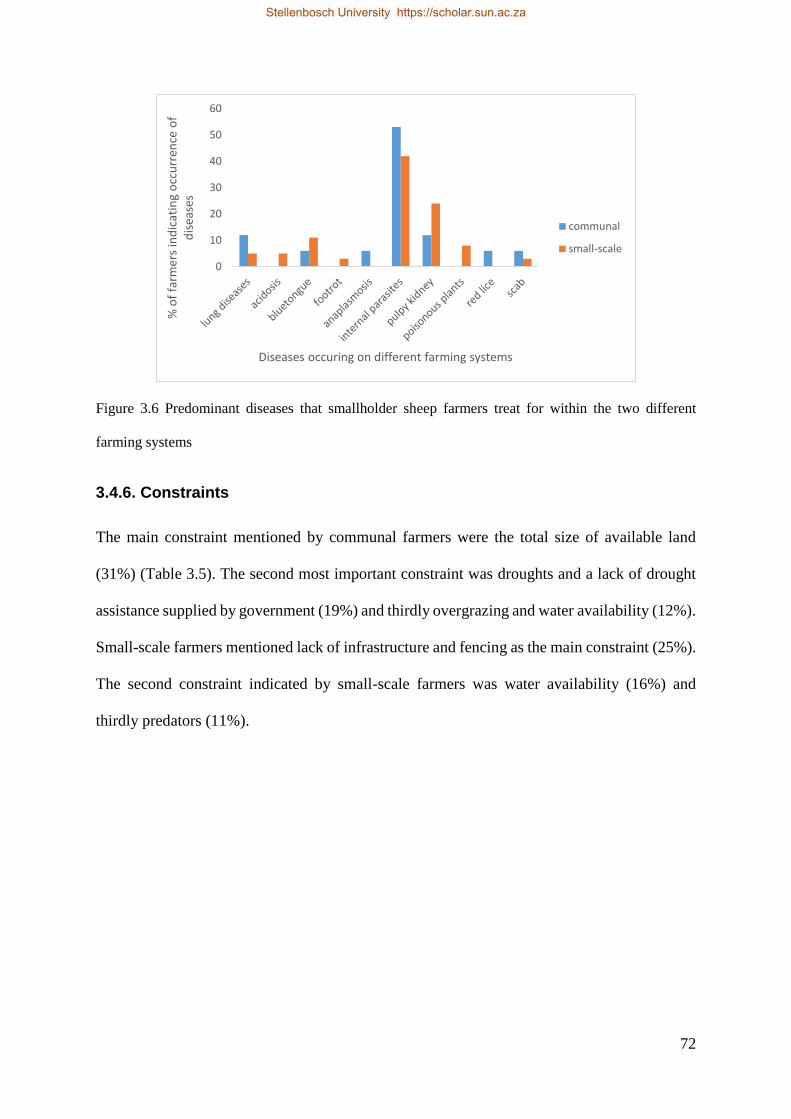
72
Figure 3.6 Predominant diseases that smallholder sheep farmers treat for within the two different
farming systems
3.4.6. Constraints
The main constraint mentioned by communal farmers were the total size of available land
(31%) (Table 3.5). The second most important constraint was droughts and a lack of drought
assistance supplied by government (19%) and thirdly overgrazing and water availability (12%).
Small-scale farmers mentioned lack of infrastructure and fencing as the main constraint (25%).
The second constraint indicated by small-scale farmers was water availability (16%) and
thirdly predators (11%).
0
10
20
30
40
50
60
% o
f fa
rmer
s in
dic
atin
g o
ccu
rren
ce o
f d
isea
ses
Diseases occuring on different farming systems
communal
small-scale
Stellenbosch University https://scholar.sun.ac.za
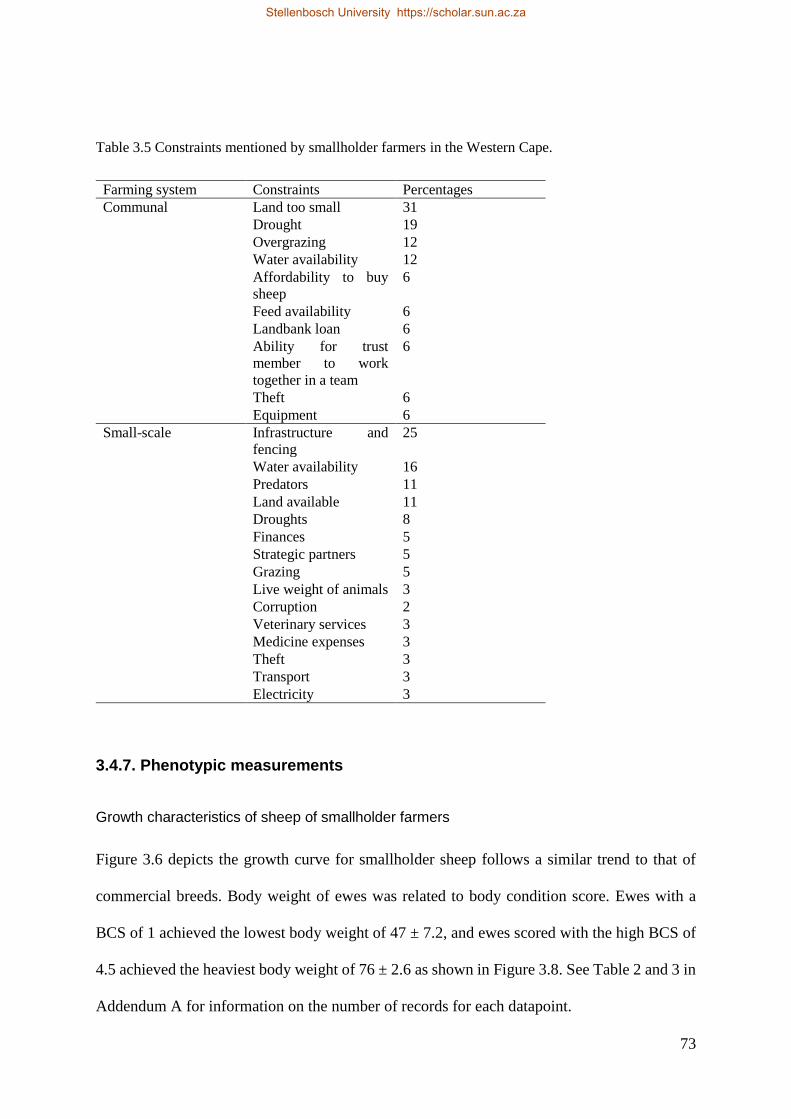
73
Table 3.5 Constraints mentioned by smallholder farmers in the Western Cape.
Farming system Constraints Percentages
Communal Land too small 31
Drought 19
Overgrazing 12
Water availability 12
Affordability to buy
sheep
6
Feed availability 6
Landbank loan 6
Ability for trust
member to work
together in a team
6
Theft 6
Equipment 6
Small-scale Infrastructure and
fencing
25
Water availability 16
Predators 11
Land available 11
Droughts 8
Finances 5
Strategic partners 5
Grazing 5
Live weight of animals 3
Corruption 2
Veterinary services 3
Medicine expenses 3
Theft 3
Transport 3
Electricity 3
3.4.7. Phenotypic measurements
Growth characteristics of sheep of smallholder farmers
Figure 3.6 depicts the growth curve for smallholder sheep follows a similar trend to that of
commercial breeds. Body weight of ewes was related to body condition score. Ewes with a
BCS of 1 achieved the lowest body weight of 47 ± 7.2, and ewes scored with the high BCS of
4.5 achieved the heaviest body weight of 76 ± 2.6 as shown in Figure 3.8. See Table 2 and 3 in
Addendum A for information on the number of records for each datapoint.
Stellenbosch University https://scholar.sun.ac.za
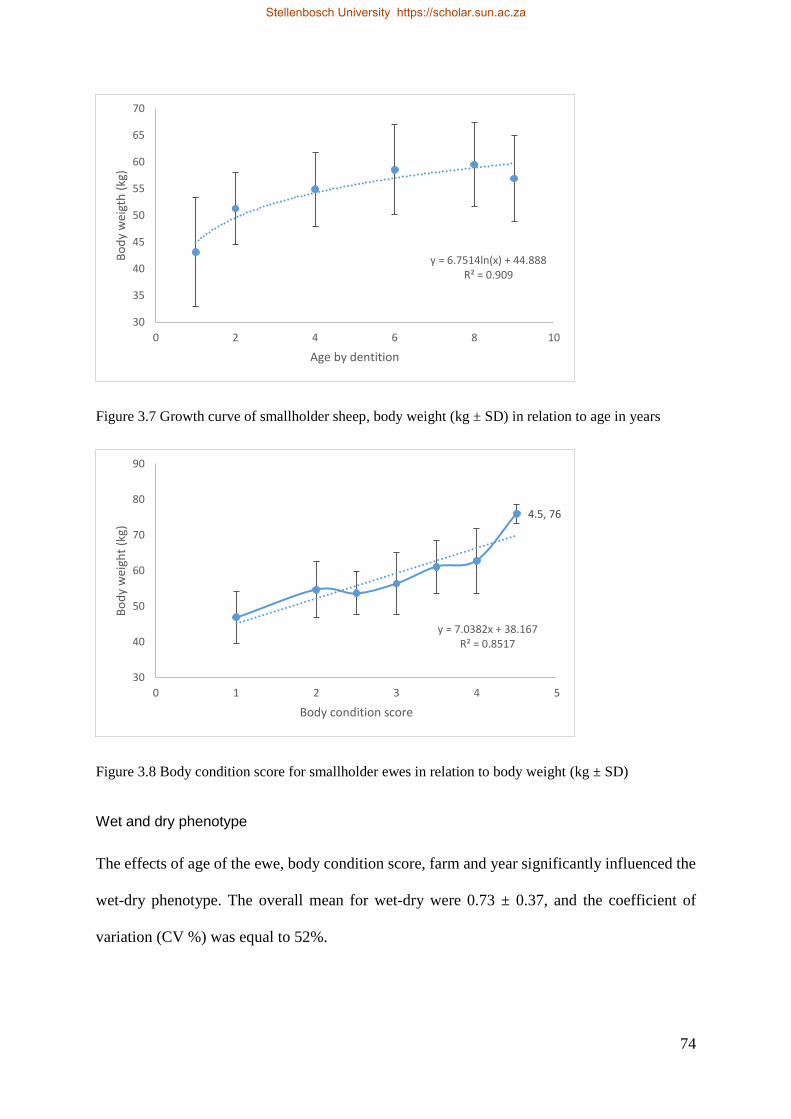
74
Figure 3.7 Growth curve of smallholder sheep, body weight (kg ± SD) in relation to age in years
Figure 3.8 Body condition score for smallholder ewes in relation to body weight (kg ± SD)
Wet and dry phenotype
The effects of age of the ewe, body condition score, farm and year significantly influenced the
wet-dry phenotype. The overall mean for wet-dry were 0.73 ± 0.37, and the coefficient of
variation (CV %) was equal to 52%.
y = 6.7514ln(x) + 44.888R² = 0.909
30
35
40
45
50
55
60
65
70
0 2 4 6 8 10
Bo
dy
wei
gth
(kg
)
Age by dentition
4.5, 76
y = 7.0382x + 38.167R² = 0.8517
30
40
50
60
70
80
90
0 1 2 3 4 5
Bo
dy
wei
ght
(kg)
Body condition score
Stellenbosch University https://scholar.sun.ac.za
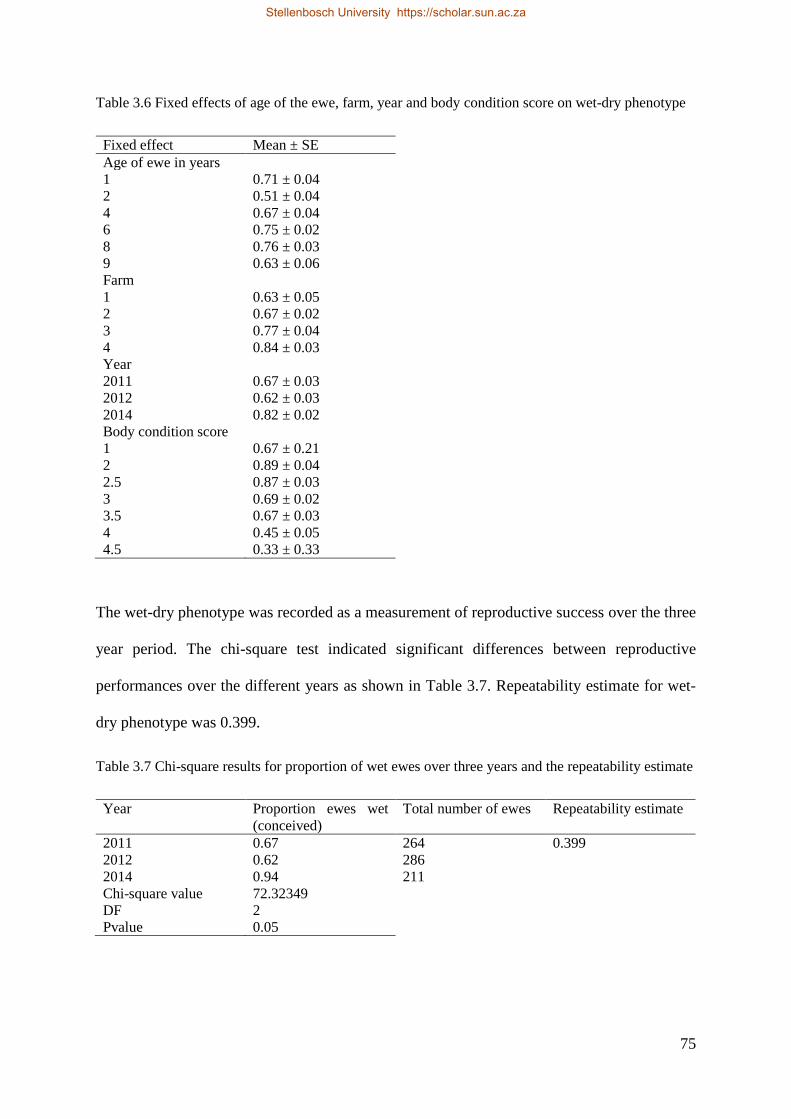
75
Table 3.6 Fixed effects of age of the ewe, farm, year and body condition score on wet-dry phenotype
Fixed effect Mean ± SE
Age of ewe in years
1 0.71 ± 0.04
2 0.51 ± 0.04
4 0.67 ± 0.04
6 0.75 ± 0.02
8 0.76 ± 0.03
9 0.63 ± 0.06
Farm
1 0.63 ± 0.05
2 0.67 ± 0.02
3 0.77 ± 0.04
4 0.84 ± 0.03
Year
2011 0.67 ± 0.03
2012 0.62 ± 0.03
2014 0.82 ± 0.02
Body condition score
1 0.67 ± 0.21
2 0.89 ± 0.04
2.5 0.87 ± 0.03
3 0.69 ± 0.02
3.5 0.67 ± 0.03
4 0.45 ± 0.05
4.5 0.33 ± 0.33
The wet-dry phenotype was recorded as a measurement of reproductive success over the three
year period. The chi-square test indicated significant differences between reproductive
performances over the different years as shown in Table 3.7. Repeatability estimate for wet-
dry phenotype was 0.399.
Table 3.7 Chi-square results for proportion of wet ewes over three years and the repeatability estimate
Year Proportion ewes wet
(conceived)
Total number of ewes Repeatability estimate
2011 0.67 264 0.399
2012 0.62 286
2014 0.94 211
Chi-square value 72.32349
DF 2
Pvalue 0.05
Stellenbosch University https://scholar.sun.ac.za
76
3.5. Discussion
The farming systems were predominantly small-scale across the Karoo and Eden districts, with
communal systems being predominant in the West Coast. Communal farming systems occurred
where large areas of state owned rangeland were used by a group of farmers for grazing their
livestock.
The number of LSU corresponded to the farm size, thus farmers with larger land owned more
livestock. Similar findings were reported by Dagnew et al. (2017). The recommended grazing
capacity for the West Coast district is 30ha/LSU, 36ha/LSU in the Karoo and 54 ha/LSU in the
Eden district (Saayman, 2016). There was variation among farming systems for stocking rate.
In the Eden, district both communal (0.26 ha/LSU) and small-scale (18.5 ha/LSU) farmers were
overstocking in comparison to all three farming systems represented in the Karoo and West
Coast district which were within the limit of the recommended grazing capacity. Rangeland
condition scores did not differ between the farming systems or vegetation type. The values for
Karoo vegetation type, however, fell within the values derived for farms in Beaufort West (Du
Toit, 1995). Range condition scores are influenced by the dominant vegetation type. If the
condition score is low (60-199) the range is dominated by climax grasses, and higher range
condition scores (200-350) is an indication of where Karoo bushes dominate the vegetation
available (Du Toit, 1995). The range condition scores for this study were on average low for
the different farming systems. The results for the rangeland condition score between the
farming systems could be influenced by the fact that the small-scale farm were assessed during
the wet-season. In the wet-season there was an abundance of annual plants species, which have
a lower forage value and this could have decreased the rangeland condition score. The
communal farms were assessed in the dry season which lacked annual species and therefore
attained a higher absolute value. The rangeland condition score is important to assess as it used
to estimate grazing capacity of the rangeland. This in turn determines the availability of
Stellenbosch University https://scholar.sun.ac.za
77
adequate nutrition for sheep and agrees with the high carrying capacity (ha/LSU) observed for
farmers in Eden and West Coast districts in this study.
The main reason for keeping livestock was for home consumption and secondly for income
purposes in both communal and small-scale farming systems. This concur with other studies
where livestock was kept mainly for regular cash income and secondly for meat production,
both in small stock (Kosgey et al., 2008) and in cattle (Mapiye et al., 2009). The skins obtained
from the sheep were of importance for some communal farmers as they stated that it is used as
“extra income of the sheep skin for transport cost to the abattoir”. Wool as a commodity is
expected to be important for farmers keeping Merino-type sheep as this would be a secondary
income. It is important to note that the need for livestock for cultural purposes and tradition
were ranked lower for small-scale farmers than for communal farmers. This is in contrast to
smallholder livestock farmers in the Eastern Cape or Limpopo (Stroebel et al., 2011) who kept
livestock primarily for cultural and/or traditional purposes. However, communal smallholder
farmers in the Western Cape ranked sheep kept for cultural purposes higher than small-scale
farmers even though it was still not the primary reason for keeping sheep.
The Dorper was the most prominent breed used in these farming systems. This is due to the
Dorper being known for its favourable growth and carcass traits as well as hardiness. The
Dorper is also known as an easy care sheep (Milne, 2000). The limited use of indigenous breeds
like the Damara and Persian could be due to the unfavourable carcass characteristics
(Tshabalala, 2000; Burger et al., 2013). Indigenous breeds, however, play an important role in
terms of adaptability and being more suitable for low-input farming systems. Kosgey et al.
(2006) confirm the limited use of indigenous breeds in smallholder sheep farming systems in
the tropics. However, the introduction of exotic breeds has not always been successful, due to
observed genotype x environmental interactions. Introduction of exotic breeds could be
accompanied with higher inputs and might not be sustainable to maintain in the long term.
Stellenbosch University https://scholar.sun.ac.za
78
The percentage of breeding ewes ranged from 39%-95% across all three farming systems
(Table 3.3). Similar results were obtained in a study by Spies & Cloete (2013) for smallholder
sheep farmers in the Free State. The number of mature ewes observed in this study was high in
comparison to commercial flock structures that have 44% mature ewes. The percentage of
lambs were low ranging from 0.17% to 2% compared to commercial flocks comprising up to
41% lambs (Spies & Cloete, 2013). Flock structure influences the annual genetic gain made in
a flock (Turner & Young, 1969). The initial joining age of rams and the number of ram and
ewe deaths also impact on annual genetic gain. A high number of rams relative to ewes
compromises annual genetic gain (Turner & Young, 1969). It is therefore important for
smallholder farmers who want to emerge into the commercial sector to improve their flock
structure if they want to enhance genetic gain in their flocks. The age structure of the ewe flock
has an effect on the output from the current flock. Achieving good production is difficult when
reproduction performance is poor and you need to retain ewes beyond 6.5 years. This will lead
to an increase in generation interval and compromise genetic gain.
The highest ranked traits that were selected for in communal farming systems included
temperament, control of flies, meat taste, growth rate, fertility and foraging ability. The small-
scale farmers selected for traits such as conformation, mothering ability, disease tolerance, heat
tolerance and temperament. This is in accordance with other studies in the tropics where
smallholder farmers consider fitness traits as most important (Kosgey et al., 2006) in
comparison to growth and carcass traits. Heat tolerance is relevant to select for considering that
sheep are raised in the Karoo environment, which is known for its extreme heat. Numerous
traits can be used to select for heat tolerance in sheep, these include, sweating rate, heart rate,
breathing rate, rectal temperature and skin temperature, coat colour and eye temperature
(McManus et al., 2009, McManus et al., 2011; McManus et al., 2016). However, in dairy cattle
temperature humidity index (THI) has been used to estimate response for selection to heat
Stellenbosch University https://scholar.sun.ac.za
79
stress (Carabaño et al., 2017). Selection for size is important, as larger sheep will yield more
income. Temperament is important to select for ease of handling sheep when tagging and
dosing are necessary.
Lucerne was the main source of supplementation used in smallholder systems. This is due to
most farmers cropping lucerne on their farms. Lucerne was harvested, bailed, and used as
conserved feed during times of food shortages.
Gastrointestinal parasites were one of the prominent conditions treated for by both communal
and small-scale farmers in all three districts. This result were consistent with other studies
(Adesehinwa et al., 2004; Zvinorova et al., 2016) on communal goats, where internal parasites
were mentioned as a major challenge. However, the majority of farmers in this study used
IVOMEC® for internal parasites. IVOMEC® is a broad spectrum parasiticide and treats
roundworms, lungworms, mange mites and sucking lice. Internal parasites may become
resistant to treatment if the same parasiticide is used consecutively. Alternating the active
ingredient for drenches is thus recommended to prevent resistance. Considering that internal
parasites were one of the prominent ailments both communal and small-scale farmers were
treating, selection objective to increase parasite resistance could also be included in breeding
objectives. The different types of internal parasites were not studied in detail and further
research needs to be conducted. Vaccinations for pulpy kidney and blue tongue were done by
a minority of farmers in respective farming systems. Faecal worm egg counts (FEC) as an
indicator of gastrointestinal parasite resistance or using the FAMACHA system can be included
in selection objective (Cloete et al., 2016). This could lead to reduced input costs to buy
anthelmintics. FAMACHA is a subjective score from 1-5 of the conjunctivae of the eye to
indicate anaemia due to Heamonchus contortus spp (Van Wyk & Bath, 2002). Studies done
have indicated that FAMACHA were positively correlated to FEC, indicating that animals with
high anaemic scores were more likely to have high FEC counts (Cloete et al., 2016). The
Stellenbosch University https://scholar.sun.ac.za
80
heritability estimates of both FAMACHA and FEC is 0.12 to 0.13 and 0.12-0.14 respectively
(Cloete et al., 2016). This latter study indicated that it is possible to achieve genetic progress if
selection is made for these traits due to the high additive variation observed for these traits
(Cloete et al., 2016).
Land availability was the main constraint mentioned by communal sheep farmers, whereas
small-scale indicated infrastructure and fencing as major constraints. This was in contrast to
other studies that identified diseases as major constraints of smallstock production (Zvinorova
et al., 2016; Dagnew et al., 2017). The reason for the difference could be due to farmers in the
Western Cape being able to treat their sheep against diseases and thus does not see intestinal
parasites and diseases as major constraints. Communal farmers primarily cited lack of land as
a constraint because they were overgrazing their rangelands in relation to the recommended
carrying capacity. Droughts and water availability were also prominent constraints mentioned
by farmers. This could possibly be linked to predicted changes in climate as reported by the
IPCC (Niang et al., 2014).
The recorded body weights for smallholder Dorpers concur with literature figures (Snyman &
Herselman, 2005; Cloete et al., 2000). Similar weights were recorded for 10 months lambs that
concur with milk tooth ewes observed in our study. The effect of age on body weight is
expected as physiologically animals grow in size and weight, as they get older. Body condition
score influenced body weight. Body condition score is an indication of the body energy
reserves of the sheep. A heavier sheep has more fat reserves than a lighter sheep. The study
indicated that ewes with a high BCS achieved a higher body weight. Similar results were
obtained in a study comparing the effect of sourveld vs. sweetveld on body weight and body
condition score (Mvinjelwa et al., 2014).
The wet-dry phenotype is a composite trait and includes both conception rate and mothering
ability. The wet-dry phenotype is indicative of the ability of a ewe to conceive, maintain
Stellenbosch University https://scholar.sun.ac.za
81
pregnancy without aborting, successful delivery and survival of lambs. The effects of age, body
condition and body weight were expected as reproductive performance have been shown to
decrease mating weight is below 45-50 kg and 2 tooth ewes have also been shown to have
lower breeding performance than older ewes due to live weight at mating (Coop, 1962). The
differences between ewes reproductive performance over the three years was also expected
since the ewes grew in age. The repeatability estimate for wet-dry of this study is higher than
that of Cloete & Heydenrych (1986). This indicates that it is possible to make genetic
improvement if selection is made for wet-dry in smallholder sheep flocks.
3.6. Conclusions
There was variation amongst smallholder sheep production systems in the Western Cape
Province of South Africa. The communal and small-scale farmers had similar reasons for
keeping sheep, but had different breeding objectives and mentioned different constraints. The
unbalanced flock structure could impose a limit on genetic progress and compromise
production in the current flock. The limited use of indigenous breeds is of concern and the
benefits of incorporation of indigenous sheep breeds should be elucidated to smallholder
farmers. The use of wet-dry phenotype to measure reproductive success was identified as a
promising tool. It can be used by farmers to select ewes that are more reproductively fit in low-
input systems involving limited recordkeeping and to cull ewes that are barren consecutively.
This study indicates that there were differences in sheep breeding and management practices
by communal and small-scale farmers in the Western Cape. Implementation of breeding and
management plans should, therefore, be farm-specific and the impact of climate change on
production should be considered.
Stellenbosch University https://scholar.sun.ac.za
82
3.7. References
Acocks, J.P.H., 1988. Veld types of South Africa. Memoirs of the Botanical Survey of South
Africa, 57. SANBI, Pretoria.
Adesehinwa, A.O.K., Okunola, J.O. & Adewumi, M.K., 2004. Socio-economic characteristics
of ruminant livestock farmers and their production constraints in some parts of South-
western Nigeria. Livest. Res. Rur. Develop. 16 (8)
Almeida, A.M., 2011. The Damara in the context of Southern Africa fat-tailed sheep breeds.
Trop. Anim. Health Prod. 43, 1427–1441.
Burger, A., Hoffman, L.C., Cloete, J.J.E., Muller, M. & Cloete, S.W.P., 2013. Carcass
composition of Namaqua Afrikaner, Dorper and SA mutton merino ram lambs reared
under extensive conditions. S. Afr. J. Anim. Sci. 43, S27-S32
Carabaño, M.J., Ramón, M., Díaz, C., Molina, A., Pérez-Guzmán, M.D. & Serradilla, J.M.,
2017. Breeding for resilience to heat stress effects: A comparison across dairy ruminant
species. J.Anim. Sci. 95, 1813-1826.
Cloete, S.W.P. & Heydenrych, H.J., 1986. The repeatability of reproduction rate in the
Tygerhoek Merino flock. S. Afr. J. Anim. Sci. 17, 15-21.
Cloete, J.J.E., Cloete, S.W.P., Scholtz, A.J. & Matthee, S., 2013. The effect of breed, ewe age
and season on tick counts of indigenous and commercial sheep in South Africa. Proc.
Assoc. Advmt Anim. Breed. Genet. 20, 187–190.
Cloete, S.W.P., Olivier, J.J., Sandenbergh, L. & Snyman, M.A., 2014. The adaption of the
South Africa sheep industry to new trends in animal breeding and genetics: A review.
S. Afr. J. Anim. Sci. 44, 307–321.
Stellenbosch University https://scholar.sun.ac.za
83
Cloete, S.W.P., Mpetile, Z. & Dzama, K., 2016. Genetic parameters involving subjective
FAMACHA scores on two farms in the Mediterranean region of South Africa. Small
Rumin. Res. 145, 33-45.
Coop, I.E., 1962. Liveweight productivity relationships in sheep. N. Z. J. Agric. Res. 5, 249-
264.
Dagnew, Y., Urge, M., Tadesse, Y. & Gizaw, S., 2017. Sheep production and breeding
Systems in North Western lowlands of Amhara Region, Ethiopia: Implication for
conservation and improvement of Gumz sheep breed. Open J. Anim. Sci. 7, 179- 197.
Directorate Statistics and economic analysis. 2013. Abstract of Agricultural statistics.
Pretoria South Africa.
Du Toit, P.C.V., 1995. The grazing index method of range condition assessment. Afr. J.
Range Forag. Sci.12, 61-67.
Everett-Hincks, J.M. & Dodds, K.G., 2008. Management of maternal-offspring behavior to
improve lamb survival in easy care sheep systems. J. Anim. Sci. 86
Fourie, A.J. & Cloete, S.W.P., 1993. Reproductive performance of commercial Merino,
Dohne Merino and SA Mutton Merino flocks in the Southern Cape. S. Afr. J. Anim.
Sci. 23, 104-110.
Goddard, M., 2009. Fitness traits in animal breeding programs. In Adaptation and fitness in
farm animal populations. Eds. Van der Werf, J.H.J.; Graser, H-U.;Frankham, R.;
Gondro, C. (ed.) Springer Science & Business Media.
Hatcher, S., Curran, G., White, A., Casey, A. & Refshauge, G., 2013. Sheep udder assessment
at lamb marking. NSW, Department of Primary Industry.
Stellenbosch University https://scholar.sun.ac.za
84
http://www.dpi.nsw.gov.au/animals-and-
livestock/sheep/management/reproduction/sheep-udder-assessment. Accessed on the 13
October 2017.
Huisman, A.E. & Brown, D.J., 2009. Genetic parameters for bodyweight, wool, and disease
resistance and reproduction traits in Merino sheep. 3. Genetic relationships between
ultrasound scan traits and other traits. Anim. Prod. Sci. 49, 283–288.
Iniguez, L.C., Quaas, R.L. & Van Vleck, L.D., 1986. Lambing performance of Morlam and
Dorset ewes under accelerated lambing systems. J. Anim. Sci. 63, 1769–1778.
Kosgey, I.S., Baker, R.L., Udo, H.M.J. & Van Arendonk, J.A.M., 2006. Successes and
failures of small ruminant breeding programmes in the tropics: a review. Small Rumin.
Res. 61, 12-28.
Kosgey, I.S., Rowlands, G.J., Van Arendonk, J.A.M. & Baker, R.L., 2008. Small ruminant
production in smallholder and pastoral/extensive farming systems in Kenya. Small
Rumin. Res. 77, 11-24.
Kottek, M., Grieser, J., Beck, C., Rudolf, B. & Rubel, F., 2006. World Map of the Köppen-
Geiger climate classification updated. Meteorol. Z., 15, 259-263. DOI: 10.1127/0941-
2948/2006/0130.
Kunene, N., Nesamvuni, E. A. & Fossey, A., 2007. Characterisation of Zulu (Nguni) sheep
using linear body measurements and some environmental factors affecting these
measurements. S. Afr. J. Anim. Sci. 37, 11–20.
Lee, G.J., Sladek, M.A. & Atkins, K.D. 2010. Selection criteria for within flock selection to
improve reproduction efficiency. Available at:
Stellenbosch University https://scholar.sun.ac.za
85
http://www.livestocklibrary.com.au/bitstream/handle/1234/33711/SheepCRC_2_87.pdf
?sequence=1.
Mapiye, C., Chimonyo, M., Dzama, K., Raats, J.G. & Mapekula, M., 2009. Opportunities for
improving Nguni cattle production in smallholder farming systems of South Africa.
Livest. Sci. 124,196-204.
Milne, C., 2000. The History of the Dorper. Small Rumin. Res. 36, 99-102.
McManus, C., Paludo, G.R., Louvandini, H., Gugel, R., Sasaki, L.C.B. & Paiva, S.R. 2009.
Heat tolerance in Brazilian sheep: Physiological and blood parameters. Trop. Anim.
Health. Prod. 41, 95-101.
McManus, C., Louvandini, H., Gugel R., Sasaki, L.C.B., Biachini, E., Bernal, F.E.M., Paiva,
S.R. & Paim, T.P. 2011. Skin and coat traits in sheep in Brazil and their relation with
heat tolerance. Trop. Anim. Health. Prod. 43, 121-126.
McManus, C., Dallago, B.S.L., Lehugeur, C., Ribeiro, L.A., Hermuche, P., Guimarães, R.F.,
de Carvalho Júnior, O.A. & Paiva, S.R., 2016. Patterns of heat tolerance in different
sheep breeds in Brazil. Small Rumin. Res. 144, 290-299.
Palmer, A.R. & Bennett, J.E., 2013. Degradation of communal rangelands in South Africa:
towards an improved understanding to inform policies. Afr. J. Range Forage Sci. 30,
57-63.
Piwczyński, D. & Kowaliszyn, B., 2013. Heritability and breeding value of sheep fertility
estimated by means of the GIBBS sampling method using the linear and threshold
models. J. Centr. Euro. Agric. 14, 23–32.
Stellenbosch University https://scholar.sun.ac.za
86
Saayman, N., 2016. Basic guidelines for veld management: Central Karoo. Infopack –
Research and Technology Development Services, Western Cape Department of
Agriculture. Saayman, 2016. (http://elsenburg.com/research-article/basic-guidelines-
veld-management-central-karoo-infopack -accessed 10 April 2017)
Safari, E., Fogarty, N.M. & Gilmour, A.R., 2005. A review of genetic parameter estimates for
wool, growth, meat and reproduction traits in sheep. Livest. Prod. Sci. 92, 271–289.
Safari, E., Fogarty, N.M., Gilmour, A.R., Atkins, K.D., Mortimer, S.I., Swan, A.A., Brien,
F.D., Greeff, J.C. & Van Der Werf, J.H.J., 2007. Across Population Genetic Parameters
for Wool, Growth, and Reproduction Traits in Australian Merino Sheep. 1. Data
Structure and Non-Genetic Effects. Aust. J. Agric. Res. 58, 169–175.
Schoeman, S.J., Cloete, S.W.P. & Olivier, J.J., 2010. Returns on investment in sheep and goat
breeding in South Africa. Livest. Sci.130, 70–82.
Snyman, M.A. & Herselman, M.J., 2005. Comparison of productive and reproductive
performance efficiency of Afrino, Dorper and Merino sheep in the False Upper Karoo.
S. Afr. J. Anim. Sci. 35, 98-108.
Snyman, M.A., Van Marle-Koster, E, Qwabe, S.Q. & Visser, C., 2013. Genetic and phenotypic
profile of three South African Namaqua Afrikaner sheep flocks. Grootfontein Agric,
13. Available at: http:/gadi.agric.za/Agric/Vol13No1_2013/namaqua.php.
Spies, D.C. & Cloete, P.C., 2013. Performance and marketing options for red meat in the
formal and informal value chains in the Free State Province. 19th International Farm
Management Congress, SGGW, Warsaw, Poland.
Stellenbosch University https://scholar.sun.ac.za
87
Stoffel, M.A., Nakagawa, S. & Schielzeth, H., 2017. rprR: Repeatability estimation and
variance decomposition by generalized linear mixed-effects models. Method Ecol.
Evol. doi: 10.1111/2041-210X.12797
Stroebel, A., Swanepoel, F.J.C. & Pell, A.N., 2011. Sustainable smallholder livestock
systems: A case study of Limpopo Province, South Africa. Livest. Sci. 139,186-190.
Thompson, J. & Meyer, H., 1994. Body condition scoring of sheep. Oregon state University
Extension services. Available from https://hdl.handle.net/1957/14303 accessed 15
October 2017.
Tosh, J.J., Wilton, J.W. & Kennedy, D., 2002. Heritability of Fertility in Four Seasons’, in
7th World Cong. Genet. Appl. Livest. Prod. Montpellier, France, pp. 23–26.
Tshabalala, P., 2000. Meat quality of South African indigenous goat and sheep breeds. MInst
Agrar Food Processing. University of Pretoria, South Africa.
Turner, H.N. & Young, S.S.Y., 1969. Chapter 16. The influence of flock structure on
productivity. In: Quantitative Genetics in Sheep Breeding. Eds by Cornell University
Press, Ithaca, New York.
Wilson, R.T. & Durkin, J.W. 1984. Age at permanent incisor eruption in indigenous sheep
and goats in semi-arid Africa. Livest. Prod. Sci. 11, 451-455.
Zishiri, O.T., Cloete, S.W.P., Olivier, J.J. & Dzama, K., 2013. ‘Genetic parameter estimates
for subjectively assessed and objectively measured traits in South African Dorper
sheep’, Small Rumin. Res. 109, 84–93.
Zvinorova, P.I., Halimani, T.E., Muchadeyi, F.C., Katsande, S., Gusha, J. & Dzama, K., 2016.
Management and control of gastrointestinal nematodes in communal goat farms in
Stellenbosch University https://scholar.sun.ac.za

88
Zimbabwe. Trop. Anim. Health Prod. 49, 361-367.
Stellenbosch University https://scholar.sun.ac.za
89
Chapter 4
Factors influencing offtake in smallholder sheep farming systems in
the Western Cape, South Africa
Abstract
The purpose of this study was to determine factors that influence sustainable offtake in
smallholder sheep farming systems in the Western Cape province of South Africa. Interviews
were conducted with 72 smallholder farmers in three districts of the Western Cape, namely the
West Coast, Karoo and Eden. General information on the socio-economic status of the farmers
was obtained through semi-structured questionnaires. Numbers of lambs sold and offtake rates
were assessed as economic indicators. A logistic regression was fitted to determine which
socio-economic factors influenced sources of income and sale outlet. The effects of district,
farming type, sources of income, participation in government programs and flock size on
number of lambs sold and offtakes rates were analysed by fitting a general linear model.
Livestock production was the major activity for 76 % of the smallholder farmers while
cropping represented 24%. Fifty one percent of the respondents fell within the age range of 40
to 60 years of age, whereas 20% were younger than 40 and 29% were older than 60 years of
age. Sixty seven percent of the farmers ranked themselves as having a medium wealth status,
while 32% ranked themselves as poor. The households interviewed were male dominated with
90% of the respondents being male and only 10% female. Land ownership was categorised as
36% self-owned, 29% leased and 29% communal land. District significantly influenced sale-
outlet. The West Coast obtained a chance of 15% to sell their product to the abattoir. Whereas
the Karoo and Eden were not different in terms of sale outlet.
Stellenbosch University https://scholar.sun.ac.za
90
Land ownership significantly influenced the farmers’ source of income. The probability of
males obtaining income from their salary vs. obtaining income from grants was 13 times more
than females. The probability of those farmers who lease land vs. communal land ownership
patterns to obtain their main income from salary was 4 times more than obtaining income from
grants/pension. The main sources of income for the Karoo farmers was livestock (46%) and
for Eden crops (32%). Contrary to other districts, farmers in the West Coast area mostly relied
on salaries (43%), thus off-farm income. The results of the general linear model indicated that
only district significantly (P<0.05) influenced average number of lambs sold and offtake rate.
The Karoo district sold a higher average number of lambs per year (41 ± 8.8), with West Coast
and Eden selling the same average number of lambs per year at 7 ± 2.2 and 7 ± 2.6 respectively.
Offtake rates did not differ among districts and were 17 ± 17% for Eden, 48% ± 20% for the
Karoo and 46 ± 20% for West Coast. Based on the social status of the farmers (age of farmer,
gender and wealth status), the farming systems in the three districts were moderately
sustainable. Based on the economic status (average number of lambs sold and offtake rate) the
farming systems in the three districts were poorly sustainable.
4.1. Introduction
Small stock is mainly kept for socio-economic benefits by poor Southern Africa communities.
Such benefits include household food security, capital and direct income (Moyo & Swanepoel,
2010). Most of the surface area in South Africa is semi-arid which makes it unsuitable for
anything but extensive ruminant livestock farming (Cloete & Olivier, 2010). The ability of
sheep to adapt to diverse and often adverse climatic conditions (Rust & Rust, 2013) ensures
that the species plays an important role in resource-poor systems. It is crucial to understand the
adaptation of sheep to such systems to ensure the sustainable utilisation of vast areas of low-
potential shrubland in the rural parts of South Africa. Smallholder farming systems in tropical
areas are seen as unsustainable, as measured against social, economic and environmental
Stellenbosch University https://scholar.sun.ac.za
91
dimensions (Manyong & Degand, 1996). Few studies in South Africa have described
smallholder sheep farming systems in the Western Cape (Grobler, 2010). Some studies were
also done in the Eastern Cape and Limpopo and focussed on communal farming systems in
rural villages (Marais, 2007; Stroebel, 2011) including market access and the economics of
smallholder systems. These studies highlighted the difficulty of smallholder farmers to attain
market access and improve their livelihoods, thereby implying economic unsustainability.
There are different socio-political issues at hand. The implementation of black economic
empowerment (BEE) in South Africa after the 1994 election profoundly affected smallholder
farmer production. Farming dynamics are different in each province of South Africa and need
to be understood before implementing any strategy to improve production (Schwalbach et al.,
2001). Programmes like the Land Redistribution for Agricultural Development (LRAD) and
the Comprehensive Agricultural Support Programme (CASP) have been initiated by the
Department of Agriculture to assist in the agricultural development and land restitution of
underprivileged communities benefitting from BEE. These initiatives aimed to increase overall
agricultural production in rural areas. Increased agricultural production is expected to improve
national and household food security, which is under pressure in Southern Africa (Aliber,
2009). These programmes had some shortcomings and more recent programmes have been
introduced as compensation. The Proactive Land Acquisition Strategy (PLAS) is a program
that acquires land for smallholder candidates that have commercial farmers assigned as mentors
for the first five years of farming.
Smallholder farmers in South Africa are vulnerable to food insecurity and mostly under the
poor in the social ranks (Altman et al., 2009, Thamaga-Chitja & Morojele, 2014). The average
monthly income per household is $390.29 (Statistics South Africa, 2014) with an average
household size of 7 members (Mapiye et al., 2009). The role that sheep play to provide food
and income is of paramount importance for sustaining the rural livelihood. The offtake of sheep
Stellenbosch University https://scholar.sun.ac.za
92
production depends on the ewes as the main productive units producing lambs that are sold for
generating income. The prices for lamb in South Africa is currently $5.15 p/kg for lambs with
a medium fat cover on the carcass (Webb, 2015) in the formal market. A carcass weighing 16-
20 kg can thus earn up to $82.4 – $103 for a resource-poor farmer. Smallholder farmers,
however, prefer to sell lambs/adult sheep on the hoof for any price ranging between $60-$91
on the informal market (personal communication with smallholder farmers). Commercially the
important factor determining the success of a sheep farmer would be lamb output (numbers or
weight marketed) expressed relative to the number of ewes maintained. Acceptable
performance in an extensive commercial system ranges between 110-156% for lambing
percentages (Snyman & Herselman, 2005) and between 94-132% (Snyman & Herselman,
2005) for weaning percentage (both expressed over ewes joined). Smallholder farmers in
contrast do not achieve high lambing and weaning percentages due to a number of constraints.
These constraints include obsolete management practices, poor environmental conditions
resulting from the overexploitation of resources, unstable feed availability, limitations to
grazing rights and the adaptability of the breed(s) used, as well as the number of sheep owned
by the individual relative to the resources allocated (Mapiye et al., 2009, Rust et al., 2015).
Grobler (2010) indicated that, of the 17 farms benefitting from the LRAD and CASP
programmes, only 4 showed acceptable lamb marketing percentages. Low lamb marketing
percentages (defined as lambs sold per ewe mated) resulted from severe drought conditions
and lamb losses due to predators. Measuring accurate lambing percentages for smallholder
sheep farmers is challenging as these farmers mostly farm extensively and do not keep records.
Offtake can therefore be used as a proxy to determine farm productivity. Offtake rate can be
defined as the proportion of animals sold or consumed within a year relative to the breeding
flock maintained (Otte & Chilonda, 2002).
Stellenbosch University https://scholar.sun.ac.za
93
In Chapter 3 the sheep farming characteristics including breeding practices were investigated.
However, a holistic approach is needed to address limitations to production in smallholder
sheep farming systems (Kosgey et al., 2006). Determining the socio-economic factors that
contributes to offtake is therefore important. Against this background, the present study
elucidates factors that influence the different sale outlets and sources of income as well as the
average number of lambs sold and offtake rate.
4.2. Material and methods
4.2.1. Description of the study site
The sampling site was described in Chapter 3.
4.2.2. Household surveys
As described in section 3.2.2. in Chapter 3 (Map 3.1). Information on the number of lambs sold
per year as indication of production performance of the flock and the number of animal entries
and exists per annum were also recorded.
4.2.3. Statistical analysis
Descriptive data pertaining to farming systems were analysed using the Statistical Analysis
Systems (SAS, 2014) procedures SURVEYMEANS and the SURVEYFREQ. An ordinal
logistic regression analysis was used to predict the odds of different sources of income, and
different sale outlets given the socio-economic profile and district, farm size and farming
system of the farmers (see Chapter 3). Sources of income were classified into 5 levels: 1) crops,
2) livestock, 3) home industries, 4) salary and 5) grants. Sale outlets were classified into 4
levels: 1) auction, 2) butchery, 3) privately and 4) abattoir.
A general linear model (GLM) was conducted using SAS (2014) to determine differences
between the three districts regarding the average number of lambs sold per year and offtake
Stellenbosch University https://scholar.sun.ac.za
94
rate. Socio-economic effects fitted as fixed effects were age of the farmer, farm type, sources
of income, wealth status, tribe, gender of the household head, whether farmer participated in
LRAD, CASP and/or PLAS program and flock size. The Bonferroni posthoc test was applied
to test for differences between districts for the average number of lambs sold and offtake rate.
4.3. Results
4.3.1. Farmers socio-economic profile
Livestock production was the major activity for 76 % of the smallholder farmers that
contributed to this survey, while cropping represented 24%. Fifty one percent of the
respondents fell within the age range of 40 to 60 years of age, whereas 20% were younger than
40 and 29% were older than 60 years of age (Table 4.2). Sixty seven percent of the farmers
ranked themselves as having a medium wealth status, while 32% ranked themselves as poor.
The households interviewed were male dominated with 90% of the respondents being male and
only 10% female. Land ownership was categorised as 36% self-owned, 29% leased and 29%
communal land. The remaining 6% of the farmers preferred not to disclose information on their
land ownership.
Stellenbosch University https://scholar.sun.ac.za
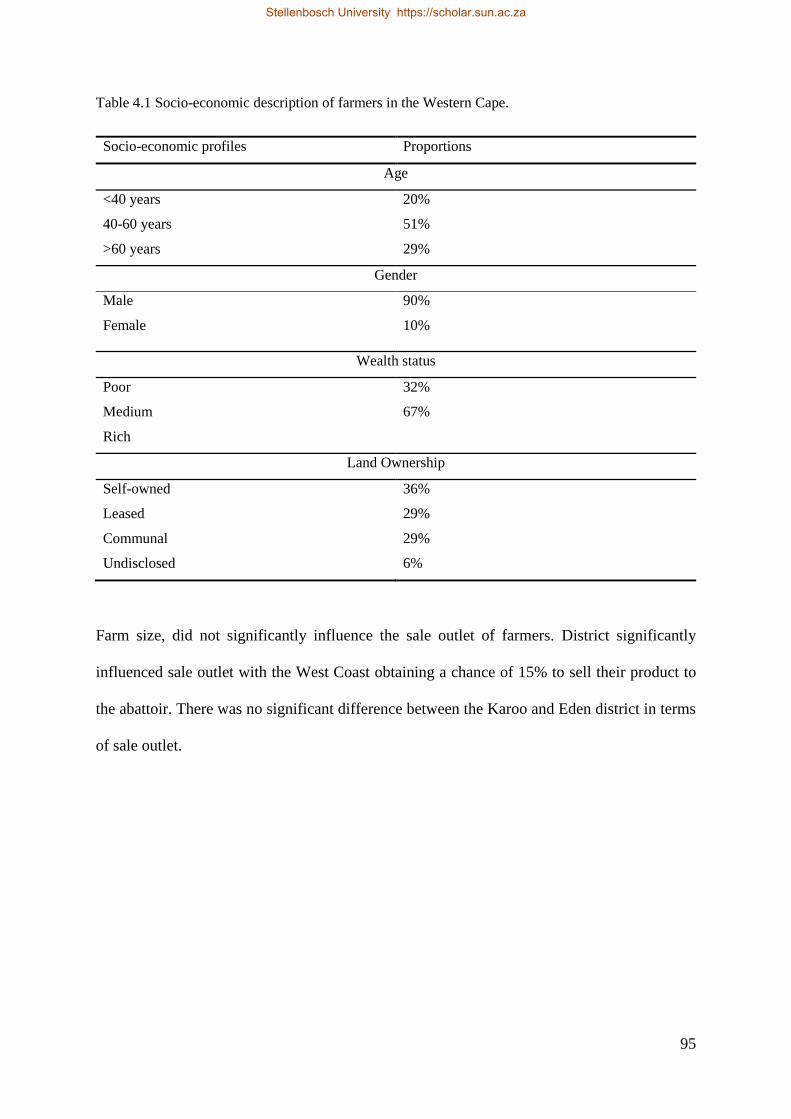
95
Table 4.1 Socio-economic description of farmers in the Western Cape.
Socio-economic profiles Proportions
Age
<40 years 20%
40-60 years 51%
>60 years 29%
Gender
Male 90%
Female 10%
Wealth status
Poor 32%
Medium 67%
Rich
Land Ownership
Self-owned 36%
Leased 29%
Communal 29%
Undisclosed 6%
Farm size, did not significantly influence the sale outlet of farmers. District significantly
influenced sale outlet with the West Coast obtaining a chance of 15% to sell their product to
the abattoir. There was no significant difference between the Karoo and Eden district in terms
of sale outlet.
Stellenbosch University https://scholar.sun.ac.za
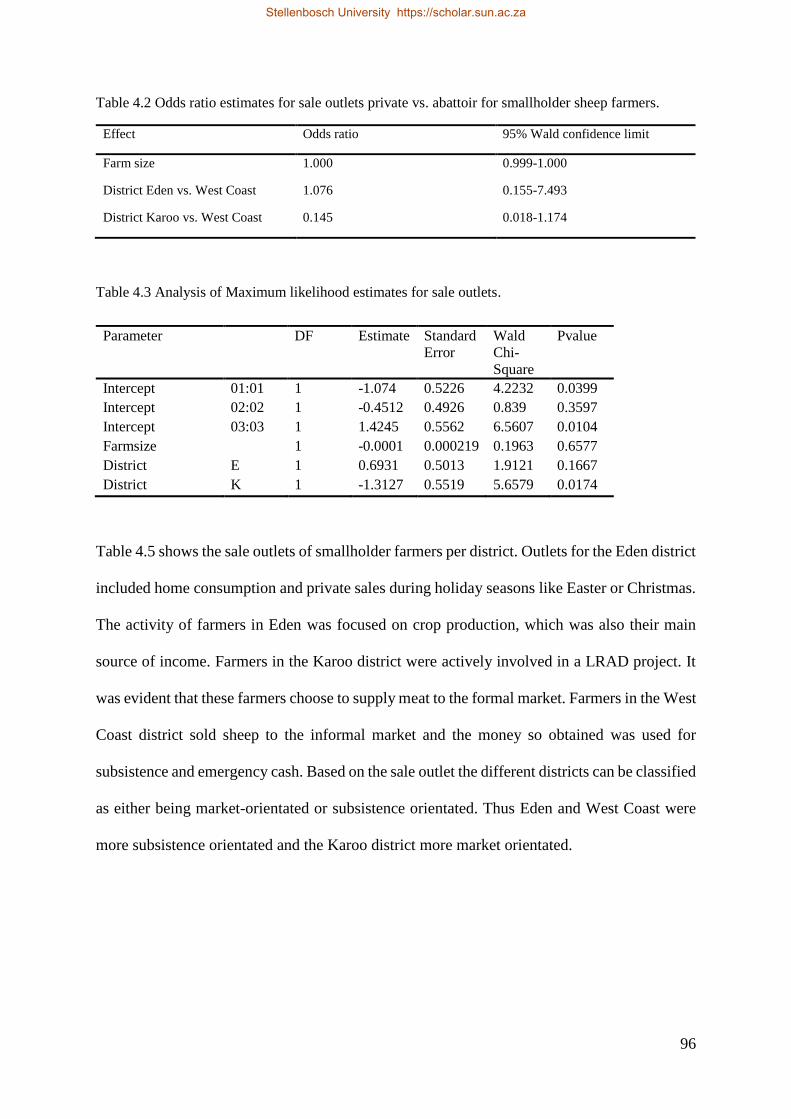
96
Table 4.2 Odds ratio estimates for sale outlets private vs. abattoir for smallholder sheep farmers.
Effect Odds ratio 95% Wald confidence limit
Farm size 1.000 0.999-1.000
District Eden vs. West Coast 1.076 0.155-7.493
District Karoo vs. West Coast 0.145 0.018-1.174
Table 4.3 Analysis of Maximum likelihood estimates for sale outlets.
Parameter
DF Estimate Standard
Error
Wald
Chi-
Square
Pvalue
Intercept 01:01 1 -1.074 0.5226 4.2232 0.0399
Intercept 02:02 1 -0.4512 0.4926 0.839 0.3597
Intercept 03:03 1 1.4245 0.5562 6.5607 0.0104
Farmsize
1 -0.0001 0.000219 0.1963 0.6577
District E 1 0.6931 0.5013 1.9121 0.1667
District K 1 -1.3127 0.5519 5.6579 0.0174
Table 4.5 shows the sale outlets of smallholder farmers per district. Outlets for the Eden district
included home consumption and private sales during holiday seasons like Easter or Christmas.
The activity of farmers in Eden was focused on crop production, which was also their main
source of income. Farmers in the Karoo district were actively involved in a LRAD project. It
was evident that these farmers choose to supply meat to the formal market. Farmers in the West
Coast district sold sheep to the informal market and the money so obtained was used for
subsistence and emergency cash. Based on the sale outlet the different districts can be classified
as either being market-orientated or subsistence orientated. Thus Eden and West Coast were
more subsistence orientated and the Karoo district more market orientated.
Stellenbosch University https://scholar.sun.ac.za
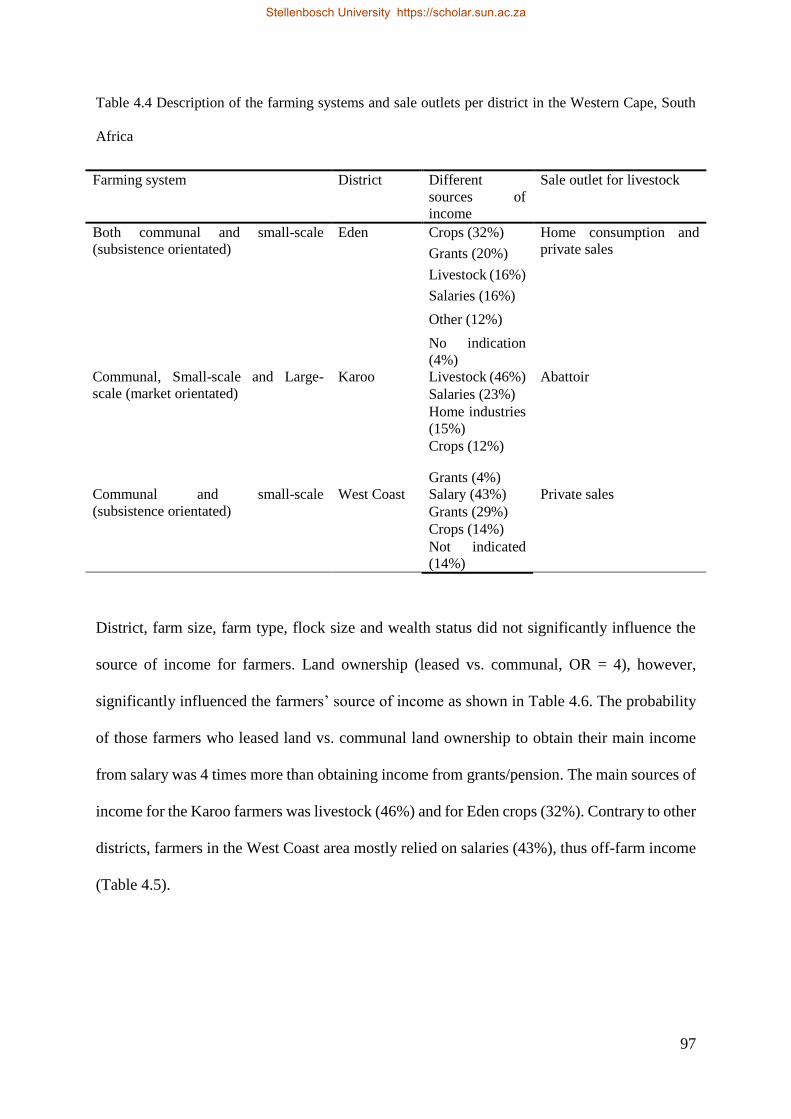
97
Table 4.4 Description of the farming systems and sale outlets per district in the Western Cape, South
Africa
Farming system District Different
sources of
income
Sale outlet for livestock
Both communal and small-scale
(subsistence orientated)
Eden Crops (32%) Home consumption and
private sales Grants (20%)
Livestock (16%)
Salaries (16%)
Other (12%)
No indication
(4%)
Communal, Small-scale and Large-
scale (market orientated)
Karoo Livestock (46%) Abattoir
Salaries (23%)
Home industries
(15%)
Crops (12%)
Grants (4%)
Communal and small-scale
(subsistence orientated)
West Coast Salary (43%) Private sales
Grants (29%)
Crops (14%)
Not indicated
(14%)
District, farm size, farm type, flock size and wealth status did not significantly influence the
source of income for farmers. Land ownership (leased vs. communal, OR = 4), however,
significantly influenced the farmers’ source of income as shown in Table 4.6. The probability
of those farmers who leased land vs. communal land ownership to obtain their main income
from salary was 4 times more than obtaining income from grants/pension. The main sources of
income for the Karoo farmers was livestock (46%) and for Eden crops (32%). Contrary to other
districts, farmers in the West Coast area mostly relied on salaries (43%), thus off-farm income
(Table 4.5).
Stellenbosch University https://scholar.sun.ac.za
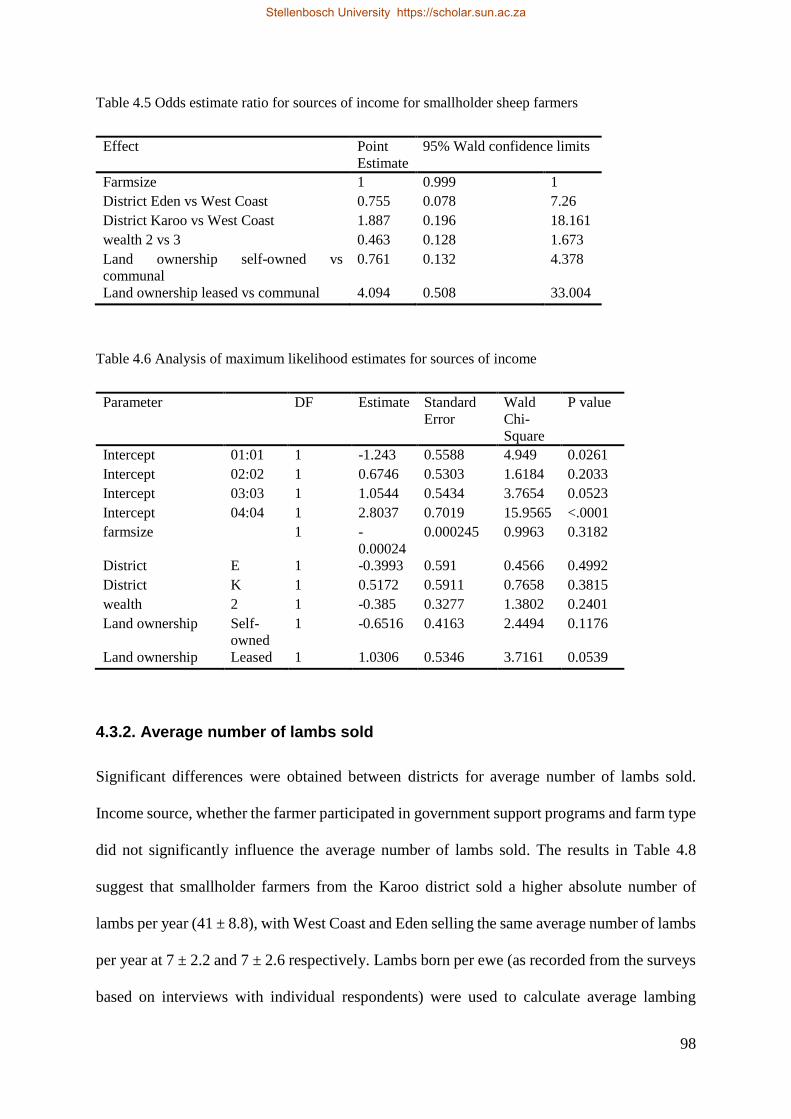
98
Table 4.5 Odds estimate ratio for sources of income for smallholder sheep farmers
Effect Point
Estimate
95% Wald confidence limits
Farmsize 1 0.999 1
District Eden vs West Coast 0.755 0.078 7.26
District Karoo vs West Coast 1.887 0.196 18.161
wealth 2 vs 3 0.463 0.128 1.673
Land ownership self-owned vs
communal
0.761 0.132 4.378
Land ownership leased vs communal 4.094 0.508 33.004
Table 4.6 Analysis of maximum likelihood estimates for sources of income
Parameter
DF Estimate Standard
Error
Wald
Chi-
Square
P value
Intercept 01:01 1 -1.243 0.5588 4.949 0.0261
Intercept 02:02 1 0.6746 0.5303 1.6184 0.2033
Intercept 03:03 1 1.0544 0.5434 3.7654 0.0523
Intercept 04:04 1 2.8037 0.7019 15.9565 <.0001
farmsize
1 -
0.00024
0.000245 0.9963 0.3182
District E 1 -0.3993 0.591 0.4566 0.4992
District K 1 0.5172 0.5911 0.7658 0.3815
wealth 2 1 -0.385 0.3277 1.3802 0.2401
Land ownership Self-
owned
1 -0.6516 0.4163 2.4494 0.1176
Land ownership Leased 1 1.0306 0.5346 3.7161 0.0539
4.3.2. Average number of lambs sold
Significant differences were obtained between districts for average number of lambs sold.
Income source, whether the farmer participated in government support programs and farm type
did not significantly influence the average number of lambs sold. The results in Table 4.8
suggest that smallholder farmers from the Karoo district sold a higher absolute number of
lambs per year (41 ± 8.8), with West Coast and Eden selling the same average number of lambs
per year at 7 ± 2.2 and 7 ± 2.6 respectively. Lambs born per ewe (as recorded from the surveys
based on interviews with individual respondents) were used to calculate average lambing
Stellenbosch University https://scholar.sun.ac.za
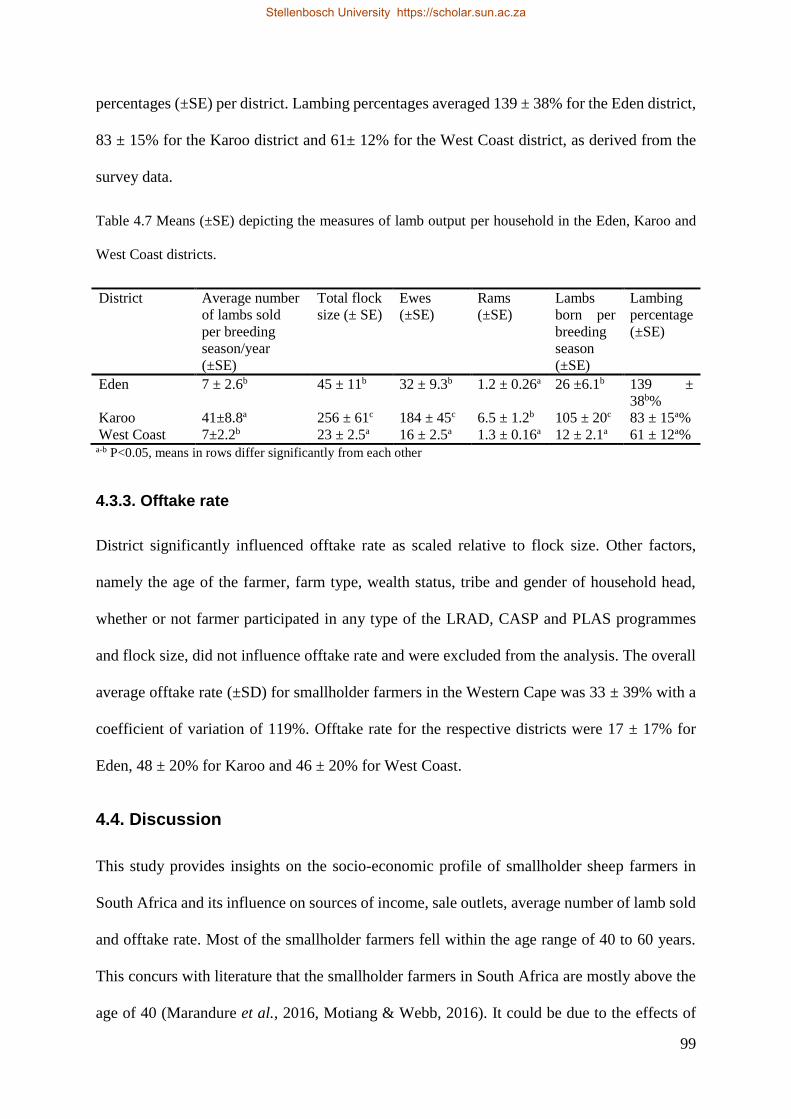
99
percentages (±SE) per district. Lambing percentages averaged 139 ± 38% for the Eden district,
83 ± 15% for the Karoo district and 61± 12% for the West Coast district, as derived from the
survey data.
Table 4.7 Means (±SE) depicting the measures of lamb output per household in the Eden, Karoo and
West Coast districts.
District Average number
of lambs sold
per breeding
season/year
(±SE)
Total flock
size (± SE)
Ewes
(±SE)
Rams
(±SE)
Lambs
born per
breeding
season
(±SE)
Lambing
percentage
(±SE)
Eden 7 ± 2.6b 45 ± 11b 32 ± 9.3b 1.2 ± 0.26a 26 ±6.1b 139 ±
38b%
Karoo 41±8.8a 256 ± 61c 184 ± 45c 6.5 ± 1.2b 105 ± 20c 83 ± 15a%
West Coast 7±2.2b 23 ± 2.5a 16 ± 2.5a 1.3 ± 0.16a 12 ± 2.1a 61 ± 12a% a-b P<0.05, means in rows differ significantly from each other
4.3.3. Offtake rate
District significantly influenced offtake rate as scaled relative to flock size. Other factors,
namely the age of the farmer, farm type, wealth status, tribe and gender of household head,
whether or not farmer participated in any type of the LRAD, CASP and PLAS programmes
and flock size, did not influence offtake rate and were excluded from the analysis. The overall
average offtake rate (±SD) for smallholder farmers in the Western Cape was 33 ± 39% with a
coefficient of variation of 119%. Offtake rate for the respective districts were 17 ± 17% for
Eden, 48 ± 20% for Karoo and 46 ± 20% for West Coast.
4.4. Discussion
This study provides insights on the socio-economic profile of smallholder sheep farmers in
South Africa and its influence on sources of income, sale outlets, average number of lamb sold
and offtake rate. Most of the smallholder farmers fell within the age range of 40 to 60 years.
This concurs with literature that the smallholder farmers in South Africa are mostly above the
age of 40 (Marandure et al., 2016, Motiang & Webb, 2016). It could be due to the effects of
Stellenbosch University https://scholar.sun.ac.za
100
migration of young rural residents to urban areas in search of better working and living
conditions (Dossa et al., 2008). In addition, the rural youth are generally not interested in
agriculture as a career. According to the sustainability classification in Table 4.1, the age of the
respondent as an indicator is moderately sustainable. Sheep farming was dominated by males
in this study, a result corresponding to other studies where males are more likely to farm with
sheep and females with goats (Dossa et al., 2008).
Sale outlets were influenced by district. The farmers in the West Coast were more likely to sell
their product to the informal market. These farmers have indicated that the price received per
lamb was better when sold privately compared to marketing lambs at the local abattoir
(personal communication). This could be due to the market costs levied in the formal market
if you do not sell a high number of lambs at any given time as well as transport costs. The
Karoo farmers were also described as being more market orientated and selling their products
to the abattoir. Sources of income were influenced by land ownership. The observed differences
in land ownership could be explained by the enhanced financial stability of farmers receiving
their income from salaries, enabling them to lease land in comparison to those farmers
receiving income from grants/pension.
Sources of income also varied with district, with West Coast receiving most income from
salaries and grants and Eden from crops and grants. This outcome can partly be explained by
the reasons for keeping sheep, as some farmers indicated that they kept sheep for a hobby or
cultural reasons, thus not necessarily to obtain income (see Chapter 3). This concurs with the
study of Motiang & Webb (2016) who indicated that 55% of households relied on income from
livestock and 47% from social grants. Farmers in the Mopeane-Rustenburg area also derived
most of their income from off-farm sources of income (Schwalbach et al., 2001). These farmers
were only farming as a part-time activity, a scenario which also observed in West Coast where
communal farming has been practiced for many generations.
Stellenbosch University https://scholar.sun.ac.za
101
The results above indicated that the variation in sources of income and sale outlets are due to
differences in socio-economic aspects such as land ownership. The assumption that the West
Coast district was mainly subsistence orientated (see Chapter 3) and the Karoo being more
market-orientated were confirmed by the results of this study. The Eden district did not show
any differences to the Karoo in terms of sale outlets. The different districts can be associated
with different farming systems when considering the different sale outlets and sources of
income.
Although the Karoo farmers were more market orientated in their sale-outlets and achieved the
highest absolute number of lambs sold, they achieved lower lambing percentages than Eden
and higher lambing percentage than West Coast. This could be due to their recent inclusion in
the PLAS program and the need to grow their ewe flocks. Even though Eden district achieved
the highest lambing percentage, their offtake rate was the lowest of the three districts. This
could be due to losing lambs between birth and weaning. Unfortunately, no information was
available on mortality rate in the flock, as this could have contributed to the low offtake rate
observed in Eden district. The previous contention that livestock did not contribute to the
income of smallholder farmers in the West Coast district does not seem to be borne out by these
results. This contradiction could be related to the 14% of respondents who did not identify their
main source of income.
Converting the average number of lambs sold to monetary terms, assuming that the price per
kg/lamb is $5.2 /kg with an average carcass weight of 20kg, then the income per farming unit
in each district will be $1033.2 for the Karoo and 728$ for both the West Coast and Eden
districts per annum. Considering the costs involved in any farming operation these values are
low and would not be able to sustain the livelihood of the farmers involved on their own. These
income values amount up to $61 – $86 per month which is below the $280 minimum wage
requirement, and under Table 4.1 is classified as poorly sustainable. Another study showed that
Stellenbosch University https://scholar.sun.ac.za
102
the annual income for smallholder farmers in Mopeane-Rustenburg amounted to $75-$149 per
month for 42% of the respondents interviewed (Schwalbach et al., 2001). These values were
below the monthly income from livestock for smallholder farmers in the Karoo and higher than
the income of smallholder farmers in both West Coast and Eden. The majority of South
Africans indicated that their monthly expenditure was between $187 – $374 (Statistics South
Africa, 2014). The income of smallholder farmers derived from livestock is therefore below
the amount needed for monthly sustenance. This situation is economically unsustainable, as
the farmer’s livelihood cannot be solely secured from income of livestock.
The overall offtake reported for this study is higher than the offtake reported for communal
sheep farmers in the Free State province (Spies & Cloete 2013) and lower than offtake rate for
commercial farmers ranging between 77-91% (Snyman & Herselman, 2005) where offtake was
calculated as the lambs weaned per 100 lambs born. Offtake as an indicator falls within
category 3 as sustainable (Table 4.1). Offtake was independent of flock size because even
though Karoo farmers had higher flock numbers their offtake did not differ significantly from
the offtake of the West Coast farmers. The reason for this is that flock size has already been
accounted for in the calculation of offtake rate. A study by Fourie & Cloete (1993) however,
suggested that a larger flock at mating could result in lower output of lambs. This could be due
to various reasons; including ram serving capacity that could be decreased in larger groups.
Other factors that could also influence offtake rate are the breed used, whether or not the sheep
received adequate nutrition, the age of the ewe and ram, as well as body condition of the ewe
and ram. These factors were not accounted for in this study and a follow-up study is needed to
determine the effects of these factors on smallholder offtake rates. Enkono et al. (2013)
estimated an offtake rate of 6.1% for communal livestock farmers in Namibia. The offtake rate
in the present study is higher than that observed by the latter author. This could be due to
differences in farming practices, as well as in differences in how offtake rate was calculated.
Stellenbosch University https://scholar.sun.ac.za
103
4.5. Conclusions
The mean age of smallholder sheep farmers is a cause for concern as most farmers are above
the age where farming is recommended as an occupation. This leaves the question of how sheep
farming will be sustained in the long term and how to re-engage the interest of the youth in
sheep farming. The percentage of farmers indicating their wealth status as poor is also of
concern for the livelihood of these farmers and the long-term sustainability of smallholder
sheep production in the Western Cape. The average offtake rate for smallholder farmers in the
Western Cape was lower than commercial figures, and the income derived from livestock
(calculated by the average number of lambs sold) is low and not economically sustainable.
There is potential for income derived from livestock to increase if the average number of lambs
sold can be increased, as seen in Karoo farmers. However, for income to be at a sustainable
level, husbandry aspects (such as nutrition, breeding plan etc.) should be addressed, as well as
other socio-economic and political issues. Addressing issues like age, gender imbalances and
land ownership could have a positive influence on the overall sustainability of sheep farming
systems in the Western Cape. The latter issues can be addressed by increasing awareness to the
youth and women about career opportunities in animal husbandry. The creation of more
platforms for training and education of youth and females in the field of agriculture is also
necessary. This is a complex issue and will need innovation and collaboration in terms of how
to make animal husbandry a promising and sustainable option for the future.
4.6. References
Aliber, M., 2009. Exploring Statistics South Africa’s national household surveys as sources
of information about household-level food security. Agrekon, Vol 48, pp 384-409.
Altman, M., Hart, T. & Jacobs, P., 2009. Household food security status in South Africa.
Agrekon 48, 345-361.
Stellenbosch University https://scholar.sun.ac.za
104
Cloete, S.W.P. & Olivier, J.J., 2010. South African Sheep and Wool Industries. In: The
International Sheep and Wool Handbook. Eds. D.J. Cottle, 95-112, Nottingham
University Press.
Dossa, L.H., Rischkowsky, B., Birner, R. & Wollny, C., 2008. Socio-economic determinants
of keeping goats and sheep by rural people in Southern Benin. Agric. Hum. Values. 25,
581-592.
Enkono, S.G., Kalundu, S.K. &Thomas, B., 2013. Analysis of factors influencing cattle off-
take rate and marketing in Ndiyona constituency of Kavango region, Namibia. Journal
of Agricultural Extension and Rural Development. 5, 201-206.
Grobler, H.J.F., 2010. Evaluation survey at extensive farms in the Central Karoo 2009.
Agriprobe, June, 6-9.
Jahnke, H.E., Tacher, G., Keil, P. & Rojat, D., 1988. Livestock Production in Tsetse-Affected
Areas of Africa. ILCA/ILRAD, Nairobi, Kenya 3–21.
Kosgey, I.S., Rowlands, G.J., Van Arendonk, J.A.M. & Baker, R.L., 2008. Small ruminant
production in smallholder and pastoral/extensive farming systems in Kenya. Small
Rumin. Res. 77, 11-24.
Manyong, A.M. & Degand, J., 1996. Sustainability of African smallholder farming systems:
Case study of highland areas of central Africa. J. Sustain. Agric. 6, 17-42.
Mapiye, C., Chimonyo, M., Dzama, K., Raats, J.G. & Mapekula, M., 2009. Opportunities for
improving Niguni cattle production in smallholder farming systems of South Africa.
Livest. Sci. 124,196-204.
Marais, P.G., 2007. Evaluation of the genetic potential for growth and wool production of
typical Transkei ewes and rams. Research report of the Grootfontein Agricultural
Stellenbosch University https://scholar.sun.ac.za
105
Development Institute, 2007. Private Bag x529, Middelburg 5900, South Africa. pp 33-
34.
Meissner, H.H., Scholtz, M.M. & Engelbrecht, F.A., 2013. Sustainability of the South
African Livestock Sector towards 2050 Part 2: Challenges, changes and required
implementations. S. Afr. J. Anim. Sci. 43, 298-319.
Motiang, D.M. & Webb, E.C., 2016. The influence of household characteristics on cattle off-
take rates in the North West Province of South Africa. Livest. Res. Rural Devel. 28, 6.
Otte, M.J. & Chilonda, P., 2002. Cattle and small ruminant production systems in Sub-
Saharan Africa. A systematic review. FAO publishing, Rome.
Rust, T., Goosen, W.J. & Mbatsha, Z., 2015. Characterization of production outputs and ewe
flock structure of communal wool sheep in Ngqolowa, Eastern Cape. Appl. Anim.
Husb. Rur. Develop. 8, 6-18.
Rust, J.M. & Rust, T., 2013. Climate change and livestock production: A review with
emphasis on Africa. S. Afr. J. Anim. Sci. 43, 255-267.
SAS, 2014. SAS Institute Inc. Cary, NC.
Schwalbach, L.M., Groenewald, I.B. & Marfo, C.B., 2001. A survey of smallholder cattle
farming systems in the North West Province of South Africa. S. Afr. J. Anim. Sci. 31,
200-204.
Snyman, M.A. & Herselman, M.J., 2005. Comparison of productive and reproductive
performance efficiency of Afrino, Dorper and Merino sheep in the False Upper Karoo.
S. Afr. J. Anim. Sci. 35, 98-108.
Stellenbosch University https://scholar.sun.ac.za
106
Smith, B., 2006. Small Stock Production. In: The Farming Handbook. Eds. S. Hines, 196-236
University of Kwa-Zulu Natal Press.
Spies, D.C. & Cloete, P.C., 2013. Performance and marketing options for red meat in the
formal and informal value chains in the Free State Province. 19th International Farm
Management Congress, SGGW, Warsaw, Poland.
Statistics, South Africa. 2014. General household survey, 2013. Published by Statistics South
Africa, Private Bag X44, Pretoria 0001.
www.statssa.gov.za/publications/P0318/P03182013.pdf (accessed 12/04/2016)
Stroebel, A., Swanepoel, F.J.C. & Pell, A.N., 2011. Sustainable smallholder livestock
systems: A case study of Limpopo Province, South Africa. Livest. Sci. 139,186-190.
Thamaga-Chitja, J.M. & Morojele, P., 2014. The context of smallholder farming in South
Africa: Towards a livelihood asset building framework. J. Human Ecol. 45, 147-155.
Turner, H.N. & Young, S.S.Y., 1969. Chapter 16. The influence of flock structure on
productivity. In: Quantitative Genetics in Sheep Breeding. Eds by Cornell University
Press, Ithaca, New York.
Webb, E.C., 2015. Description of carcass classification goals and the current situation in
South Africa. S. Afr. J. Anim. Sci. 35, 98-108.
Stellenbosch University https://scholar.sun.ac.za
107
Chapter 5
Genetic diversity and population structure of South African
smallholder farmer sheep breeds determined using the
OvineSNP50 beadchip
Abstract
A population structure study was performed on South African ovine populations using the
OvineSNP50 beadchip. Blood samples were obtained from 295 sheep of which 172 had been
identified as smallholder Dorpers, 4 as smallholder White Dorpers, 46 as purebred Dorpers, 26
as purebred South African Mutton Merinos and 47 as purebred Namaqua Afrikaners. Blood
from the latter three breeds were obtained from a resource flock maintained on the Nortier
research farm. Genetic diversity was estimated using allelic richness (Ar), observed
heterozygosity (Ho), expected heterozygosity (He) and inbreeding coefficient (F). Population
structure analysis was performed using fastSTRUCTURE to determine the breed composition
of each genotyped individual. The Namaqua Afrikaner had the lowest He of 0.280 ± 0.18 while
the He of smallholder Dorper, Dorper and South African Mutton Merino did not differ and were
respectively 0.364 ± 0.13, 0.332 ± 0.16 and 0.329 ± 0.17. The average inbreeding coefficient
was highest for the pure breeds, Namaqua Afrikaner, Dorper and South African Mutton Merino
compared to the average inbreeding coefficient for the smallholder Dorper population. The
smallholder Dorper population was introgressed with Namaqua Afrikaner, South African
Mutton Merino and White Dorper germplasm. Similarly, the smallholder Dorper population
was more genetically diverse compared to purebred Dorper, South African Mutton Merino and
Namaqua Afrikaner sheep from the research farm. The higher genetic diversity among the
smallholder sheep may be advantageous for their fitness and can be used to facilitate selective
breeding.
Stellenbosch University https://scholar.sun.ac.za
108
5.1. Introduction
Some of the major sheep breeds kept by smallholder farmers include Dorper, Merino, Namaqua
Afrikaner and Damara sheep. The Dorper is a composite breed derived from an initial cross
between Black headed Persian and Dorset Horn sheep in the early 1900’s and is widely farmed
in the arid and semi-arid environments of South Africa. This is because of the ability of Dorpers
to grow and reproduce well in harsh environments (Milne, 2000). The Namaqua Afrikaner is
one of the oldest indigenous breeds in South Africa (Ramsay et al., 2001). The breed was
associated with the nomadic Nama people between 200 to 400 AD in the harsh dry areas of the
North-Western Cape and Southern Namibia. The Namaqua Afrikaner is adapted to harsh
environments (Snyman et al., 2005) and is currently listed as an endangered breed (Qwabe et
al., 2013). The South African Mutton Merino was derived from the German Merino and was
selected for both wool and meat production (Schoeman et al., 2010).
Smallholder sheep farmers in South Africa possess flocks with a low reproductive performance
(Grobler 2010; Marais 2007). This may be due to many factors, including nutrition,
management, ambient temperature as well as genetics. Genetics however play an important
role in establishing permanent change that can be sustainable in the long term by improving
traits related to robustness. Robustness traits are important for the low-input farming systems
employed by smallholder farmers and are likely to become more important as the effects of
climate change in Southern Africa become more evident (Nardone et al., 2010). Smallholder
sheep farmers, however, do not have formal breeding programs to genetically improve their
breeds. The genetic population structure of smallholder flocks is generally unknown as
uncontrolled crossbreeding of different breeds is frequently practiced (Gizaw et al., 2014).
Methods that are frequently used to analyse population structure include principal component
analysis (PCA) based methods and model-based methods such as STRUCTURE (Pritchard et
al., 2000), ADMIXTURE (Alexander et al., 2009) and fastSTRUCTURE (Raj et al., 2014).
Stellenbosch University https://scholar.sun.ac.za
109
Principal component analysis constructs low-dimensional projections of data and decomposes
the variance-covariance structure among sample genotypes into independent contrasts. The
disadvantage of PCA is that it may be difficult to interpret estimates of the global ancestry of
the sampled individuals based upon their projection coordinates (Novembre & Stephens 2008).
Model-based methods use a Bayesian framework and compute global ancestry estimates as the
posterior distributions of population membership. Limitations to STRUCTURE include a
lengthy convergence time for large genotype datasets and fastSTRUCTURE was developed to
increase the speed of inference and achieve accuracies comparable to those produced by
STRUCTURE and ADMIXTURE (Raj et al., 2014).
It is important to know the genetic structure of a breeding population to provide sound breeding
advice. Due to the existing unstructured breeding strategies it is possible that smallholder sheep
flocks could either have high levels of inbreeding; or, if populations are sufficiently large and
diverse, they could be completely outbred by random mating within a multi-breed context.
Inbreeding or the level of genetic homozygosity in a population is inversely proportional to
fitness and robustness in sheep (Ercanbrack & Knight 1991; Wiener et al. 1992; Van Wyk et
al., 2009; Leroy, 2014). Ensuring genetic diversity is important for increased robustness, as a
reduction in genetic diversity can lead to a decrease in population means for fitness traits
(Goddard, 2009). Sustainable levels of inbreeding would be below 20-25% as higher levels can
putatively lead to inbreeding depression (Ercanbrack & Knight, 1991). Genetic diversity of
sheep resources in South Africa have been studied using microsatellites (Buduram, 2004;
Qwabe et al., 2013), random amplified polymorphic DNA (RAPD) (Hlophe, 2011) and single
nucleotide polymorphisms (SNPs) (Sandenbergh et al., 2015). Population structure of these
populations was assessed using STRUCTURE (Qwabe et al., 2013) and PCA (Sandenbergh et
al., 2015). Low estimates of genetic diversity were obtained for the Namaqua Afrikaner breed
using SNPs (Kijas et al., 2009, Sandenbergh et al., 2015) and microsatellites (Qwabe et al.,
Stellenbosch University https://scholar.sun.ac.za
110
2013). Literature has also reported the Dorper and SAMM to have relatively high levels of
genetic diversity using SNPs (Sandenbergh et al., 2015) as well as in the Merino breed which
had the highest level of genetic diversity in a worldwide breed comparison (Kijas et al., 2009).
In contrast, studies using RAPD markers have shown the Merino (12%) and Dorper (24%)
breeds to have lower levels of genetic diversity than indigenous Nguni sheep breeds (29%)
(Hlophe, 2011). The contradictory results could be due the marker type used, as RAPD markers
are less likely affected by ascertainment bias compared to SNP markers (Vignal et al., 2002).
No studies have yet been conducted to investigate the genetic composition of sheep obtained
from smallholder farmers in the Western Cape, South Africa. Population structure analysis is
also important for use in downstream genetic analyses such as genome wide association studies
(Price et al., 2006).
The objective of this study were to determine genetic diversity and population structure within
the Dorper breed sampled from smallholder farmers in the Western Cape, South Africa relative
to the Namaqua Afrikaner, Dorper and SAMM sheep obtained from the Nortier research farm
situated in the same Province.
5.2. Materials and Methods
The sites of sample collection were Nortier research farm and the Ebenheaser smallholder
community in the West Coast district. Nortier is located at 32º 5' 32.0833" S, 18º 18' 18.3000"
E and Ebenheaser are located at 31º 35' 8.5856" S, 18º 14' 39.2442" E. Animals on both sites
were maintained on natural shrub pastures typical of the region.
Blood samples from the smallholder sheep were collected from the jugular vein into EDTA
vacutainer tubes from all animals and on blood cards for animals from the resource sheep flock.
Ethical clearance was obtained from the Departmental Ethics Committee for Research on
Animals (DECRA) approval numbers of R12/53 for smallholder flocks and R14/100 for the
Stellenbosch University https://scholar.sun.ac.za
111
resource flock from the Western Cape Department of Agriculture. DNA was extracted using a
Purelink® Genomic DNA Mini kit (Thermo Fisher Scientific, Johannesburg, South Africa).
The blood samples from the research farm were stored at -80 ºC before being applied to blood
cards and were then submitted for genotyping at GeneSeek (Lincoln, NE, USA). SNP
genotyping was performed using the Illumina® OvineSNP50 Beadchip.
In this study, we focused on characterizing the genetic variation present within the Dorper, and
Namaqua Afrikaner (Namafr) breeds. The Namaqua Afrikaner is a fat-tailed breed and is used
in this study to represent fat-tailed indigenous sheep breeds. The South African Mutton Merino
(SAMM) will be used to represent the Merino type breeds. The total number of sampled sheep
was 295 and of the 176 smallholder sheep, 172 were identified by the owners as Dorpers
(Dorpersm) and 4 as White Dorpers. Sheep selected from the smallholder flock were breeding
ewes, with ages ranging from 1 year to 6+ years. Sheep sampled from the Nortier research
flock were identified as 46 purebred Dorpers, 26 purebred SAMM and 47 purebred Namafr.
Unrelated ewes were selected from the research farm flock, ranging in age from 2 years to 6+
years.
Genotypic data were analysed using PLINK (Purcell et al., 2007). The number of polymorphic
SNPs and average MAF were derived for each of the sampled breed groups using PLINK.
Quality control was performed on the data for all of the genetic groups simultaneously with
filtering thresholds set to 5% for minor allele frequency, Hardy Weinberg Equilibrium at P <
0.001, and 95% genotype call rate per animal. After filtering 43,500 SNPs were retained and
used in the analyses. Genetic diversity was estimated using observed heterozygosity (Ho),
expected heterozygosity (He) and allelic richness (Ar). Inbreeding coefficients, F, were
estimated using PLINK based on the observed versus expected proportions of homozygous
genotypes. An ANOVA was fitted to examine differences between the inbreeding coefficients
of animals from the research and smallholder farms, as well as to determine differences
Stellenbosch University https://scholar.sun.ac.za
112
between the breeds for inbreeding levels. Allelic richness (Ar) was estimated using ADZE
(Szpiech et al., 2008). A principal component analysis was performed using the SNPRelate
package in R (Zheng et al., 2012) to visualise the clustering of animals by breed types.
Population structure analyses were performed using fastSTRUCTURE (Raj et al., 2014) to
determine the breed composition of members of the resource and smallholder flocks. The
choice for the number of K was made by using two criteria: 1) model complexity that
maximizes the marginal likelihood, and 2) model components used to explain structure in the
data. For this study, K = 4 produced the highest average marginal likelihood and was used to
represent the number of ancestral populations.
5.3. Results
The percentages of polymorphic SNPs were 76%, 77%, 66% and 81% for the Dorper, SAMM,
Namafr and Dorpersm respectively. Average minor allele frequencies (MAF) were 0.258,
0.249, 0.218 and 0.279 for the Dorper, SAMM, Namafr and Dorpersm, respectively. The
Namaqua Afrikaner ranked the lowest for genetic diversity with a He = 0.280 and the Dorpersm
ranked the highest with He = 0.364 (Table 5.1). The Dorpersm had the highest allelic richness
(Ar = 1.976) and the Namafr the lowest (Ar = 1.799). The average inbreeding coefficients
differed between the smallholder and resource flock animals with the research farm animals
attaining a higher average inbreeding coefficient of 0.13 ± 0.008 relative to animals on the
smallholder farms with an average inbreeding coefficient of 0.04 ± 0.003. Average inbreeding
was also estimated for the different genetic groups and the Dorpersm (0.034 ± 0.042)
populations had the lowest inbreeding coefficients compared to the Dorper (0.074 ± 0.047),
SAMM (-0.050 ± 0.046) and Namafr (0.237 ± 0.054) (Table 5.1).
Stellenbosch University https://scholar.sun.ac.za
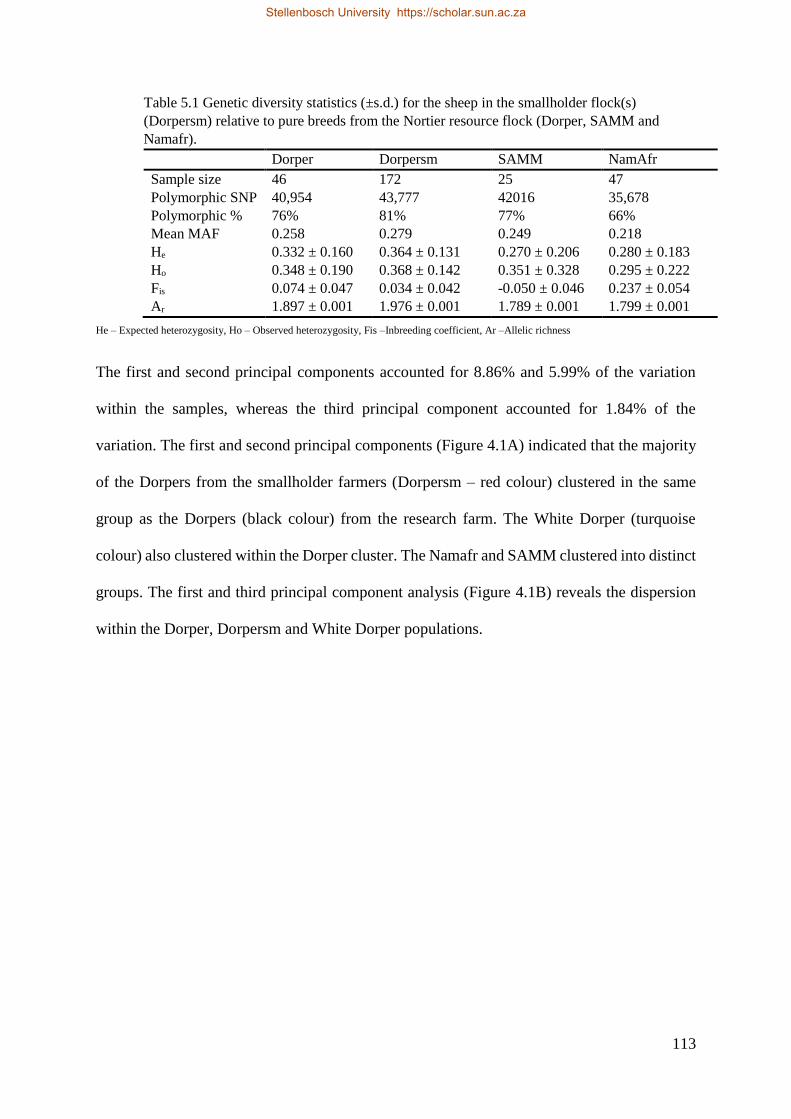
113
Table 5.1 Genetic diversity statistics (±s.d.) for the sheep in the smallholder flock(s)
(Dorpersm) relative to pure breeds from the Nortier resource flock (Dorper, SAMM and
Namafr).
Dorper Dorpersm SAMM NamAfr
Sample size 46 172 25 47
Polymorphic SNP 40,954 43,777 42016 35,678
Polymorphic % 76% 81% 77% 66%
Mean MAF 0.258 0.279 0.249 0.218
He 0.332 ± 0.160 0.364 ± 0.131 0.270 ± 0.206 0.280 ± 0.183
Ho 0.348 ± 0.190 0.368 ± 0.142 0.351 ± 0.328 0.295 ± 0.222
Fis 0.074 ± 0.047 0.034 ± 0.042 -0.050 ± 0.046 0.237 ± 0.054
Ar 1.897 ± 0.001 1.976 ± 0.001 1.789 ± 0.001 1.799 ± 0.001
He – Expected heterozygosity, Ho – Observed heterozygosity, Fis –Inbreeding coefficient, Ar –Allelic richness
The first and second principal components accounted for 8.86% and 5.99% of the variation
within the samples, whereas the third principal component accounted for 1.84% of the
variation. The first and second principal components (Figure 4.1A) indicated that the majority
of the Dorpers from the smallholder farmers (Dorpersm – red colour) clustered in the same
group as the Dorpers (black colour) from the research farm. The White Dorper (turquoise
colour) also clustered within the Dorper cluster. The Namafr and SAMM clustered into distinct
groups. The first and third principal component analysis (Figure 4.1B) reveals the dispersion
within the Dorper, Dorpersm and White Dorper populations.
Stellenbosch University https://scholar.sun.ac.za
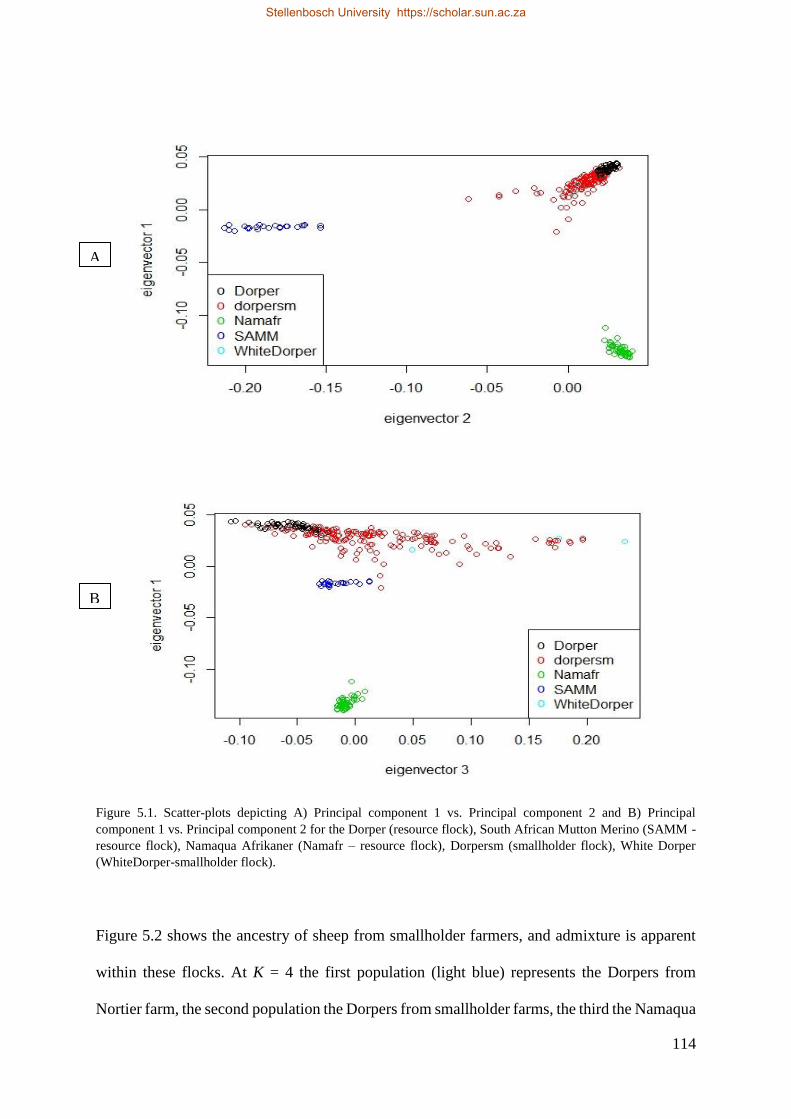
114
Figure 5.1. Scatter-plots depicting A) Principal component 1 vs. Principal component 2 and B) Principal
component 1 vs. Principal component 2 for the Dorper (resource flock), South African Mutton Merino (SAMM -
resource flock), Namaqua Afrikaner (Namafr – resource flock), Dorpersm (smallholder flock), White Dorper
(WhiteDorper-smallholder flock).
Figure 5.2 shows the ancestry of sheep from smallholder farmers, and admixture is apparent
within these flocks. At K = 4 the first population (light blue) represents the Dorpers from
Nortier farm, the second population the Dorpers from smallholder farms, the third the Namaqua
A
B
Stellenbosch University https://scholar.sun.ac.za
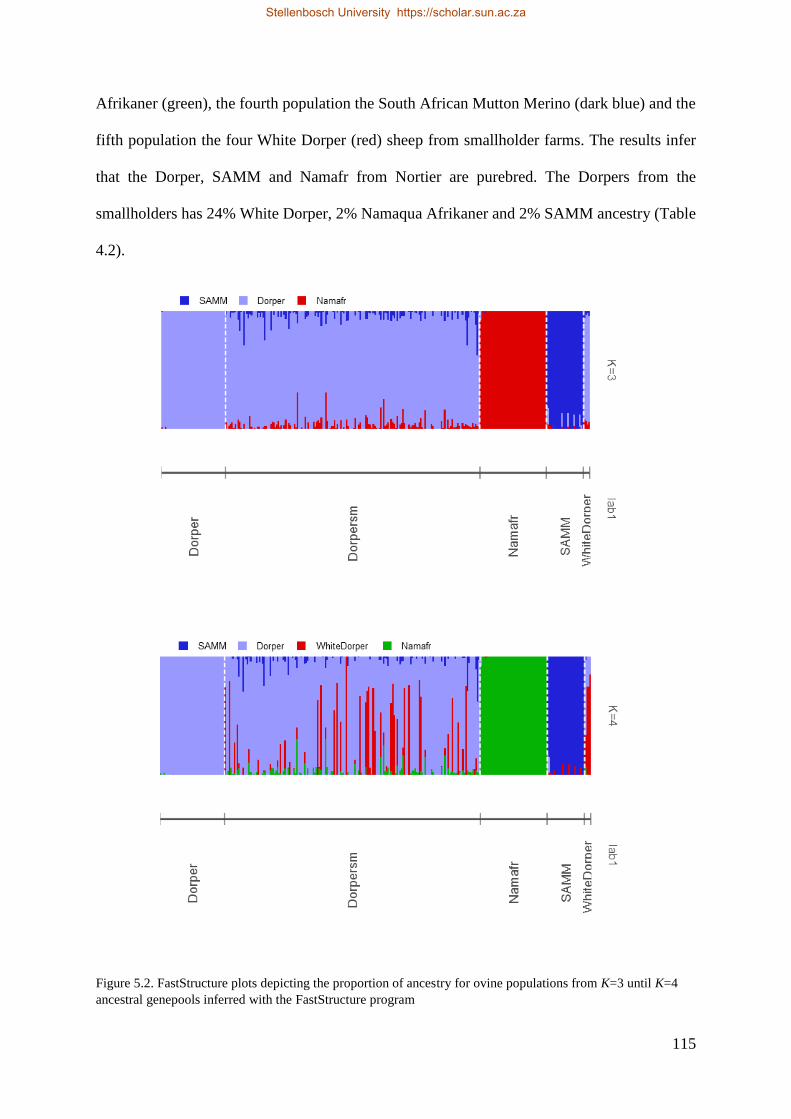
115
Afrikaner (green), the fourth population the South African Mutton Merino (dark blue) and the
fifth population the four White Dorper (red) sheep from smallholder farms. The results infer
that the Dorper, SAMM and Namafr from Nortier are purebred. The Dorpers from the
smallholders has 24% White Dorper, 2% Namaqua Afrikaner and 2% SAMM ancestry (Table
4.2).
Figure 5.2. FastStructure plots depicting the proportion of ancestry for ovine populations from K=3 until K=4
ancestral genepools inferred with the FastStructure program
Stellenbosch University https://scholar.sun.ac.za
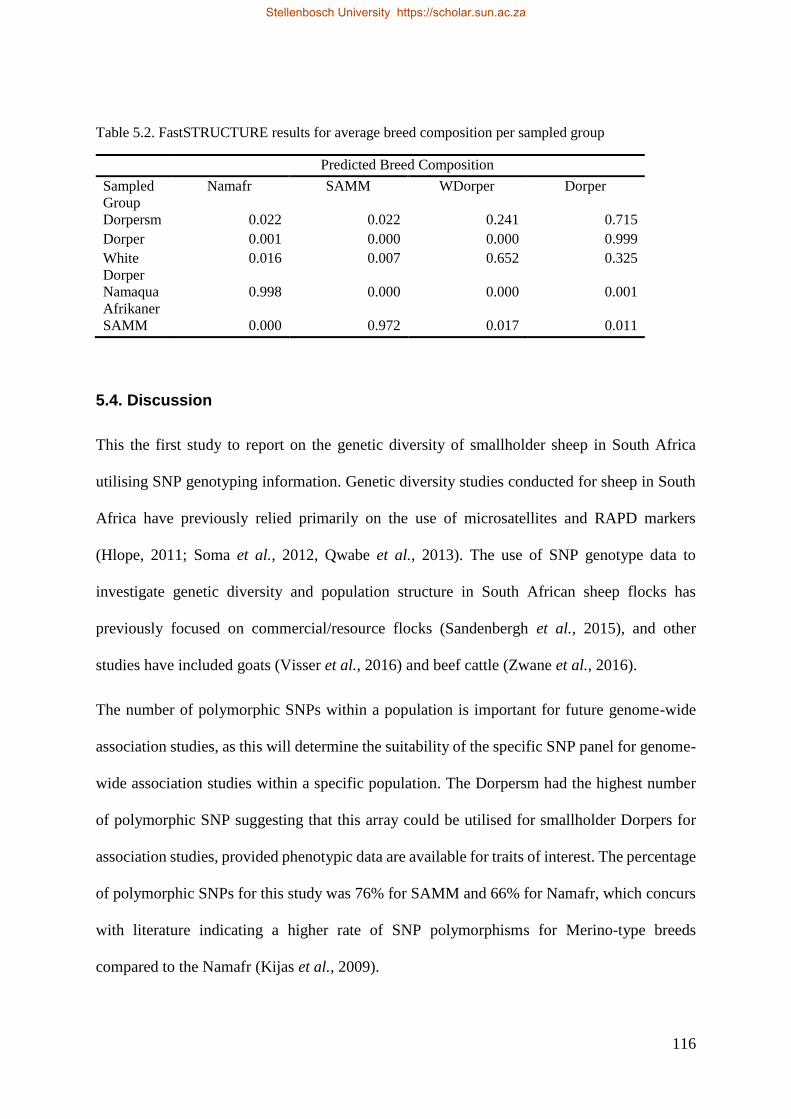
116
Table 5.2. FastSTRUCTURE results for average breed composition per sampled group
Predicted Breed Composition
Sampled
Group
Namafr SAMM WDorper Dorper
Dorpersm 0.022 0.022 0.241 0.715
Dorper 0.001 0.000 0.000 0.999
White
Dorper
0.016 0.007 0.652 0.325
Namaqua
Afrikaner
0.998 0.000 0.000 0.001
SAMM 0.000 0.972 0.017 0.011
5.4. Discussion
This the first study to report on the genetic diversity of smallholder sheep in South Africa
utilising SNP genotyping information. Genetic diversity studies conducted for sheep in South
Africa have previously relied primarily on the use of microsatellites and RAPD markers
(Hlope, 2011; Soma et al., 2012, Qwabe et al., 2013). The use of SNP genotype data to
investigate genetic diversity and population structure in South African sheep flocks has
previously focused on commercial/resource flocks (Sandenbergh et al., 2015), and other
studies have included goats (Visser et al., 2016) and beef cattle (Zwane et al., 2016).
The number of polymorphic SNPs within a population is important for future genome-wide
association studies, as this will determine the suitability of the specific SNP panel for genome-
wide association studies within a specific population. The Dorpersm had the highest number
of polymorphic SNP suggesting that this array could be utilised for smallholder Dorpers for
association studies, provided phenotypic data are available for traits of interest. The percentage
of polymorphic SNPs for this study was 76% for SAMM and 66% for Namafr, which concurs
with literature indicating a higher rate of SNP polymorphisms for Merino-type breeds
compared to the Namafr (Kijas et al., 2009).
Stellenbosch University https://scholar.sun.ac.za

117
The average MAF was lower for the Namafr suggesting either a lower genetic diversity for this
breed, or a greater genetic distance from the discovery breeds used to identify common SNPs
for inclusion on the assay. The Namaqua Afrikaner had lower levels of genetic diversity with
the lowest He and highest inbreeding levels of all of the breeds, suggesting that inbreeding in
conjunction with a small population size has resulted in a loss of variation within the breed.
This low diversity was previously also reported in other studies using microsatellites
(Buduram, 2004, Qwabe et al., 2013) and SNP panels (Kijas et al., 2009; Sandenbergh et al.,
2015). The breed was originally sourced from the conservation flock at Carnarvon
Experimental Station as described by Qwabe et al. (2013). There is an estimated number of
2000 Namaqua Afrikaner sheep in South Africa with two conservation flocks consisting of 100
ewes each (Snyman, 2014), thus the effective population size for the Namaqua Afrikaner sheep
used in this study is small. The results could also be influenced by SNP ascertainment bias in
the development of the Ovine SNP50 beadchip, since the Namafr and other African fat-tailed
breeds were underrepresented among the breeds used for the development of the chip (Kijas et
al., 2012; Sandenbergh, 2015). Estimates of He for the Dorper and SAMM agree with literature
estimates that indicate high levels of genetic diversity for these breeds (Kijas et al., 2009).
Allelic richness for the Dorper was similar to literature estimates of 1.828 but, for the Namafr,
allelic richness in this study exceeded the value of 1.576 reported by Kijas et al. (2009). This
could be due to the use of a larger SNP panel in this study as well as to the origin of the
Namaqua Afrikaner samples used in the latter study.
The Dorpersm had the highest genetic diversity of all the breeds as assessed by all the diversity
parameters. The higher genetic diversity observed in the smallholder Dorper sheep can be
attributed to admixture of these animals with other breed types. The population structure
analysis suggested introgression of the Dorpersm with indigenous fat-tailed breeds such as the
Namafr as well as wool types, here represented by the SAMM. These results confirm the
Stellenbosch University https://scholar.sun.ac.za
118
assumption that smallholder sheep populations are genetically more diverse than purebred
sheep populations and this stems from ancestral crossbreeding. The analyses could not verify
whether these results reflect recent or historical admixture among the breeds. The Dorpersm
and the White Dorper clustered into the same group as purebred Dorpers in the PCA. The
Dorpersm population consisted out of purebred Dorpers as depicted from the
fastSTRUCTURE results. There are, however, other Dorper-derived animals that contain
germplasm from fat-tailed and/or wool breeds. Namafr and SAMM ewes from the research
farm clustered into distinct groups, which was expected as these were purebred populations.
Comparing the differences between farms, the smallholder farms had lowest inbreeding levels,
which was also expected since the breeding program at the research farm was expected to
accumulate inbreeding. The level of inbreeding in smallholder sheep populations and purebred
Dorper and SAMM ewes is below 20% which is a sustainable level of inbreeding to have in a
sheep flock. The inbreeding in the Namafr (24%) reaches the level of being unsustainable.
5.5. Conclusions
The high genetic diversity is favourable for the smallholder sheep as it can facilitate rapid
genetic change if a coherent selection strategy is formulated based on heritable traits of
economic relevance. The Namaqua Afrikaner as an indigenous breed to South Africa has an
important role to play in smallholder farming systems, as it is able to survive and reproduce in
low input systems. Introgression of Dorpers with Namaqua Afrikaner (fat-tailed breeds) and
South African Mutton Merino have been confirmed in this study. The Namaqua Afrikaner (and
other fat-tailed sheep breeds) are commonly used in smallholder sheep systems and thus the
low genetic diversity observed in the Namaqua Afrikaner is of some concern for the future of
this breed as a genetic resource. Strategies to mitigate this may include a structured rotation
plan between the conservation flocks that are currently being maintained in South Africa as
described by Qwabe et al. (2013). These conservation flocks were found to be distinct
Stellenbosch University https://scholar.sun.ac.za
119
populations from one another (Qwabe et al., 2013) and thus could be used to source unrelated
animals from the breed to assist in reducing inbreeding and increasing diversity. Alternatively,
crossing the Namaqua Afrikaner with other adapted breeds could retain those adaptive traits
characteristic of the breed in crossbred progeny, while also assimilating advantages such as an
improved growth rate and improved carcass composition derived from the other parent. To take
advantage of such a system on the commercial and smallholder level, purebred populations of
the Namaqua Afrikaner need to be maintained.
5.6. References
Alexander, D.H., Novembre, J. & Lange, K., 2009. Fast model-based estimation of ancestry in
unrelated individuals. Genome Res.19, 1655-1664.
Buduram, P., 2004. Genetic characterization of South African sheep breeds using DNA
markers. M.Sc. thesis. University of Free State. South Africa.
Ercanbrack, S.K. & Knight, A.D., 1991. Effects of inbreeding on reproduction and wool
production of Rambouillet, Targhee, and Columbian ewes. J. Anim. Sci. 69, 4734-
4744.
Gizaw, S., Van Arendonk, J.A.M., Valle-Zarate, A., Haile, A., Rischkowsky, B., Dessie, T. &
Mwai, A.O., 2014. Breeding programmes for smallholder sheep farming systems: II.
Optimization of cooperative village breeding schemes. J. Anim. Breed. Genet. 131,
350-357.
Goddard, M., 2009. Fitness traits in animal breeding programs, in: Adaptation and fitness in
farm animal populations: Evolutionary and breeding perspectives on genetic resource
management. Eds. Van der Werf, J., H.-U. Graser, R., Frankham, & C., Gondro, 41-52
Springer Science & Business Media.
Grobler, H.J.F., 2010. Evaluation survey at extensive farms in the Central Karoo 2009.
Agriprobe, June, 6-9.
Stellenbosch University https://scholar.sun.ac.za
120
Hlophe, S.R., 2011. Genetic variation between and within six selected south African sheep
breeds using random amplified polymorphic DNA and protein markers, Master’s thesis,
University of Zululand, South Africa.
Kijas, J.W., Townley, D., Dalrymple, B.P., Heaton, M.P., Maddox, J.F., McGrath, A., Wilson,
P., Ingersoll, R.G., McCulloch, R., McWilliam, S.,Tang, D., McEwan, J., Cockett, N.,
Oddy, V.H., Nicholas, F.W. & Raadsma, H., for the International Sheep Genomics
Consortium. 2009. A genome wide survey of SNP variation reveals the genetic
structure of sheep breeds. PLoS One 4, e4668.
Kijas, J.W., Lenstra, J.A., Hayes, B., Boitard, S., Porto Neto, L.R, San Cristobal, M., Servin,
B., McCulloch, R., Whan, V., Gietzen, K., Paiva, S., Barendse, W., Ciani, E., Raadsma,
H., McEwan, J., Dalrymple, B. & the International Sheep Genomics Consortium
Members. 2012. Genome-wide analysis of the world’s sheep breeds reveals high levels
of historic mixture and strong recent selection. PLoS Biol 10, e1001258.
Leroy, G., 2014. Inbreeding depression in livestock species: review and meta-analysis. Anim.
Genet. 45, 618-628.
Marais P.G., 2007. Evaluation of the genetic potential for growth and wool production of
typical Transkei ewes and rams. Research report of the Grootfontein Agricultural
Development Institute, 2007. Private Bag x529, Middelburg 5900, South Africa. p. 33-
34.
Milne, C., 2000. The History of the Dorper. Small Rumin. Res. 36, 99-102.
Nardone, A., Ronchi, B., Lacetera, N., Ranieri, M. S. & Berrabucci, U., 2010. Effects of climate
change on animal production and sustainability of livestock systems. Livest. Sci.130,
57-69.
Novembre, J. & Stephens, M., 2008. Interpreting principal components analyses of spatial
population genetic variation. Nature Genet. 40, 646-649.
Stellenbosch University https://scholar.sun.ac.za
121
Price, A.L., Patterson, N.J., Plenge, R.M., Weinblatt, M.E., Shadick, N.A & Reich, D., 2006.
Principal components analysis corrects for stratification in genome-wide association
studies. Nature Genet. 38, 904-909.
Pritchard, J.K., Stephens, M. & Donnelly, P., 2000. Inference of population structure using
multilocus genotype data. Genet. 155, 945-949.
Purcell, S., Neale, B., Todd-Brown, K., Thomas, L., Ferreira, M.A.R., Bender, D., Maller, J.,
Sklar, P., De Bakker, P.I.W., Daly, M.J. & Sham, P.C., 2007. PLINK: a toolset for
whole-genome association and population-based linkage analysis. Amer. J. Hum.
Genet. 81, 559-575.
Qwabe, S.O., Van Marle-Köster, E. & Visser, C., 2013. Genetic diversity and population
structure of the endangered Namaqua Afrikaner sheep. Trop. Anim. Health Prod. 45,
511-516.
Raj, A., Stephens, M. & Pritchard, J.K., 2014. fastSTRUCTURE: Variational inference of
population structure in large SNP data sets. Genet. 197, 573-589.
Ramsay, K. H., Harris, L. & Kotze, A., 2001. Landrace breeds: South Africa’s indigenous and
locally developed farm animals. Publication Farm Animal Conservation Trust, ISBN:
0-620-25493-9.
Sandenbergh, L., 2015. Identification of SNPs associated with robustness and greater
reproductive success in South African Merino using SNP chip technology. PhD thesis.
University of Stellenbosch, South Africa
Sandenbergh, L. Cloete, S.W.P. Roodt-Wilding, R., Snyman, M.A. & Van der Merwe, A.E.,
2015. Genetic diversity and population structure of four South African sheep breeds.
Proc. Assoc. Advmt Breed. Genet. 21, 294-297.
Schoeman, S.J., Cloete, S.W.P. & Oliver, J.J., 2010. Returns on investment in sheep and goat
breeding in South Africa. Livest. Sci. 130, 70-82.
Stellenbosch University https://scholar.sun.ac.za
122
Snyman, M. A., Buys, T. & Jonker, M. L., 2005. Production and reproduction performance of
Namaqua Afrikaner sheep. 6th Global Conference on the Conservation of Domestic
Animal Genetic Resource, Magalies Park, South Africa, 9-13 October
Snyman, M.A., 2014. South African sheep breeds: Namaqua Afrikaner. Info-pack ref.
2014/023. Grootfontein Agricultural Development Institute.
Soma, P., Kotze, A., Grobler, J.P. & Van Wyk, J.B., 2012. South African sheep breeds:
Population genetic structure and conservation implications. Small Rumin. Res.103,
112–119.
Szpiech, Z.A., Jakobsson, M. & Rosenberg, N.A., 2008. ADZE: a rarefaction approach for
counting alleles private to combinations of populations. Bioinformat. 24, 2498-2504.
Van Wyk, J.B., Fair, M.D. & Cloete, S.W.P., 2009. Case study: The effect of inbreeding on
the production and reproduction traits in the Elsenburg Dormer sheep stud. Livest. Sci.
120, 218-224.
Vignal, A., Milan, D., Sancristobal, M. & Eggen, A., 2002. A review on SNP and other types
of molecular markers and their use in animal genetics. Genet. Sel. Evol. 34, 275-305.
Visser, C., Lashmar, S.F., Van Marle-Köster, E., Poli, M.A. & Allain, D. 2016. Genetic
diversity and population structure in South African, French and Argentinian Angora
Goats from Genome-Wide SNP data. PLOS One 11, 0154353.
Wiener, G., Lee, G.J. & Wooliams, J.A., 1992. Effects of rapid inbreeding and crossing of
inbred lines on the body weight growth of sheep. Anim. Prod. 55, 89-99.
Zheng, X., Levine, D., Shen, J., Gogarten, S.M., Laurie, C. & Weir, B.S., 2012. A high-
performance computing toolset for relatedness and principal component analysis of
SNP data. Bioinformat. 28, 3326-3328.
Zwane, A.A., Maiwashe, A., Makgahlela, M.L., Choudbury, A., Taylor, J.F. & Van Marle-
Köster, E., 2016. Genome-wide identification of breed-informative single-nucleotide
Stellenbosch University https://scholar.sun.ac.za
123
polymorphisms in three South African indigenous cattle breeds. S. Afr. J. Anim. Sci.
46, 302-311.
Stellenbosch University https://scholar.sun.ac.za
124
Chapter 6
Genome-wide association study for wet-dry phenotype in
smallholder ovine populations in South Africa
Abstract
The aim of this study was to identify single nucleotide polymorphisms (SNPs) associated with
genomic region underlying variation in the binomial reproductive trait ‘wet-dry’ in sheep. The
wet-dry phenotype was used to represent the reproductive status of the ewes, divided into two
categories, dry (ewes that did not lamb or that lost a lamb) and wet (ewes that had lambed and
had at least one suckling lamb). Wet-dry records were obtained from smallholder farmers (n =
176) and Nortier Research Farm (n = 131) for the 2014 breeding season. Ages of the ewes
ranged from 1 year to 6+ years. Data from 307 individuals were analysed, of which 172 Dorpers
and 4 White Dorpers were from smallholder sheep flocks and 48 Dorpers, 46 Namaqua
Afrikaners, 26 South African Mutton Merinos, 4 South African Mutton Merino x Dorper and
7 Dorper x South African Mutton Merino crossbreds were from the research farm. A logistic
regression model was fitted to adjust the data for the fixed effects of farm, breed, and age of
the ewe and weight at mating as a covariate. Linkage disequilibrium (LD) and inbreeding
coefficient were estimated using PLINK. Association analysis was performed using the
genome-wide efficient mixed-model association package (GEMMA) to determine whether any
significant SNPs were associated with the wet-dry reproductive trait. The wet-dry phenotype
differed significantly between the smallholder (0.63 ± 0.04) and research farm flocks (0.79 ±
0.04). Genome-wide LD across all populations was r2 = 0.36. Dorpers from the smallholder
flock exhibited rapid LD decay versus the resource ovine populations. Inbreeding levels were
also lower for the smallholder flock (4 ± 0.003%) versus the research flock (13 ± 0.008%). No
Stellenbosch University https://scholar.sun.ac.za
125
significant SNPs were identified after correction for false discovery rate. The heritability
estimate for wet-dry using SNP information was 0.24. This estimate concurs with the literature
and indicates the possibility of using genomic selection to improve reproduction in smallholder
sheep flocks
6.1. Introduction
Smallholder sheep farmers in South Africa have been reported to have flocks with low
reproductive performance (Marais, 2007; Grobler, 2010). This may be owing to many factors,
including nutrition, management and genetics. Genetic selection plays an important role in
establishing permanent change that is sustainable for the long term in improving traits related
to fitness. Fitness traits are linked to the reproduction of animals and can be measured with
various indicator traits. Reproduction can be measured by composite traits such as number of
lambs born per ewe lifetime or the number of lambs weaned per ewe lifetime, or by
components traits such as litter size, fertility, conception rate and mothering ability (Zishiri et
al., 2013). Quantifying and measuring fitness traits in smallholder production systems can be
challenging owing to a lack of recordkeeping. It is therefore necessary to use easy-to-measure
indicator traits that involve minimal recordkeeping and input costs.
In Chapter 2, under section 2.5 we discussed the genetic traits important for sustainability under
which the wet-dry phenotype were mentioned. The wet-dry phenotype (Fourie & Cloete, 1993)
is recorded from an udder examination performed during the marking of recently born lambs
or at the weaning of lambs. Wet-dry refers to whether a ewe is lactating or not, and can be used
as an indicator of reproductive performance of ewes in low-input farming systems. The wet-
dry phenotype is a composite trait and includes conception rate and mothering ability.
Heritabilities have yet to be estimated for this trait in South Africa. Heritabilities have
previously been estimated for Australian Merino flocks and range from 0.09 to 0.17 for wet-
Stellenbosch University https://scholar.sun.ac.za
126
dry recorded at weaning and 0.04 to 0.11 when recorded at lamb marking (Lee et al., 2010).
Heritability estimates for the component conception rate/fertility traits range from 0.01 to 0.30
(Iniguez et al., 1986; Tosh et al., 2002; Vatankhah et al., 2006; Piwczynski & Kowaliszyn,
2013). Wet-dry is therefore an easy to measure trait that can be recorded in smallholder sheep
farming systems as a proxy for reproduction. The underlying genetic regulation of reproduction
has not been fully elucidated. However, some genes that influence fecundity and oestrous cycle
in sheep have been identified. Genes affecting litter size in sheep include the BMPR1B/FecB
mutation on chromosome 6, GDF9 on chromosome 5 and BMP15 on the X chromosome
(Montgomery et al., 2001; Souza et al., 2001; Davis, 2004; Juengel et al., 2004; McNatty et
al., 2005; Polley et al., 2010). Genes influencing the oestrous cycle include PGFS
(AKR1B5/AKR1C3), PGES, PGFR, and PTGS2 (Kumar et al., 2013). Genotyping using SNPs
makes it possible to investigate population structure and establish pedigree relationships among
animals. Linkage disequilibrium (LD) in a population is important to consider for genome-
wide association studies (GWAS). This is because LD is the ability of an allele from one marker
to predict the allelic status of another marker (Meadows et al., 2008). A preliminary genome-
wide association study was conducted to investigate whether the wet-dry phenotype was
influenced by variation in any of these genes. If indications of associations were found, then
these genes could be further investigated to identify variants that could be used in marker-
assisted selected programmes to improve reproduction in smallholder farming operations.
The aim of this study therefore was to identify SNPs associated with quantitative trait loci
(QTL) underlying variation in the binomial wet-dry reproductive trait.
6.2. Materials and methods
The sites of sample collection were Nortier Research Farm and the Ebenheaser smallholder
community in Western Cape, South Africa. Ethical clearance was obtained from the
Stellenbosch University https://scholar.sun.ac.za
127
Departmental Ethics Committee for Research on Animals (DECRA), namely approval
numbers R12/53 for smallholder flocks and R14/100 for the resource flock from the Western
Cape Department of Agriculture. Nortier is located at 32º 5' 32.0833" S, 18º 18' 18.3000" E.
Ebenheaser is located at 31º 35' 8.5856" S, 18º 14' 39.2442" E. These farms are located in the
West Coast district and are classified under the Succulent Karoo Biome, described by Acocks
(1988). The succulent Karoo consists mainly of succulent plants and is a winter rainfall area.
The altitude ranges from sea level to 1500 m and the mean annual rainfall is between 20 and
350 mm. A winter lambing season was implemented, and wet-dry data were collected after the
lambing season in July–August 2014. The wet-dry phenotype was used to represent the
reproductive status of the ewes. The ewes were divided into two categories: dry (ewes that did
not lamb, or that lost all their lamb(s) and were thus not lactating) and wet (ewes that had
lambed and were suckling one or more lambs). Wet-dry records were obtained from
smallholders (n = 176) and the resource flock at Nortier Research Farm (n = 131) for the 2014
breeding season. The ages of the ewes ranged from 1 year to 6+ years. A logistic regression
model was fitted in SAS (2012) to adjust the phenotypic data for the fixed effects of farm,
breed, age of the ewe and mating weight as a covariate. The sheep sampled from the
smallholder farms were identified in a fastSTRUCTURE analysis (Raj et al., 2014) as being
172 Dorpers (Dorpersm) and 4 White Dorpers. The sheep sampled from the research farm were
identified as 48 Dorpers, 46 Namaqua Afrikaners (Namafr), 26 South African Mutton Merinos
(SAMM), 4 South African Mutton Merino x Dorper (SAMMDX) and 7 Dorper x South African
Mutton Merino (DSAMMX) crossbreds.
The DNA samples were genotyped using the Ovine 50K SNP bead chip. Genotypic data were
analysed using PLINK (Purcell et al., 2007). Data for 307 individuals were analysed. Quality
control was conducted by setting thresholds for minor allele frequency at 5%, Hardy Weinberg
Equilibrium at P <0.001, and genotype call rate per animal at 95%. The data were pruned
Stellenbosch University https://scholar.sun.ac.za
128
according to these criteria and 43 500 SNPs were retained and used in the analyses. Linkage
disequilibrium and inbreeding coefficient were calculated with PLINK. Association analysis
was performed using the genome-wide efficient mixed-model association package (GEMMA)
(Zhou & Stephens, 2012), to determine whether any significant large-effect SNPs were
associated with the wet-dry reproductive trait.
Breed proportions were fit as covariates, and the farm of origin (smallholder or research farms)
was fit as a covariate in the model for the genotypic data. The genetic similarity matrix was
estimated using GEMMA. A univariate linear mixed model was fit in GEMMA for testing
marker associations with wet-dry accounting for population stratification and pedigree
structure. Chip heritability was estimated as the proportion of the phenotypic variance
explained by genotypes.
The model used was:
y = Wɑ + x β + µ + ε µ ~ MVNn (0, λT-1K) and ε ~ MVNn (0, T
-1In)
Where: y is an n-vector of binary trait values (1 for wet, 0 for dry) for the n individuals
W = (w1,….., wc) is an n x n matrix of covariate values corresponding to the fixed effects and
including a column of 1s
ɑ = is an c-vector of the corresponding fixed effect parameters including the intercept
x = n-vector of marker genotypes
β = effect size of the marker
µ = n-vector of random residual additive genetic effects
ε = is an n-vector of errors
Stellenbosch University https://scholar.sun.ac.za
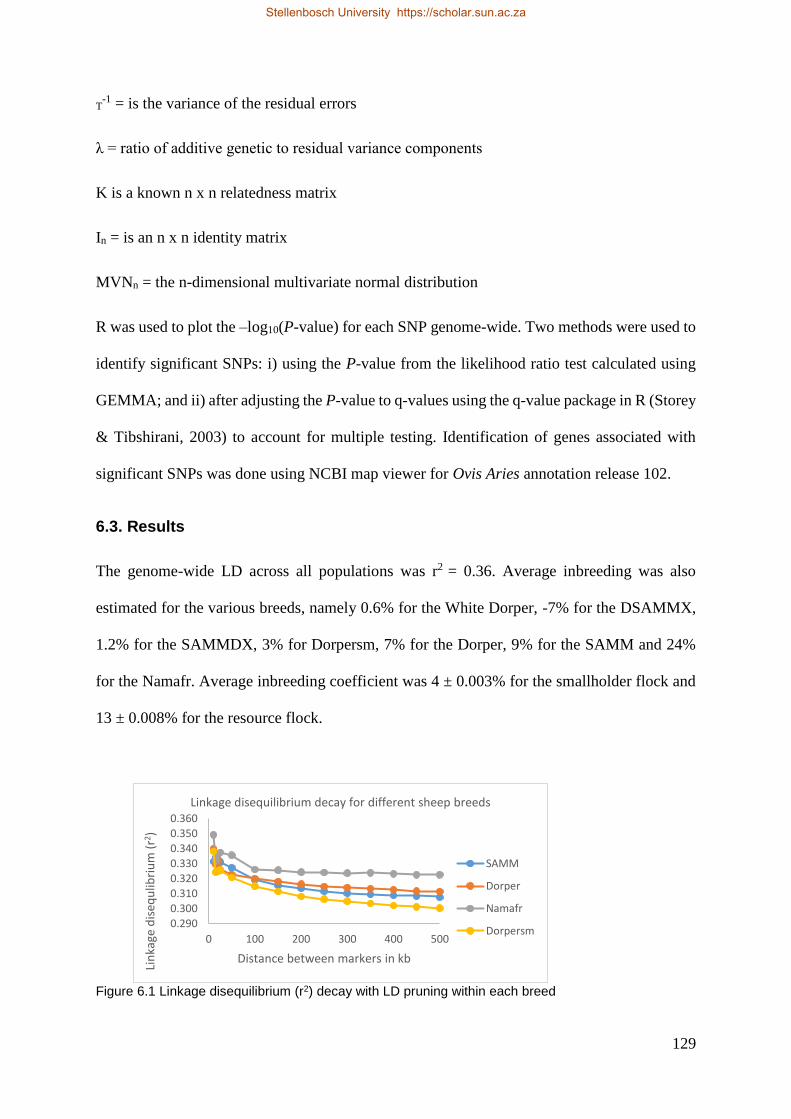
129
T-1 = is the variance of the residual errors
λ = ratio of additive genetic to residual variance components
K is a known n x n relatedness matrix
In = is an n x n identity matrix
MVNn = the n-dimensional multivariate normal distribution
R was used to plot the –log10(P-value) for each SNP genome-wide. Two methods were used to
identify significant SNPs: i) using the P-value from the likelihood ratio test calculated using
GEMMA; and ii) after adjusting the P-value to q-values using the q-value package in R (Storey
& Tibshirani, 2003) to account for multiple testing. Identification of genes associated with
significant SNPs was done using NCBI map viewer for Ovis Aries annotation release 102.
6.3. Results
The genome-wide LD across all populations was r2 = 0.36. Average inbreeding was also
estimated for the various breeds, namely 0.6% for the White Dorper, -7% for the DSAMMX,
1.2% for the SAMMDX, 3% for Dorpersm, 7% for the Dorper, 9% for the SAMM and 24%
for the Namafr. Average inbreeding coefficient was 4 ± 0.003% for the smallholder flock and
13 ± 0.008% for the resource flock.
Figure 6.1 Linkage disequilibrium (r2) decay with LD pruning within each breed
0.290
0.300
0.310
0.320
0.330
0.340
0.350
0.360
0 100 200 300 400 500
Lin
kage
dis
equ
libri
um
(r2
)
Distance between markers in kb
Linkage disequilibrium decay for different sheep breeds
SAMM
Dorper
Namafr
Dorpersm
Stellenbosch University https://scholar.sun.ac.za
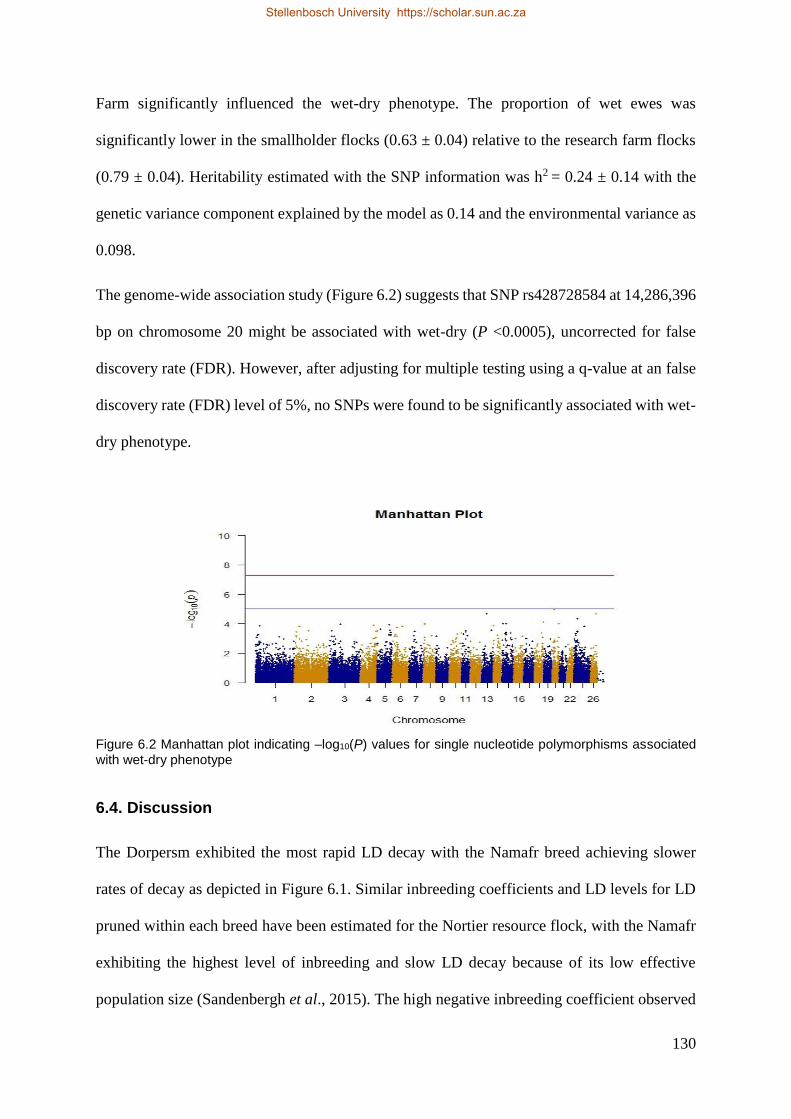
130
Farm significantly influenced the wet-dry phenotype. The proportion of wet ewes was
significantly lower in the smallholder flocks (0.63 ± 0.04) relative to the research farm flocks
(0.79 ± 0.04). Heritability estimated with the SNP information was h2 = 0.24 ± 0.14 with the
genetic variance component explained by the model as 0.14 and the environmental variance as
0.098.
The genome-wide association study (Figure 6.2) suggests that SNP rs428728584 at 14,286,396
bp on chromosome 20 might be associated with wet-dry (P <0.0005), uncorrected for false
discovery rate (FDR). However, after adjusting for multiple testing using a q-value at an false
discovery rate (FDR) level of 5%, no SNPs were found to be significantly associated with wet-
dry phenotype.
Figure 6.2 Manhattan plot indicating –log10(P) values for single nucleotide polymorphisms associated with wet-dry phenotype
6.4. Discussion
The Dorpersm exhibited the most rapid LD decay with the Namafr breed achieving slower
rates of decay as depicted in Figure 6.1. Similar inbreeding coefficients and LD levels for LD
pruned within each breed have been estimated for the Nortier resource flock, with the Namafr
exhibiting the highest level of inbreeding and slow LD decay because of its low effective
population size (Sandenbergh et al., 2015). The high negative inbreeding coefficient observed
Stellenbosch University https://scholar.sun.ac.za
131
for the DSAMMX might be because these crossbreds were F1s and possessed higher levels of
heterozygosity. The Dorpers and White Dorper obtained from smallholder flocks exhibited low
levels of inbreeding in comparison to the purebred Dorper, SAMM and Namafr obtained from
the resource flocks. This could be due to the willingness of smallholder farmers to crossbreed.
The inbreeding levels for the purebred Dorper and SAMM are in line with literature estimates
(Sandenbergh et al., 2015) and are as expected for close nucleus breeding schemes.
These results for wet-dry phenotype are consistent with those in the literature, ranging from
0.72 in Merino ewes to 0.80 for SA Mutton Merino ewes in the Bredasdorp region (Fourie &
Cloete, 1993). Lee et al. (2010) report heritability estimates of 0.09 to 0.17 for wet-dry at
weaning and 0.04 to 0.11 for wet-dry at marking. The SNP heritibility estimate of the current
study falls in the range of heritability estimates for conception rate (0.01 to 0.30) reported in
the literature (Iniguez et al., 1986; Lee et al., 2009, Piwczynski & Kowaliszyn, 2013). The
variation observed in heritability estimates is probably because of different methods used for
estimation, and different variance components between breeds and production environments.
The high level of genome-wide LD, however, implies the possibility of identifying SNPs that
form haplotype blocks that influence reproduction in sheep. Sandenbergh (2015) accordingly
suggested that many loci of small to medium effect might influence the expression of
reproduction traits in sheep. The different patterns of LD observed between the breeds
implicate the number of markers that can be used for identification of QTL. The smallholder
sheep had the shortest LD stretches and thus dense SNP marker panels should be used to
identify significant SNPs. The genome-wide association analysis did not yield significant SNPs
for wet-dry when a false discovery rate correction was applied to the SNP association P-values,
which is because of the limited number of records available for this study.
Stellenbosch University https://scholar.sun.ac.za
132
6.5. Conclusions
The smallholder sheep flock exhibited low levels of inbreeding, which is promising for future
genetic improvement in these populations. It is thus possible to use this approach to estimate
additive genetic merit of animals in smallholder populations, allowing an opportunity for
selection to improve genetic gain. Identifying causal variants related to the wet-dry phenotype,
which is affordable and easy to measure in smallholder farming systems, could aid in
improving the intensity of selection for this trait. This is the first study implicating the possible
use of SNP data to investigate genetic structure in smallholder sheep populations in South
Africa and to estimate a heritability estimate for wet-dry phenotype relevant to smallholder
sheep farmers. The next step would be to improve the collection of phenotypic data and
increase sample size for further genomic studies. The use of the Ovine SNP 600 K BeadChip
or whole genome sequencing could also be of value for future studies.
6.5. References
Acocks, J.P.H., 1988. Veld types of South Africa. Memoirs of the Botanical Survey of South
Africa, 57. SANBI, Pretoria.
Davis, G.H., 2004. Fecundity genes in sheep. Anim. Reprod. Sci. 82-83, 247-253.
Fourie, A.J. & Cloete, S.W.P., 1993. Reproductive performance of commercial Merino, Dohne
Merino and SA Mutton Merino flocks in the Southern Cape. S. Afr. J. Anim. Sci. 23,
104-110.
Grobler, H.J.F., 2010. Evaluation survey at extensive farms in the Central Karoo 2009.
Agriprobe, June, 6-9.
Iniguez, L.C., Quass, R.L. & Van Vleck, L.D., 1986. J. Anim. Sci. 63, 1769-1778.
Stellenbosch University https://scholar.sun.ac.za
133
Juengel, J.L., Bodensteiner, K.J., Heath, D.A., Hudson, N.L., Moeller, C.L., Smith, P.,
Galloway, S.M., Davis, G.H., Sawyer, H.R. & McNatty, K.P., 2004. Physiology of
GDF9 and BMP15 signalling molecules. Anim. Reprod. Sci. 82-83, 447-460.
Kumar, R., Ramteke, P.W., Nath, A., Pramod, R.K., Singh, S.P., Sharma, S.K. & Kumar, S.,
2013. Role of candidate genes regulating uterine prostaglandins biosynthesis for
maternal recognition of pregnancy in domestic animals. ISRN Physiol., Hindawi
Publishing, Volume 2013, article ID 854572, http://dx.doi.org/10.1155/2013/854572.
pp.8
Lee, G.J., Atkins, K.D. & Sladek, M.A., 2009. Genetic parameters for lifetime reproductive
performance of merino ewes. Proc. Assoc. Advmt. Anim. Breed. Genet. 18, 382-385.
Lee, G.J., Sladek, M.A. & Atkins, K.D., 2010. Selection criteria for within flock selection to
improve reproduction efficiency.
http://www.livestocklibrary.com.au/bitstream/handle/1234/33711/SheepCRC_2_87.p
df?sequence=1 (accessed 21/01/2016)
Marais, P.G., 2007. Evaluation of the genetic potential for growth and wool production of
typical Transkei ewes and rams. Research report of the Grootfontein Agricultural
Development Institute, 2007. Private Bag x529, Middelburg 5900, South Africa. pp.
33-34.
McNatty, K.P., Smith, P., Moore, L.G, Reader, K., Lun, S., Hanrahan, J.P., Groome, N.P.,
Laitinen, M., Ritvos, O. & Juengel, J.L., 2005. Oocyte-expressed genes affecting
ovulation rate. Mol. Cell. Endocrinol. 234, 57-66.
Meadows, J.R.S., Chan, E.K.F. & Kijas, J.W. 2008. Linkage disequilibrium compared between
five populations of domestic sheep. BMC Genet. 9, 61-71.
Montgomery, G.W., Galloway, S.M., Davis, G.H. & McNatty, K.P., 2001. Genes controlling
ovulation rate in sheep. Reprod. 121, 843-852.
Stellenbosch University https://scholar.sun.ac.za
134
Piwczynski, D. & Kowaliszyn, B., 2013. Heritability and breeding value of sheep fertility
estimated by means of GIBBS sampling method using linear and threshold models. J.
Cent. Eur. Agric. 14, 23-32.
Polley, S., De, S., Brahma, B., Mukherjee, A., Vinesh, P.V., Batabyal, S., Arora, J.S., Pan, S.,
Samanta, A.K., Datta, T.K. & Goswami, S.L., 2010. Polymorphism of BMPR1B,
BMP15 and GDF9 fecundity genes in prolific Garole sheep. Trop. Anim. Health Prod.
42, 985-993.
Purcell, S., Neale, B., Todd-Brown, K., Thomas, L., Ferreira, M.A.R., Bender, D., Maller, J.,
Sklar, P., De Bakker, P.I.W., Daly, M.J. & Sham, P.C., 2007. PLINK: a toolset for
whole-genome association and population-based linkage analysis. Am. J. Hum. Genet.
81, 559-575.
Raj, A., Stephens, M. & Pritchard, J.K. 2014.fastSTRUCTURE: Variational inference of
population structure in large SNP data sets. Genet. 197, 573-589.
Sandenbergh, L., 2015. Identification of SNPs associated with robustness and greater
reproductive success in South African Merino using SNP chip technology. PhD thesis.
University of Stellenbosch.
Sandenbergh, L., Cloete, S.W.P., Roodt-Wilding, R., Snyman, M.A. & Van der Merwe, A.E.,
2015. Genetic diversity and population structure of four South African sheep breeds.
Proc. Assoc. Advmt. Anim. Breed. Genet. 21, 294-297.
SAS, 2012. SAS Institute Inc. Cary, NC.
Souza, C.J.H., MacDougall, C., Campbell, B.K. & McNeilly, A.S., 2001. The Booroola (FecB)
phenotype is associated with a mutation in the bone morphogenetic receptor type 1 B
(BMPR1B) gene. J. Endocrinol. 169, R1-R6.
Storey, J.D. & Tibshirani, R., 2003. Statistical significance for genome-wide experiments.
Proc. Natl. Acad. Sci. USA. 100, 9440-9445.
Stellenbosch University https://scholar.sun.ac.za
135
Tosh, J.J., Wilton, J.W. & Kennedy, D., 2002. Heritability of fertility in four seasons for ewes
under accelerated lambing. Seventh WCGALP – August 19-23, Montpellier, France
Vatankhah, W., Poortahmasb, A. & Merzaei, H.R., 2006. Estimation of performance and
genetic parameters of reproductive traits in Lori-Bakhtiari sheep using linear and
threshold models. EAAP, 57th Annual Meeting, Antyla, 64.
Zhou, X. & Stephens, M., 2012. Genome-wide efficient mixed-model analysis for association
studies. Nat. Genet. 44, 821-824.
Zishiri, O.T., Cloete, S.W.P., Olivier, J.J. & Dzama, K., 2013. Genetic parameters for growth,
reproduction and fitness traits in the South African Dorper sheep breed. Small Rumin.
Res. 112, 39-48
Stellenbosch University https://scholar.sun.ac.za
136
Chapter 7
Identification of selection signatures related to traits of robustness
in South African sheep populations using the Bayesian Fst and
HAPFLK approaches
Abstract
A study was conducted using HAPFLK and Bayescan to identify selection signatures in
purebred Dorper, Namaqua Afrikaner and South African Mutton Merino sheep breeds.
Selection signatures obtained using HAPFLK identified 26 significant SNP markers with
selective sweeps on chromosome 1 and chromosome 2. Heat shock protein 28 (DNAJC28)
were under selection on chromosome 1 and genes on chromosome 2 were gonadotropin
releasing hormone (GNRH1), melanoregulin (MREG), spermatogenesis associated protein
31C2 –like and testis-expressed sequence 10 protein –like. The Bayescan method suggested 92
loci that were under selection. A signature was found on chromosome 10 in relaxin/insulin-like
family peptide receptor 2 (RXFP2) that plays a role in the absence of horns (polledness) in
sheep. This study suggested that some important genes for reproduction and adaptation to heat
stress as suggested by HAPFLK, whereas the Bayescan confirmed traits like polledness and
keratin that indicates ancient selection.
7.1. Introduction
Currently, there are 21.2 million sheep in South Africa (Abstract of Agriculture, 2015), which
consists of more than 20 different breeds of which the Dorper and Merino are most prominent
breeds (Cloete & Olivier, 2010). Other sheep breeds include the Merino, Dohne Merino,
Dorper, South African Mutton Merino, Dormer, Ile de France, Merino Landsheep, Afrino, Van
Rooy, Meatmaster, Damara, Nguni, Pedi and the Namaqua Afrikaner amongst others. Sheep
Stellenbosch University https://scholar.sun.ac.za
137
are mainly commercially farmed for meat and wool in South Africa. The Dorper, Merino and
South African Mutton Merino are some of the prominent commercial breeds used in South
Africa.
The Dorper is a composite breed derived from an initial cross between Black headed Persian
and Dorset Horn sheep in the early 1900’s and is widely farmed in the arid and semi-arid
environments of South Africa. This is because of the ability of Dorpers to grow and reproduce
well in harsh environments (Milne, 2000). The Namaqua Afrikaner is one of the oldest
indigenous breeds in South Africa (Ramsay et al., 2001). The breed was associated with the
nomadic Nama people between 200 to 400 AD in the harsh dry areas of the North-Western
Cape and Southern Namibia. The Namaqua Afrikaner is adapted to harsh environments
(Snyman et al., 2005) and is currently listed as an endangered breed (Qwabe et al., 2013). The
South African Mutton Merino was derived from the German Merino and was selected for both
wool and meat production (Schoeman et al., 2010).
Selection signatures are used to determine selection patterns in populations. It is a backward
approach inferring selected mutations with their associated phenotypes (Ross-Ibarra et al.,
2007). Different methods are used to detect selection signatures, including the Fst and more
recently FLK approach (Fariello et al., 2013). Fst outlier approach is commonly used in
selection signatures studies; however there are some limitations to only using Fst measures. Fst
does not account for sampling errors, whereas FLK accounts for population size, heterogeneity
and for the hierarchal structures between populations (Fariello et al., 2013). Kijas et al., 2012
used the Fst approach to determine selection signatures in sheep populations and found 31
genomic regions under selection. A study using HAPFLK using the same HAPMAP dataset
observed 41 selection signatures with only 10 regions overlapping with the study of Kijas et
al. (2012) (Fariello et al., 2014). Strong selection signatures were detected for polledness in
studies using both Fst and HapFLK methods (Kijas et al., 2012; Fariello et al., 2014) indicating
Stellenbosch University https://scholar.sun.ac.za
138
that this trait has been selected for many years. Selection signature studies are important to
determine selection for traits of economic importance in livestock. They have also been widely
used in several studies to determine regions under selection in different livestock species
including cattle, goats and pigs (Ramey et al., 2013; Ai et al., 2013; Ma et al., 2015; Kim et
al., 2016). Limited research has been done on selection signatures in South African sheep
populations. A study done on South African Merinos using Fst statistics identified 31
signatures of selection within this population (Sandenbergh, 2015).
Knowledge on how sheep populations differentiated is of value to improve further sheep
breeding schemes. The objective of this study was to compare HAPFLK and Bayesian Fst to
detect selection signatures related to physiological pathways putatively linked to robustness
traits in three South African purebreds namely the Dorper, South African Mutton Merino and
Namaqua Afrikaner.
7.2. Materials and Methods
Refer to section 6.2 in Chapter 6 for the description of materials and methods.
7.3. Statistical analysis
7.3.1. Quality control
The DNA samples were genotyped using the OvineSNP50 Bead Chip. Genotypic data were
analysed using PLINK (Purcell et al., 2007). Data for 307 individuals were analysed. Quality
control was conducted by setting thresholds for minor allele frequency <0.01, genotype call
rate per animal at 95% across all breeds. The data were pruned according to these criteria and
48078 SNPs for 193 sheep were retained and used in the analyses.
The population structure was investigated using fastSTRUCTURE (Raj et al., 2014) to identify
outlier animals that are admixed. These animals were excluded from the HAPFLK analysis.
Stellenbosch University https://scholar.sun.ac.za
139
HAPFLK analysis was run for four breeds, the Dorper (46), Namaqua Afrikaner (48), South
African Mutton Merino (26) and Australian Merino (51), using the Valais Blacknose Sheep as
an outgroup (24). The Australian Merino and Valais Blacknose sheep data were obtained from
the HAPMAP sheep data (Kijas et al., 2009, Kijas et al., 2012). Bayescan 2.1 was used to do
an Fst test on the same dataset. A q-value threshold of 0.01 were applied to reduce the number
of false positives for both analysis. BayeScan is based on a multinomial Dirichlet model and
uses Reversible Jump Markov Chain Monte Carlo (RJ-MCMC) algorithms to obtain posterior
distributions (Foll & Gaggiotti, 2008). The Bayesian approach corrects for the uncertainty of
allele frequencies due to small samples sizes. Ensuring a reduction in the observation of false
positives among outlier markers (the prior odds) for the neutral model is set and posterior odds
(PO) is used to make decisions. Therefore, in the analysis of this data, the PO was set at 4000
to identify loci under selection within the populations. The SNPs under selection were
investigated further to determine genes putatively in linkage disequilibrium with the SNP loci.
Identification of genes associated with significant SNPs was done using NCBI map viewer for
Ovis Aries annotation release 102, 1Mb upstream or downstream of the markers under
selection.
7.4. Results
From the HAPFLK analysis, 26 SNPs were predicted to have been under strong selection as
shown in Table 7.1. Heat shock protein (DNAJC28) were under selection on chromosome 1
which plays an important role in the adaptation of sheep in extreme heat situations (Edwards
& Hansen, 1996) and gonadotropin releasing hormone (GNRH1), melanoregulin (MREG),
spermatogenesis associated protein 31C2 –like and testis-expressed sequence 10 protein –like
on chromosome 2. A population tree were rooted using the ValaisBlacknose as an outgroup to
infer selection for specific regions in different populations as seen in Figure 7.1. Selection for
the DNAJC28 is evident in the Australian Merino and Namaqua Afrikaner. A significant
Stellenbosch University https://scholar.sun.ac.za
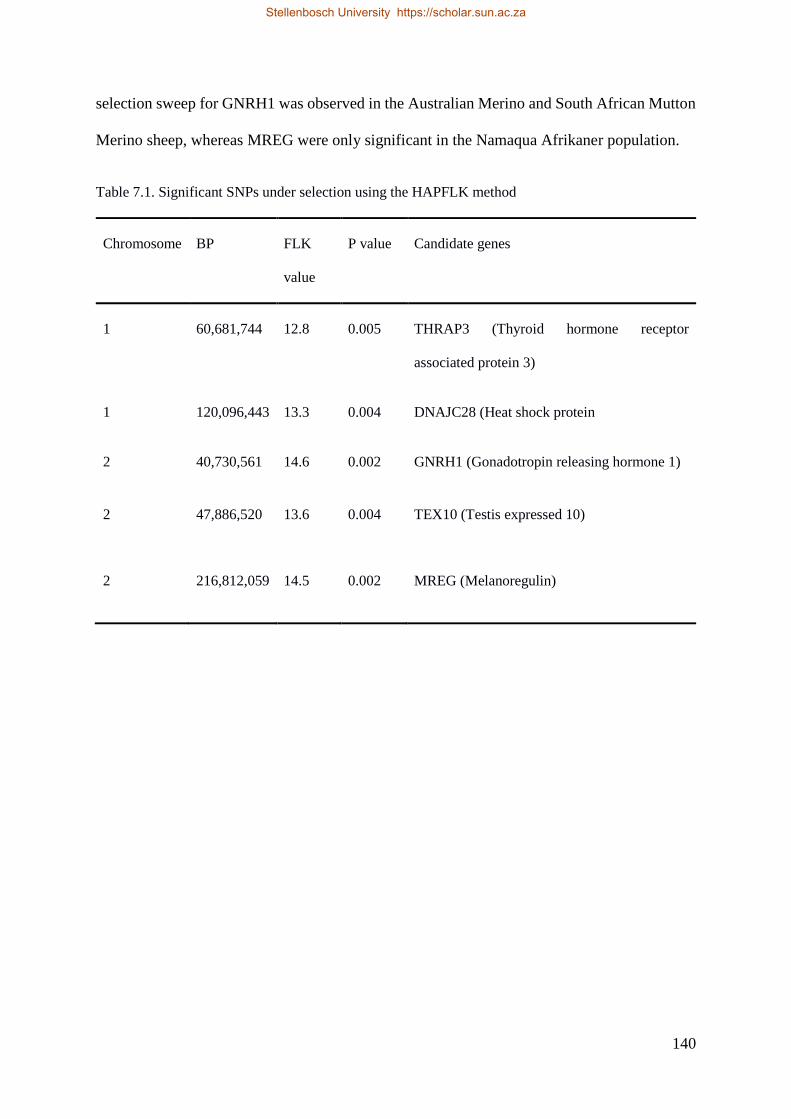
140
selection sweep for GNRH1 was observed in the Australian Merino and South African Mutton
Merino sheep, whereas MREG were only significant in the Namaqua Afrikaner population.
Table 7.1. Significant SNPs under selection using the HAPFLK method
Chromosome BP FLK
value
P value Candidate genes
1 60,681,744 12.8 0.005 THRAP3 (Thyroid hormone receptor
associated protein 3)
1 120,096,443 13.3 0.004 DNAJC28 (Heat shock protein
2 40,730,561 14.6 0.002 GNRH1 (Gonadotropin releasing hormone 1)
2 47,886,520 13.6 0.004 TEX10 (Testis expressed 10)
2 216,812,059 14.5 0.002 MREG (Melanoregulin)
Stellenbosch University https://scholar.sun.ac.za
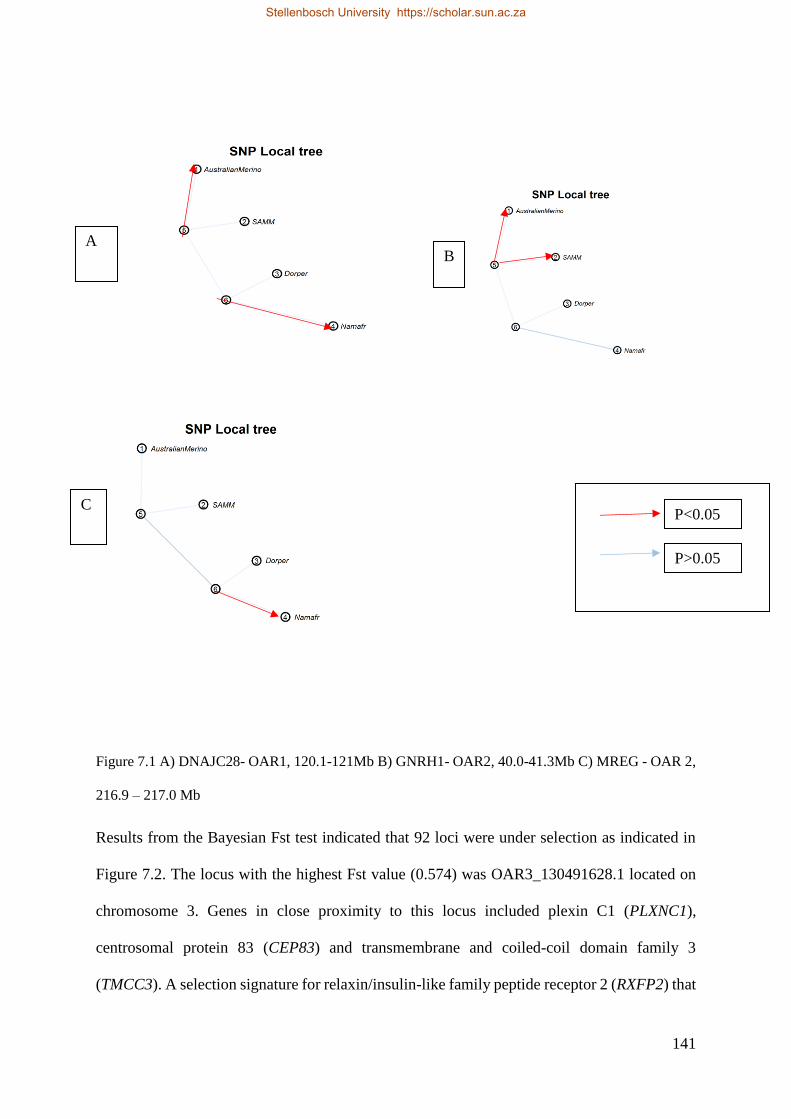
141
Figure 7.1 A) DNAJC28- OAR1, 120.1-121Mb B) GNRH1- OAR2, 40.0-41.3Mb C) MREG - OAR 2,
216.9 – 217.0 Mb
Results from the Bayesian Fst test indicated that 92 loci were under selection as indicated in
Figure 7.2. The locus with the highest Fst value (0.574) was OAR3_130491628.1 located on
chromosome 3. Genes in close proximity to this locus included plexin C1 (PLXNC1),
centrosomal protein 83 (CEP83) and transmembrane and coiled-coil domain family 3
(TMCC3). A selection signature for relaxin/insulin-like family peptide receptor 2 (RXFP2) that
A B
C P<0.05
P>0.05
Stellenbosch University https://scholar.sun.ac.za
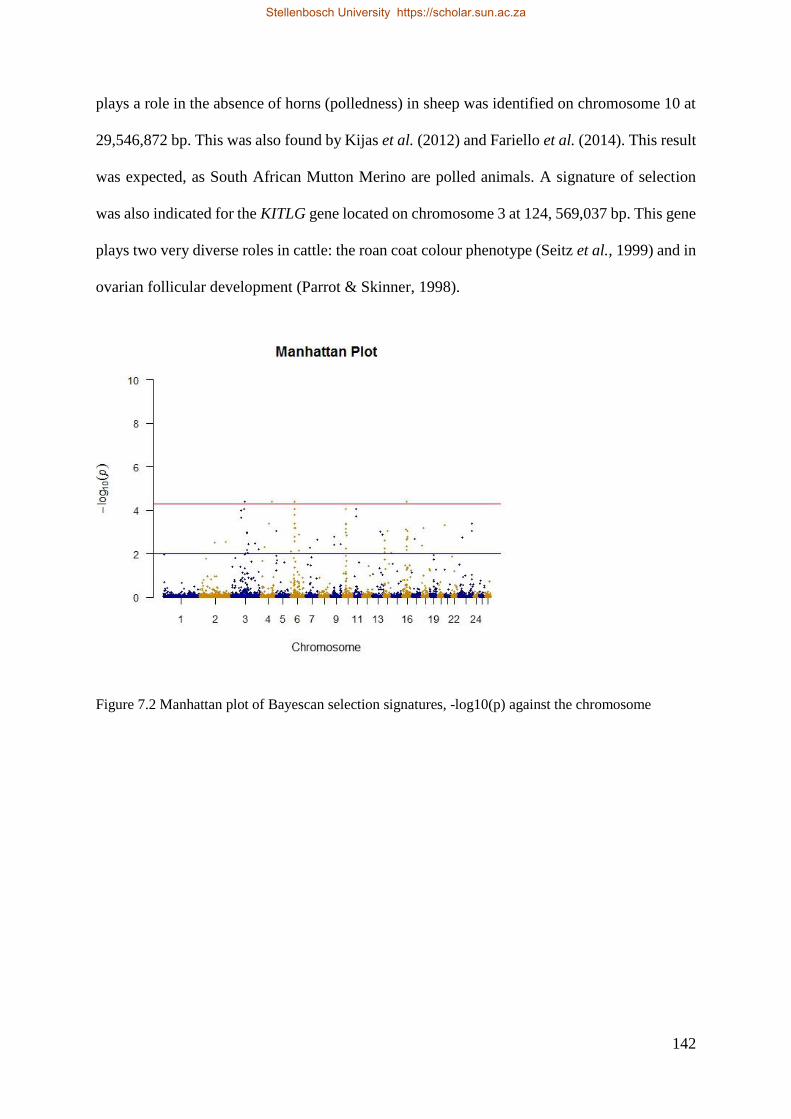
142
plays a role in the absence of horns (polledness) in sheep was identified on chromosome 10 at
29,546,872 bp. This was also found by Kijas et al. (2012) and Fariello et al. (2014). This result
was expected, as South African Mutton Merino are polled animals. A signature of selection
was also indicated for the KITLG gene located on chromosome 3 at 124, 569,037 bp. This gene
plays two very diverse roles in cattle: the roan coat colour phenotype (Seitz et al., 1999) and in
ovarian follicular development (Parrot & Skinner, 1998).
Figure 7.2 Manhattan plot of Bayescan selection signatures, -log10(p) against the chromosome
Stellenbosch University https://scholar.sun.ac.za
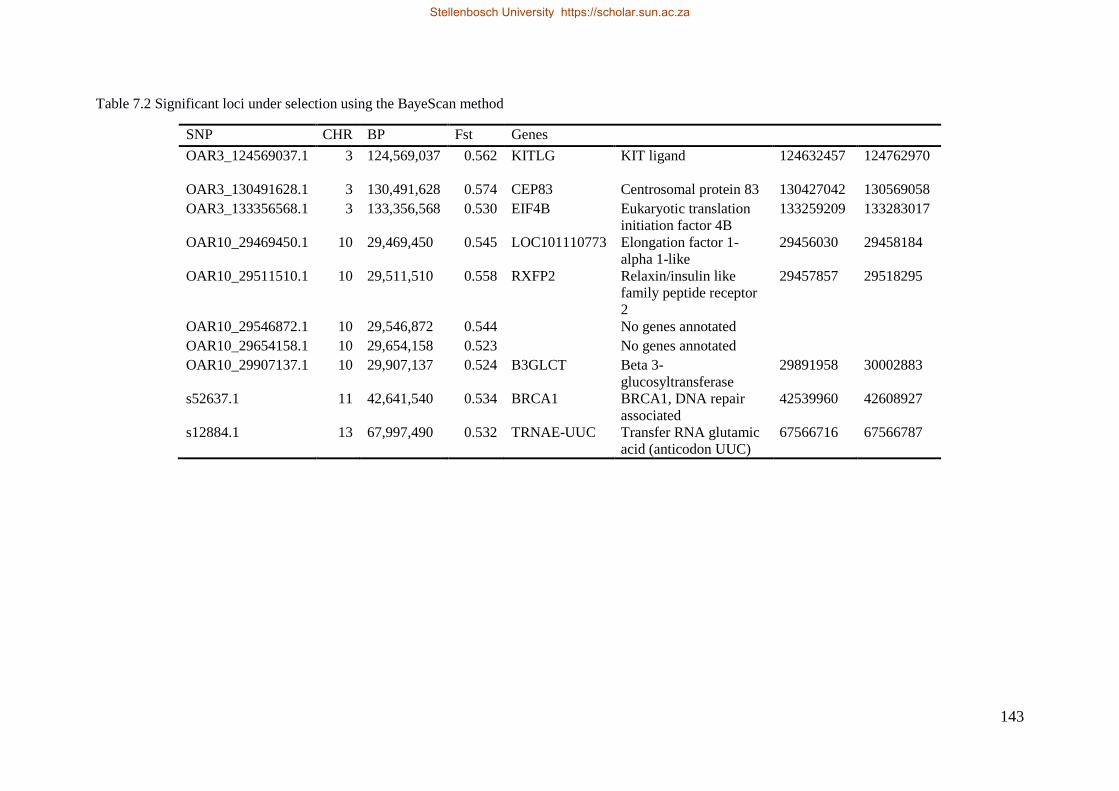
143
Table 7.2 Significant loci under selection using the BayeScan method
SNP CHR BP Fst Genes
OAR3_124569037.1 3 124,569,037 0.562 KITLG KIT ligand 124632457 124762970
OAR3_130491628.1 3 130,491,628 0.574 CEP83 Centrosomal protein 83 130427042 130569058
OAR3_133356568.1 3 133,356,568 0.530 EIF4B Eukaryotic translation
initiation factor 4B
133259209 133283017
OAR10_29469450.1 10 29,469,450 0.545 LOC101110773 Elongation factor 1-
alpha 1-like
29456030 29458184
OAR10_29511510.1 10 29,511,510 0.558 RXFP2 Relaxin/insulin like
family peptide receptor
2
29457857 29518295
OAR10_29546872.1 10 29,546,872 0.544
No genes annotated
OAR10_29654158.1 10 29,654,158 0.523
No genes annotated
OAR10_29907137.1 10 29,907,137 0.524 B3GLCT Beta 3-
glucosyltransferase
29891958 30002883
s52637.1 11 42,641,540 0.534 BRCA1 BRCA1, DNA repair
associated
42539960 42608927
s12884.1 13 67,997,490 0.532 TRNAE-UUC Transfer RNA glutamic
acid (anticodon UUC)
67566716 67566787
Stellenbosch University https://scholar.sun.ac.za
Stellenbosch University https://scholar.sun.ac.za
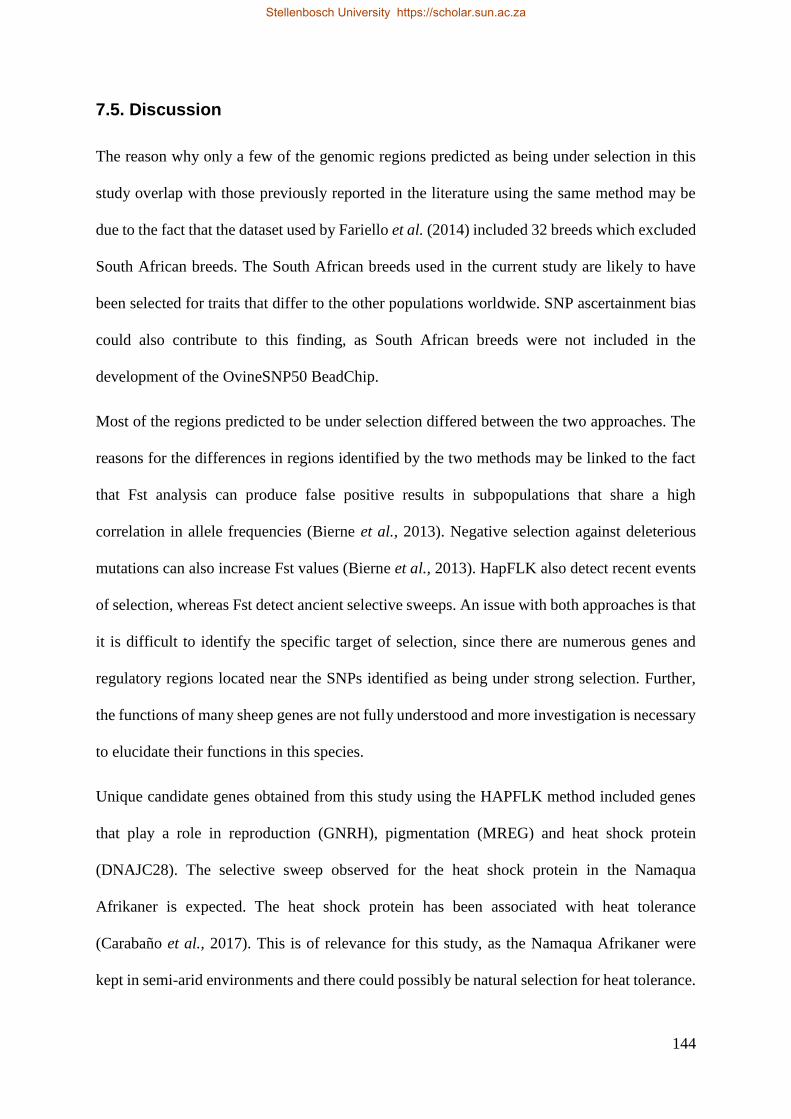
144
7.5. Discussion
The reason why only a few of the genomic regions predicted as being under selection in this
study overlap with those previously reported in the literature using the same method may be
due to the fact that the dataset used by Fariello et al. (2014) included 32 breeds which excluded
South African breeds. The South African breeds used in the current study are likely to have
been selected for traits that differ to the other populations worldwide. SNP ascertainment bias
could also contribute to this finding, as South African breeds were not included in the
development of the OvineSNP50 BeadChip.
Most of the regions predicted to be under selection differed between the two approaches. The
reasons for the differences in regions identified by the two methods may be linked to the fact
that Fst analysis can produce false positive results in subpopulations that share a high
correlation in allele frequencies (Bierne et al., 2013). Negative selection against deleterious
mutations can also increase Fst values (Bierne et al., 2013). HapFLK also detect recent events
of selection, whereas Fst detect ancient selective sweeps. An issue with both approaches is that
it is difficult to identify the specific target of selection, since there are numerous genes and
regulatory regions located near the SNPs identified as being under strong selection. Further,
the functions of many sheep genes are not fully understood and more investigation is necessary
to elucidate their functions in this species.
Unique candidate genes obtained from this study using the HAPFLK method included genes
that play a role in reproduction (GNRH), pigmentation (MREG) and heat shock protein
(DNAJC28). The selective sweep observed for the heat shock protein in the Namaqua
Afrikaner is expected. The heat shock protein has been associated with heat tolerance
(Carabaño et al., 2017). This is of relevance for this study, as the Namaqua Afrikaner were
kept in semi-arid environments and there could possibly be natural selection for heat tolerance.
Stellenbosch University https://scholar.sun.ac.za
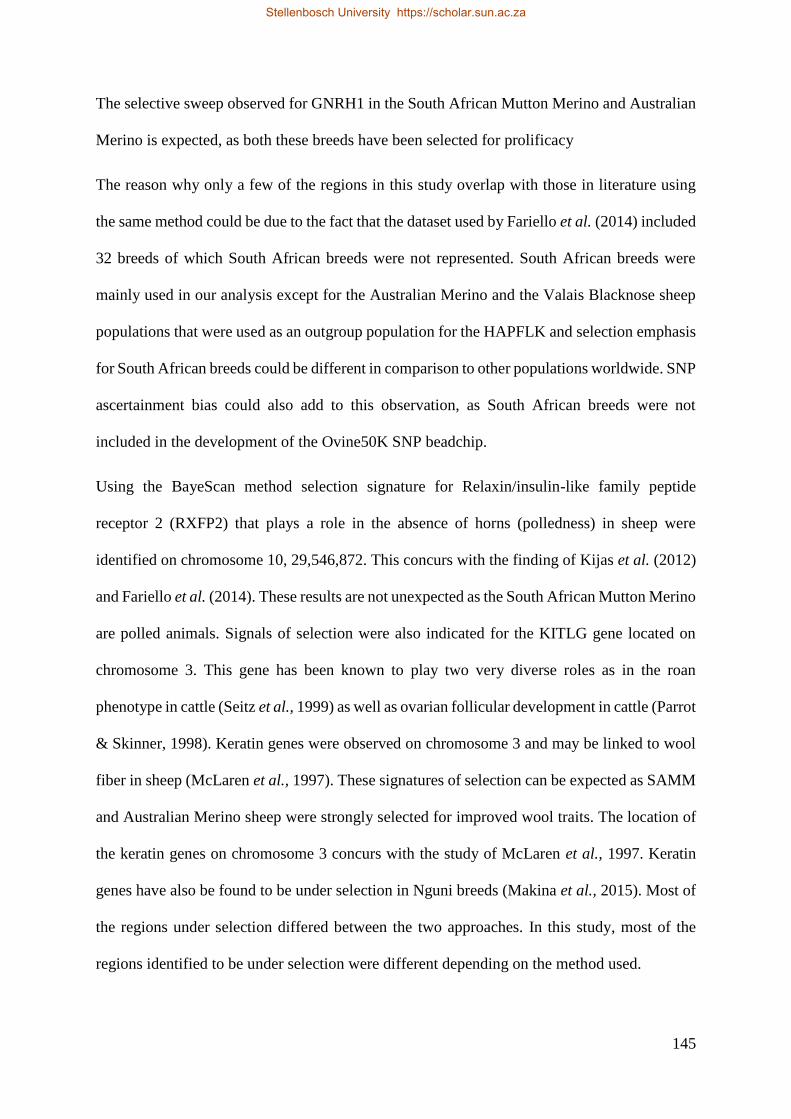
145
The selective sweep observed for GNRH1 in the South African Mutton Merino and Australian
Merino is expected, as both these breeds have been selected for prolificacy
The reason why only a few of the regions in this study overlap with those in literature using
the same method could be due to the fact that the dataset used by Fariello et al. (2014) included
32 breeds of which South African breeds were not represented. South African breeds were
mainly used in our analysis except for the Australian Merino and the Valais Blacknose sheep
populations that were used as an outgroup population for the HAPFLK and selection emphasis
for South African breeds could be different in comparison to other populations worldwide. SNP
ascertainment bias could also add to this observation, as South African breeds were not
included in the development of the Ovine50K SNP beadchip.
Using the BayeScan method selection signature for Relaxin/insulin-like family peptide
receptor 2 (RXFP2) that plays a role in the absence of horns (polledness) in sheep were
identified on chromosome 10, 29,546,872. This concurs with the finding of Kijas et al. (2012)
and Fariello et al. (2014). These results are not unexpected as the South African Mutton Merino
are polled animals. Signals of selection were also indicated for the KITLG gene located on
chromosome 3. This gene has been known to play two very diverse roles as in the roan
phenotype in cattle (Seitz et al., 1999) as well as ovarian follicular development in cattle (Parrot
& Skinner, 1998). Keratin genes were observed on chromosome 3 and may be linked to wool
fiber in sheep (McLaren et al., 1997). These signatures of selection can be expected as SAMM
and Australian Merino sheep were strongly selected for improved wool traits. The location of
the keratin genes on chromosome 3 concurs with the study of McLaren et al., 1997. Keratin
genes have also be found to be under selection in Nguni breeds (Makina et al., 2015). Most of
the regions under selection differed between the two approaches. In this study, most of the
regions identified to be under selection were different depending on the method used.
Stellenbosch University https://scholar.sun.ac.za
146
The reasons for the differences in regions identified by the two different methods could be
linked to the fact that Fst values can produce false outliers in subpopulations that share high
correlation in gene frequencies (Bierne et al., 2013). Soma et al., 2012 indicated that the Dorper
and SAMM was genetically close compared to the Namaqua Afrikaner that is further distanced
from the Dorper and Merino-type breeds. Negative selection against deleterious mutations can
also increase Fst values (Bierne et al., 2013). Artificial selection for various traits such as
conformation, size, fat distribution, colour pattern, hair/wool type has been made in the South
African Dorper (Milne, 2000). The SAMM has been selected for improved wool traits,
conformation and growth traits (Neser et al., 2000). The HAPFLK focus on haplotype
differentiation which identifies selection sweeps of haplotypes inherited together. A setback
with both methods is that it is difficult to identify with certainty the specific target under
selection, since there are numerous genes within the regions of selection. The functions of some
of the genes in sheep species are not clearly described in the literature and more investigation
is necessary to elucidate their functions in sheep species.
7.6. Conclusions
Selective sweep have been identified on regions of chromosome 1 and 2 that has been selected
for adaptation to heat and reproduction respectively. Candidate genes under strong selection in
South African sheep populations identified include pigmentation (KITLG); selection appears
to have been applied to variation in relaxin/insulin-like family peptide receptor 2 (RXFP2) and
keratin genes. These selected regions concur with the observation that artificial selection has
been placed on traits such as colour/pigmentation and growth in the development of the Dorper
and on wool and growth traits in the South African Mutton Merino and Australian Merino.
Natural selection has also occurred for traits related to adaptability.
Stellenbosch University https://scholar.sun.ac.za
147
7.7. References
Ai, H., Huang, L. & Ren, J., 2013. Genetic diversity, linkage disequilibrium and selection
signatures in Chinese and Western pigs revealed by genome-wide SNP markers. PLoS
ONE, 8, e56001.
Bierne, N., Roze, D. & Welch J.J., 2013. Pervasive selection or is it ...? Why are Fst outliers
sometimes so frequent? Mol. Ecol. 22, 2061-2064.
Carabaño, M.J., Ramón, M., Díaz, C., Molina, A., Pérez-Guzmán, M.D. & Serradilla, J.M.,
2017. Breeding for resilience to heat stress effects: A comparison across dairy ruminant
species. J.Anim. Sci. 95, 1813-1826.
Cloete, S.W.P. & Olivier, J.J., 2010. South African Sheep and Wool industry. In: International
Sheep and Wool handbook. Ed. D.J. Cottle. Nottingham University Press, Manor Farm,
Thrumpton, Nottingham NG11 0AX, united Kingdom. Pp 95-112.
Deng, W.D., Shu, W., Yang, S. L., Shi, X.W. & Mao, H.M., 2009. Pigmentation in black-
boned sheep (Ovis aries): association with polymorphism of the MC1R gene. Mol. Biol.
Reports 36, 431-436.
Edwards, J.L. & Hansen, P.J. 1996. Elevated temperature increases heat shock protein 70
synthesis in bovine two-cell embryos and compromises function of maturing oocytes.
Biol. Reprod. 55, 340-346.
Fariello, M.I., Boitard, S., Naya, H., SanCristobal, M. & Servin, B., 2013. Detecting signatures
of selection through haplotype differentiation among hierarchically structured
populations. Genet. 193, 929-941.
Stellenbosch University https://scholar.sun.ac.za
148
Fariello, M.I., Servin, B., Tosser-Klopp, G., Rupp, R., Moreno, C., International Sheep
Genomics Consortium, SanCristobal, M. & Boitard, S., 2014. Selection signatures in
worldwide sheep populations. PLoS ONE 9, e103813
Foll, M. & Gaggiotti, O., 2008. A genome-scan method to identify selected loci appropriate for
both dominant and codominant markers: A Bayesian perspective. Genet. 180, 977-993.
Garcia-Garcia, M.J. Eggenscwiler, J.T., Caspary, T., Alcorn H.L., Wyler, M.R., Huangfu, D.,
Rakeman, A.S., Lee, J.D. Feinberg, E.H., Timmer J.R. & Anderson K.V., 2005.
Analysis of mouse embryonic patterning and morphogenesis by forward genetics. Proc
Natl Acad Sci USA 102, 5913-5919.
Kijas, J.W., Townley, D., Dalrymple, B.P., Heaton, M.P., Maddox, J.F., McGrath, A., Wilson,
P., Ingersoll, R.G., McCulloch, R., McWilliam, S., Tang, D., McEwan, J., Cockett, N.,
Oddy, V.H., Nicholas, F.W. & Raadsma, H., 2009. A Genome wide survey of SNP
variation reveals the genetic structure of sheep breeds. PLoS ONE 4, e4668, doi:
10.1371/journal.pone.0004668
Kijas, J.W., Lenstra, J.A., Hayes, B., Boitard, S., Porto Neto, L.R, San Cristobal, M., Servin,
B., McCulloch, R., Whan, V., Gietzen, K., Paiva, S., Barendse, W., Ciani, E., Raadsma,
H., McEwan, J., Dalrymple, B. & the International Sheep Genomics Consortium
Members., 2012. Genome-wide analysis of the world’s sheep breeds reveals high levels
of historic mixture and strong recent selection. PLoS Biol 10, e1001258.
Kim, E-S., Elbeltagy, A.R., Aboul-Naga, A.M., Rischkowsky, B., Sayre, B., Mwacharo, J.M.
& Rothschild, M.F., 2016. Multiple genomic signatures of selection in goats and sheep
indigenous to a hot arid environment. Heredity, 1-10.
Ma, Y.,Wei, J., Zhang, Q., Chen, L., Wang, J., Liu, J. & Ding, X., 2015. A genome scan for
selection signatures in pigs. PLoS ONE 10, e0116850.
Stellenbosch University https://scholar.sun.ac.za
149
Makina, S.O., Muchadeyi, F.C., Van Marle-Köster, E., Taylor, J.F., Makgahlela, M.L. &
Maiwashe A. 2015. Genome-wide scan for selection signatures in six cattle breeds in
South Africa. Genet. Sel. Evol. 47, 92-106.
McLaren, R., Rogers, G.R., Davies, K.P., Maddox, J.F. & Montgomery G.W., 1997. Linkage
mapping of wool keratin and keratin-associated protein genes in sheep. Mamm.
Genome 8, 938-940.
Milne, C., 2000. The History of the Dorper. Small Rumin. Res. 36, 99-102.
Moyo, S. & Swanepoel, F.J.C., 2010. Multifunctionality of livestock in developing
communities. In: The role of livestock in developing communities: enhancing
multifunctionality. Eds. Swanepoel, F.J.C., Stroebel, A., Moyo, S. publ. UFS & CTA.
pp. 1-12.
Neser, F.W.C., Erasmus, G.J. & Van Wyk, J.B. 2000. Genetic studies on the South African
Mutton Merino: growth traits. S. Afr. J. Anim. Sci. 30, 172-177.
Parrott, J.A. & Skinner, M.K. 1998.Thecal cell-granulosa cell interactions involve a positive
feedback loop among keratinocyte growth factor, hepatocyte growth factor, and Kit
ligand during ovarian follicular development. Endocrinology [Pubmed]
Purcell, S., Neale, B., Todd-Brown, K., Thomas, L., Ferreira, M.A.R., Bender, D., Maller, J.,
Sklar, P., De Bakker, P.I.W., Daly, M.J. & Sham, P.C., 2007. PLINK: a toolset for
whole-genome association and population-based linkage analysis. Am. J. Hum. Genet.
81, 559-575.
Raj, A., Stephens, M. & Pritchard, J.K., 2014. fastSTRUCTURE: Variational inference of
population structure in large SNP data sets. Genetics. 197, 573-589.
Stellenbosch University https://scholar.sun.ac.za
150
Ramey H.R., Decker J.E., McKay S.D., Rolf M.M., Schnabel R.D. & Taylor J.F., 2013
Detection of selective sweeps in cattle using genome-wide SNP data. BMC Genomics.
14, 382-10.1186/1471-2164-14-382.
Rezaie, H., Marc, D., Choiset Y., Takahashi, M., Hoa, G.H.B., Haertle T., Grosclaude J. &
Debey, P., 2000. High yield purification and physio-chemical properties of full-length
recombinant allelic variants of sheep prion protein linked to scrapie susceptibility. Eur.
J. Biochem 267, 2833-2839.
Ross-Ibarra, J., Morrel, P.L. & Gaut, B.S., 2007. Plant domestication, a unique opportunity to
identify the genetic basis of adaptation. PNAS 104, 8641-8648
Sandenbergh, L., 2015. Identification of SNPs associated with robustness and greater
reproductive success in South African Merino using SNP chip technology. PhD thesis.
University of Stellenbosch.
Seitz, J.J., Schmutz, S.M., Thue, T.D., Buchanan, F.C. & Mamm. 1999. A missense mutation
in the bovine MGF gene is associated with the roan phenotype in Belgian Blue and
Shorthorn cattle. Genome
Soma, P., Kotze, A., Grobler, J.P. & Van Wyk, J.B., 2012. South African sheep breeds:
Population genetic structure and conservation implications. Small Rumin. Res.103,
112–119.
Stellenbosch University https://scholar.sun.ac.za
151
Chapter 8
Conclusions and recommendations
8.1 Conclusions
The aim of the study was to investigate the productivity of smallholder sheep farming in the
Western Cape, South Africa, using an interdisciplinary approach. This included integrating
genomics and socio-economic aspects. Knowledge on socio-economic factors influencing
average number of lambs and offtake rate was obtained from the survey. The part of the study
based on genomic analyses yielded knowledge on genetic diversity and the population structure
of smallholder animal genetic resources, as well as selection signatures related to physiological
pathways putatively linked to robustness traits.
The need for this study stems from integral role that sheep plays in the livelihood of smallholder
farmers in South Africa. A number of constraints are impeding sustainable sheep production,
including socio-economic factors (wealth status, gender, age, education) and environmental
factors (land availability, water resources, nutrition, and livestock biodiversity). A farming
system needs to be resilient in terms of its ability to adapt to environmental changes to ensure
long term sustainability.
Sheep breeding practices of smallholder farmers were elucidated. The overwhelming
popularity of Dorper sheep over Merino, Damara and Meatmaster breeds was confirmed.
Smallholder farmers also indicated that they select for traits such as heat tolerance, size and
temperament.
Socio-economic factors such as age of the farmer, farm type, wealth status, tribe and gender or
LRAD/CASP participation did not significantly influence offtake. The offtake of smallholder
sheep farmers was lower compared to offtake figures for commercial sheep farmers as reported
Stellenbosch University https://scholar.sun.ac.za
152
in the literature. Sale outlets and sources of income which is descriptive of the type of farming
system were influenced by the district. Factors that influenced sale outlets were the age of the
farmer and whether or not the farmers own land. Therefore farming systems are not different
according district. The districts are therefore representative of different farming systems..
Those in the West Coast and Eden area were more subsistence farming, whereas the farmers
in the Karoo were more commercially orientated and achieved a higher average numbers of
lambs sold. Overall the smallholder sheep farmers were found not to be economically viable
due to low income derived from average number of lambs sold, even though their offtake levels
were similar with commercial farmers. The reasons for their income being low could be
because of the number of lambs sold per annum being lower than commercial farmers in
general. The large variation in offtake rate observed within the farming systems could be
explained by certain farmers that recently joined a land reform project and that were
accumulating breeding ewes to build their breeding flock and thus obtaining low offtake rates
and farmers that are selling lambs during December holiday for cash income. There is,
however, scope to increase economic viability of farming systems if the average number of
lambs sold is increased. This can be achieved by ensuring that suitable breeding and
management plans with breeding objectives suitable for the farming system are implemented.
However, other socio-economic issues should also be addressed such as age, gender and land
ownership, as these factors are known to influence decision-making to farm with small
ruminants.
The study also focused on the animal genetic resources of smallholder sheep farmers to
determine whether their gene pool was diverse and adapted/robust to their environment. The
survey indicated that smallholder sheep farmers in the Western Cape mostly farm with Dorpers.
These Dorpers are admixed and not purebred. This was confirmed by the FastStructure analysis
in Chapter 5 that indicated admixture of the Dorper breeds used in smallholder sheep farming
Stellenbosch University https://scholar.sun.ac.za
153
systems. The Dorpers used by smallholder farmers were admixed with Merino type breeds and
indigenous fat-tailed like the Namaqua Afrikaner. Some of the sheep indicated as White
Dorpers by smallholder sheep farmers were confirmed through the FastStructure analysis. The
Dorper sheep from smallholder sheep farmers also had a lower inbreeding coefficient than the
Dorpers sourced from the research farm as well as the two other pure breeds (Namaqua
Afrikaner and South African Mutton Merino) used in this study as a base population. Thus
from these results, smallholder sheep genetic resources can be classified as being
environmentally viable, as there is sufficient genetic diversity within their ovine resources. This
high genetic diversity, however, needs to be maintained and managed to the benefit of the
farmers to increase smallstock production performance. The genetic diversity may be explained
by migration, as smallholder farmers constantly bring new genes into their population to
improve their flocks.
The study also investigated whether there has been selected for traits related to robustness and
reproduction in smallholder sheep populations. This was important to determine in terms of
evaluating the ability of animals to adapt to changing environments. This was done using
GWAS (GEMMA) and selection signatures (HAPFLK and BayeScan) to identify causal
variants associated with adaptability. The GWAS did not yield significant results. It needs to
be conceded that small sample size in the study was small. The nature of the trait that was
defined (wet-dry) was also unlikely to support uncomplicated inheritance depending on a
relatively small number of quantitative trait loci (QTL) despite a moderate heritability based
on SNP-data. The infinitesimal model is much more likely, where many QTL (each of small
effect) contribute to the phenotypic expression of the wet-dry phenotype (Hill, 2010). From the
HAPFLK and Bayescan in chapter 7, signals of selection were detected for genes related to
reproduction, pigmentation, polledness and heat tolerance. The low inbreeding and the fact that
the sheep from smallholders have putatively been selected for robustness traits makes it
Stellenbosch University https://scholar.sun.ac.za
154
possible for future genetic gain in this population. Genetic gain can lead to improved offtake
and will influence the economic sustainability of the farmers. Selection signatures linked to
fitness and robustness are also of value to add to current literature important for future studies
involving adaptation of sheep to changes in ambient temperature.
The survey results provided information on the breeds farmed and selection objectives of
farmers. This was integrated with the genomic studies because the genetic diversity and
population study confirmed the assumed breeds utilised by smallholder farmers and high
diversity; whereas the selection signature study confirmed the selection objectives of
smallholder sheep farmers such as selection for heat tolerance of sheep. The wet-dry phenotype
measurement and GWAS can be integrated with the average number of lambs sold and offtake
rate obtained from the survey. Rangeland condition scores for both communal and small-scale
farmers were low and could explain low offtake rate in both farming systems. Improvement in
rangeland condition could lead to improvement of sheep productivity.
8.2 Recommendations
The different constraints as mentioned by communal and small-scale farmers should first be
addressed to ensure that farmers have access to land, grazing, water and infrastructure. These
are the basics of a farming operation even before the issue of genetic resources can be
addressed. Genomics, however, provide many options and opportunities in terms of
information on genetic structure, relationships between individual animals and genomic
selection. The stage at which genomics should be included into a breeding plan will differ
between farmers. Farmers that have already progressed in overcoming major constraints can
utilise genomics for further improvement in terms of decreasing generation interval, identifying
pedigree and for instance enhancing traits of importance for their farming system. Literature
Stellenbosch University https://scholar.sun.ac.za
155
has indicated many genetic improvement programs which have failed due to a lack of attention
to the social aspects.
There are many more aspects to consider in terms of social/political, economic and
environmental indicators but this will need the collaboration of more stakeholders. For future
studies it would also important to take a more participatory approach and involve more
stakeholders to determine the necessary indicators to address before attempting introducing
any new technology.
The study showcases the use of genomics to evaluate breed diversity as an indicator of
environmental sustainability. Only 307 sheep were genotyped in this study using a 50K SNP
chip. Due to the levels of LD a denser chip would be recommended for future studies like the
600K SNP bead chip or even the use of whole genome sequencing using more sheep. Attempts
should be made to obtain reliable phenotypes of traits related to robustness and not only one
trait. Farmers should include traits in their breeding objectives applicable to their sheep farming
system to enable genetic improvement. Use of selection indices in smallholder sheep
production has been demonstrated elsewhere.
Recording of phenotypes to include in selection indices and genomic selection is of importance
for genetic improvement. This is one of the major challenges for smallholder and even
commercial sheep farmers in South Africa due to the extensive nature of sheep farming
systems. The availability of the national small stock improvement scheme (NSIS) makes it
possible for registered stud farmers and commercial sheep farmers to participate in genetic
improvement program. Recordkeeping can be done using applications developed for
smartphones. Similar recordkeeping systems have been developed using ICT technologies in
Kenya (Irungu et al., 2015). Blood samples can also be collected from each individual sheep
with phenotypic information recorded in the database and this can aid in the development of a
suitable reference population for smallholder farmers for genomic selection of the traits
Stellenbosch University https://scholar.sun.ac.za
156
important for their specific farming system. The feasibility of such programs is likely to
increase as genotyping costs per individual decline.
Depending on resources available to smallholder farmers the following easy to measure
phenotypes can be recorded:
1. Body condition score on a scale from 1 to 5, where 1 is extremely emaciated and 5 is
obese. This can be recorded before the mating season to ensure that ewes have a body
condition score of 3. This will increase the chances of successful conception and hence
influence the number of lambs born per ewe joined.
2. Wet and dry phenotype can be recorded during the lambing season; ewes can be
classified as dry or lactating. Ewes that are dry in two years consecutively should be
culled from the breeding flock. Selection can be made on offspring of ewes who are
proven to produce lambs every year.
3. The number of lambs born per ewe can be measured by the end of lambing season when
ewes are kraaled together to be counted by farmers.
4. FAMACHA can also be recorded as an indication of Haemonchus contortus spp. in
summer rainfall areas. This trait is important as it allows for the selection of sheep that
are resistant to gastro-intestinal parasites. Faecal worm egg counts can also be recorded
to select for resistance to gastro-intestinal parasites. This can be done with the help of
state veterinarians.
In situations where smallholder farmers have scales or weigh bands available farmers can also
record live weights, such as weaning weight and body weight of ewes before mating. Linear
measurements that are correlated with body weight can also be used.
Stellenbosch University https://scholar.sun.ac.za
157
The successful recording of phenotypes can be achieved by the collaboration of farmers,
government, research institutions, higher education and private companies to act as funding
bodies for sustainability projects.
Carrying capacity also varied between farming systems with communal farmers from Eden and
West Coast overgrazing their land. Increasing the number of LSU could lead to an increase in
offtake rate and improved economic sustainability. Farmers should, however, take care to
prevent overgrazing of their land to ensure sustainable usage. Land is a limited resource and
options should be considered for the optimal use of land already available to farmers. Options
should thus be provided to smallholder farmers on how to increase their LSU to the
recommended carrying capacity from the Western Cape Department of Agriculture. Good
grazing and rangeland management techniques to ensure sustainable use of land resources
should also be adhered to.
8.3. Research Outputs
8.3.1. Peer-reviewed publications
Molotsi, A.H., Taylor, J.F., Cloete, S.W.P., Decker, J.E., Muchadeyi, F., Sandenbergh, L. &
Dzama, K. 2017. Preliminary genome-wide association study for wet-dry phenotype in
smallholder ovine populations in South Africa. S. Afr. J. Anim. Sci. 47, 327-331.
Molotsi, A.H., Dube, B., Oosting, S., Marandure, T., Mapiye, C., Cloete, S.W.P. & Dzama, K.
Genetic traits of relevance to sustainability of smallholder sheep farming systems in South
Africa. Sustainability, 9, 1225. DOI:10.3390/su9081225
Molotsi, A.H., Taylor, J.F., Cloete, S.W.P., Muchadeyi, F., Decker, J.E., Whitacre, L.K.,
Sandenbergh, L., & Dzama, K. Genetic diversity and population structure of South African
Stellenbosch University https://scholar.sun.ac.za
158
smallholder farmer sheep breeds determined using the OvineSNP50 beadchip. Trop. Anim.
Health Prod. 49, 1771-1777. DOI: 10.1007/s11250-017-1392-7.
8.3.2. Conference outputs
Davids, A.H. & Dzama, K. 2013. Linking small-scale livestock farming to food security in
South Africa from an animal breeding perspective. Poster at 1st Food security conference 2013
Molotsi, A.H., Taylor, J.F., Cloete, S.W.P., Whitacre, L., Dzama, K. & Zvinorova, I. 2016.
Genetic structure of smallholder sheep in the Western Cape, South Africa. Presented at the 49th
Congress for South African Society of Animal Sciences, 3-6 July 2016, Stellenbosch, South
Africa
Molotsi, A.H., Oosting, S.J., Cloete, S.W.P. & Dzama, K. 2017. Offtake and genetic diversity
as indicators of sustainability for smallholder sheep farming systems in the Western Cape,
South Africa. Presented at the 6th Forum on Sustainability, 28-29 January 2017, Cape Town,
South Africa.
8.4 References
Hill, G., 2010. Understanding and using quantitative genetic variation. Phil. Trans. R. Soc. 365,
73-85.
Irungu, K. R. G., Mbugua, D. & Muia, J., 2015. Information and Communication Technologies
( ICTs ) Attract Youth into Profitable Agriculture in Kenya. East Afr. Agric. Forest. J.
81, 24–33.
Stellenbosch University https://scholar.sun.ac.za
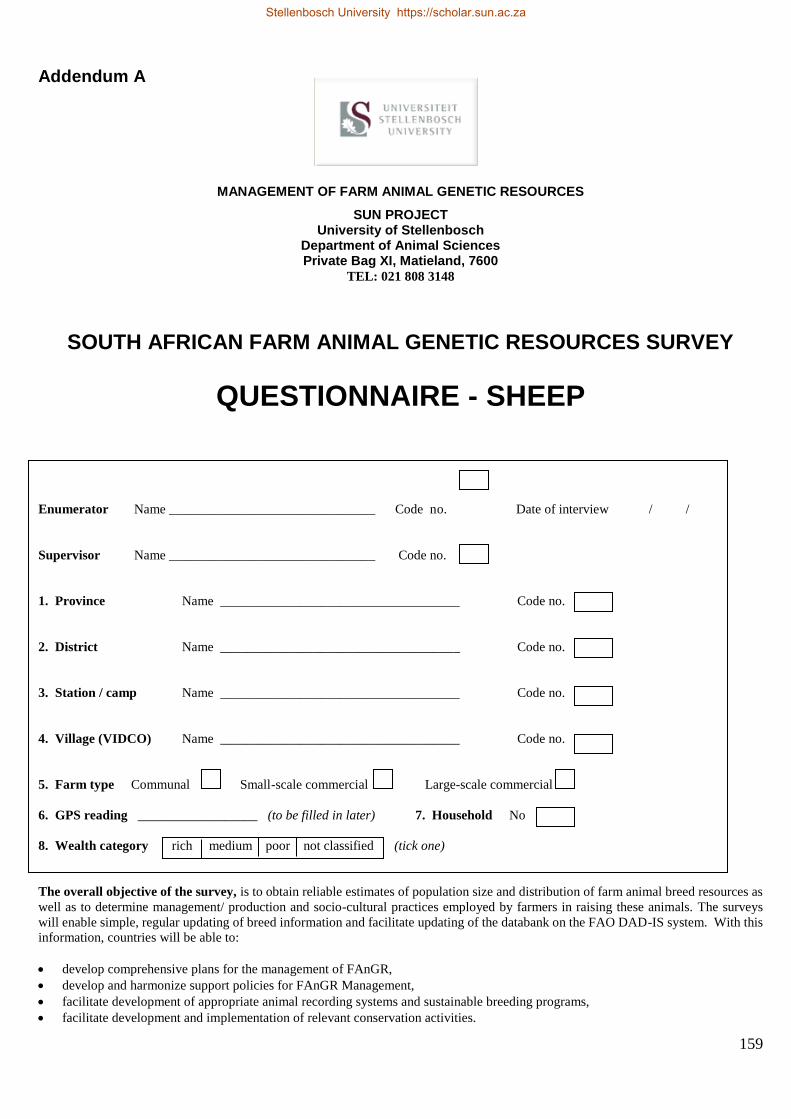
159
Addendum A
MANAGEMENT OF FARM ANIMAL GENETIC RESOURCES
SUN PROJECT University of Stellenbosch
Department of Animal Sciences Private Bag XI, Matieland, 7600
TEL: 021 808 3148
SOUTH AFRICAN FARM ANIMAL GENETIC RESOURCES SURVEY
QUESTIONNAIRE - SHEEP
Enumerator Name _______________________________ Code no. Date of interview / /
Supervisor Name _______________________________ Code no.
1. Province Name ____________________________________ Code no.
2. District Name ____________________________________ Code no.
3. Station / camp Name ____________________________________ Code no.
4. Village (VIDCO) Name ____________________________________ Code no.
5. Farm type Communal Small-scale commercial Large-scale commercial
6. GPS reading __________________ (to be filled in later) 7. Household No
8. Wealth category rich medium poor not classified (tick one)
The overall objective of the survey, is to obtain reliable estimates of population size and distribution of farm animal breed resources as
well as to determine management/ production and socio-cultural practices employed by farmers in raising these animals. The surveys
will enable simple, regular updating of breed information and facilitate updating of the databank on the FAO DAD-IS system. With this
information, countries will be able to:
develop comprehensive plans for the management of FAnGR,
develop and harmonize support policies for FAnGR Management,
facilitate development of appropriate animal recording systems and sustainable breeding programs,
facilitate development and implementation of relevant conservation activities.
Stellenbosch University https://scholar.sun.ac.za
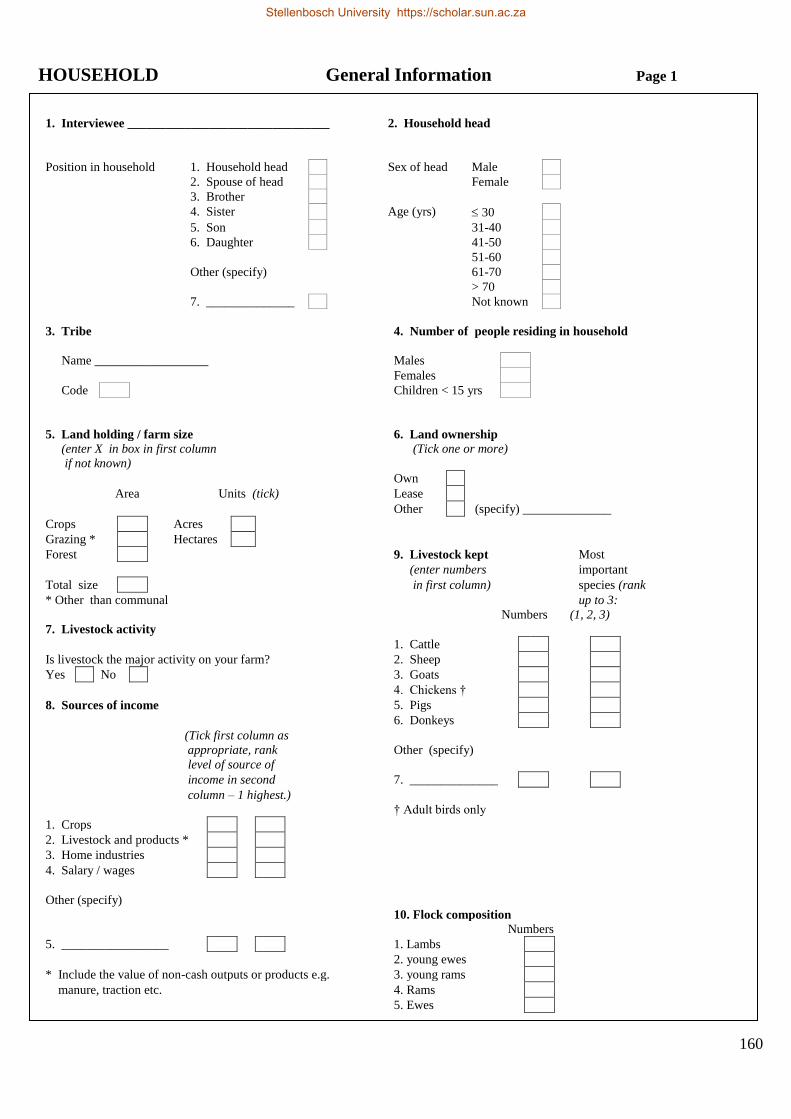
160
HOUSEHOLD General Information Page 1
1. Interviewee ________________________________ 2. Household head
Position in household 1. Household head Sex of head Male
2. Spouse of head Female
3. Brother
4. Sister Age (yrs) 30
5. Son 31-40
6. Daughter 41-50
51-60
Other (specify) 61-70
> 70
7. ______________ Not known
3. Tribe 4. Number of people residing in household
Name __________________ Males
Females
Code Children < 15 yrs
5. Land holding / farm size 6. Land ownership
(enter X in box in first column (Tick one or more)
if not known)
Own
Area Units (tick) Lease
Other (specify) ______________
Crops Acres
Grazing * Hectares
Forest 9. Livestock kept Most
(enter numbers important
Total size in first column) species (rank
* Other than communal up to 3:
Numbers (1, 2, 3)
7. Livestock activity species (rank
1. Cattle
Is livestock the major activity on your farm? 2. Sheep
Yes No 3. Goats
4. Chickens †
8. Sources of income 5. Pigs
6. Donkeys
(Tick first column as
appropriate, rank Other (specify)
level of source of
income in second 7. ______________
column – 1 highest.)
† Adult birds only
1. Crops
2. Livestock and products *
3. Home industries
4. Salary / wages
Other (specify)
10. Flock composition
Numbers
5. _________________ 1. Lambs
2. young ewes
* Include the value of non-cash outputs or products e.g. 3. young rams
manure, traction etc. 4. Rams
5. Ewes
Stellenbosch University https://scholar.sun.ac.za
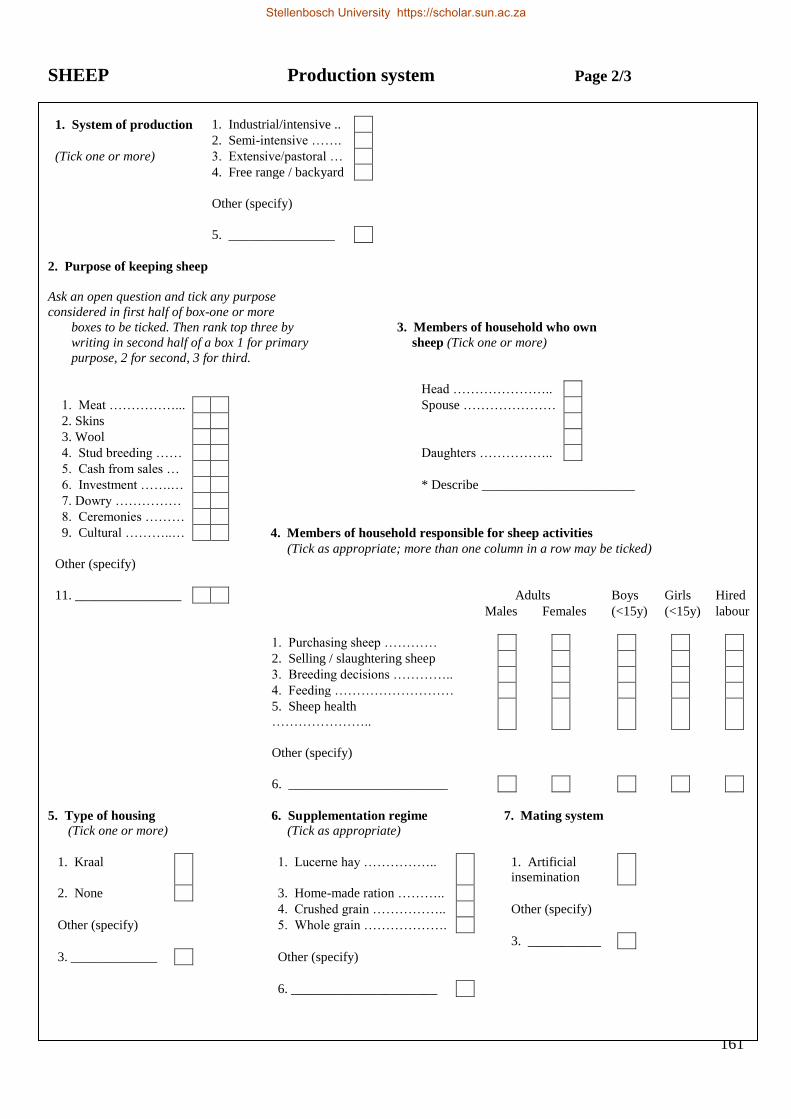
161
SHEEP Production system Page 2/3
1. System of production 1. Industrial/intensive ..
2. Semi-intensive …….
(Tick one or more) 3. Extensive/pastoral …
4. Free range / backyard
Other (specify)
5. ________________
2. Purpose of keeping sheep
Ask an open question and tick any purpose
considered in first half of box-one or more
boxes to be ticked. Then rank top three by 3. Members of household who own
writing in second half of a box 1 for primary sheep (Tick one or more)
purpose, 2 for second, 3 for third.
Head …………………..
1. Meat ……………... Spouse …………………
2. Skins
3. Wool
4. Stud breeding …… Daughters ……………..
5. Cash from sales …
6. Investment …….… * Describe _______________________
7. Dowry ……………
8. Ceremonies ………
9. Cultural ………..… 4. Members of household responsible for sheep activities
(Tick as appropriate; more than one column in a row may be ticked)
Other (specify)
11. ________________ Adults Boys Girls Hired
Males Females (<15y) (<15y) labour
1. Purchasing sheep …………
2. Selling / slaughtering sheep
3. Breeding decisions …………..
4. Feeding ………………………
5. Sheep health
…………………..
Other (specify)
6. ________________________
5. Type of housing 6. Supplementation regime 7. Mating system
(Tick one or more) (Tick as appropriate)
1. Kraal 1. Lucerne hay …………….. 1. Artificial
insemination
2. None 3. Home-made ration ………..
4. Crushed grain …………….. Other (specify)
Other (specify) 5. Whole grain ……………….
3. ___________
3. _____________ Other (specify)
6. ______________________
Stellenbosch University https://scholar.sun.ac.za
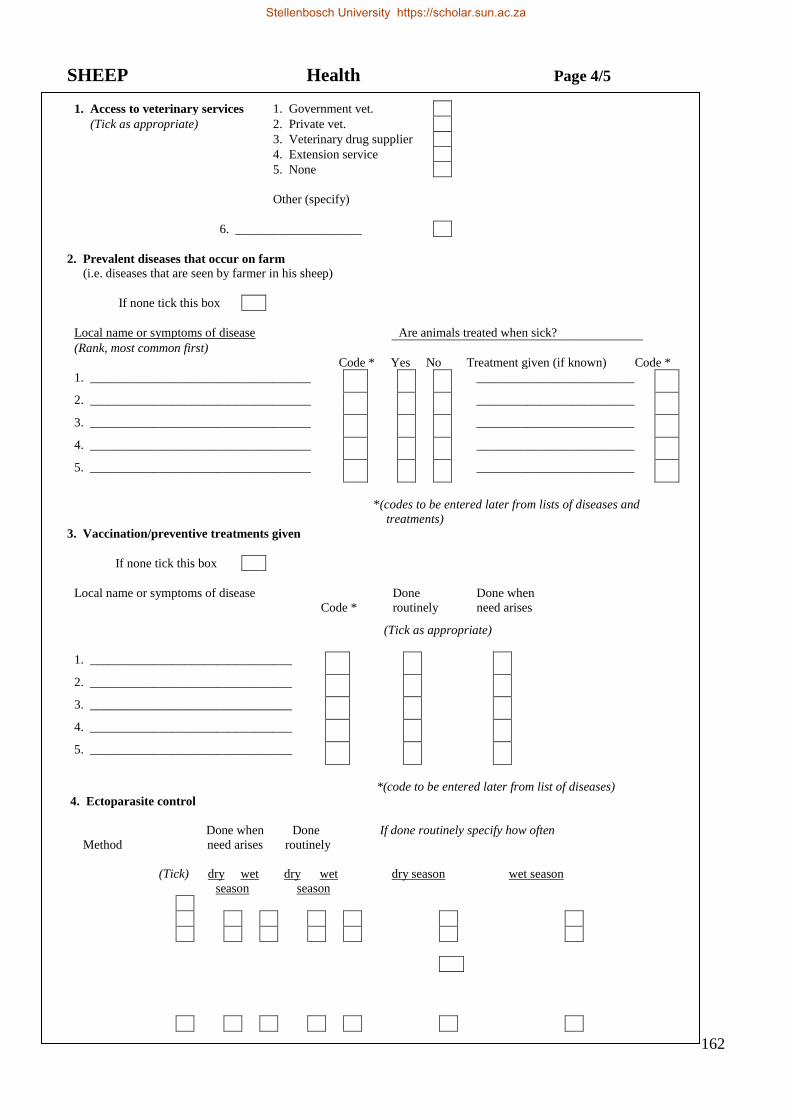
162
SHEEP Health Page 4/5
1. Access to veterinary services 1. Government vet.
(Tick as appropriate) 2. Private vet.
3. Veterinary drug supplier
4. Extension service
5. None
Other (specify)
6. ____________________
2. Prevalent diseases that occur on farm
(i.e. diseases that are seen by farmer in his sheep)
If none tick this box
Local name or symptoms of disease Are animals treated when sick?
(Rank, most common first)
Code * Yes No Treatment given (if known) Code *
1. ___________________________________ _________________________
2. ___________________________________ _________________________
3. ___________________________________ _________________________
4. ___________________________________ _________________________
5. ___________________________________ _________________________
*(codes to be entered later from lists of diseases and
treatments)
3. Vaccination/preventive treatments given
If none tick this box
Local name or symptoms of disease
Code *
Done
routinely
Done when
need arises
(Tick as appropriate)
1. ________________________________
2. ________________________________
3. ________________________________
4. ________________________________
5. ________________________________
*(code to be entered later from list of diseases)
4. Ectoparasite control
Done when Done If done routinely specify how often
Method need arises routinely
(Tick) dry wet dry wet dry season wet season
season season
Stellenbosch University https://scholar.sun.ac.za

163
SHEEP Entries/exits/culling Page 6
1. Numbers of entries within last 12 months 2. Numbers of exits within last 12 months
(Enter X in a box if not known, 0 if answer is none) (Enter X in a box if not known, 0 if answer is none)
Adults Adults
Males Females Males Females
1. Bred …………… 1. Died ………….
2. Bought ………… 2. Sold …………..
3. Donated/gift …... 3. Slaughtered …..
4. Exhanged/lent … 4. Exchanged/lent
5. Donated/gift …
6. Stolen ………...
3. Sale outlet ( if sold in last 12 months)
Were sheep sold? Yes No 4. Reasons for culling / disposal
If yes tick one 1. Sold at auction Ask as open question and tick any answers given in first
or more boxes. 2. Sold to butcher half of box, one or more boxes to be ticked. Then rank
3. Sold privately top three by writing in second half of box 1 for
4. Sold to abattoir primary reason for culling, 2 for second and 3 for third.
Other (specify) Males Females
5. ______________________ 1. Size ………………………
2. Conformation / shape ……
Selling price 3. Colour ……………………
Are you making profit? Y N 4. Temperament …………….
If not why? 5. Health ……………………
6. Body condition ………….
7. Performance ……………..
8. Old age …………………..
9. Poor fertility ……………..
Other (specify)
10. ___________________
11. ___________________
General Problems
Y N
Stock theft
If yes, how many get stolen in a year?
How much does theft costs you yearly?
Problem of predators (dogs, jackals, etc)
How much does predation costs you yearly?
Are there any other major obstacle in your enterprise?
Do you think government has done enough so far in improving the standard of farming in communal areas?
Stellenbosch University https://scholar.sun.ac.za
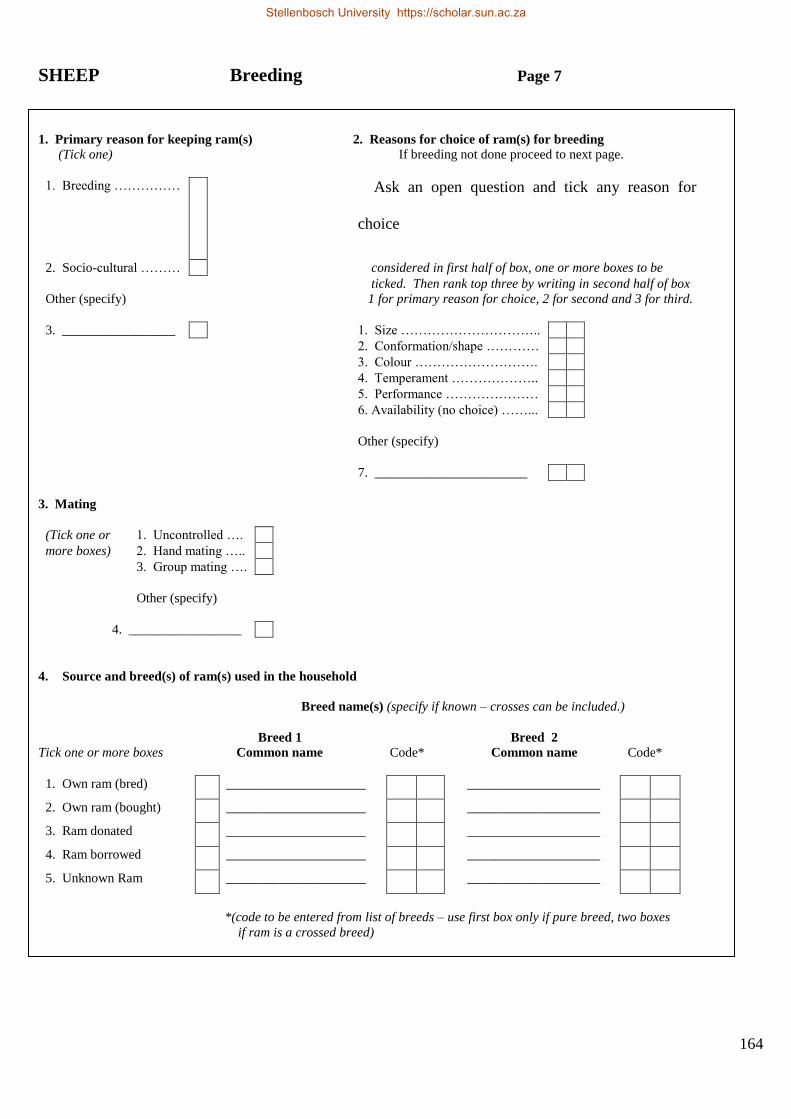
164
SHEEP Breeding Page 7
1. Primary reason for keeping ram(s) 2. Reasons for choice of ram(s) for breeding
(Tick one) If breeding not done proceed to next page.
1. Breeding …………… Ask an open question and tick any reason for
choice
2. Socio-cultural ……… considered in first half of box, one or more boxes to be
ticked. Then rank top three by writing in second half of box
Other (specify) 1 for primary reason for choice, 2 for second and 3 for third.
3. _________________ 1. Size …………………………..
2. Conformation/shape …………
3. Colour ……………………….
4. Temperament ………………..
5. Performance …………………
6. Availability (no choice) ……...
Other (specify)
7. _______________________
3. Mating
(Tick one or 1. Uncontrolled ….
more boxes) 2. Hand mating …..
3. Group mating ….
Other (specify)
4. _________________
4. Source and breed(s) of ram(s) used in the household
Breed name(s) (specify if known – crosses can be included.)
Breed 1 Breed 2
Tick one or more boxes Common name Code* Common name Code*
1. Own ram (bred) _____________________ ____________________
2. Own ram (bought) _____________________ ____________________
3. Ram donated _____________________ ____________________
4. Ram borrowed _____________________ ____________________
5. Unknown Ram _____________________ ____________________
*(code to be entered from list of breeds – use first box only if pure breed, two boxes
if ram is a crossed breed)
Stellenbosch University https://scholar.sun.ac.za
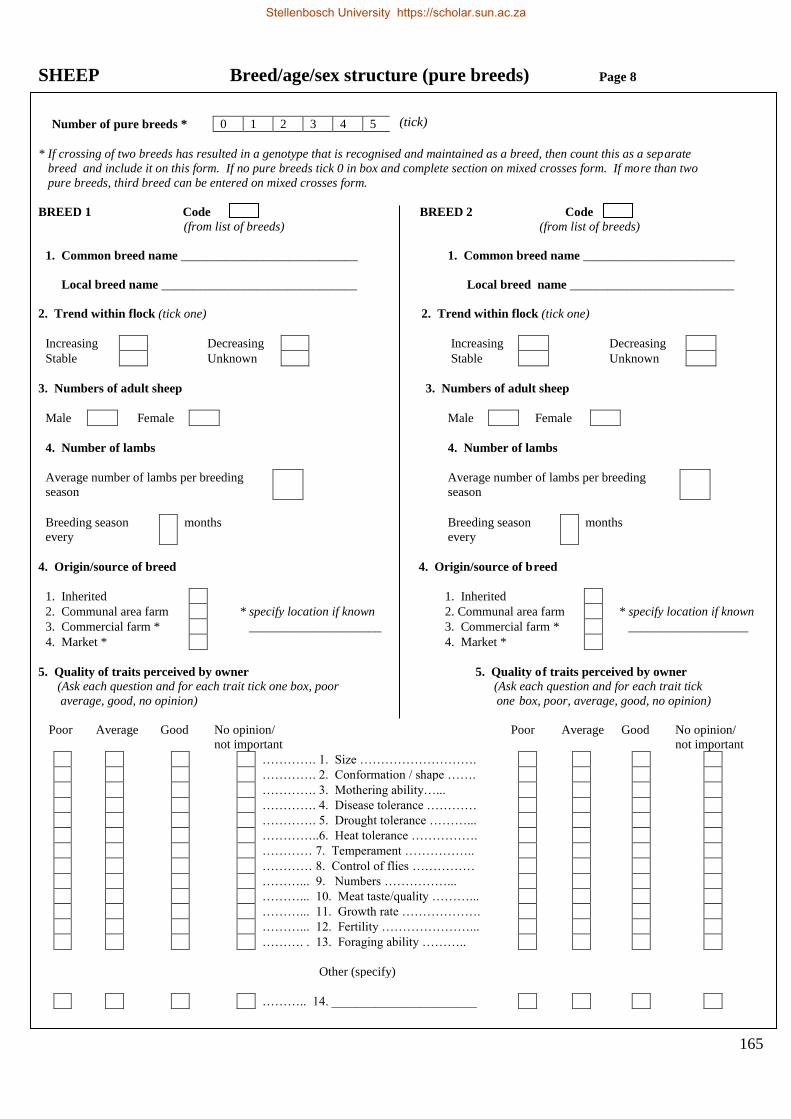
165
SHEEP Breed/age/sex structure (pure breeds) Page 8
Number of pure breeds * 0 1 2 3 4 5
* If crossing of two breeds has resulted in a genotype that is recognised and maintained as a breed, then count this as a separate
breed and include it on this form. If no pure breeds tick 0 in box and complete section on mixed crosses form. If more than two
pure breeds, third breed can be entered on mixed crosses form.
BREED 1 Code BREED 2 Code
(from list of breeds) (from list of breeds)
1. Common breed name ____________________________ 1. Common breed name ________________________
Local breed name _______________________________ Local breed name __________________________
2. Trend within flock (tick one) 2. Trend within flock (tick one)
Increasing Decreasing Increasing Decreasing
Stable Unknown Stable Unknown
3. Numbers of adult sheep 3. Numbers of adult sheep
Male Female Male Female
4. Number of lambs 4. Number of lambs
Average number of lambs per breeding
season
Average number of lambs per breeding
season
Breeding season
every
months Breeding season
every
months
4. Origin/source of breed 4. Origin/source of breed
1. Inherited 1. Inherited
2. Communal area farm * specify location if known 2. Communal area farm * specify location if known
3. Commercial farm * _____________________ 3. Commercial farm * ___________________
4. Market * 4. Market *
5. Quality of traits perceived by owner 5. Quality of traits perceived by owner
(Ask each question and for each trait tick one box, poor (Ask each question and for each trait tick
average, good, no opinion) one box, poor, average, good, no opinion)
Poor Average Good No opinion/ Poor Average Good No opinion/
not important not important
…………. 1. Size ……………………….
…………. 2. Conformation / shape …….
…………. 3. Mothering ability…...
…………. 4. Disease tolerance …………
…………. 5. Drought tolerance ………...
…………..6. Heat tolerance …………….
………… 7. Temperament ……………..
………… 8. Control of flies ……………
………... 9. Numbers ……………...
………... 10. Meat taste/quality ………...
………... 11. Growth rate ……………….
………... 12. Fertility …………………...
………. . 13. Foraging ability ………..
Other (specify)
……….. 14. _______________________
(tick)
Stellenbosch University https://scholar.sun.ac.za
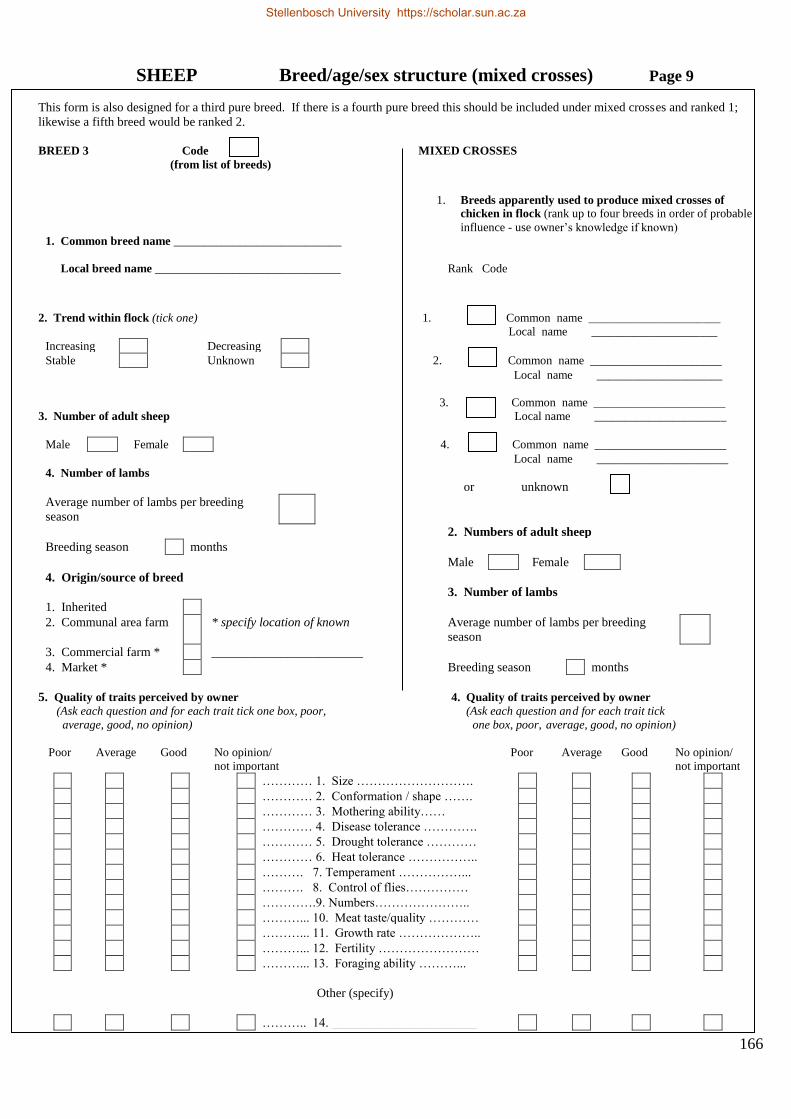
166
SHEEP Breed/age/sex structure (mixed crosses) Page 9
This form is also designed for a third pure breed. If there is a fourth pure breed this should be included under mixed crosses and ranked 1;
likewise a fifth breed would be ranked 2. BREED 3 Code MIXED CROSSES
(from list of breeds)
1. Breeds apparently used to produce mixed crosses of
chicken in flock (rank up to four breeds in order of probable
influence - use owner’s knowledge if known)
1. Common breed name ____________________________
Local breed name _______________________________ Rank Code
2. Trend within flock (tick one) 1. Common name ______________________
Local name _____________________
Increasing Decreasing
Stable Unknown 2. Common name ______________________
Local name _____________________
3. Common name ______________________
3. Number of adult sheep Local name ______________________
Male Female 4. Common name ______________________
Local name ______________________
4. Number of lambs
or unknown
Average number of lambs per breeding
season
2. Numbers of adult sheep
Breeding season months
Male Female
4. Origin/source of breed
3. Number of lambs
1. Inherited
2. Communal area farm * specify location of known Average number of lambs per breeding
season
3. Commercial farm * ________________________
4. Market * Breeding season months
5. Quality of traits perceived by owner 4. Quality of traits perceived by owner
(Ask each question and for each trait tick one box, poor, (Ask each question and for each trait tick
average, good, no opinion) one box, poor, average, good, no opinion)
Poor Average Good No opinion/ Poor Average Good No opinion/
not important not important
………… 1. Size ……………………….
………… 2. Conformation / shape …….
………… 3. Mothering ability……
………… 4. Disease tolerance ………….
………… 5. Drought tolerance …………
………… 6. Heat tolerance ……………..
………. 7. Temperament ……………...
………. 8. Control of flies……………
………….9. Numbers…………………..
………... 10. Meat taste/quality …………
………... 11. Growth rate ………………..
………... 12. Fertility ……………………
………... 13. Foraging ability ………...
Other (specify)
……….. 14. _______________________
Stellenbosch University https://scholar.sun.ac.za
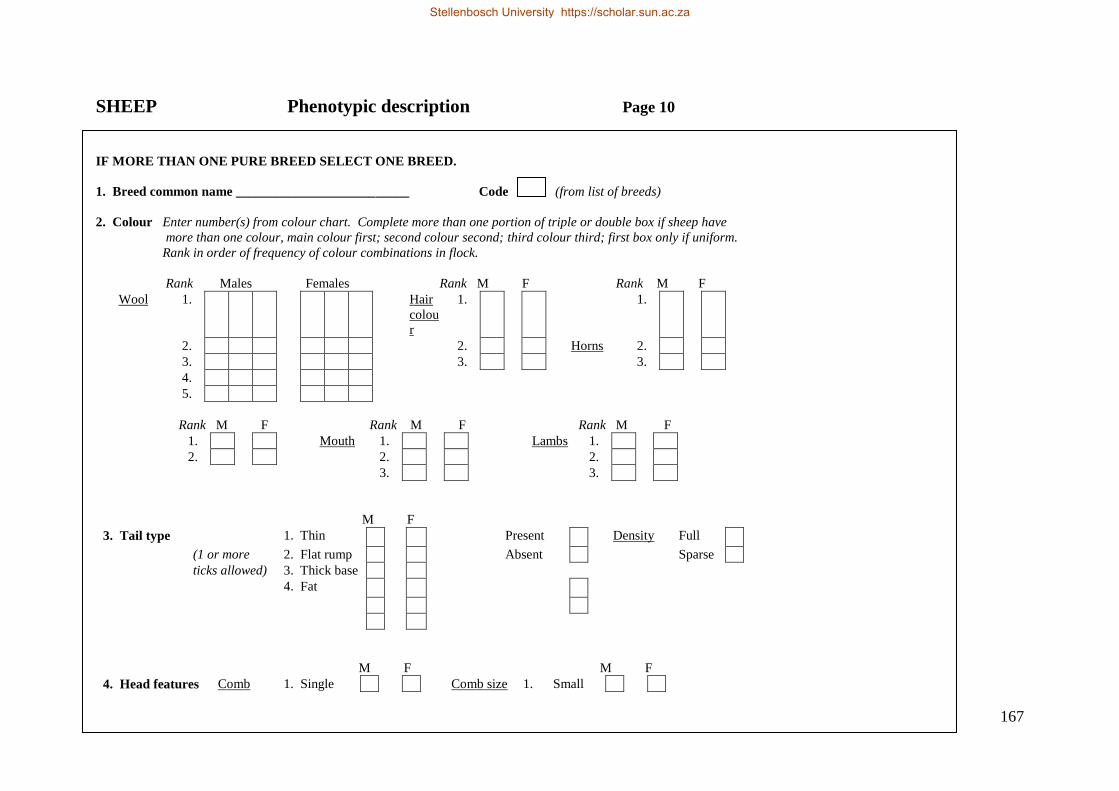
167
SHEEP Phenotypic description Page 10
IF MORE THAN ONE PURE BREED SELECT ONE BREED.
1. Breed common name __________________________ Code (from list of breeds)
2. Colour Enter number(s) from colour chart. Complete more than one portion of triple or double box if sheep have
more than one colour, main colour first; second colour second; third colour third; first box only if uniform.
Rank in order of frequency of colour combinations in flock.
Rank Males Females Rank M F Rank M F
Wool 1. Hair
colou
r
1. 1.
2. 2. Horns 2.
3. 3. 3.
4.
5.
Rank M F Rank M F Rank M F
1. Mouth 1. Lambs 1.
2. 2. 2.
3. 3.
M F
3. Tail type 1. Thin Present Density Full
(1 or more 2. Flat rump Absent Sparse
ticks allowed) 3. Thick base
4. Fat
M F M F
4. Head features Comb 1. Single Comb size 1. Small
Stellenbosch University https://scholar.sun.ac.za
Stellenbosch University https://scholar.sun.ac.za
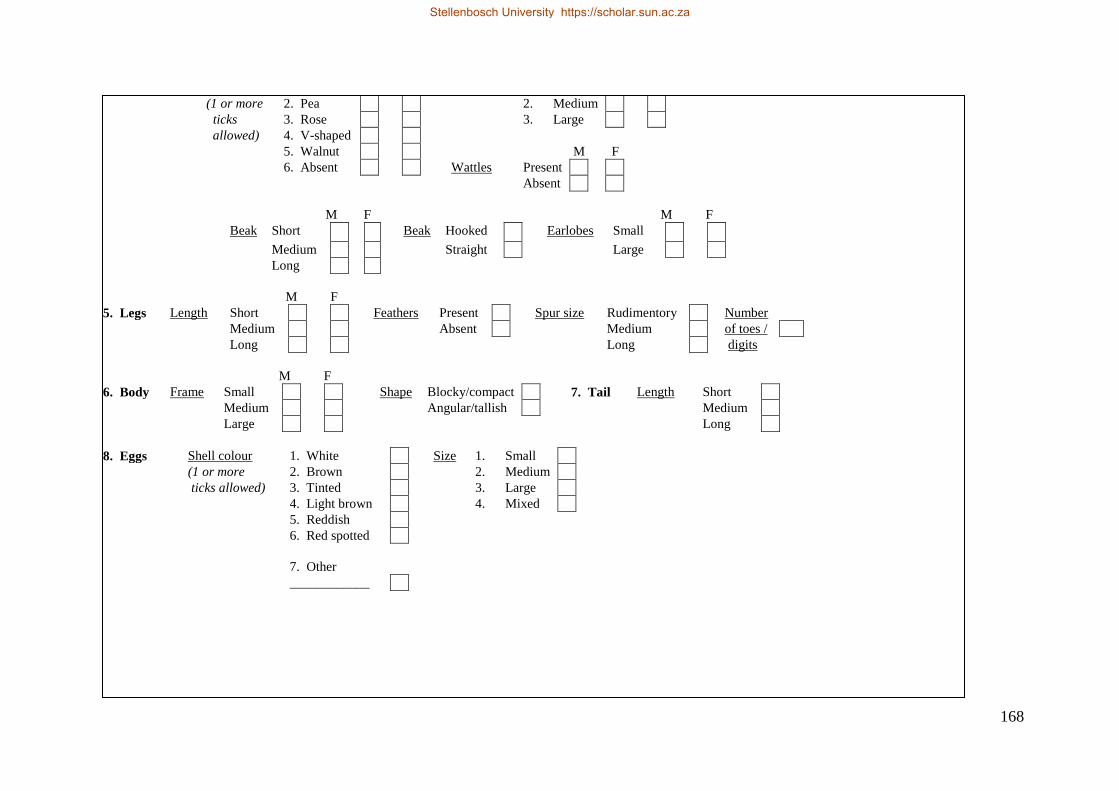
168
(1 or more 2. Pea 2. Medium
ticks 3. Rose 3. Large
allowed) 4. V-shaped
5. Walnut M F
6. Absent Wattles Present
Absent
M F M F
Beak Short Beak Hooked Earlobes Small
Medium Straight Large
Long
M F
5. Legs Length Short Feathers Present Spur size Rudimentory Number
Medium Absent Medium of toes /
Long Long digits
M F
6. Body Frame Small Shape Blocky/compact 7. Tail Length Short
Medium Angular/tallish Medium
Large Long
8. Eggs Shell colour 1. White Size 1. Small
(1 or more 2. Brown 2. Medium
ticks allowed) 3. Tinted 3. Large
4. Light brown 4. Mixed
5. Reddish
6. Red spotted
7. Other
____________
Stellenbosch University https://scholar.sun.ac.za
Stellenbosch University https://scholar.sun.ac.za
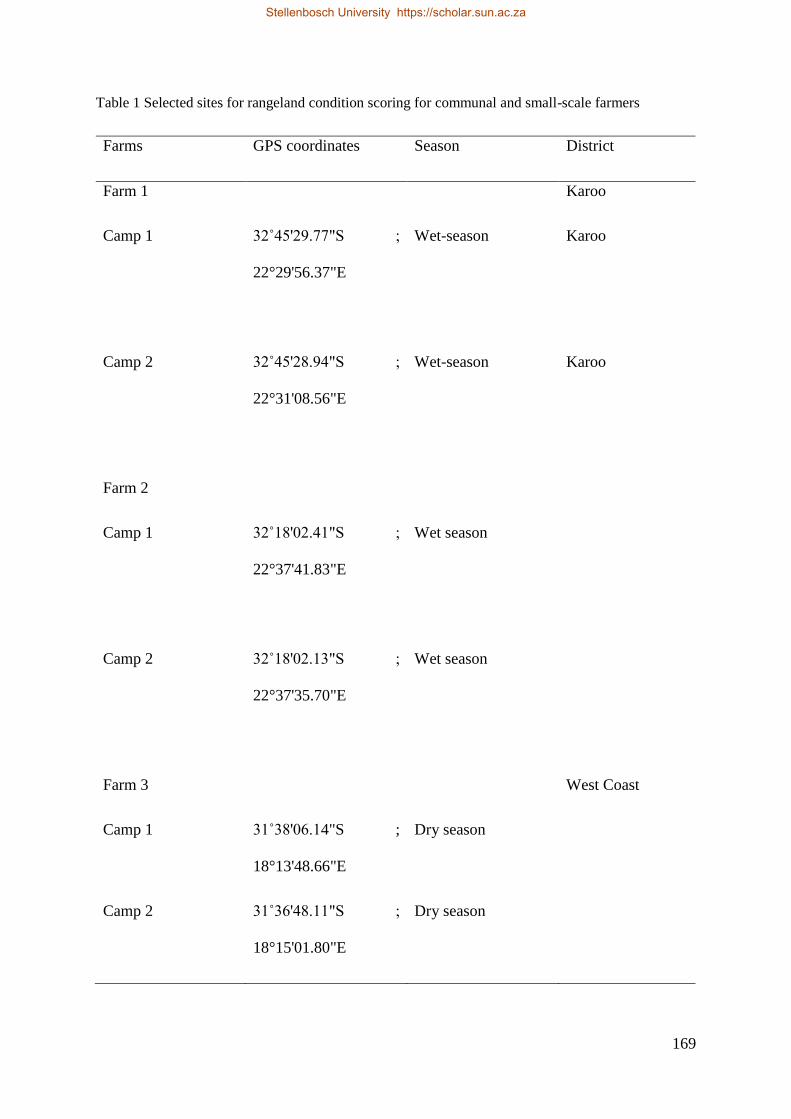
169
Table 1 Selected sites for rangeland condition scoring for communal and small-scale farmers
Farms GPS coordinates Season District
Farm 1 Karoo
Camp 1 32˚45'29.77"S ;
22°29'56.37"E
Wet-season Karoo
Camp 2 32˚45'28.94"S ;
22°31'08.56"E
Wet-season Karoo
Farm 2
Camp 1 32˚18'02.41"S ;
22°37'41.83"E
Wet season
Camp 2 32˚18'02.13"S ;
22°37'35.70"E
Wet season
Farm 3 West Coast
Camp 1 31˚38'06.14"S ;
18°13'48.66"E
Dry season
Camp 2 31˚36'48.11"S ;
18°15'01.80"E
Dry season
Stellenbosch University https://scholar.sun.ac.za
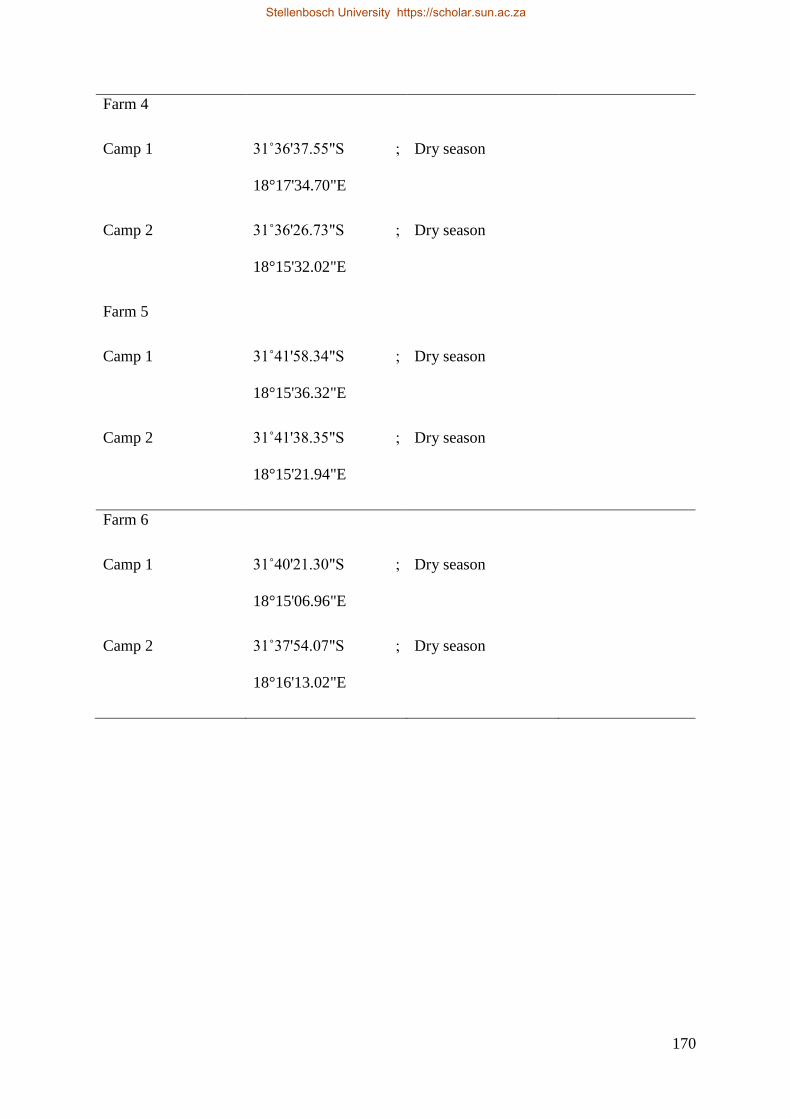
170
Farm 4
Camp 1 31˚36'37.55"S ;
18°17'34.70"E
Dry season
Camp 2 31˚36'26.73"S ;
18°15'32.02"E
Dry season
Farm 5
Camp 1 31˚41'58.34"S ;
18°15'36.32"E
Dry season
Camp 2 31˚41'38.35"S ;
18°15'21.94"E
Dry season
Farm 6
Camp 1 31˚40'21.30"S ;
18°15'06.96"E
Dry season
Camp 2 31˚37'54.07"S ;
18°16'13.02"E
Dry season
Stellenbosch University https://scholar.sun.ac.za
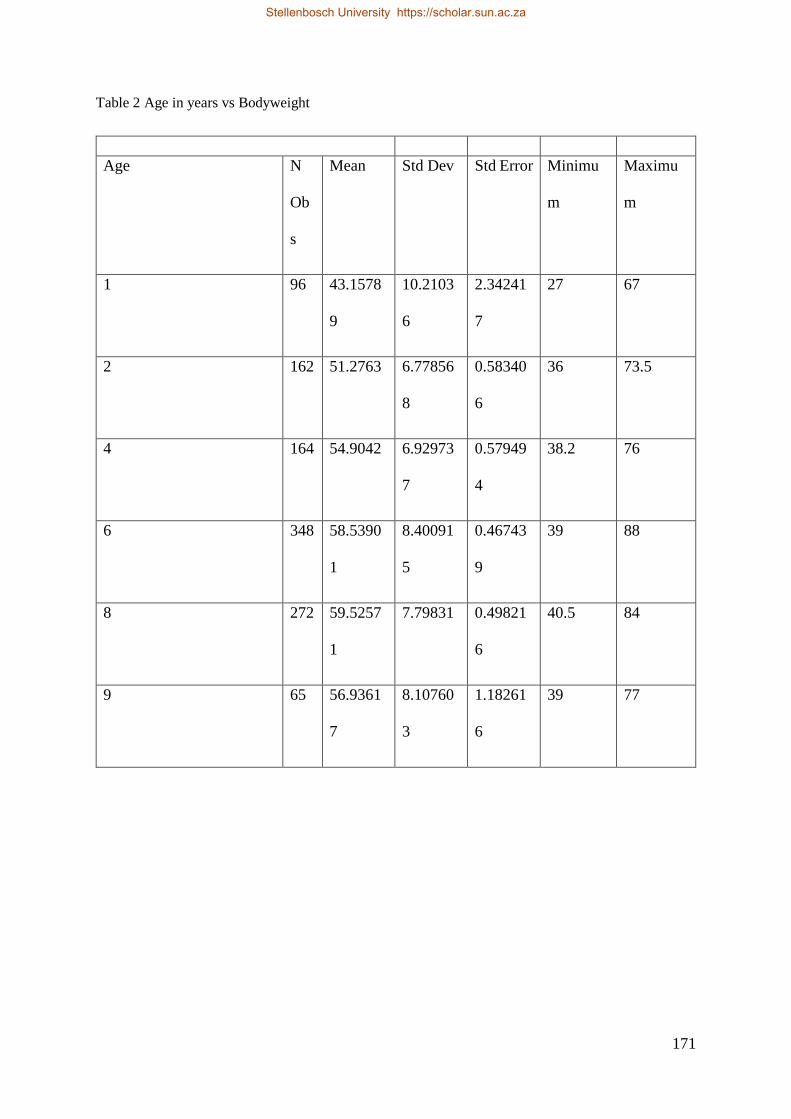
171
Table 2 Age in years vs Bodyweight
Age N
Ob
s
Mean Std Dev Std Error Minimu
m
Maximu
m
1 96 43.1578
9
10.2103
6
2.34241
7
27 67
2 162 51.2763 6.77856
8
0.58340
6
36 73.5
4 164 54.9042 6.92973
7
0.57949
4
38.2 76
6 348 58.5390
1
8.40091
5
0.46743
9
39 88
8 272 59.5257
1
7.79831 0.49821
6
40.5 84
9 65 56.9361
7
8.10760
3
1.18261
6
39 77
Stellenbosch University https://scholar.sun.ac.za
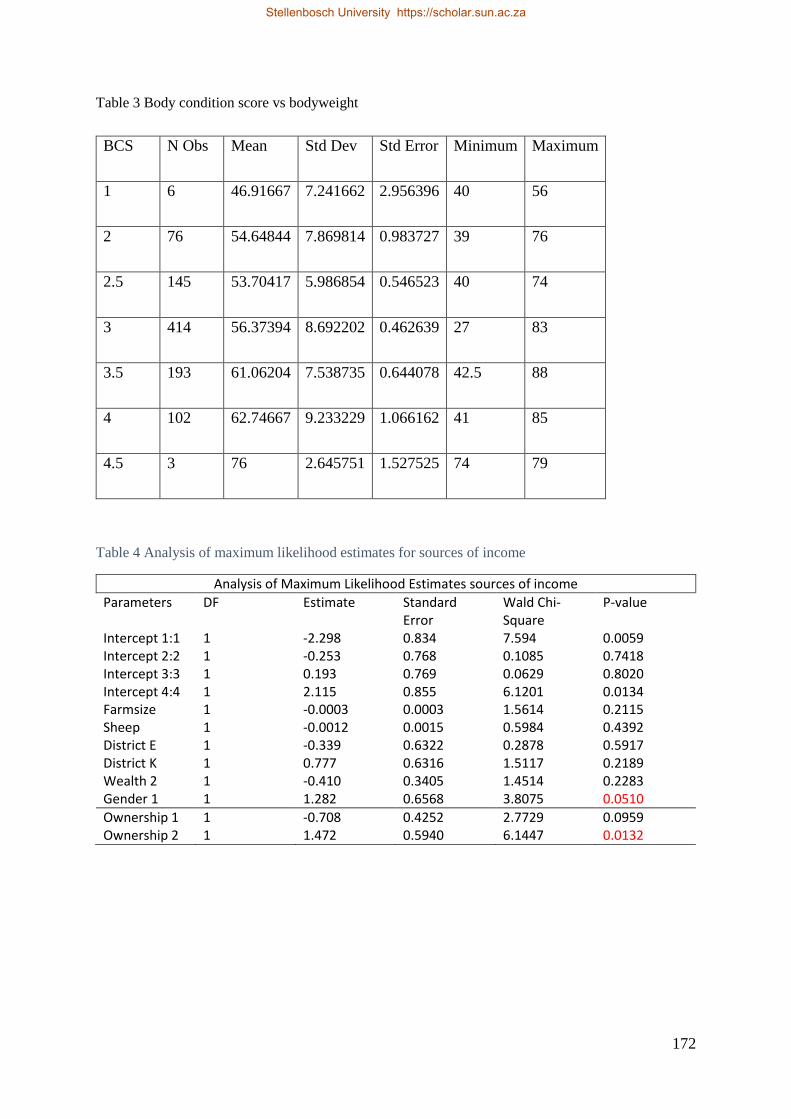
172
Table 3 Body condition score vs bodyweight
BCS N Obs Mean Std Dev Std Error Minimum Maximum
1 6 46.91667 7.241662 2.956396 40 56
2 76 54.64844 7.869814 0.983727 39 76
2.5 145 53.70417 5.986854 0.546523 40 74
3 414 56.37394 8.692202 0.462639 27 83
3.5 193 61.06204 7.538735 0.644078 42.5 88
4 102 62.74667 9.233229 1.066162 41 85
4.5 3 76 2.645751 1.527525 74 79
Table 4 Analysis of maximum likelihood estimates for sources of income
Analysis of Maximum Likelihood Estimates sources of income
Parameters DF Estimate Standard Error
Wald Chi-Square
P-value
Intercept 1:1 1 -2.298 0.834 7.594 0.0059 Intercept 2:2 1 -0.253 0.768 0.1085 0.7418 Intercept 3:3 1 0.193 0.769 0.0629 0.8020 Intercept 4:4 1 2.115 0.855 6.1201 0.0134 Farmsize 1 -0.0003 0.0003 1.5614 0.2115 Sheep 1 -0.0012 0.0015 0.5984 0.4392 District E 1 -0.339 0.6322 0.2878 0.5917 District K 1 0.777 0.6316 1.5117 0.2189 Wealth 2 1 -0.410 0.3405 1.4514 0.2283 Gender 1 1 1.282 0.6568 3.8075 0.0510
Ownership 1 1 -0.708 0.4252 2.7729 0.0959 Ownership 2 1 1.472 0.5940 6.1447 0.0132
Stellenbosch University https://scholar.sun.ac.za
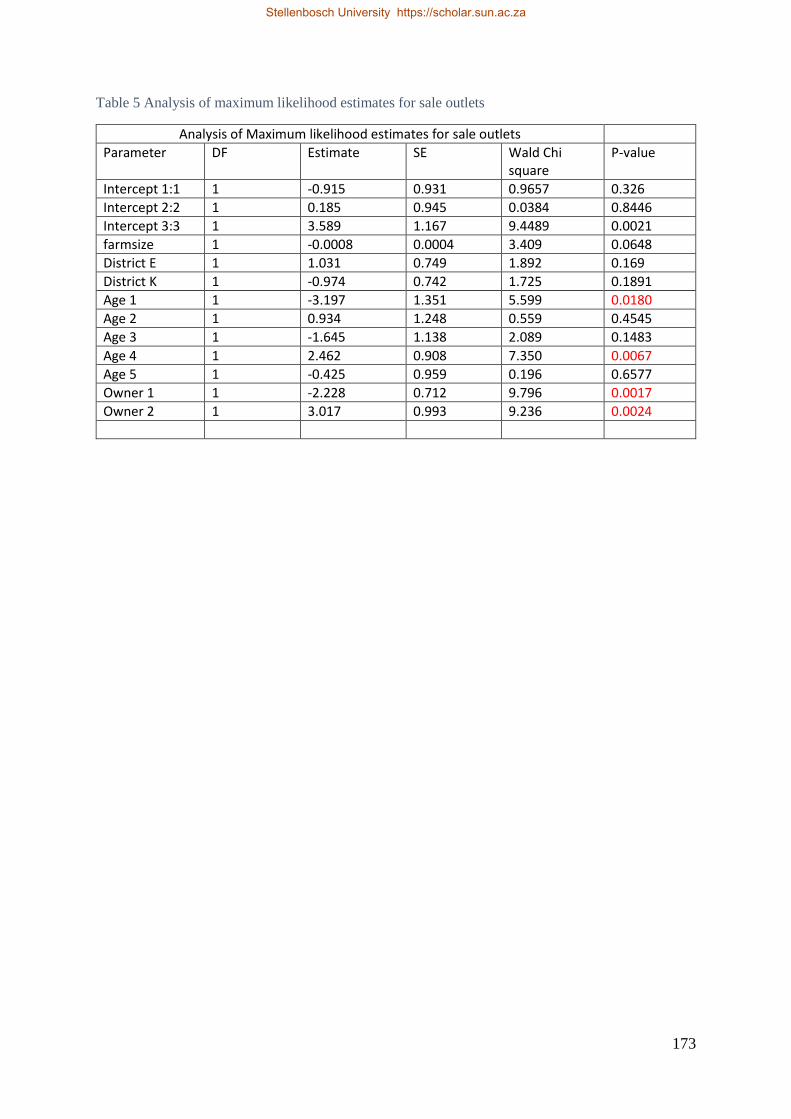
173
Table 5 Analysis of maximum likelihood estimates for sale outlets
Analysis of Maximum likelihood estimates for sale outlets
Parameter DF Estimate SE Wald Chi square
P-value
Intercept 1:1 1 -0.915 0.931 0.9657 0.326
Intercept 2:2 1 0.185 0.945 0.0384 0.8446
Intercept 3:3 1 3.589 1.167 9.4489 0.0021
farmsize 1 -0.0008 0.0004 3.409 0.0648
District E 1 1.031 0.749 1.892 0.169
District K 1 -0.974 0.742 1.725 0.1891
Age 1 1 -3.197 1.351 5.599 0.0180
Age 2 1 0.934 1.248 0.559 0.4545
Age 3 1 -1.645 1.138 2.089 0.1483
Age 4 1 2.462 0.908 7.350 0.0067
Age 5 1 -0.425 0.959 0.196 0.6577
Owner 1 1 -2.228 0.712 9.796 0.0017
Owner 2 1 3.017 0.993 9.236 0.0024
Stellenbosch University https://scholar.sun.ac.za
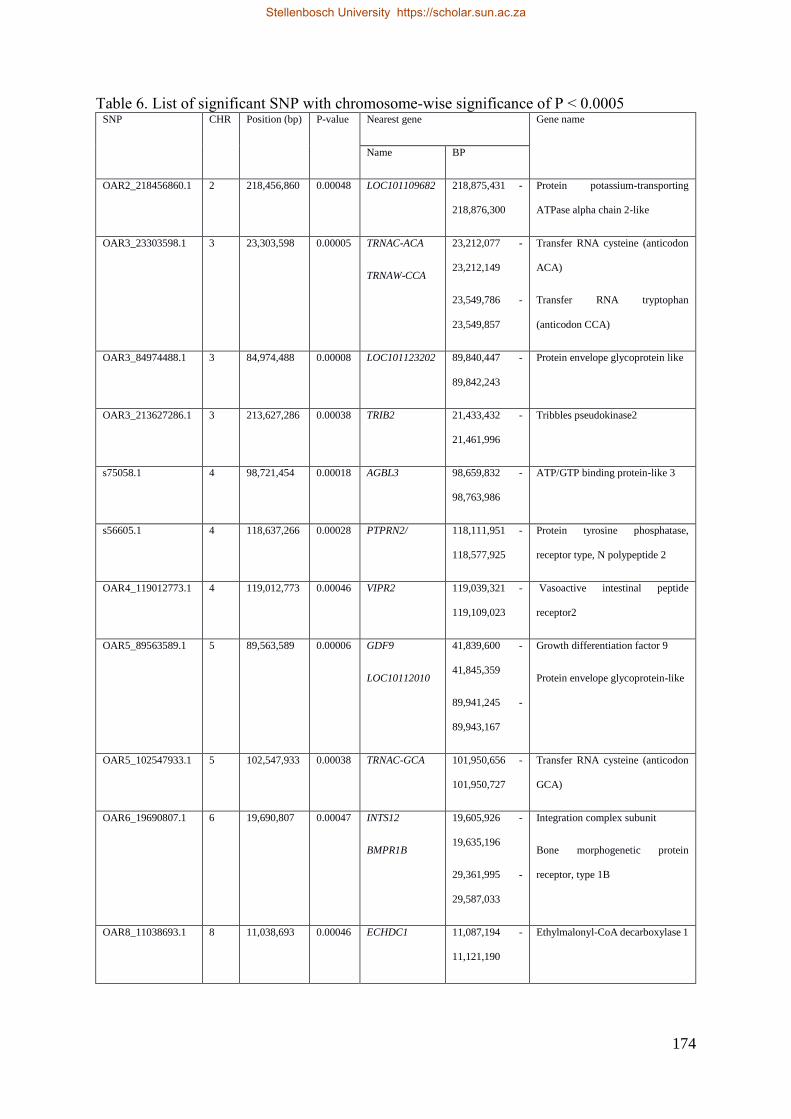
174
Table 6. List of significant SNP with chromosome-wise significance of P < 0.0005 SNP CHR Position (bp) P-value Nearest gene Gene name
Name BP
OAR2_218456860.1 2 218,456,860 0.00048 LOC101109682 218,875,431 -
218,876,300
Protein potassium-transporting
ATPase alpha chain 2-like
OAR3_23303598.1 3 23,303,598 0.00005 TRNAC-ACA
TRNAW-CCA
23,212,077 -
23,212,149
23,549,786 -
23,549,857
Transfer RNA cysteine (anticodon
ACA)
Transfer RNA tryptophan
(anticodon CCA)
OAR3_84974488.1 3 84,974,488 0.00008 LOC101123202 89,840,447 -
89,842,243
Protein envelope glycoprotein like
OAR3_213627286.1 3 213,627,286 0.00038 TRIB2 21,433,432 -
21,461,996
Tribbles pseudokinase2
s75058.1 4 98,721,454 0.00018 AGBL3 98,659,832 -
98,763,986
ATP/GTP binding protein-like 3
s56605.1 4 118,637,266 0.00028 PTPRN2/ 118,111,951 -
118,577,925
Protein tyrosine phosphatase,
receptor type, N polypeptide 2
OAR4_119012773.1 4 119,012,773 0.00046 VIPR2 119,039,321 -
119,109,023
Vasoactive intestinal peptide
receptor2
OAR5_89563589.1 5 89,563,589 0.00006 GDF9
LOC10112010
41,839,600 -
41,845,359
89,941,245 -
89,943,167
Growth differentiation factor 9
Protein envelope glycoprotein-like
OAR5_102547933.1 5 102,547,933 0.00038 TRNAC-GCA 101,950,656 -
101,950,727
Transfer RNA cysteine (anticodon
GCA)
OAR6_19690807.1 6 19,690,807 0.00047 INTS12
BMPR1B
19,605,926 -
19,635,196
29,361,995 -
29,587,033
Integration complex subunit
Bone morphogenetic protein
receptor, type 1B
OAR8_11038693.1 8 11,038,693 0.00046 ECHDC1 11,087,194 -
11,121,190
Ethylmalonyl-CoA decarboxylase 1
Stellenbosch University https://scholar.sun.ac.za
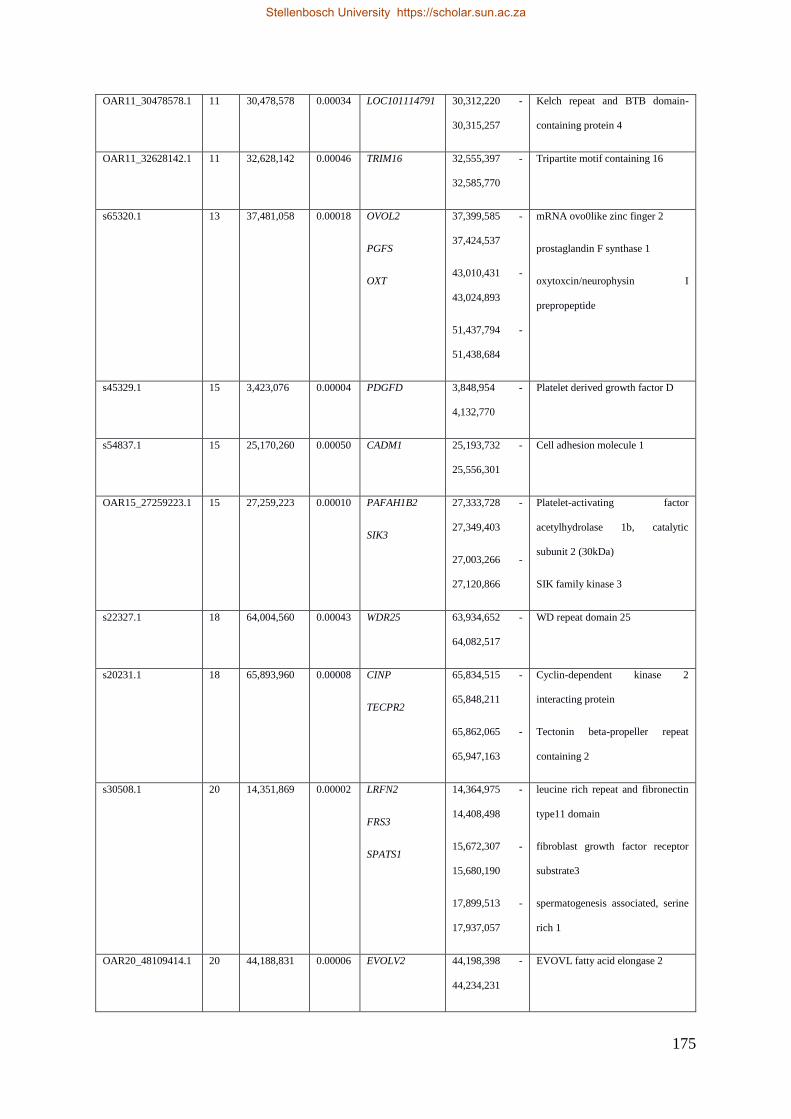
175
OAR11_30478578.1 11 30,478,578 0.00034 LOC101114791 30,312,220 -
30,315,257
Kelch repeat and BTB domain-
containing protein 4
OAR11_32628142.1 11 32,628,142 0.00046 TRIM16 32,555,397 -
32,585,770
Tripartite motif containing 16
s65320.1 13 37,481,058 0.00018 OVOL2
PGFS
OXT
37,399,585 -
37,424,537
43,010,431 -
43,024,893
51,437,794 -
51,438,684
mRNA ovo0like zinc finger 2
prostaglandin F synthase 1
oxytoxcin/neurophysin I
prepropeptide
s45329.1 15 3,423,076 0.00004 PDGFD 3,848,954 -
4,132,770
Platelet derived growth factor D
s54837.1 15 25,170,260 0.00050 CADM1 25,193,732 -
25,556,301
Cell adhesion molecule 1
OAR15_27259223.1 15 27,259,223 0.00010 PAFAH1B2
SIK3
27,333,728 -
27,349,403
27,003,266 -
27,120,866
Platelet-activating factor
acetylhydrolase 1b, catalytic
subunit 2 (30kDa)
SIK family kinase 3
s22327.1 18 64,004,560 0.00043 WDR25 63,934,652 -
64,082,517
WD repeat domain 25
s20231.1 18 65,893,960 0.00008 CINP
TECPR2
65,834,515 -
65,848,211
65,862,065 -
65,947,163
Cyclin-dependent kinase 2
interacting protein
Tectonin beta-propeller repeat
containing 2
s30508.1 20 14,351,869 0.00002 LRFN2
FRS3
SPATS1
14,364,975 -
14,408,498
15,672,307 -
15,680,190
17,899,513 -
17,937,057
leucine rich repeat and fibronectin
type11 domain
fibroblast growth factor receptor
substrate3
spermatogenesis associated, serine
rich 1
OAR20_48109414.1 20 44,188,831 0.00006 EVOLV2 44,198,398 -
44,234,231
EVOVL fatty acid elongase 2
Stellenbosch University https://scholar.sun.ac.za

176
OAR25_38810834.1 25 38,810,834 0.00018 CDHR1
LRIT1
38,788,175 –
38,809,445
38,818,798 –
38,841,222
Cadherin related family member 1
Leucine-rich repeat,
immunoglobulin-like and
transmembrane domains 1
Stellenbosch University https://scholar.sun.ac.za
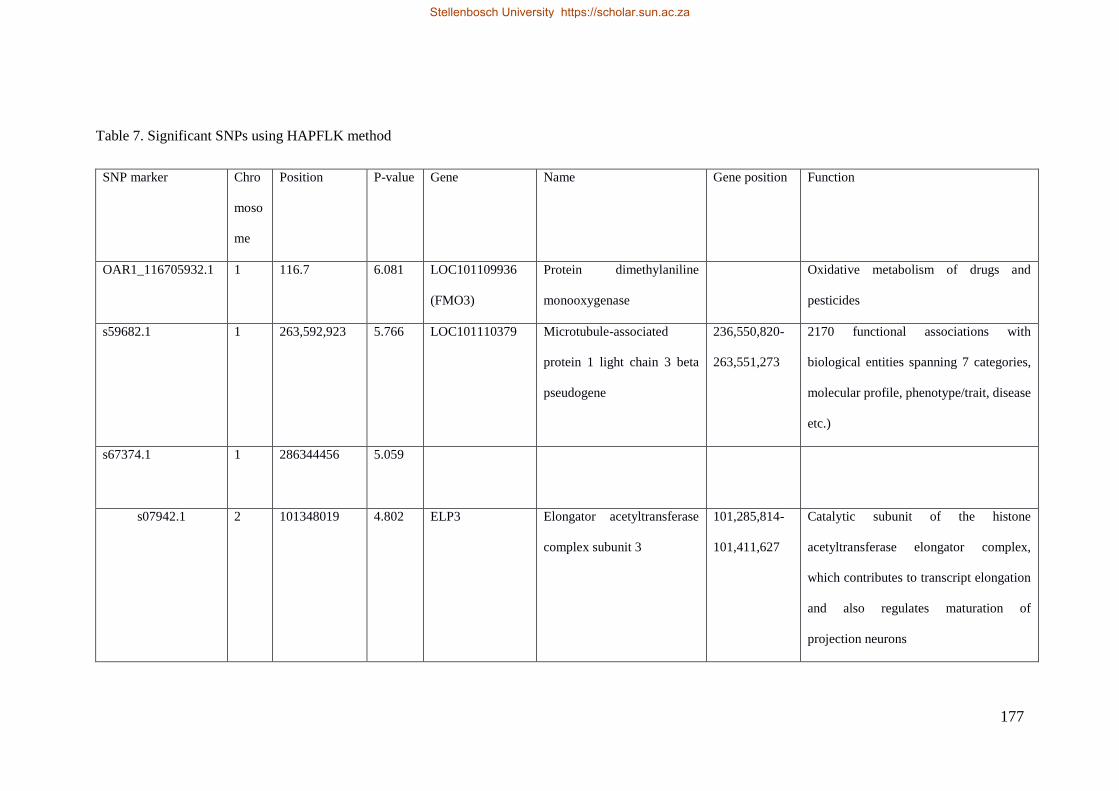
177
Table 7. Significant SNPs using HAPFLK method
SNP marker Chro
moso
me
Position P-value Gene Name Gene position Function
OAR1_116705932.1 1 116.7 6.081 LOC101109936
(FMO3)
Protein dimethylaniline
monooxygenase
Oxidative metabolism of drugs and
pesticides
s59682.1
1 263,592,923
5.766 LOC101110379 Microtubule-associated
protein 1 light chain 3 beta
pseudogene
236,550,820-
263,551,273
2170 functional associations with
biological entities spanning 7 categories,
molecular profile, phenotype/trait, disease
etc.)
s67374.1
1 286344456
5.059
s07942.1
2 101348019
4.802 ELP3 Elongator acetyltransferase
complex subunit 3
101,285,814-
101,411,627
Catalytic subunit of the histone
acetyltransferase elongator complex,
which contributes to transcript elongation
and also regulates maturation of
projection neurons
Stellenbosch University https://scholar.sun.ac.za
Stellenbosch University https://scholar.sun.ac.za
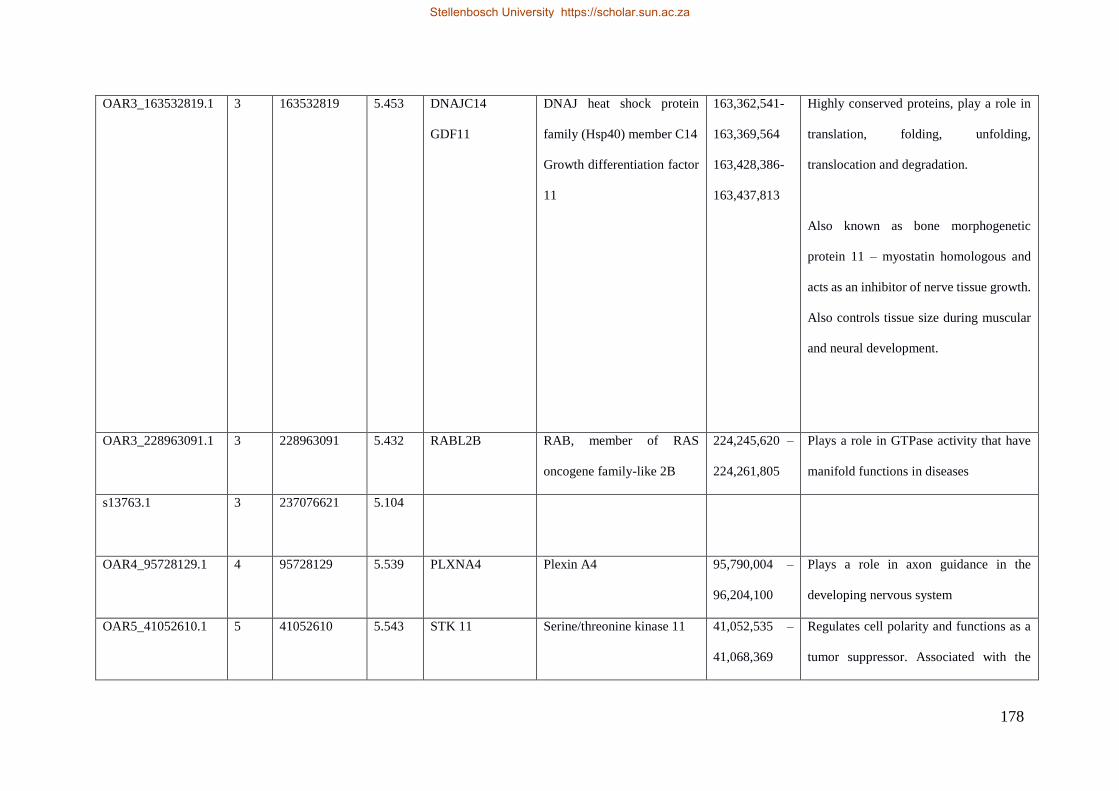
178
OAR3_163532819.1
3 163532819
5.453 DNAJC14
GDF11
DNAJ heat shock protein
family (Hsp40) member C14
Growth differentiation factor
11
163,362,541-
163,369,564
163,428,386-
163,437,813
Highly conserved proteins, play a role in
translation, folding, unfolding,
translocation and degradation.
Also known as bone morphogenetic
protein 11 – myostatin homologous and
acts as an inhibitor of nerve tissue growth.
Also controls tissue size during muscular
and neural development.
OAR3_228963091.1
3 228963091
5.432 RABL2B RAB, member of RAS
oncogene family-like 2B
224,245,620 –
224,261,805
Plays a role in GTPase activity that have
manifold functions in diseases
s13763.1
3 237076621
5.104
OAR4_95728129.1
4 95728129
5.539 PLXNA4 Plexin A4 95,790,004 –
96,204,100
Plays a role in axon guidance in the
developing nervous system
OAR5_41052610.1
5 41052610
5.543 STK 11 Serine/threonine kinase 11 41,052,535 –
41,068,369
Regulates cell polarity and functions as a
tumor suppressor. Associated with the
Stellenbosch University https://scholar.sun.ac.za
Stellenbosch University https://scholar.sun.ac.za
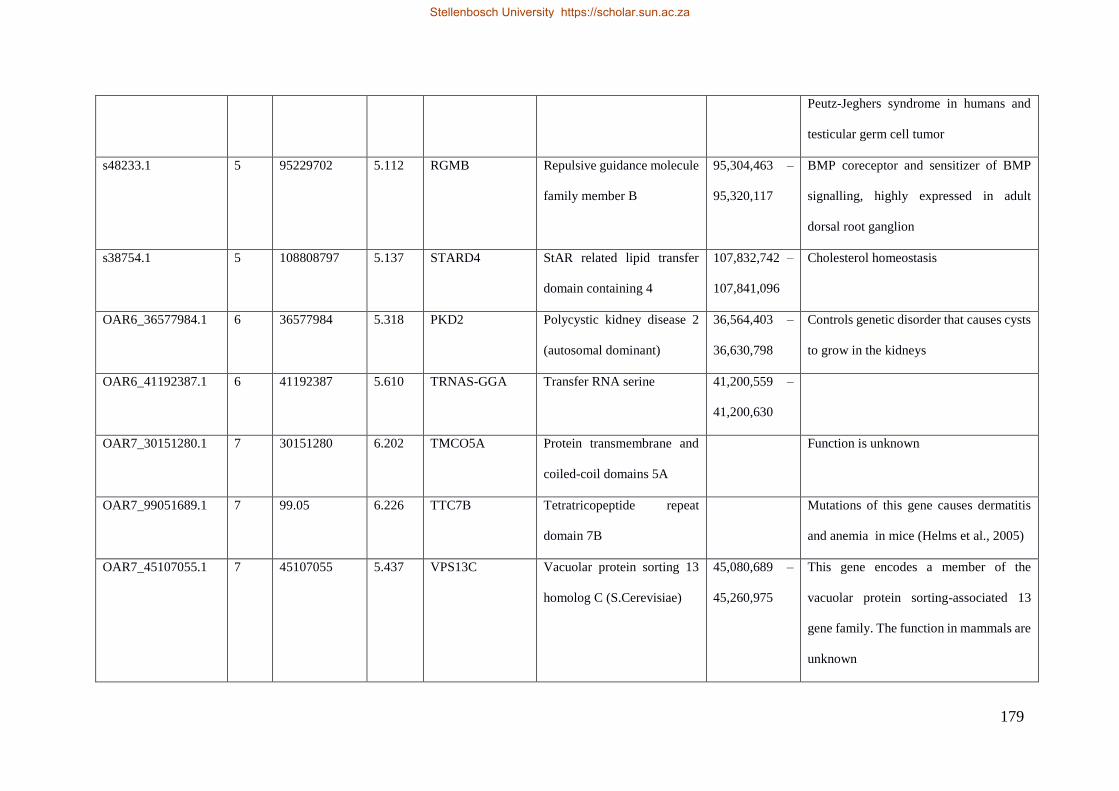
179
Peutz-Jeghers syndrome in humans and
testicular germ cell tumor
s48233.1
5 95229702
5.112 RGMB Repulsive guidance molecule
family member B
95,304,463 –
95,320,117
BMP coreceptor and sensitizer of BMP
signalling, highly expressed in adult
dorsal root ganglion
s38754.1
5 108808797
5.137 STARD4 StAR related lipid transfer
domain containing 4
107,832,742 –
107,841,096
Cholesterol homeostasis
OAR6_36577984.1
6 36577984
5.318 PKD2 Polycystic kidney disease 2
(autosomal dominant)
36,564,403 –
36,630,798
Controls genetic disorder that causes cysts
to grow in the kidneys
OAR6_41192387.1
6 41192387
5.610 TRNAS-GGA Transfer RNA serine 41,200,559 –
41,200,630
OAR7_30151280.1 7 30151280 6.202 TMCO5A Protein transmembrane and
coiled-coil domains 5A
Function is unknown
OAR7_99051689.1 7 99.05 6.226 TTC7B Tetratricopeptide repeat
domain 7B
Mutations of this gene causes dermatitis
and anemia in mice (Helms et al., 2005)
OAR7_45107055.1
7 45107055
5.437 VPS13C Vacuolar protein sorting 13
homolog C (S.Cerevisiae)
45,080,689 –
45,260,975
This gene encodes a member of the
vacuolar protein sorting-associated 13
gene family. The function in mammals are
unknown
Stellenbosch University https://scholar.sun.ac.za
Stellenbosch University https://scholar.sun.ac.za
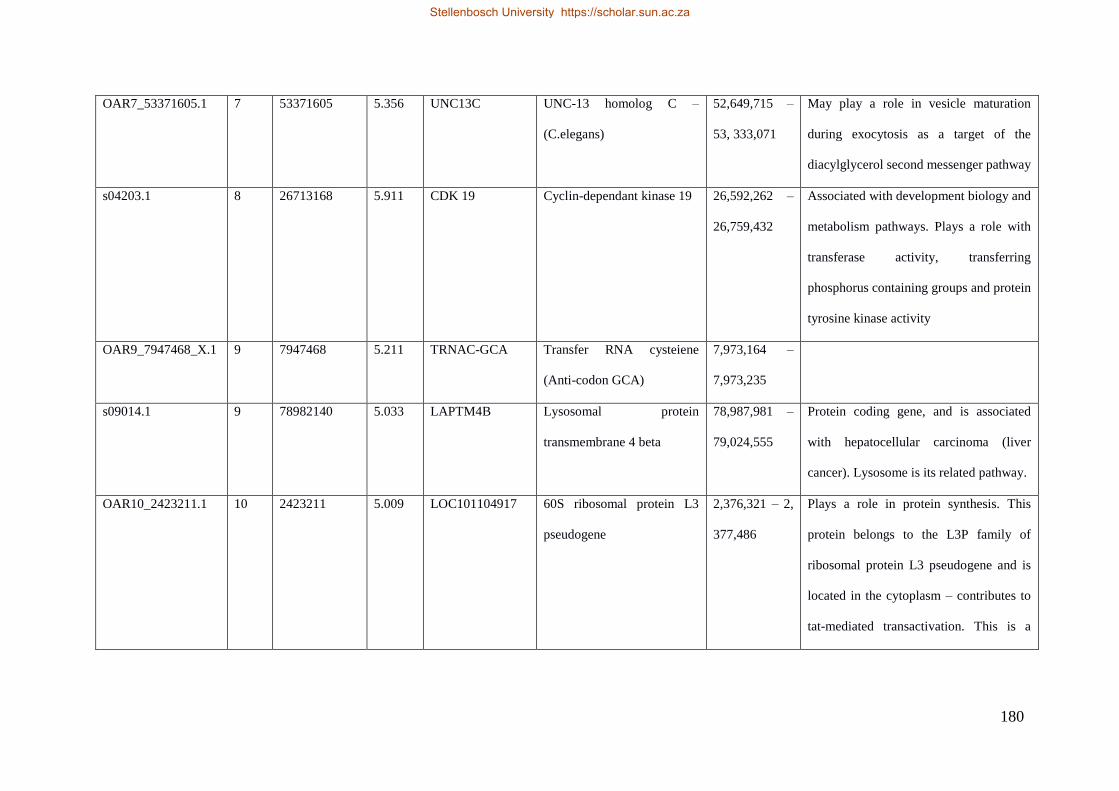
180
OAR7_53371605.1
7 53371605
5.356 UNC13C UNC-13 homolog C –
(C.elegans)
52,649,715 –
53, 333,071
May play a role in vesicle maturation
during exocytosis as a target of the
diacylglycerol second messenger pathway
s04203.1
8 26713168
5.911 CDK 19 Cyclin-dependant kinase 19 26,592,262 –
26,759,432
Associated with development biology and
metabolism pathways. Plays a role with
transferase activity, transferring
phosphorus containing groups and protein
tyrosine kinase activity
OAR9_7947468_X.1
9 7947468
5.211 TRNAC-GCA Transfer RNA cysteiene
(Anti-codon GCA)
7,973,164 –
7,973,235
s09014.1
9 78982140
5.033 LAPTM4B Lysosomal protein
transmembrane 4 beta
78,987,981 –
79,024,555
Protein coding gene, and is associated
with hepatocellular carcinoma (liver
cancer). Lysosome is its related pathway.
OAR10_2423211.1
10 2423211
5.009 LOC101104917 60S ribosomal protein L3
pseudogene
2,376,321 – 2,
377,486
Plays a role in protein synthesis. This
protein belongs to the L3P family of
ribosomal protein L3 pseudogene and is
located in the cytoplasm – contributes to
tat-mediated transactivation. This is a
Stellenbosch University https://scholar.sun.ac.za
Stellenbosch University https://scholar.sun.ac.za
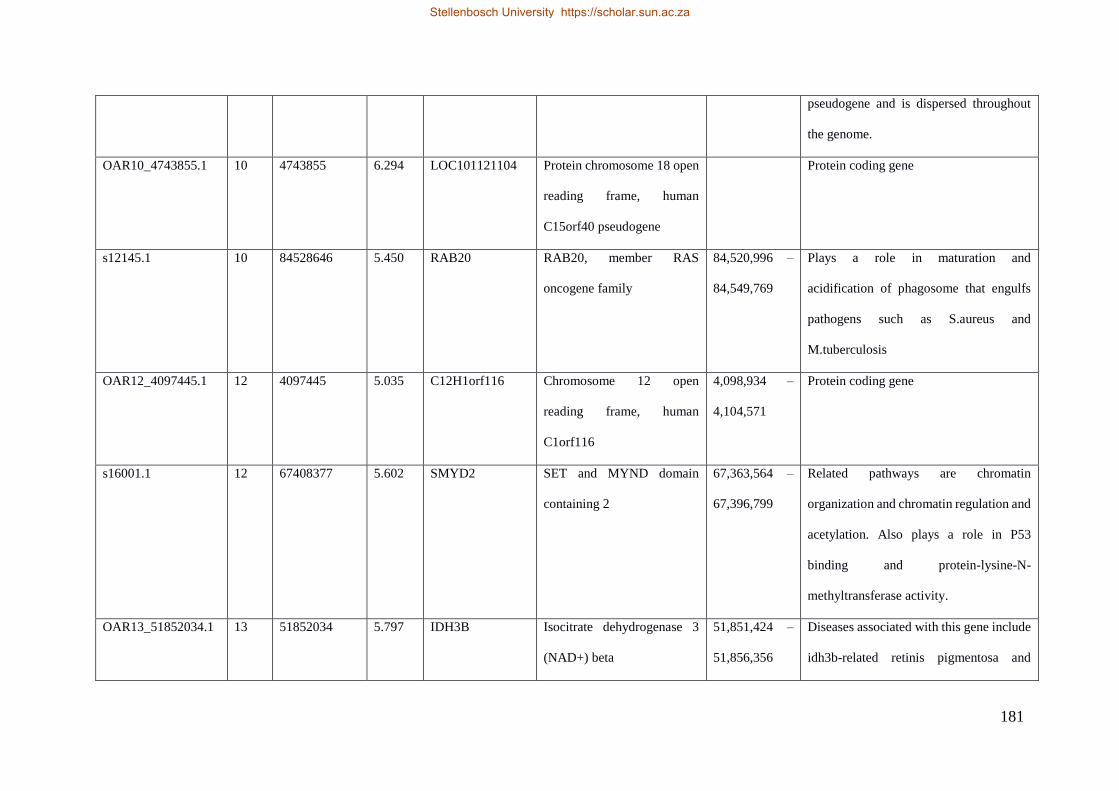
181
pseudogene and is dispersed throughout
the genome.
OAR10_4743855.1
10 4743855
6.294 LOC101121104 Protein chromosome 18 open
reading frame, human
C15orf40 pseudogene
Protein coding gene
s12145.1
10 84528646
5.450 RAB20 RAB20, member RAS
oncogene family
84,520,996 –
84,549,769
Plays a role in maturation and
acidification of phagosome that engulfs
pathogens such as S.aureus and
M.tuberculosis
OAR12_4097445.1
12 4097445
5.035 C12H1orf116 Chromosome 12 open
reading frame, human
C1orf116
4,098,934 –
4,104,571
Protein coding gene
s16001.1
12 67408377
5.602 SMYD2 SET and MYND domain
containing 2
67,363,564 –
67,396,799
Related pathways are chromatin
organization and chromatin regulation and
acetylation. Also plays a role in P53
binding and protein-lysine-N-
methyltransferase activity.
OAR13_51852034.1
13 51852034
5.797 IDH3B Isocitrate dehydrogenase 3
(NAD+) beta
51,851,424 –
51,856,356
Diseases associated with this gene include
idh3b-related retinis pigmentosa and
Stellenbosch University https://scholar.sun.ac.za
Stellenbosch University https://scholar.sun.ac.za
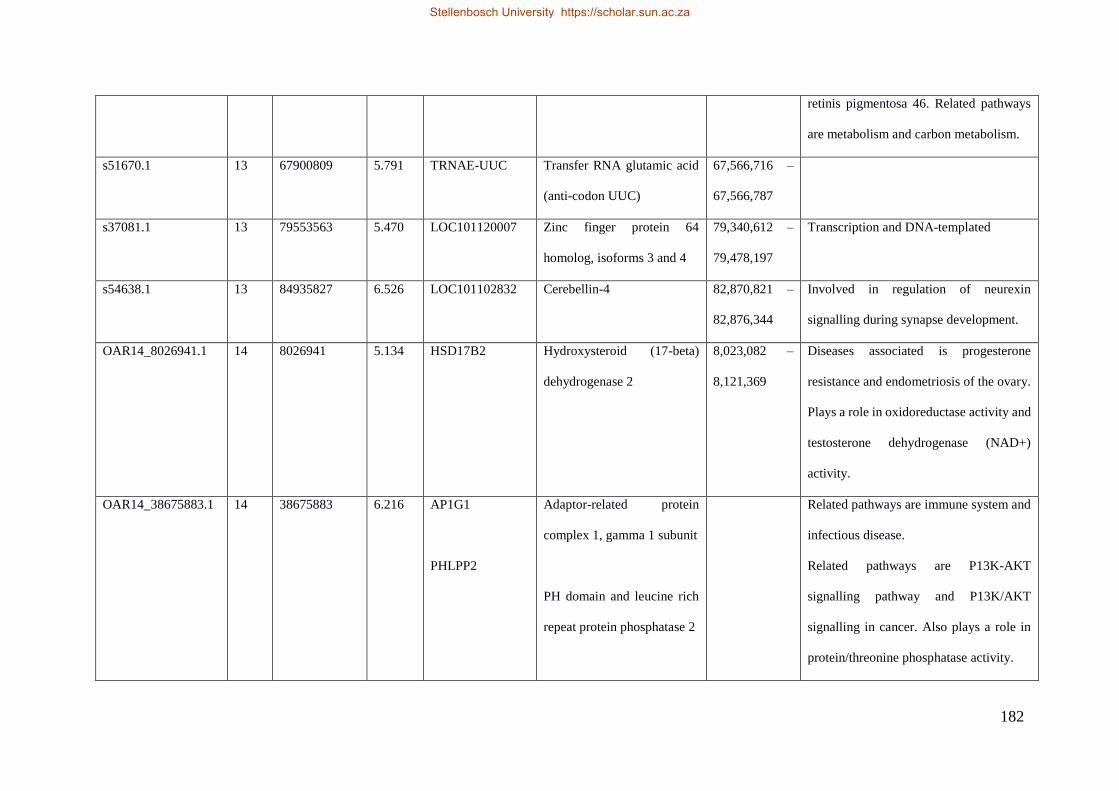
182
retinis pigmentosa 46. Related pathways
are metabolism and carbon metabolism.
s51670.1
13 67900809
5.791 TRNAE-UUC Transfer RNA glutamic acid
(anti-codon UUC)
67,566,716 –
67,566,787
s37081.1
13 79553563
5.470 LOC101120007 Zinc finger protein 64
homolog, isoforms 3 and 4
79,340,612 –
79,478,197
Transcription and DNA-templated
s54638.1
13 84935827
6.526 LOC101102832 Cerebellin-4 82,870,821 –
82,876,344
Involved in regulation of neurexin
signalling during synapse development.
OAR14_8026941.1
14 8026941
5.134 HSD17B2 Hydroxysteroid (17-beta)
dehydrogenase 2
8,023,082 –
8,121,369
Diseases associated is progesterone
resistance and endometriosis of the ovary.
Plays a role in oxidoreductase activity and
testosterone dehydrogenase (NAD+)
activity.
OAR14_38675883.1
14 38675883
6.216 AP1G1
PHLPP2
Adaptor-related protein
complex 1, gamma 1 subunit
PH domain and leucine rich
repeat protein phosphatase 2
Related pathways are immune system and
infectious disease.
Related pathways are P13K-AKT
signalling pathway and P13K/AKT
signalling in cancer. Also plays a role in
protein/threonine phosphatase activity.
Stellenbosch University https://scholar.sun.ac.za
Stellenbosch University https://scholar.sun.ac.za
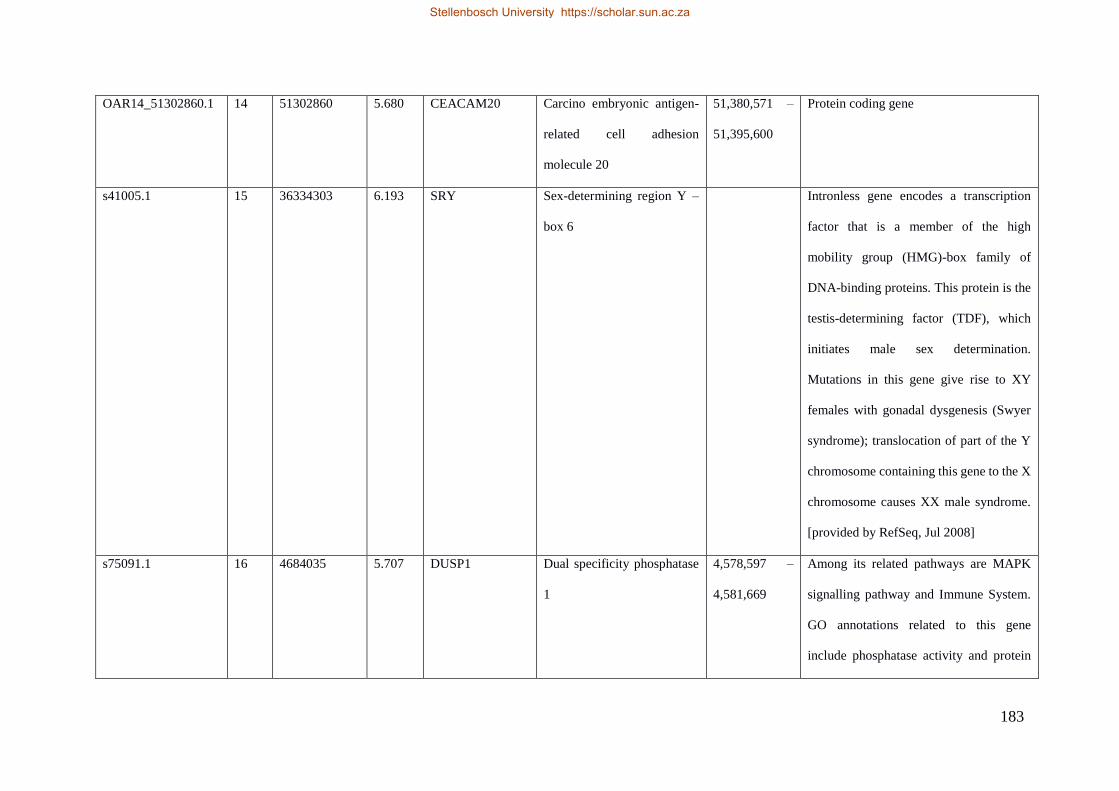
183
OAR14_51302860.1
14 51302860
5.680 CEACAM20 Carcino embryonic antigen-
related cell adhesion
molecule 20
51,380,571 –
51,395,600
Protein coding gene
s41005.1
15 36334303
6.193 SRY Sex-determining region Y –
box 6
Intronless gene encodes a transcription
factor that is a member of the high
mobility group (HMG)-box family of
DNA-binding proteins. This protein is the
testis-determining factor (TDF), which
initiates male sex determination.
Mutations in this gene give rise to XY
females with gonadal dysgenesis (Swyer
syndrome); translocation of part of the Y
chromosome containing this gene to the X
chromosome causes XX male syndrome.
[provided by RefSeq, Jul 2008]
s75091.1
16 4684035
5.707 DUSP1 Dual specificity phosphatase
1
4,578,597 –
4,581,669
Among its related pathways are MAPK
signalling pathway and Immune System.
GO annotations related to this gene
include phosphatase activity and protein
Stellenbosch University https://scholar.sun.ac.za
Stellenbosch University https://scholar.sun.ac.za
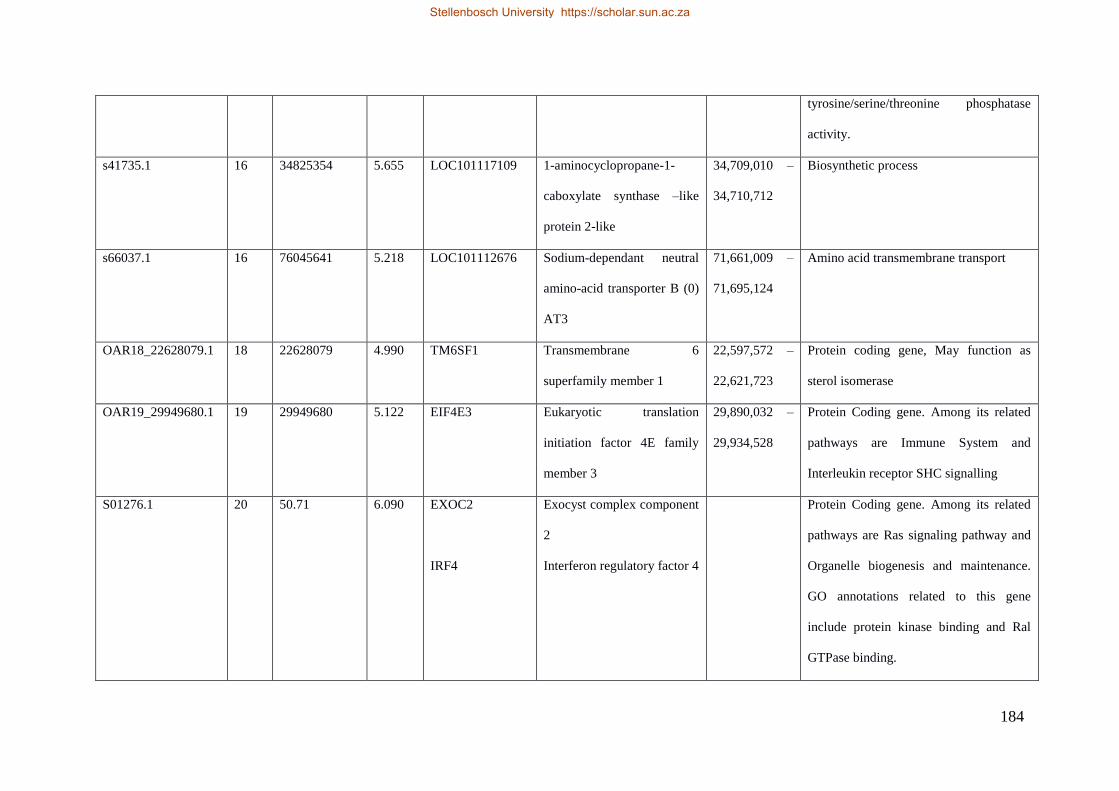
184
tyrosine/serine/threonine phosphatase
activity.
s41735.1
16 34825354
5.655 LOC101117109 1-aminocyclopropane-1-
caboxylate synthase –like
protein 2-like
34,709,010 –
34,710,712
Biosynthetic process
s66037.1
16 76045641
5.218 LOC101112676 Sodium-dependant neutral
amino-acid transporter B (0)
AT3
71,661,009 –
71,695,124
Amino acid transmembrane transport
OAR18_22628079.1
18 22628079
4.990 TM6SF1 Transmembrane 6
superfamily member 1
22,597,572 –
22,621,723
Protein coding gene, May function as
sterol isomerase
OAR19_29949680.1
19 29949680
5.122 EIF4E3 Eukaryotic translation
initiation factor 4E family
member 3
29,890,032 –
29,934,528
Protein Coding gene. Among its related
pathways are Immune System and
Interleukin receptor SHC signalling
S01276.1 20 50.71 6.090 EXOC2
IRF4
Exocyst complex component
2
Interferon regulatory factor 4
Protein Coding gene. Among its related
pathways are Ras signaling pathway and
Organelle biogenesis and maintenance.
GO annotations related to this gene
include protein kinase binding and Ral
GTPase binding.
Stellenbosch University https://scholar.sun.ac.za
Stellenbosch University https://scholar.sun.ac.za
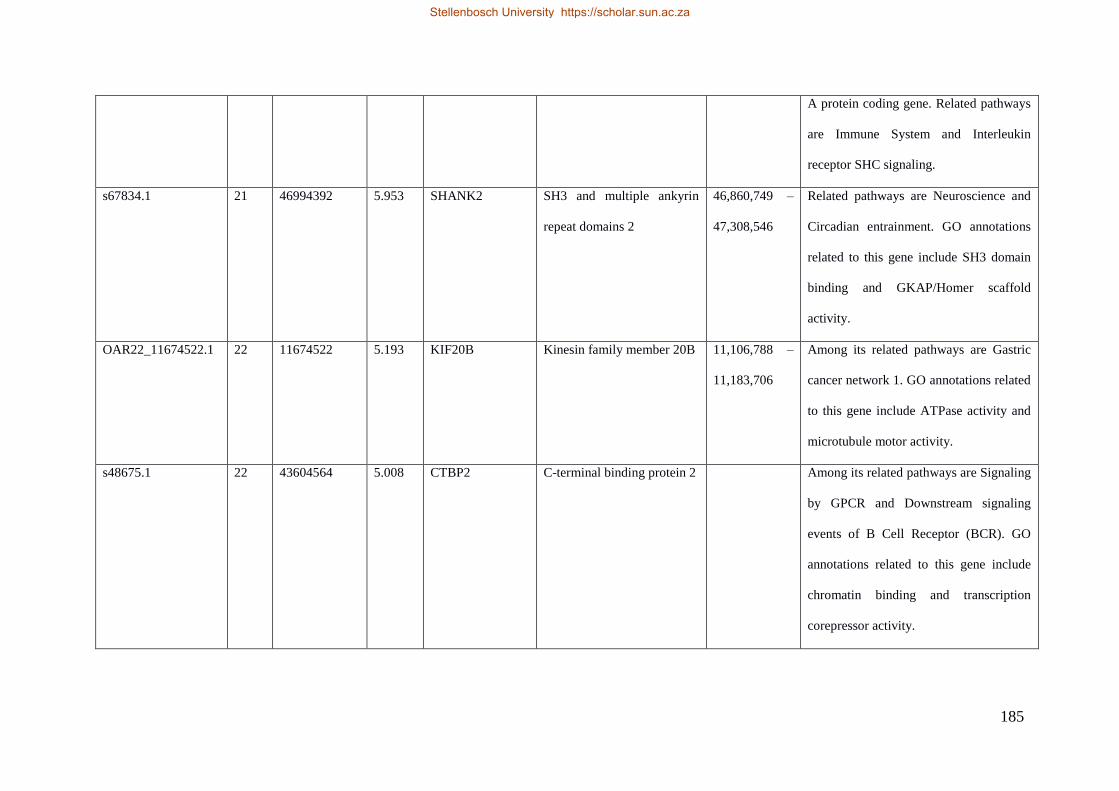
185
A protein coding gene. Related pathways
are Immune System and Interleukin
receptor SHC signaling.
s67834.1
21 46994392
5.953 SHANK2 SH3 and multiple ankyrin
repeat domains 2
46,860,749 –
47,308,546
Related pathways are Neuroscience and
Circadian entrainment. GO annotations
related to this gene include SH3 domain
binding and GKAP/Homer scaffold
activity.
OAR22_11674522.1 22 11674522
5.193 KIF20B Kinesin family member 20B 11,106,788 –
11,183,706
Among its related pathways are Gastric
cancer network 1. GO annotations related
to this gene include ATPase activity and
microtubule motor activity.
s48675.1
22 43604564
5.008 CTBP2 C-terminal binding protein 2 Among its related pathways are Signaling
by GPCR and Downstream signaling
events of B Cell Receptor (BCR). GO
annotations related to this gene include
chromatin binding and transcription
corepressor activity.
Stellenbosch University https://scholar.sun.ac.za
Stellenbosch University https://scholar.sun.ac.za
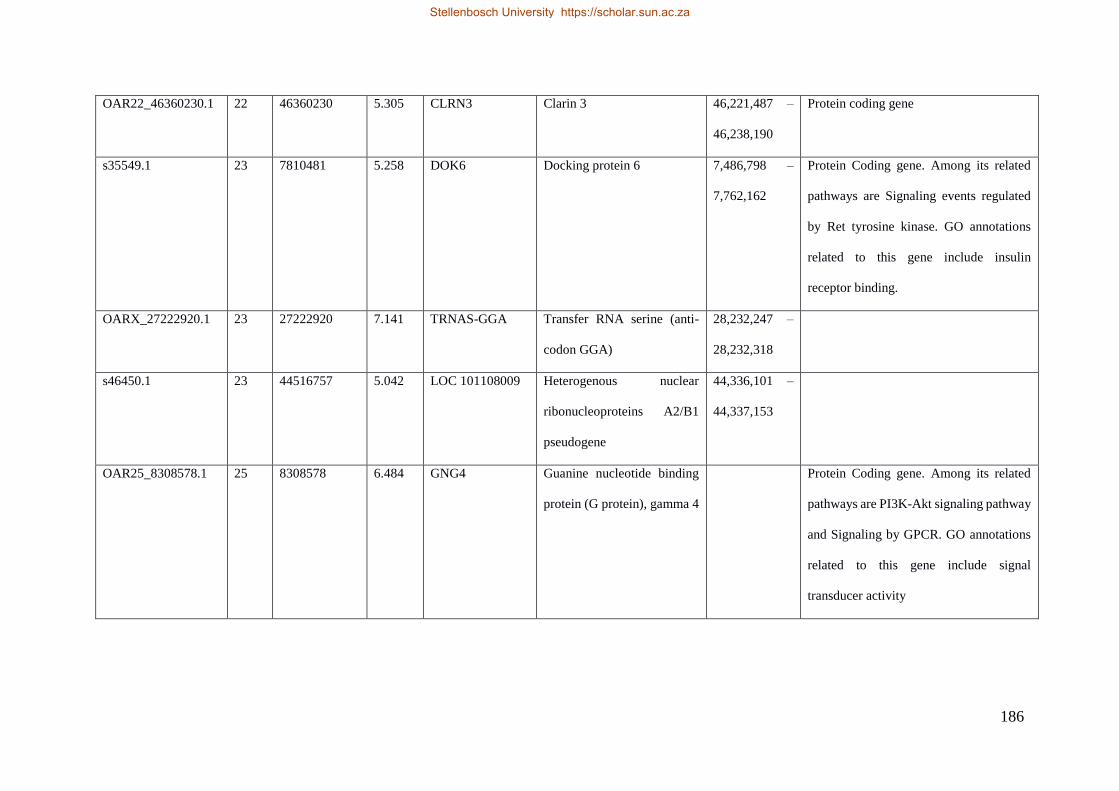
186
OAR22_46360230.1
22 46360230
5.305 CLRN3 Clarin 3 46,221,487 –
46,238,190
Protein coding gene
s35549.1
23 7810481
5.258 DOK6 Docking protein 6 7,486,798 –
7,762,162
Protein Coding gene. Among its related
pathways are Signaling events regulated
by Ret tyrosine kinase. GO annotations
related to this gene include insulin
receptor binding.
OARX_27222920.1
23
27222920
7.141 TRNAS-GGA Transfer RNA serine (anti-
codon GGA)
28,232,247 –
28,232,318
s46450.1
23 44516757
5.042 LOC 101108009 Heterogenous nuclear
ribonucleoproteins A2/B1
pseudogene
44,336,101 –
44,337,153
OAR25_8308578.1 25 8308578
6.484 GNG4 Guanine nucleotide binding
protein (G protein), gamma 4
Protein Coding gene. Among its related
pathways are PI3K-Akt signaling pathway
and Signaling by GPCR. GO annotations
related to this gene include signal
transducer activity
Stellenbosch University https://scholar.sun.ac.za
Stellenbosch University https://scholar.sun.ac.za
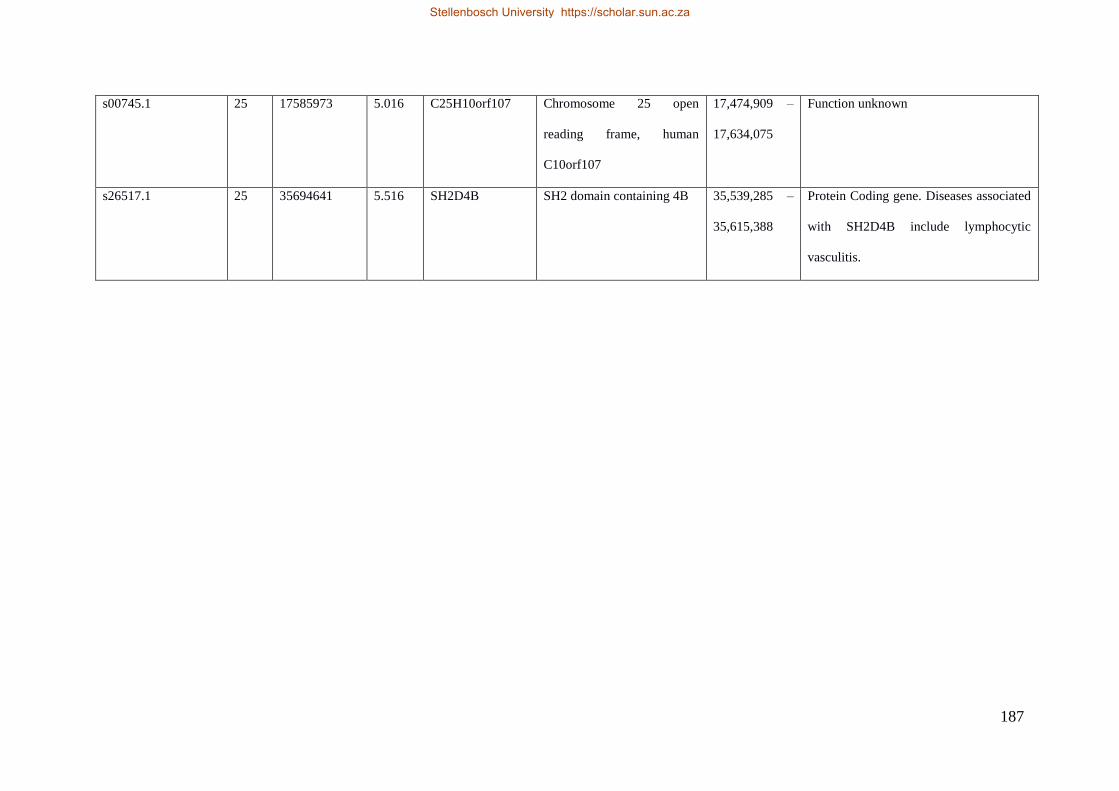
187
s00745.1
25 17585973
5.016 C25H10orf107 Chromosome 25 open
reading frame, human
C10orf107
17,474,909 –
17,634,075
Function unknown
s26517.1
25 35694641
5.516 SH2D4B SH2 domain containing 4B 35,539,285 –
35,615,388
Protein Coding gene. Diseases associated
with SH2D4B include lymphocytic
vasculitis.
Stellenbosch University https://scholar.sun.ac.za
Stellenbosch University https://scholar.sun.ac.za
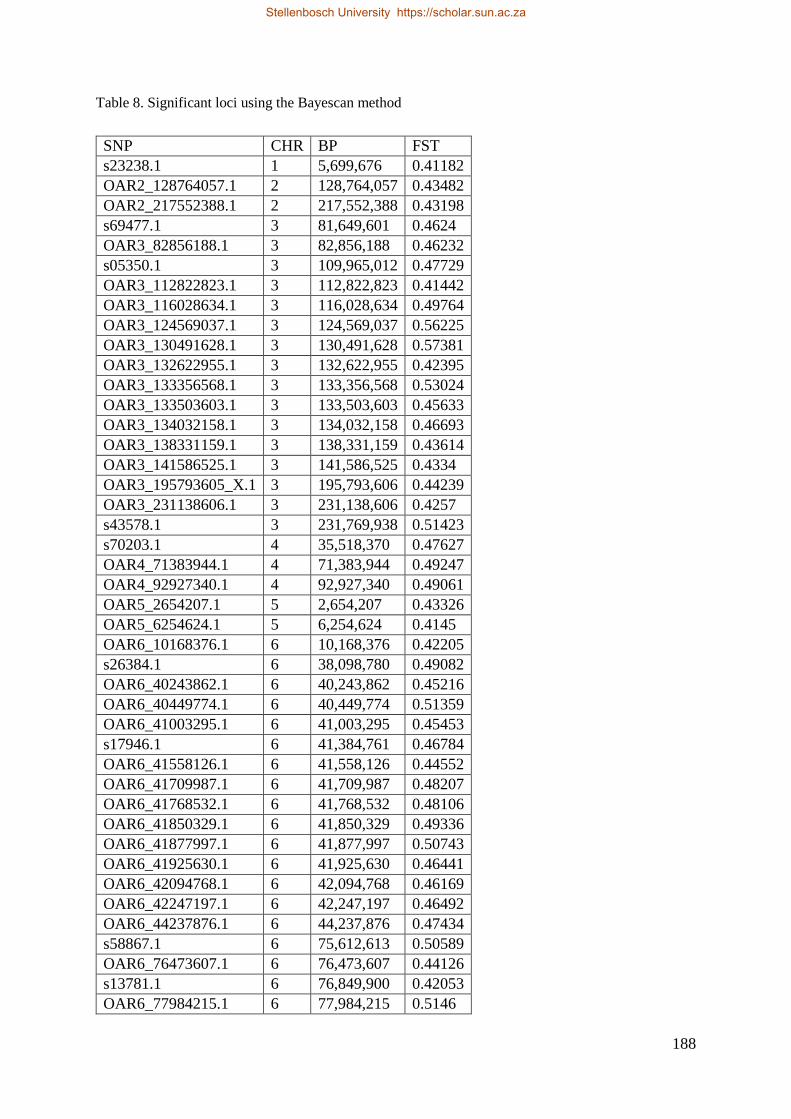
188
Table 8. Significant loci using the Bayescan method
SNP CHR BP FST
s23238.1 1 5,699,676 0.41182
OAR2_128764057.1 2 128,764,057 0.43482
OAR2_217552388.1 2 217,552,388 0.43198
s69477.1 3 81,649,601 0.4624
OAR3_82856188.1 3 82,856,188 0.46232
s05350.1 3 109,965,012 0.47729
OAR3_112822823.1 3 112,822,823 0.41442
OAR3_116028634.1 3 116,028,634 0.49764
OAR3_124569037.1 3 124,569,037 0.56225
OAR3_130491628.1 3 130,491,628 0.57381
OAR3_132622955.1 3 132,622,955 0.42395
OAR3_133356568.1 3 133,356,568 0.53024
OAR3_133503603.1 3 133,503,603 0.45633
OAR3_134032158.1 3 134,032,158 0.46693
OAR3_138331159.1 3 138,331,159 0.43614
OAR3_141586525.1 3 141,586,525 0.4334
OAR3_195793605_X.1 3 195,793,606 0.44239
OAR3_231138606.1 3 231,138,606 0.4257
s43578.1 3 231,769,938 0.51423
s70203.1 4 35,518,370 0.47627
OAR4_71383944.1 4 71,383,944 0.49247
OAR4_92927340.1 4 92,927,340 0.49061
OAR5_2654207.1 5 2,654,207 0.43326
OAR5_6254624.1 5 6,254,624 0.4145
OAR6_10168376.1 6 10,168,376 0.42205
s26384.1 6 38,098,780 0.49082
OAR6_40243862.1 6 40,243,862 0.45216
OAR6_40449774.1 6 40,449,774 0.51359
OAR6_41003295.1 6 41,003,295 0.45453
s17946.1 6 41,384,761 0.46784
OAR6_41558126.1 6 41,558,126 0.44552
OAR6_41709987.1 6 41,709,987 0.48207
OAR6_41768532.1 6 41,768,532 0.48106
OAR6_41850329.1 6 41,850,329 0.49336
OAR6_41877997.1 6 41,877,997 0.50743
OAR6_41925630.1 6 41,925,630 0.46441
OAR6_42094768.1 6 42,094,768 0.46169
OAR6_42247197.1 6 42,247,197 0.46492
OAR6_44237876.1 6 44,237,876 0.47434
s58867.1 6 75,612,613 0.50589
OAR6_76473607.1 6 76,473,607 0.44126
s13781.1 6 76,849,900 0.42053
OAR6_77984215.1 6 77,984,215 0.5146
Stellenbosch University https://scholar.sun.ac.za
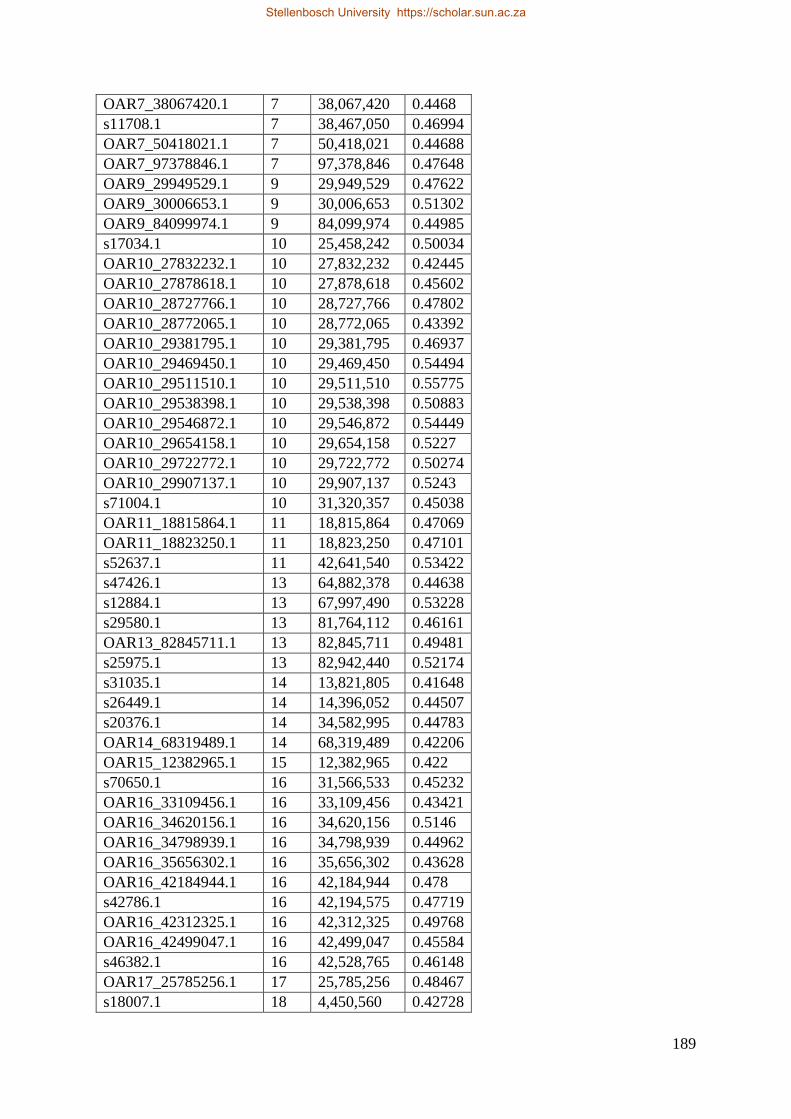
189
OAR7_38067420.1 7 38,067,420 0.4468
s11708.1 7 38,467,050 0.46994
OAR7_50418021.1 7 50,418,021 0.44688
OAR7_97378846.1 7 97,378,846 0.47648
OAR9_29949529.1 9 29,949,529 0.47622
OAR9_30006653.1 9 30,006,653 0.51302
OAR9_84099974.1 9 84,099,974 0.44985
s17034.1 10 25,458,242 0.50034
OAR10_27832232.1 10 27,832,232 0.42445
OAR10_27878618.1 10 27,878,618 0.45602
OAR10_28727766.1 10 28,727,766 0.47802
OAR10_28772065.1 10 28,772,065 0.43392
OAR10_29381795.1 10 29,381,795 0.46937
OAR10_29469450.1 10 29,469,450 0.54494
OAR10_29511510.1 10 29,511,510 0.55775
OAR10_29538398.1 10 29,538,398 0.50883
OAR10_29546872.1 10 29,546,872 0.54449
OAR10_29654158.1 10 29,654,158 0.5227
OAR10_29722772.1 10 29,722,772 0.50274
OAR10_29907137.1 10 29,907,137 0.5243
s71004.1 10 31,320,357 0.45038
OAR11_18815864.1 11 18,815,864 0.47069
OAR11_18823250.1 11 18,823,250 0.47101
s52637.1 11 42,641,540 0.53422
s47426.1 13 64,882,378 0.44638
s12884.1 13 67,997,490 0.53228
s29580.1 13 81,764,112 0.46161
OAR13_82845711.1 13 82,845,711 0.49481
s25975.1 13 82,942,440 0.52174
s31035.1 14 13,821,805 0.41648
s26449.1 14 14,396,052 0.44507
s20376.1 14 34,582,995 0.44783
OAR14_68319489.1 14 68,319,489 0.42206
OAR15_12382965.1 15 12,382,965 0.422
s70650.1 16 31,566,533 0.45232
OAR16_33109456.1 16 33,109,456 0.43421
OAR16_34620156.1 16 34,620,156 0.5146
OAR16_34798939.1 16 34,798,939 0.44962
OAR16_35656302.1 16 35,656,302 0.43628
OAR16_42184944.1 16 42,184,944 0.478
s42786.1 16 42,194,575 0.47719
OAR16_42312325.1 16 42,312,325 0.49768
OAR16_42499047.1 16 42,499,047 0.45584
s46382.1 16 42,528,765 0.46148
OAR17_25785256.1 17 25,785,256 0.48467
s18007.1 18 4,450,560 0.42728
Stellenbosch University https://scholar.sun.ac.za
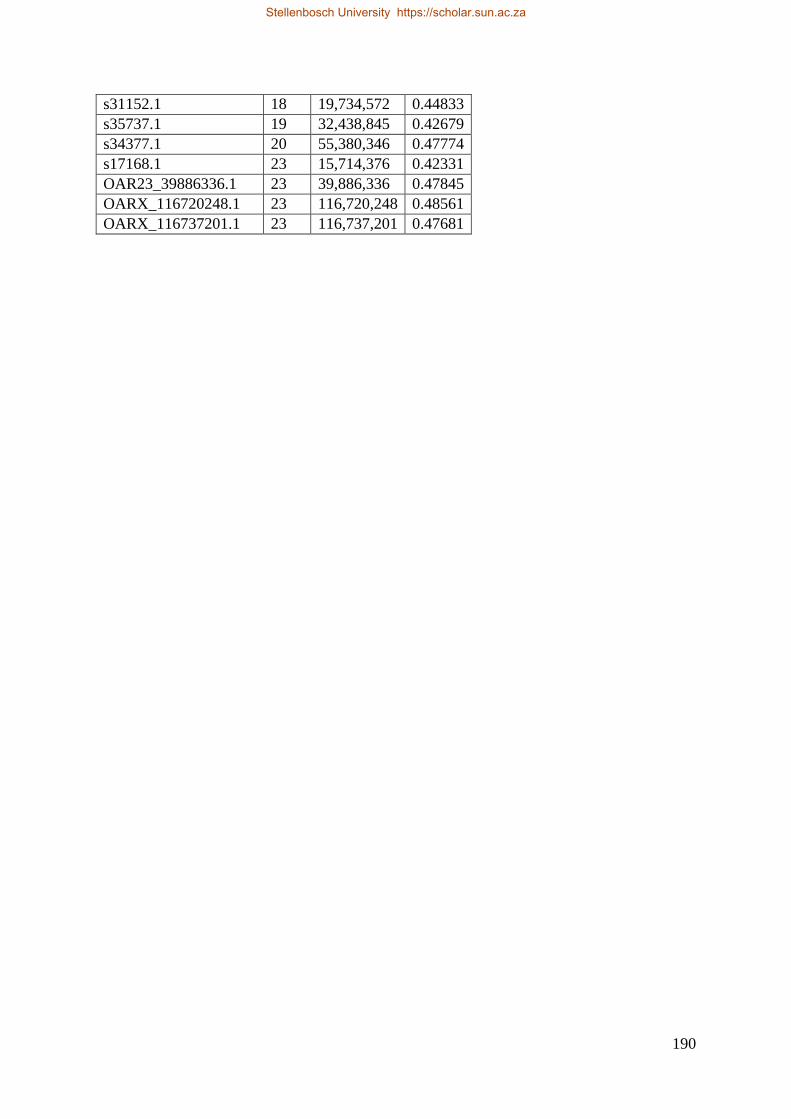
190
s31152.1 18 19,734,572 0.44833
s35737.1 19 32,438,845 0.42679
s34377.1 20 55,380,346 0.47774
s17168.1 23 15,714,376 0.42331
OAR23_39886336.1 23 39,886,336 0.47845
OARX_116720248.1 23 116,720,248 0.48561
OARX_116737201.1 23 116,737,201 0.47681
Stellenbosch University https://scholar.sun.ac.za