Embed Size (px)
Citation preview

Supplementary information
Tolerance landscapes in thermal ecology
E.L. Rezende, L. E. Castañeda and M. Santos.
Measuring thermal tolerance .................................................................. 2
Static versus ramping assays .................................................................. 2
Fig. S1 – Building a thermal tolerance landscape ..................................... 6
Fig. S2 – The tolerance landscape and subordinate traits .......................... 7
Body mass and thermal inertia ............................................................... 8
Appendix S1 ........................................................................................ 10
Appendix S2 ........................................................................................ 12
References ........................................................................................... 13
1
Measuring thermal tolerance
The thermal landscape can be readily estimated from knockdown time estimates
obtained across different temperatures (Fig. S1). Given an adequate sample size, TDT
curves can be estimated not only for the median lethal time in which 50% of
individuals succumb to heat, which roughly corresponds to the average knockdown
times (see Cooper et al. 2008), but also for other lethal time values. Briefly,
individuals are submitted to different constant stressful temperatures and their
knockdown times are recorded (i.e., static assay, e.g., Santos et al. 2011). The time
taken for a given fraction of the sample to collapse (say, 90% of all individuals) in
each temperature is then estimated. Subsequently, a TDT curve describing the isocline
for this survival probability (= 0.1 in this example) can be readily calculated with a
regression of log-transformed time estimates against T (eqn. 1). One can then build
thermal tolerance landscape by superimposing TDT curves describing different
survival probability isoclines (Fig. S1).
STATIC VERSUS RAMPING ASSAYS
The proposed framework suggests that, deviations due to varying cumulative thermal
effects and hardening aside, static and ramping protocols provide different estimates
of a single underlying relationship between thermal tolerance and time (see fig. 3b in
Santos et al. 2011). Nonetheless, a systematic analysis of thermal tolerance curves
must take into account these deviations and their potential effects on the
quantification of parameters CTmax and z. Whereas the effects of hardening are
relatively straightforward to control, methodology has such a great impact of
estimates of thermal tolerance (Lutterschmidt and Hutchison 1997; Chown et al.
2009; Santos et al. 2011; Ribeiro et al. 2012) that it may jeopardize comparative
2
efforts, the quest for general patterns and, more importantly, the validation of results
(Rezende and Santos 2012). Circumventing these issues requires an understanding of
the pros and cons of different methods and, ultimately, a concerted effort to employ a
standardized methodology.
We presently advocate for the use of static assays at different temperatures
because thermal tolerance varies both with the intensity and the duration of the heat
stress, and neither are independent nor controlled in ramping assays. Without
understanding how the total cumulative thermal stress resulting in impaired
physiological function changes with temperature and time, it is virtually impossible to
compare estimates from assays obtained with different ramping protocols (e.g., it is
unclear whether a starting temperature of 40 ° C and a ramping rate of 0 . 05 °C min−1
results on a higher thermal challenge than a starting temperature of 38 °C and a rate
of 0 .1° C min−1). Because the intensity and duration of the thermal stress is
determined by the interaction between starting temperatures and heating rates, their
effects cannot be readily partitioned or controlled by statistical means (see Rezende et
al. 2011).
Conversely, in static assays the intensity and duration of the thermal stress are
orthogonal to one another because temperature is kept constant. These assays are
more adequate for analyses at the population level because they permit the
quantification of the death rate constant k, which can be directly compared across
species measured at the same temperatures (additionally, lethal times and the intensity
of selection can be readily extrapolated from k for different scenarios). For the same
reason, regression models to estimate CTmax and z differ between protocols. Parameter
estimation with static assays involves ordinary least squares (OLS), including T as
and log10 t as the independent and dependent variable, without and with measurement
3
error, respectively (CTmax and z are then calculated from the slope and intercept, see
main text). In ramping assays, both T and log10 t involve measurement error, hence
OLS results may be jeopardized because it attempts to minimize a sum of squared
errors that is not orthogonal to neither T or log10 t.
Measurement accuracy is also expected to be lower in ramping assays,
primarily because it is easier to maintain a constant temperature than temperatures
increasing at a constant rate (e.g., this probably explains some of the contradictory
results listed in Rezende and Santos 2012). Failing to detect when an animal collapses
will result in error in knockdown time in static assays, and in knockdown time and
temperature in ramping assays (see Castañeda et al. 2012). Thermal inertia may also
be more problematic for ramping assays, particularly those employing fast rates of
temperature increase, than static assays in which Ta and Tb eventually reach thermal
equilibrium (eqn S1 and S2). Taken together, these factors might explain, for instance,
why heat tolerance in Drosophila is seemingly unaffected by water status when
assayed with ramping protocols (Overgaard et al. 2012) and highly dependent on
humidity when comparisons involve static assays at a common temperature (Maynard
Smith 1957; Bubliy et al. 2012).
To summarize, estimates obtained with ramping assays are, in principle,
suitable for parameter estimation. However, in practice it is advisable to focus on
measurements of knockdown times at different temperatures, to ensure that
measurement noise is minimal and the statistical power to detect potentially relevant
associations is maximized (see also Santos et al. 2011). Differences in goodness of fit
between analyses employing estimates obtained with static versus ramping assay
support these concerns: whereas the semi-logarithmic relationship explains 98.8% of
the variation in knockdown times measured in D. subobscura at different
4

temperatures (r2 = 0.988; see Fig. 1), this value drops to roughly 50.7% when analyses
are repeated pooling mean knockdown temperatures and times of G. pallidipes
estimated with different ramping assays (r2 = 0.507; values from fig. 1a in Terblanche
et al. 2007, who reported r2 = 0.576 assuming a linear relation between knockdown
temperature and time). If this anecdotic observation happens to be general, then
ramping assays should be avoided during the estimation of parameters CTmax and z of
TDT curves.
5

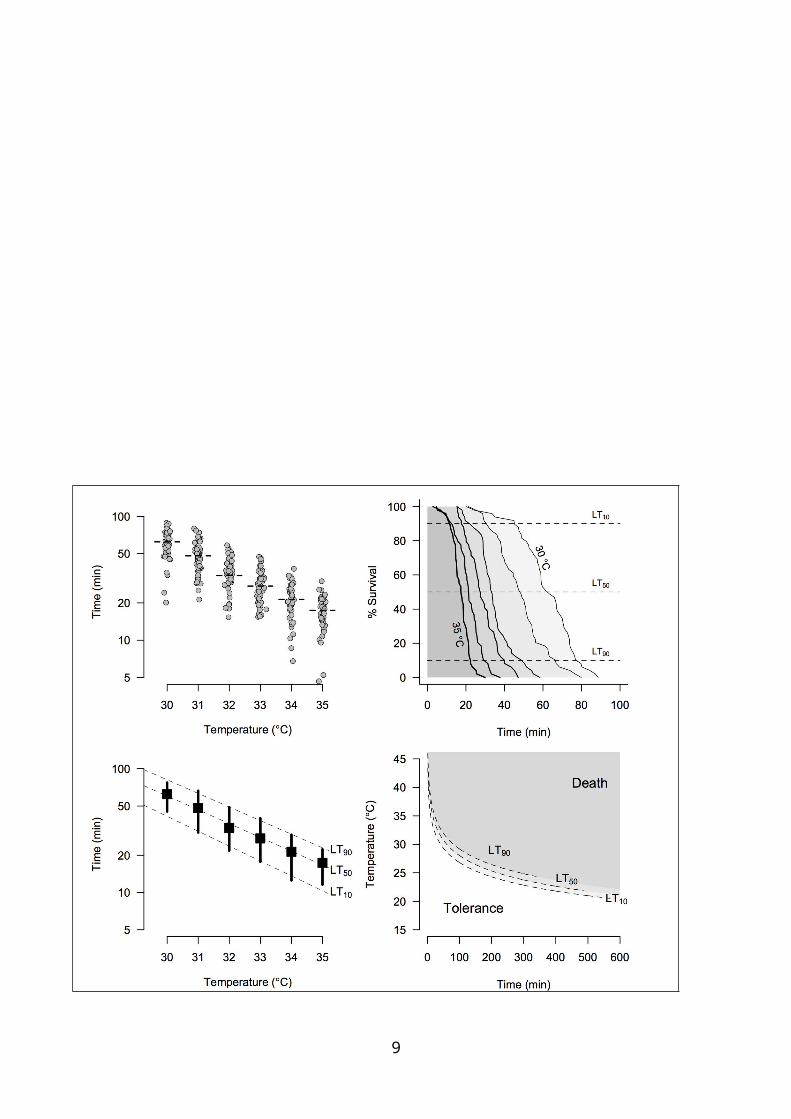
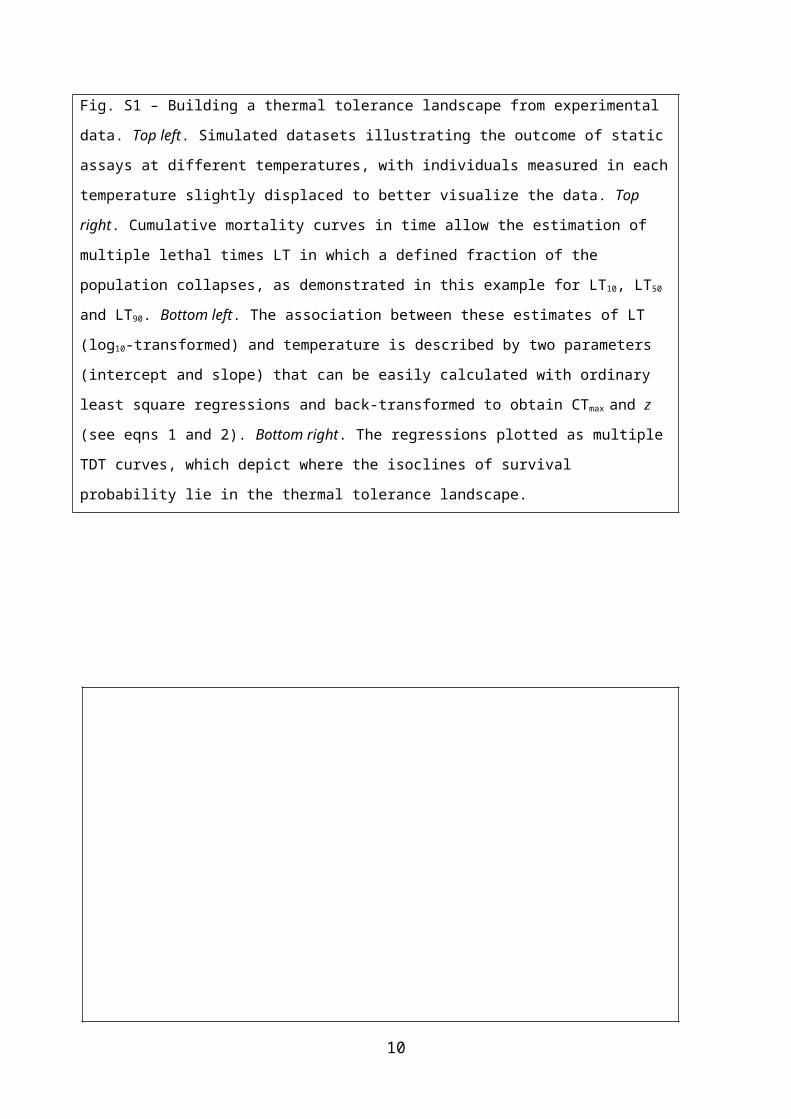
Fig. S1 – Building a thermal tolerance landscape from experimental data. Top left. Simulated
datasets illustrating the outcome of static assays at different temperatures, with individuals measured
in each temperature slightly displaced to better visualize the data. Top right. Cumulative mortality
curves in time allow the estimation of multiple lethal times LT in which a defined fraction of the
population collapses, as demonstrated in this example for LT10, LT50 and LT90. Bottom left. The
association between these estimates of LT (log10-transformed) and temperature is described by two
parameters (intercept and slope) that can be easily calculated with ordinary least square regressions
and back-transformed to obtain CTmax and z (see eqns 1 and 2). Bottom right. The regressions plotted
as multiple TDT curves, which depict where the isoclines of survival probability lie in the thermal
tolerance landscape.
6
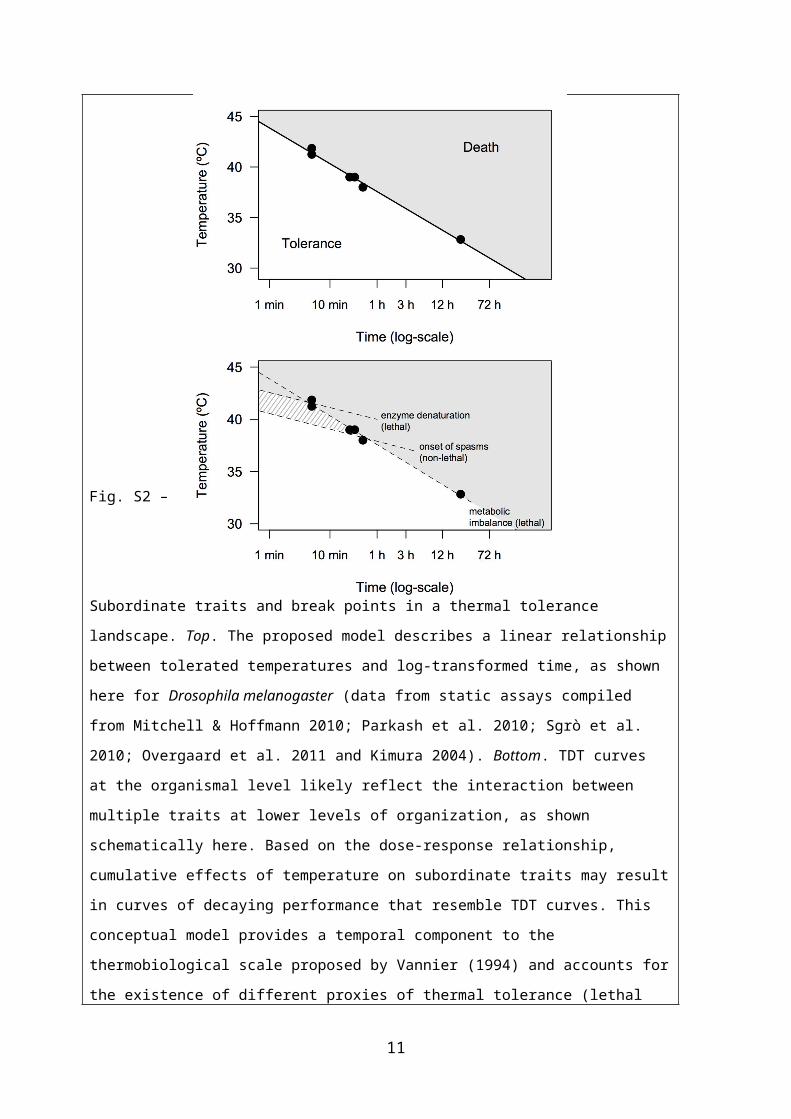
Fig. S2 – Subordinate traits and break points in a thermal tolerance landscape. Top. The proposed
model describes a linear relationship between tolerated temperatures and log-transformed time, as
shown here for Drosophila melanogaster (data from static assays compiled from Mitchell &
Hoffmann 2010; Parkash et al. 2010; Sgrò et al. 2010; Overgaard et al. 2011 and Kimura 2004).
Bottom. TDT curves at the organismal level likely reflect the interaction between multiple traits at
lower levels of organization, as shown schematically here. Based on the dose-response
relationship, cumulative effects of temperature on subordinate traits may result in curves of
decaying performance that resemble TDT curves. This conceptual model provides a temporal
component to the thermobiological scale proposed by Vannier (1994) and accounts for the
existence of different proxies of thermal tolerance (lethal and non-lethal) that can vary with the
nature of the assay. For instance, whereas enzyme denaturation and metabolic imbalance during a
thermal challenge can be lethal, other end points such as the onset of muscle spasms or loss of
motor coordination are non-lethal and may give rise to seemingly different results. This model can
also explain, from a physiological perspective, the presence of break-points along the TDT curve
(Santos et al. 2011).
7

BODY MASS AND THERMAL INERTIA
The proposed approach is highly general and applicable to other systems, being
limited primarily by the thermal tolerance and environmental data available for
hypothesis testing. This is particularly true for small organisms in which thermal
inertia is not a concern, and even some time lag between ambient temperature Ta and
body temperature Tb (within the range of minutes) may not alter dramatically the
predictions of the model. However, for larger organisms thermal inertia may have an
impact on estimates of thermal tolerance measured in the laboratory and on Tb in the
field.
The impact of thermal inertia on these variables can be estimated with
knowledge of the time constant t (Bell 1980; Stevenson 1985; Huey et al. 1992),
which can be measured empirically or estimated from allometry (Lactin and Johnson
1998). According to simplified heat transfer models:
dT b( t )dt
=T a( t )−T b ( t )
t . eqn S1
The solution of this differential equation will have the form f (T a)⋅e(−t / t ), and t (min)
can be defined as the time it takes Tb to reach 1 – 1/e = 63.2% of its final asymptotic
value. Thus, in a static assay in which animals are initially submitted to a step change
in Ta (from room temperature to T; eqn 1), the time t necessary for DT to drop to
levels corresponding to a 1% of DT ( t 0 ) corresponds to t=t ln (1/0 .01 ). For example, t
< 5 min when t <1. 086 min , which can be contrasted against the total duration of a
8
static assay to analyze to what extent thermal inertia might affect knockdown times
estimates.
To quantify the impact of thermal inertia during warming conditions, which
apply both to ramping assays and estimations of Tb in the field, Huey et al. (1992)
demonstrated that the maximum lag between Ta and Tb is:
T a( t )−T b( t )=bt , eqn S2
where b (° C min−1) corresponds to the rate of temperature increase. Consequently, the
absolute maximum lag between Ta and Tb for an organism with t = 1 min will be
small for typical fast ramping experiments employing heating rates of 0 .5° C min−1,
and virtually negligible in the field (see fig. 1 in Terblanche et al. 2011). Because
warming rates in the field are generally low (unless the organism encounters
contrasting Ta during displacement from one microenvironment to another), larger
values of t seem to be more of a concern during estimations of thermal tolerance in
the laboratory than for extrapolations to field conditions.
9
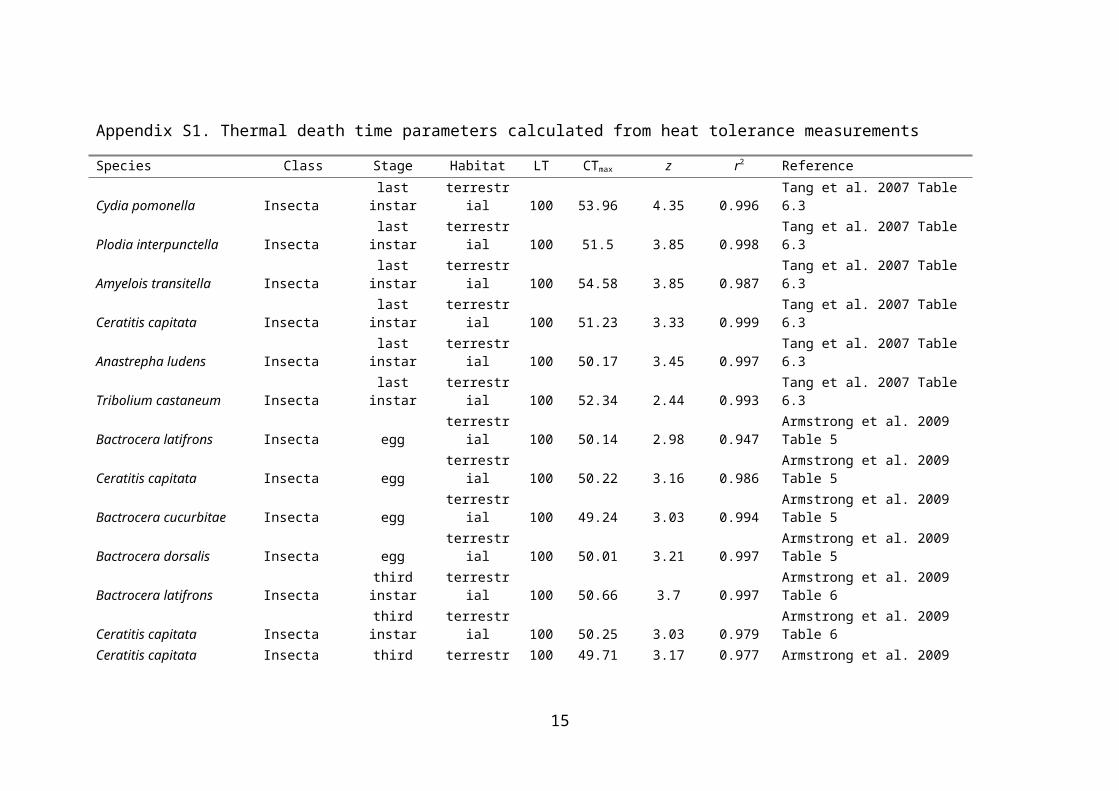
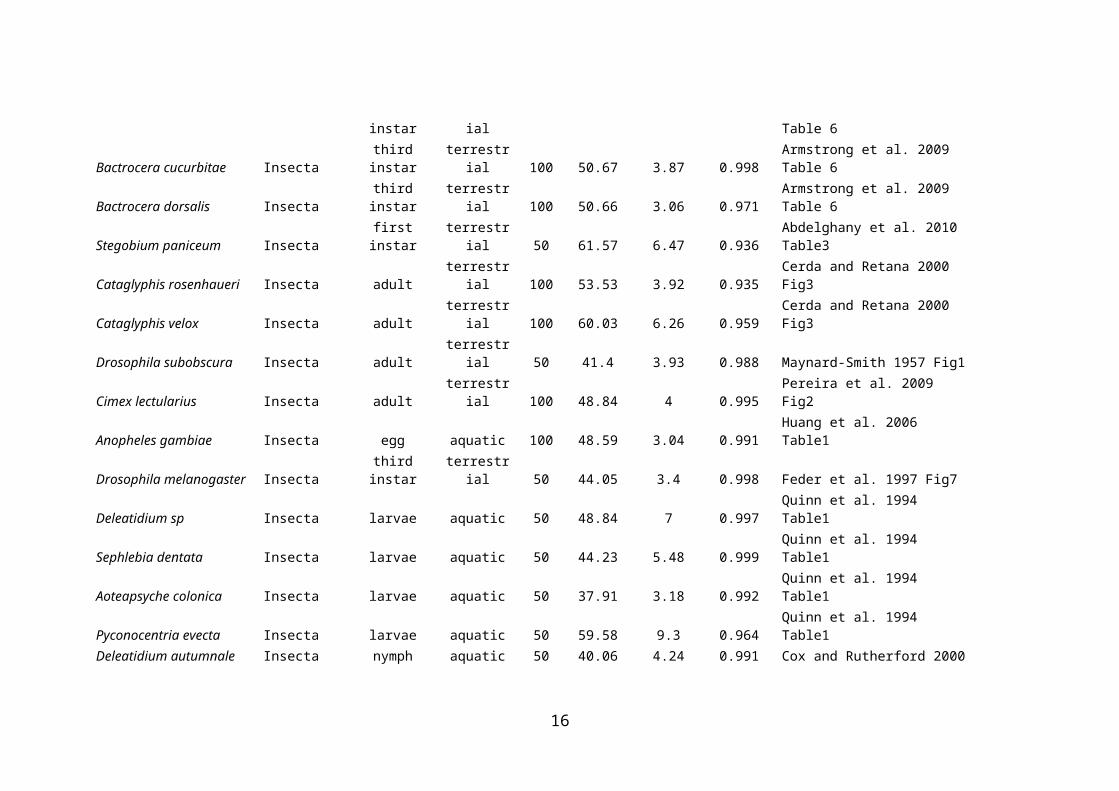
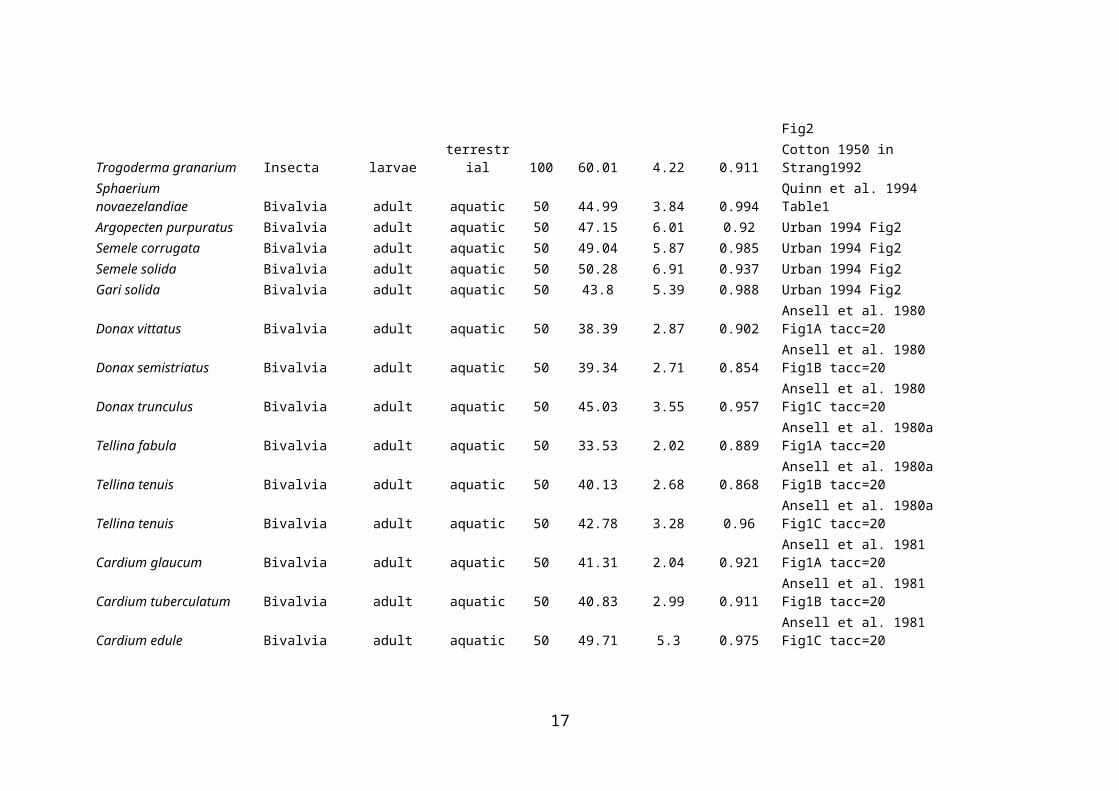
Appendix S1. Thermal death time parameters calculated from heat tolerance measurements
Species Class Stage Habitat LT CTmax z r2 ReferenceCydia pomonella Insecta last instar terrestrial 100 53.96 4.35 0.996 Tang et al. 2007 Table 6.3Plodia interpunctella Insecta last instar terrestrial 100 51.5 3.85 0.998 Tang et al. 2007 Table 6.3Amyelois transitella Insecta last instar terrestrial 100 54.58 3.85 0.987 Tang et al. 2007 Table 6.3Ceratitis capitata Insecta last instar terrestrial 100 51.23 3.33 0.999 Tang et al. 2007 Table 6.3Anastrepha ludens Insecta last instar terrestrial 100 50.17 3.45 0.997 Tang et al. 2007 Table 6.3Tribolium castaneum Insecta last instar terrestrial 100 52.34 2.44 0.993 Tang et al. 2007 Table 6.3Bactrocera latifrons Insecta egg terrestrial 100 50.14 2.98 0.947 Armstrong et al. 2009 Table 5Ceratitis capitata Insecta egg terrestrial 100 50.22 3.16 0.986 Armstrong et al. 2009 Table 5Bactrocera cucurbitae Insecta egg terrestrial 100 49.24 3.03 0.994 Armstrong et al. 2009 Table 5Bactrocera dorsalis Insecta egg terrestrial 100 50.01 3.21 0.997 Armstrong et al. 2009 Table 5Bactrocera latifrons Insecta third instar terrestrial 100 50.66 3.7 0.997 Armstrong et al. 2009 Table 6Ceratitis capitata Insecta third instar terrestrial 100 50.25 3.03 0.979 Armstrong et al. 2009 Table 6Ceratitis capitata Insecta third instar terrestrial 100 49.71 3.17 0.977 Armstrong et al. 2009 Table 6Bactrocera cucurbitae Insecta third instar terrestrial 100 50.67 3.87 0.998 Armstrong et al. 2009 Table 6Bactrocera dorsalis Insecta third instar terrestrial 100 50.66 3.06 0.971 Armstrong et al. 2009 Table 6Stegobium paniceum Insecta first instar terrestrial 50 61.57 6.47 0.936 Abdelghany et al. 2010 Table3Cataglyphis rosenhaueri Insecta adult terrestrial 100 53.53 3.92 0.935 Cerda and Retana 2000 Fig3Cataglyphis velox Insecta adult terrestrial 100 60.03 6.26 0.959 Cerda and Retana 2000 Fig3Drosophila subobscura Insecta adult terrestrial 50 41.4 3.93 0.988 Maynard-Smith 1957 Fig1Cimex lectularius Insecta adult terrestrial 100 48.84 4 0.995 Pereira et al. 2009 Fig2Anopheles gambiae Insecta egg aquatic 100 48.59 3.04 0.991 Huang et al. 2006 Table1Drosophila melanogaster Insecta third instar terrestrial 50 44.05 3.4 0.998 Feder et al. 1997 Fig7Deleatidium sp Insecta larvae aquatic 50 48.84 7 0.997 Quinn et al. 1994 Table1Sephlebia dentata Insecta larvae aquatic 50 44.23 5.48 0.999 Quinn et al. 1994 Table1Aoteapsyche colonica Insecta larvae aquatic 50 37.91 3.18 0.992 Quinn et al. 1994 Table1Pyconocentria evecta Insecta larvae aquatic 50 59.58 9.3 0.964 Quinn et al. 1994 Table1Deleatidium autumnale Insecta nymph aquatic 50 40.06 4.24 0.991 Cox and Rutherford 2000 Fig2
10
Trogoderma granarium Insecta larvae terrestrial 100 60.01 4.22 0.911 Cotton 1950 in Strang1992Sphaerium novaezelandiae Bivalvia adult aquatic 50 44.99 3.84 0.994 Quinn et al. 1994 Table1Argopecten purpuratus Bivalvia adult aquatic 50 47.15 6.01 0.92 Urban 1994 Fig2Semele corrugata Bivalvia adult aquatic 50 49.04 5.87 0.985 Urban 1994 Fig2Semele solida Bivalvia adult aquatic 50 50.28 6.91 0.937 Urban 1994 Fig2Gari solida Bivalvia adult aquatic 50 43.8 5.39 0.988 Urban 1994 Fig2Donax vittatus Bivalvia adult aquatic 50 38.39 2.87 0.902 Ansell et al. 1980 Fig1A tacc=20Donax semistriatus Bivalvia adult aquatic 50 39.34 2.71 0.854 Ansell et al. 1980 Fig1B tacc=20Donax trunculus Bivalvia adult aquatic 50 45.03 3.55 0.957 Ansell et al. 1980 Fig1C tacc=20Tellina fabula Bivalvia adult aquatic 50 33.53 2.02 0.889 Ansell et al. 1980a Fig1A tacc=20Tellina tenuis Bivalvia adult aquatic 50 40.13 2.68 0.868 Ansell et al. 1980a Fig1B tacc=20Tellina tenuis Bivalvia adult aquatic 50 42.78 3.28 0.96 Ansell et al. 1980a Fig1C tacc=20Cardium glaucum Bivalvia adult aquatic 50 41.31 2.04 0.921 Ansell et al. 1981 Fig1A tacc=20Cardium tuberculatum Bivalvia adult aquatic 50 40.83 2.99 0.911 Ansell et al. 1981 Fig1B tacc=20Cardium edule Bivalvia adult aquatic 50 49.71 5.3 0.975 Ansell et al. 1981 Fig1C tacc=20Ameiurus nebulosus Actinopterygii adult aquatic 50 36.4 1.35 0.987 Brett 1956 Fig2Semotilus atromaculatus Actinopterygii adult aquatic 50 35.86 1.9 0.969 Brett 1956 Fig2Rhinichthys atratulus Actinopterygii adult aquatic 50 34.57 1.32 0.984 Brett 1956 Fig2Salmo salar Actinopterygii adult aquatic 50 32.52 1.78 0.988 Brett 1956 Fig2Salvelinus frontinalis Actinopterygii adult aquatic 50 31.94 2 0.993 Brett 1956 Fig2Oncorhynchus tshawytscha Actinopterygii adult aquatic 50 30.15 1.34 0.955 Brett 1956 Fig2Cristivomer namaycush Actinopterygii adult aquatic 50 29.36 1.47 0.993 Brett 1956 Fig2Trematomus bernacchii Actinopterygii adult aquatic 50 16.99 3.1 0.972 Somero and DeVries 1967 Table1Trematomus hansoni Actinopterygii adult aquatic 50 16.96 3.03 0.932 Somero and DeVries 1967 Table1Trematomus borchgrevinki Actinopterygii adult aquatic 50 17.87 3.73 0.974 Somero and DeVries 1967 Table1Salvelinus confluentus Actinopterygii juvenile aquatic 50 34.87 2.83 0.999 Selong et al. 2011 Fig1Fundulus parvipinnis Actinopterygii adult aquatic 50 42.14 1.65 0.991 Doudoroff 1945 Fig2Girella nigricans Actinopterygii young aquatic 50 38.15 2.09 0.995 Doudoroff 1945 Fig2Atherinops affinis Actinopterygii young aquatic 50 34.59 0.82 0.967 Doudoroff 1945 Fig2
11
Appendix S2. Thermal death time parameters calculated from cold tolerance measurements
Species Class Stage Habitat LT CTmin z’ r2 ReferenceTribolium castaneum Insecta all terrestrial 50 -85.17 17.09 0.916 Fields 1992 Fig1Cryptolestes ferrugineus Insecta all terrestrial 50 -100.96 20.60 0.992 Fields 1992 Fig1Sitophilus granarius Insecta all terrestrial 50 -35.26 8.25 0.988 Fields 1992 Fig1Alphitobius diaperinus Insecta adult terrestrial 50 -33.05 9.36 0.934 Renault et al. 2004 Fig2Lasioderma serricone Insecta egg terrestrial 50 -23.05 7.07 0.995 Imai and Harada Table1Lasioderma serricone Insecta larvae terrestrial 50 -33.03 9.21 0.921 Imai and Harada Table1Lasioderma serricone Insecta pupae terrestrial 50 -26.44 7.36 0.874 Imai and Harada Table1Lasioderma serricone Insecta adult terrestrial 50 -24.35 6.47 0.966 Imai and Harada Table1Stegobium paniceum Insecta adult terrestrial 50 -22.19 6.02 0.961 Abdelghany et al. 2010 Table4Callosobruchus maculatus Insecta pupae terrestrial 50 -27.94 6.42 0.958 Loganathan et al. 2011 Tables4,5Callosobruchus maculatus Insecta egg terrestrial 50 -32.58 9.25 0.966 Loganathan et al. 2011 Tables4,5Oryzaephilus surinamensis Insecta adult terrestrial 100 -107.16 23.03 0.965 Mathlein 1961 in Strang 1992Sitophilus granarius Insecta adult terrestrial 100 -36.12 7.11 0.937 Back and Cotton1924 in Strang 1992Sitophilus granarius Insecta egg terrestrial 100 -59.23 12.65 0.915 Mathlein 1961 in Strang 1992Sitophilus granarius Insecta larvae terrestrial 100 -48.78 9.79 0.96 Mathlein 1961 in Strang 1992Sitophilus oryzae Insecta adult terrestrial 100 -38.98 8.98 0.965 Back and Cotton1924 in Strang 1992Tribolium castaneum Insecta all terrestrial 100 -35.28 7.70 0.934 Cotton 1950 in Strang 1992Tribolium confusum Insecta all terrestrial 100 -34.31 7.37 0.917 Cotton 1950 in Strang 1992Tineola bisselliella Insecta egg terrestrial 100 -47.32 9.73 0.965 Back and Cotton 1927 in Strang 1992Tineola bisselliella Insecta larvae terrestrial 100 -49.18 8.71 0.878 Back and Cotton 1927 in Strang 1992Anagasta kuhniella Insecta all terrestrial 100 -40.23 7.21 0.952 Cotton 1950 in Strang 1992Plodia interpunctuella Insecta all terrestrial 100 -34.94 6.11 0.95 Cotton 1950 in Strang 1992
12

References
Abdelghany, A.Y., Awadalla, S.S., Abdel-Baky, N.F., El-Syrafi, H.A, & Fields, P.G.
(2010) Effect of high and low temperatures on the drugstore beetle
(Coleoptera: Anobiidae). J. Econ. Entomol., 103, 1909–1914.
Ansell, A.D., Barnett, P.R.O., Bodoy, A. & Massé, H. (1980) Upper Temperature
Tolerances of Some European Molluscs II. Donax vittatus, D. semistriatus and
D. trunculus. Mar. Biol., 58, 41-46.
Ansell, A.D., Barnett, P.R.O., Bodoy, A. & Massé, H. (1980a) Upper Temperature
Tolerances of Some European Molluscs. I Tellina fabula and T. tenuis. Mar.
Biol., 58, 33-39.
Ansell, A.D., Barnett, P.R.O., Bodoy, A. & Massé, H. (1981) Upper Temperature
Tolerances of Some European Molluscs. III. Cardium glaucum, C.
tuberculatum and C. edule. Mar. Biol., 65, 177-183.
Armstrong, J.W., Tang, J. & Wang, S. (2009) Thermal death kinetics of
Mediterranean, Malasyan, melon and oriental fruit fly (Diptera: Tephritidae)
eggs and third instars. J. Econ. Entomol, 102, 522–532.
Bell, C.J. (1980) The scaling of thermal inertia in lizards. J. Exp. Biol., 86, 79 – 85.
Brett, J.R. (1956) Some principles in the thermal requirements of fishes. Quat. Rev.
Biol., 31, 75-87.
Bulbiy, O.A., Kristensen, T.N., Kellermann, V. & Loeschcke, V. (2012) Humidity
affects genetic architecture of heat resistance in Drosophila melanogaster. J.
Evol. Biol., 25, 1180-1188.
Castañeda, L.E., Calabria, G., Betancourt, L.A., Rezende, E.L. & Santos, M. (2012)
Measurement error in heat tolerance assays. J. Therm. Biol. 37: 432-437.
13

Cerdá, X. & Retana, J. (2000) Alternative strategies by thermophilic ants to cope with
extreme heat: individual versus colony level traits. Oikos, 89, 155 – 163.
Chown, S.L., Jumbam, K.R., Sørensen, J.G. & Terblanche, J.S. (2009) Phenotypic
variance, plasticity and heritability estimates of critical thermal limits depend
on methodological context. Funct. Ecol., 23, 133–140.
Cooper, B.S., Williams, B.H. & Angilletta, M.A. (2008) Unifying indices of heat
tolerance in ectotherms. J. Therm. Biol., 33, 320-323.
Cox, T.J. & Rutherford J.C. (2000) Thermal tolerances of two stream invertebrates
exposed to diumally varying temperature. New Zeal. J. Marin. Freshwat. Res.,
34, 203-208.
Doudoroff, P. (1945) The resiatance and acclimation of marine fishes to temperature
changes. II Experiments with Fundulus and Atherinops. Biol. Bull., 88, 194-
206.
Feder, M.E., Blain, N. & Figureas, H. (1997) Natural thermal stress and heat-shock
protein expression in Drosophila larvae and pupae. Funct. Ecol., 11,90-100.
Fields, P.G. (1992) The control of stored-product insects and mites with extreme
temperatures. J. Stor. Prod. Res., 28, 89-118.
Huang, J., Walker, E.D, Vulule, J. & Miller, J.R. (2006) Daily temperature profiles in
and around Western Kenyan larval habitats of Anopheles gambiae as related to
egg mortality. Malaria Journal, 5,87.
Huey, R.B., Crill, W.D., Kingsolver, J.G. & Weber, K.E. (1992) A method for rapid
measurement of heat or cold resistance of small insects. Funct. Ecol., 6, 489–
494.
14
Imai, T. & Harada, H. (2006) Low-temperature as an alternative to fumigation to
disinfest stored tobacco of the cigarette beetle, Lasioderma serricorne (F.)
(Coleoptera: Anobiidae). Appl. Entomol. Zool., 41, 87-91.
Kimura, M.T. (2004) Cold and heat tolerance of drosophilid flies with reference to
their latitudinal distributions. Oecologia, 140, 442–449.
Lactin, D.J. & Johnson, D.L. (1998) Convective heat loss and change in body
temperature of grasshopper and locust nymphs: relative importance of wind
speed, insect size and insect orientation. J. Therm. Biol., 23, 5 – 13.
Loganathan, M., Jayas, D.S., Fields, P.G. & White, N.D.G. (2011) Low and high
temperatures for the control of cowpea beetle, Callosobruchus maculatus (F.)
(coleoptera: Bruchidae) in chickpeas. J. Stor. Prod. Res., 47, 244 – 248.
Lutterschmidt, W. I. & Hutchinson, V. H. (1997) The critical thermal maximum: data
to support the onset of spasms as the definitive end point. Can. J. Zool., 75,
1553-1560.
Maynard Smith, J. (1957) Temperature tolerance and acclimatization in Drosophila
subobscura. J. Exp. Biol., 34, 85-96.
Mitchell, K.A.& Hoffmann, A.A. (2010) Thermal ramping rate influences
evolutionary potential and species differences for upper thermal limits in
Drosophila. Funct. Ecol., 24, 694-700.
Overgaard, J., Kristensen, T.N., Hoffmann, A.A., Mitchell, K.A. & Hoffmann, A.A.
(2011) Thermal tolerance in widespread and tropical Drosophila species: does
phenotypic plasticity increase with latitude? Am. Nat., 178, S80–S96
Overgaard, J., Kristensen, T.N. & Sorensen, J.G. (2012) Validity of thermal ramping
assays used to assess thermal tolerance in arthropods. PloS ONE 7: e32758.
15
Parkash, P., Sharma, V. & Kalra, B. (2010) Correlated changes in thermotoler- ance
traits and body color phenotypes in montane populations of Drosophila
melanogaster: analysis of within- and between-population variations. J. Zool.,
280, 49–59.
Pereira, R.M., Koehler, P.G., Pfiester, M. & Walker, W. (2009) Lethal effects of heat
and use of localized heat treatment for control of bed bug infestations. J. Econ.
Entomol., 102, 1182-1188.
Quinn, J.M., Steele, G.L., hickey, C.W. & Vickers, M.L. (1994) Upper thermal
tolerances of twelve New Zealand stream invertebrate species. New Zeal. J.
Marin. Freshwat. Res., 28, 391-397.
Renault, D., Nedved, O., Hervant, F. & Vernon, P. (2004) The importance of
fluctuating thermal regimes for repairing chill injuries in the tropical beetle
Alphitobius diaperinus (Coleoptera: Tenebrionidae) during exposure to low
temperature. Physiol. Entomol., 29, 139-145.
Rezende, E. L., Tejedo, M. & Santos, M. (2011) Estimating the adaptive potential of
critical thermal limits: methodological problems and evolutionary
implications. Funct. Ecol., 25, 111 – 121.
Rezende, E.L. & Santos, M. (2012) Comment on ‘Ecologically relevant measures of
tolerance to potentially lethal temperatures’. J. Exp. Biol., 215, 702 – 703.
Ribeiro, P.L., Camacho, A. & Navas, C.A. (2012) Considerations for assessing
maximum critical temperatures in small ectothermic animals: insights from
leaf-cutting ants. PloS ONE, 7, e32083.
Santos, M., Castañeda, L. E. & Rezende, E. L. (2011) Making sense of heat tolerance
estimates in ectotherms: lessons from Drosophila. Funct. Ecol., 25, 1169 –
1180.
16
Selong, J.H., McMahon, T.E., Zale, A.V. & Barrows, F.T. (2011) Effect of
temperature on growth and survival of bull trout, with application of an
improved method for determining thermal tolerance in fishes. Trans. Am. Fish.
Soc., 130, 1026-1037.
Sgrò, C.M., Overgaard, J., Kristensen, T.N., Mitchell, K.A., Cockerell, F.E. &
Hoffmann, A.A. (2010) A comprehensive assessment of geographic varia- tion
in heat tolerance and hardening capacity in populations of Drosophila
melanogaster from eastern Australia. J. Evol. Biol., 23, 2484–2493.
Somero, G.N. & De Vries A.L. (1967) Temperature tolerance in some arctic fishes.
Science, 156, 257-258.
Stevenson, R.D. (1985) Body size and limits of the daily range of body temperature in
terrestrial ectotherms. Am. Nat., 125, 102-117.
Strang, T. J. K. (1992) A review of published temperatures for the control of pest
insects in museums. Collection Forum, 8, 41-67.
Tang, J., Mitcham, E., Wang, E. & Lurie, S. (2007) Heat treatment for postharvest
pest control. Pp. xiv + 349. Cromwell Press, Trowbridge.
Tang, J., Ikediala, J.N., Wang, S., Hansen, J.D. & Cavalieri, R.P. (2000) High-
temperature-short-time thermal quarantine methods. Postharv. Biol. Technol.,
21, 129 –145.
Terblanche, J.S., Deere, J.A., Clusella-Trullas, S., Janion, C. & Chown, S.L. (2007)
Critical thermal limits depend on methodological context. Proc. Roy. Soc. B,
274, 2935–2942.
Terblanche, J. S., Hoffmann, A. A., Mitchell, K., Rako, L., Le Roux, P. C. and
Chown, S. L. (2011) Ecologically relevant measures of tolerance to potentially
lethal temperatures. J. Exp. Biol., 214, 3713 – 3725.
17

Urban, H.J. (1994) Upper temperature tolerance of ten bivalve species off Peru and
Chile related to El Niño. Mar. Ecol. Prog. Ser., 107,139-145.
Vannier, G. (1994) The thermobiological limits of some freezing tolerant insects: the
supercooling and thermostupor points. Acta Oecologica, 15, 31–42.
18