Embed Size (px)
Citation preview
Geography Compass 9/1 (2015): 14–26, 10.1111/gec3.12193
Geo-awareness, Geo-enablement, Geotechnologies, CitizenScience, and Storytelling: Geography on the World Stage
Joseph J. Kerski*Education Manager, Esri, 1 International Court, Broomfield, Colorado USA
AbstractFive converging global trends – geo-awareness, geo-enablement, geotechnologies, citizen science, andstorytelling– have the potential to offer geography a world audience – attention from education andsociety that may be unprecedented in the history of the discipline. Issues central to geography are nowpart of the global consciousness. Everyday objects are rapidly becoming locatable, and thus able to bemonitored and mapped. Many tools and data sets that were formerly used and examined only bygeographers and other earth and environmental scientists are now in the hands of the general public.Citizens outside academia are becoming involved in contributing data to the scientific community.Multimedia and cloud-based Geographic Information Systems (GIS) have greatly multiplied theattraction that maps have had for centuries to tell stories. But despite these trends bringing opportunityto geography, is geoliteracy becoming increasingly valued? How can educators, researchers, andpractitioners seize the opportunity that these trends seem to present to actively promote geographiccontent knowledge, skills, and perspectives throughout education and society?
Introduction
My aims in this document are three fold. First, I make the case that five converging global trendsare exerting great impact on geography, on education, and on society. Second, in light of thesetrends, I consider whether geoliteracy is becoming increasingly valued. Third, I offer practicalsuggestions to the geography educator, researcher, and practitioner to be able to seize theopportunities that these trends offer for developing geographic knowledge, skills, andperspectives in education and society.
FIVE CONVERGING GLOBAL TRENDS
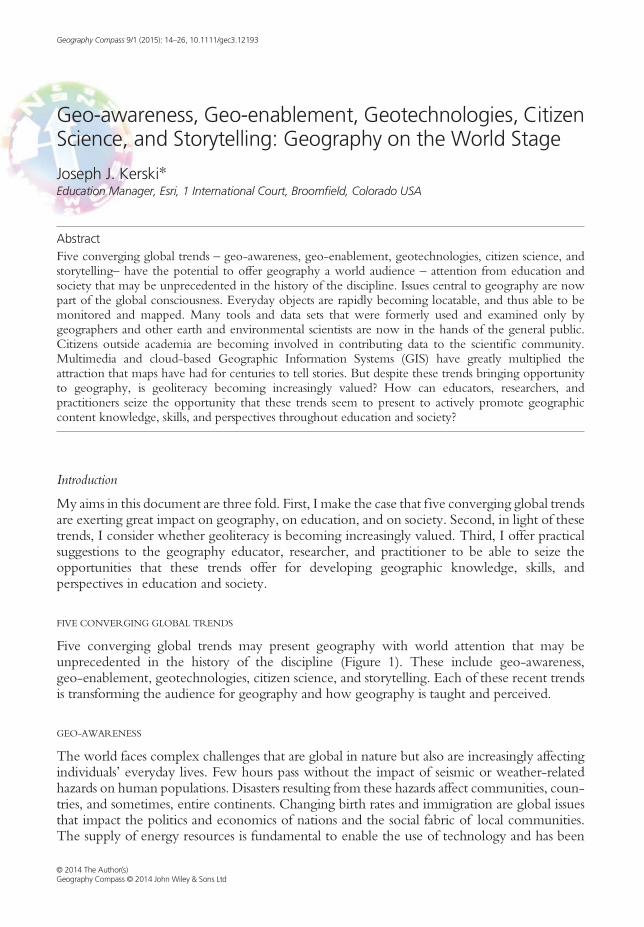
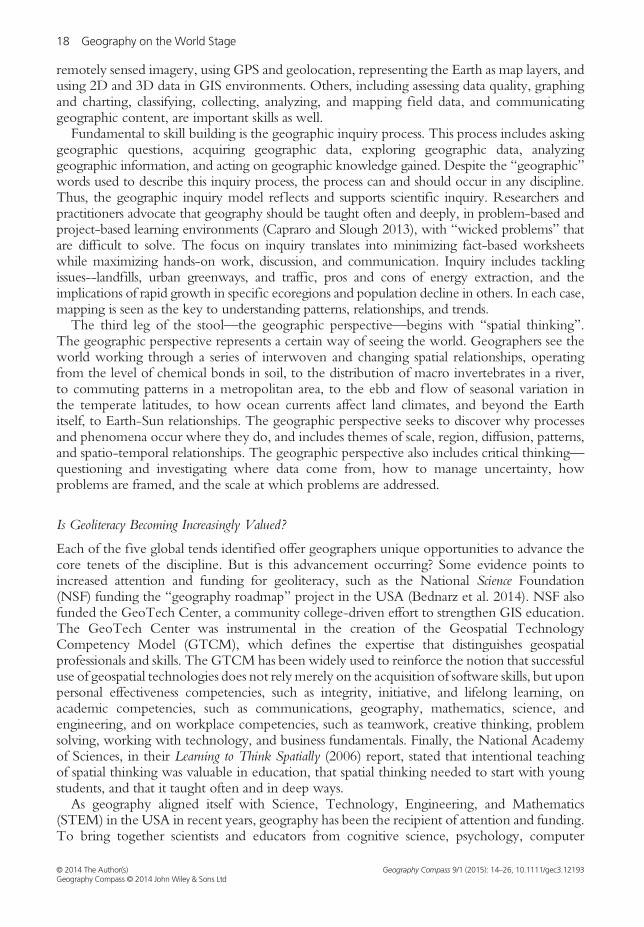
Five converging global trends may present geography with world attention that may beunprecedented in the history of the discipline (Figure 1). These include geo-awareness,geo-enablement, geotechnologies, citizen science, and storytelling. Each of these recent trendsis transforming the audience for geography and how geography is taught and perceived.
GEO-AWARENESS
The world faces complex challenges that are global in nature but also are increasingly affectingindividuals’ everyday lives. Few hours pass without the impact of seismic or weather-relatedhazards on human populations. Disasters resulting from these hazards affect communities, coun-tries, and sometimes, entire continents. Changing birth rates and immigration are global issuesthat impact the politics and economics of nations and the social fabric of local communities.The supply of energy resources is fundamental to enable the use of technology and has been
© 2014 The Author(s)Geography Compass © 2014 John Wiley & Sons Ltd
Fig. 1. Five converging global trends that present geography with new global opportunities.
Geography on the World Stage 15
linked to standards of living and educational attainment. Epidemics and diseases affect specificsegments of society and impact the entire planet in significant ways. Sustaining agricultureand fisheries is critical to food supplies. The transportation of people and products consumesmassive amounts of human time and energy. Issues of water quality and quantity are fundamen-tal to the very existence of humanity. Political instability and violence displace wholepopulations.These challenges have long been some of the fundamental issues that geographers studied.
Yet in the past decade, these challenges have become a part of the public consciousness. Thethemes that have driven geographic thinking and research have in large part become topics ofeveryday conversation. There is a heightened awareness that these issues affect individuals’everyday lives, that they are serious, and that they need to be solved. There is also growingrealization that they all occur somewhere, at multiple scales, with specific spatial distributions,patterns, and linkages; and with temporal and spatial components.
GEO-ENABLEMENT
Societies are rapidly moving to an era where most everything in everyday life will be able to belocated on a map, or “geo-enabled.” From smartphones to tablets and laptops, from webcamsrecording traffic or bird counts to whether car parking lot sensors, from orbiting Earth-imagingsatellites to surface or underground sensors recording water quality, seismicity, and weather,these sensors and devices transmit a latitude–longitude signal, enabled by the coupling of GlobalPositioning Systems (GPS), smartphone towers, and Wi-Fi transmitters. As geo-enablingextends to thermostats, light switches, and appliances in ordinary homes, it contributes to“the internet of things” (Wasik 2013) and “smart cities” (Al-Hader and Rodzi 2009). As thesemeasurements become mapped within Geographic Information Systems (GIS) and remotesensing environments, they become a “nervous system” for the planet (Dangermond 2002).This geo-enablement is taking place at different rates in different areas around the world, leadingto a more uniform access to technology in some areas, and increasing inequalities because ofaccess to devices, bandwidth, and data in other areas.
© 2014 The Author(s)Geography Compass © 2014 John Wiley & Sons Ltd
Geography Compass 9/1 (2015): 14–26, 10.1111/gec3.12193
16 Geography on the World Stage
GEOTECHNOLOGIES
Until recently, satellite imagery, digital maps, aerial photographs, 3D profiles, geodatabases,spatial statistics, and related tools, methods, and data were used largely by those in GIS andscientific fields. Today, millions of maps and satellite images are viewed hourly. Like music,graphics, office tools, and other technologies, GIS has been migrating to a cloud-based“Software as a Service” (SaaS) model. Not only have geographic tools, maps, and spatial databecome instantly available, they can be downloaded, streamed, embedded, changed, andreformatted on devices from smartphones to tablets, in the field, in vehicles, in research labs,in classrooms, and just about everywhere. These digital maps are used in newscasts, web pages,videos, and news feeds, becoming among the most common type of 21st Century media.Geodatabases map and synthesize data coming in from geo-enabled devices and objects, andthrough these objects, the public has become extremely conscious of the value of maps in theireveryday lives.
CITIZEN SCIENCE
The largest part of the “internet of things” sensor network is not electronic sensors, but thegeneral public themselves. In fields such as phenology and bird monitoring, the public has beenengaged for decades in contributing their own observations, but web-based GIS makes it easierfor the general public to contribute data. The general public is also voluntarily and involuntarilyproviding information about their location through the use of cloud-based smartphone andweb applications. Information being fed to cloud-based services offers to make life moreefficient, comfortable, and interesting. Examples include connecting with others through fitnessapps, recommending products matching a person’s purchasing history, and feeding individuals’current speed and location to a regional real-time traffic map so that motorists can avoid snarls.Information about the location of things are of high interest to those providing Internet services.However, even more interesting to service providers are the movements of people, who makeup a seven billion strong sensor network – providing information about the planet as has neverbeen gathered before.
STORYTELLING
For centuries, maps have been valued because they provide a large amount of detail in a smallamount of space, and because of their capacity for telling a story. Telling stories through mapsbegan with describing explored lands in great detail against terra incognita. Today, geographictools, data, and multimedia on the web expand the ability and audience for storytelling throughmaps. Any person with a smartphone or computer can use maps to tell his or her story.Platforms that enable citizens to tell stories through maps include Esri Story Maps (http://
storymaps.arcgis.com), Map Story (http://mapstory.org), and other tools. Today’s story mapsrange in scale, theme, and purpose. From Napoleon’s march to this year’s hurricanes, fromChina’s new highways to where food originates, educators, students, researchers, and the publiccan create their own story maps, through the use of live web maps with text, video, audio,sketches, and photographs. Teaching about the dynamic Earth with dynamic maps seemsparticularly appropriate to many (Hong 2014).This is not the first timewhen geography was afforded great opportunity. DuringWorldWar
II and again during the Cold War and Space Race, a heightened awareness of global affairstranslated into calls for increased frequency and quantitative rigor in geography and Science,Technology, Engineering, and Mathematics (STEM) education. However, these periodstended to be short-lived, and were accompanied by setbacks, such as the closure of many
© 2014 The Author(s)Geography Compass © 2014 John Wiley & Sons Ltd
Geography Compass 9/1 (2015): 14–26, 10.1111/gec3.12193
Geography on the World Stage 17
geography departments in the USA (Dobson 2007). Will the five trends occurring today beenough to generate and sustain the interest of the general public, as well as policymakers andeducational administrators? Will this enable the recognition of geography and the geographicperspective and cement geography as a fundamental, funded, respected subject throughouteducation and in decision making throughout society?
GEOLITERACY
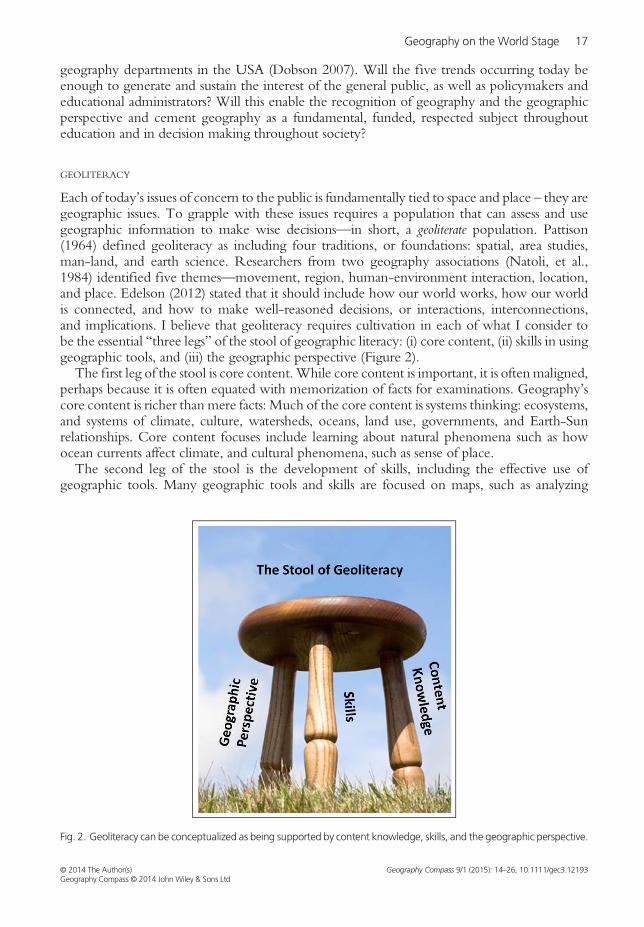
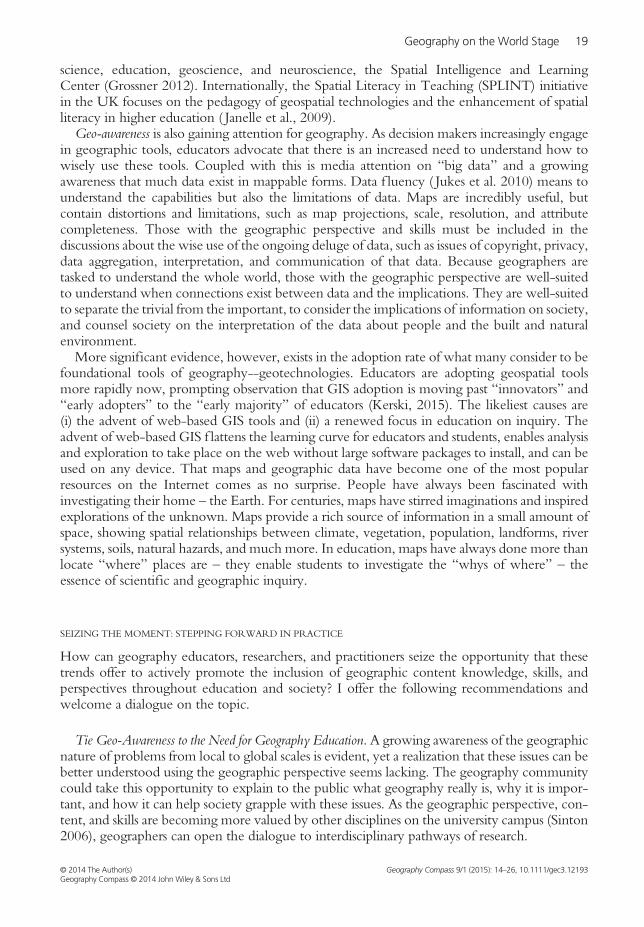
Each of today’s issues of concern to the public is fundamentally tied to space and place – they aregeographic issues. To grapple with these issues requires a population that can assess and usegeographic information to make wise decisions—in short, a geoliterate population. Pattison(1964) defined geoliteracy as including four traditions, or foundations: spatial, area studies,man-land, and earth science. Researchers from two geography associations (Natoli, et al.,1984) identified five themes—movement, region, human-environment interaction, location,and place. Edelson (2012) stated that it should include how our world works, how our worldis connected, and how to make well-reasoned decisions, or interactions, interconnections,and implications. I believe that geoliteracy requires cultivation in each of what I consider tobe the essential “three legs” of the stool of geographic literacy: (i) core content, (ii) skills in usinggeographic tools, and (iii) the geographic perspective (Figure 2).The first leg of the stool is core content.While core content is important, it is oftenmaligned,
perhaps because it is often equated with memorization of facts for examinations. Geography’score content is richer than mere facts: Much of the core content is systems thinking: ecosystems,and systems of climate, culture, watersheds, oceans, land use, governments, and Earth-Sunrelationships. Core content focuses include learning about natural phenomena such as howocean currents affect climate, and cultural phenomena, such as sense of place.The second leg of the stool is the development of skills, including the effective use of
geographic tools. Many geographic tools and skills are focused on maps, such as analyzing
Fig. 2. Geoliteracy can be conceptualized as being supported by content knowledge, skills, and the geographic perspective.
© 2014 The Author(s)Geography Compass © 2014 John Wiley & Sons Ltd
Geography Compass 9/1 (2015): 14–26, 10.1111/gec3.12193
18 Geography on the World Stage
remotely sensed imagery, using GPS and geolocation, representing the Earth as map layers, andusing 2D and 3D data in GIS environments. Others, including assessing data quality, graphingand charting, classifying, collecting, analyzing, and mapping field data, and communicatinggeographic content, are important skills as well.Fundamental to skill building is the geographic inquiry process. This process includes asking
geographic questions, acquiring geographic data, exploring geographic data, analyzinggeographic information, and acting on geographic knowledge gained. Despite the “geographic”words used to describe this inquiry process, the process can and should occur in any discipline.Thus, the geographic inquiry model ref lects and supports scientific inquiry. Researchers andpractitioners advocate that geography should be taught often and deeply, in problem-based andproject-based learning environments (Capraro and Slough 2013), with “wicked problems” thatare difficult to solve. The focus on inquiry translates into minimizing fact-based worksheetswhile maximizing hands-on work, discussion, and communication. Inquiry includes tacklingissues--landfills, urban greenways, and traffic, pros and cons of energy extraction, and theimplications of rapid growth in specific ecoregions and population decline in others. In each case,mapping is seen as the key to understanding patterns, relationships, and trends.The third leg of the stool—the geographic perspective—begins with “spatial thinking”.
The geographic perspective represents a certain way of seeing the world. Geographers see theworld working through a series of interwoven and changing spatial relationships, operatingfrom the level of chemical bonds in soil, to the distribution of macro invertebrates in a river,to commuting patterns in a metropolitan area, to the ebb and f low of seasonal variation inthe temperate latitudes, to how ocean currents affect land climates, and beyond the Earthitself, to Earth-Sun relationships. The geographic perspective seeks to discover why processesand phenomena occur where they do, and includes themes of scale, region, diffusion, patterns,and spatio-temporal relationships. The geographic perspective also includes critical thinking—questioning and investigating where data come from, how to manage uncertainty, howproblems are framed, and the scale at which problems are addressed.
Is Geoliteracy Becoming Increasingly Valued?
Each of the five global tends identified offer geographers unique opportunities to advance thecore tenets of the discipline. But is this advancement occurring? Some evidence points toincreased attention and funding for geoliteracy, such as the National Science Foundation(NSF) funding the “geography roadmap” project in the USA (Bednarz et al. 2014). NSF alsofunded the GeoTech Center, a community college-driven effort to strengthen GIS education.The GeoTech Center was instrumental in the creation of the Geospatial TechnologyCompetency Model (GTCM), which defines the expertise that distinguishes geospatialprofessionals and skills. The GTCMhas been widely used to reinforce the notion that successfuluse of geospatial technologies does not relymerely on the acquisition of software skills, but uponpersonal effectiveness competencies, such as integrity, initiative, and lifelong learning, onacademic competencies, such as communications, geography, mathematics, science, andengineering, and on workplace competencies, such as teamwork, creative thinking, problemsolving, working with technology, and business fundamentals. Finally, the National Academyof Sciences, in their Learning to Think Spatially (2006) report, stated that intentional teachingof spatial thinking was valuable in education, that spatial thinking needed to start with youngstudents, and that it taught often and in deep ways.As geography aligned itself with Science, Technology, Engineering, and Mathematics
(STEM) in the USA in recent years, geography has been the recipient of attention and funding.To bring together scientists and educators from cognitive science, psychology, computer
© 2014 The Author(s)Geography Compass © 2014 John Wiley & Sons Ltd
Geography Compass 9/1 (2015): 14–26, 10.1111/gec3.12193
Geography on the World Stage 19
science, education, geoscience, and neuroscience, the Spatial Intelligence and LearningCenter (Grossner 2012). Internationally, the Spatial Literacy in Teaching (SPLINT) initiativein the UK focuses on the pedagogy of geospatial technologies and the enhancement of spatialliteracy in higher education ( Janelle et al., 2009).Geo-awareness is also gaining attention for geography. As decision makers increasingly engage
in geographic tools, educators advocate that there is an increased need to understand how towisely use these tools. Coupled with this is media attention on “big data” and a growingawareness that much data exist in mappable forms. Data f luency ( Jukes et al. 2010) means tounderstand the capabilities but also the limitations of data. Maps are incredibly useful, butcontain distortions and limitations, such as map projections, scale, resolution, and attributecompleteness. Those with the geographic perspective and skills must be included in thediscussions about the wise use of the ongoing deluge of data, such as issues of copyright, privacy,data aggregation, interpretation, and communication of that data. Because geographers aretasked to understand the whole world, those with the geographic perspective are well-suitedto understand when connections exist between data and the implications. They are well-suitedto separate the trivial from the important, to consider the implications of information on society,and counsel society on the interpretation of the data about people and the built and naturalenvironment.More significant evidence, however, exists in the adoption rate of what many consider to be
foundational tools of geography--geotechnologies. Educators are adopting geospatial toolsmore rapidly now, prompting observation that GIS adoption is moving past “innovators” and“early adopters” to the “early majority” of educators (Kerski, 2015). The likeliest causes are(i) the advent of web-based GIS tools and (ii) a renewed focus in education on inquiry. Theadvent of web-based GIS f lattens the learning curve for educators and students, enables analysisand exploration to take place on the web without large software packages to install, and can beused on any device. That maps and geographic data have become one of the most popularresources on the Internet comes as no surprise. People have always been fascinated withinvestigating their home – the Earth. For centuries, maps have stirred imaginations and inspiredexplorations of the unknown. Maps provide a rich source of information in a small amount ofspace, showing spatial relationships between climate, vegetation, population, landforms, riversystems, soils, natural hazards, and much more. In education, maps have always done more thanlocate “where” places are – they enable students to investigate the “whys of where” – theessence of scientific and geographic inquiry.
SEIZING THE MOMENT: STEPPING FORWARD IN PRACTICE
How can geography educators, researchers, and practitioners seize the opportunity that thesetrends offer to actively promote the inclusion of geographic content knowledge, skills, andperspectives throughout education and society? I offer the following recommendations andwelcome a dialogue on the topic.
Tie Geo-Awareness to the Need for Geography Education. A growing awareness of the geographicnature of problems from local to global scales is evident, yet a realization that these issues can bebetter understood using the geographic perspective seems lacking. The geography communitycould take this opportunity to explain to the public what geography really is, why it is impor-tant, and how it can help society grapple with these issues. As the geographic perspective, con-tent, and skills are becoming more valued by other disciplines on the university campus (Sinton2006), geographers can open the dialogue to interdisciplinary pathways of research.
© 2014 The Author(s)Geography Compass © 2014 John Wiley & Sons Ltd
Geography Compass 9/1 (2015): 14–26, 10.1111/gec3.12193
20 Geography on the World Stage
Contribute to the Dialogue About Issues Surrounding Geo-enablement. Geographers should activelycontribute to the discussions that are in the public consciousness about the implications ofgeo-enablement, such as location privacy and crowdsourcing. They should also demonstratehow geography education can help foster skills in handling and interpreting the deluge of datathat ensues from geo-enablement.Emphasize that maps are not just reference documents. Many regard maps largely as reference
documents. Geographers must demonstrate how maps can be a doorway to discovery aboutthe physical and cultural world and local communities in which we live.Emphasize that digital maps are usually more useful than paper maps. Because of these changes and
the increased demand for base data for use in GIS, paper maps are limited; they have been con-verted into digital form to expand their use for new applications. Geographers can discuss withtheir students the advantages and challenges of paper maps and digital maps.Maps are not just for geographers. Maps are useful to broad sectors of society, such as an
epidemiologist studying the spread of diseases, climatologists studying climate change, andbusinesspersons siting new franchises. Maps are essential tools for studying these issues and forsolving real problems.Model effective use of geotechnologies in teaching, research, and other applications. Geographers can use
the democratization of geotechnologies to explain why and how skills in using these tools areessential to many careers and everyday tasks.Engage the Citizen Science Community. Geographers can use the energy, expertise, and size of
the citizen science community to illustrate why phenomena can be understood morecompletely when it is mapped. GIS provides a framework that enables the management ofthe large volume of data generated by the citizen science community.Promote Civic Engagement. Geographers can use citizen science, fieldwork, and geotechnologies
to cultivate a culture of civic engagement, where volunteer efforts are made more visible andlocal, including students want to contribute to their own community.Tell Stories withMaps. Geographers can take advantage of the longstanding interest that people
have had with maps, and the equally rich tradition of telling stories, to use web-based dynamicmapping tools engage the general public.Focus on Change. Nearly all issues and problems have a change component. Because the
Earth is changing, a platform to map that change that also is dynamic is the perfect complement,and that is what web based mapping offers.Focus on Connections to Educational Content Standards. For the trends identified above to be
embraced in educational systems around the world, the activities based on them need to befirmly and demonstrably anchored in content standards.Focus on Workforce Needs. Focusing on workforce needs helps make education more relevant
to society. The Geographic Information Science and Technology’s Body of Knowledge (Dibiase et al.,2007) and the Geopatial Technology Competency Model help guide course planning. ThePartnerships for 21st Century Skills (www.p21.org) documents can help ensure that relevant skillsare taught in these programs.Focus on Career Skills. Geotechnologies were identified by the US Department of Labor
(Gewin 2004) as one of three major growth fields for the 21st Century. The use of GIS andweb mapping technologies builds skills in technology, organization, communication, criticalthinking, and other skills needed by government agencies, the private sector, academia, andnonprofit organizations.Help Students to Engage with the Tools. The bulk of geotechnology training in secondary and univer-
sity education over the past 20years has been geared towards educators, rather than students. Whilethis has the advantage of working with professionals who in turn could impact thousands of others,educators must realize that it is even more important for the students to learn how to use these tools.
© 2014 The Author(s)Geography Compass © 2014 John Wiley & Sons Ltd
Geography Compass 9/1 (2015): 14–26, 10.1111/gec3.12193
Geography on the World Stage 21
Engage the Research Community. For educators and policymakers to be convinced that it isworth their time and finances to invest in geographic perspectives, geography content, andgeospatial technologies for teaching and learning, a research base needs to be solidly developed.While some studies have investigated the effectiveness and implementation of geographicperspectives, content, and skills, much remains to be studied. Research is needed in thedevelopment and evaluation of assessment instruments, and in the most effective strategies forteaching and learning with geospatial technologies, particularly web-based tools.Don’t Neglect the Educational Policymakers. To effect change in education, it is important that
policymakers are convinced that teaching and learning geographic concepts, skills, and toolsbring value, substance, and interest into education. They also need to be convinced that it willhelp them achieve their policy goals, including increased student performance, retention andgraduation rates, critical thinking, and problem-solving ability.
TEACHING AND LEARNING WITH WEB MAPPING TOOLS
The advent of today’s geotechnologies affords numerous opportunities for the educator andstudent to analyze diverse phenomena – from population distribution to biomes – at scales fromlocal to global, over many time periods. However, determining which resources and tools aremost valuable for instruction can be confusing. Let us focus on a few excellent places to start,and model how to use these resources in education.
Methods of incorporating inquiry through Web mapping
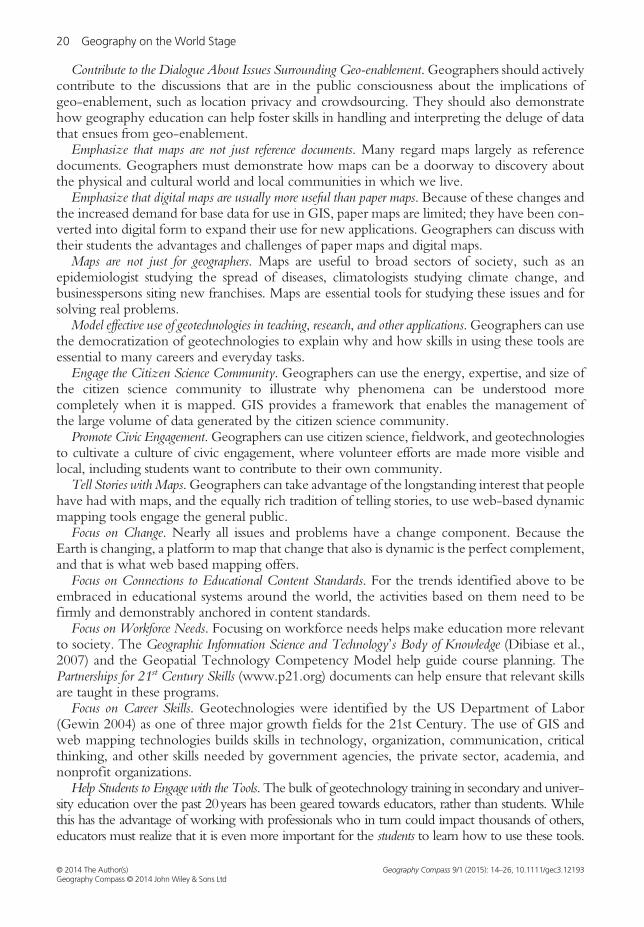
Because the Earth is monitored as never before, satellite images and aerial photographs are oftencollected before, during, and after natural disasters or other Earth-changing events. Forexample, using the USGS Coastal resources at http://coastal.er.usgs.gov/hurricanes/katrina/enables discussions about impact, land use, preparedness, and policy, in this case, aboutHurricane Katrina (Figure 3).Educators can compare historical to current satellite images over a 40-year time span using the
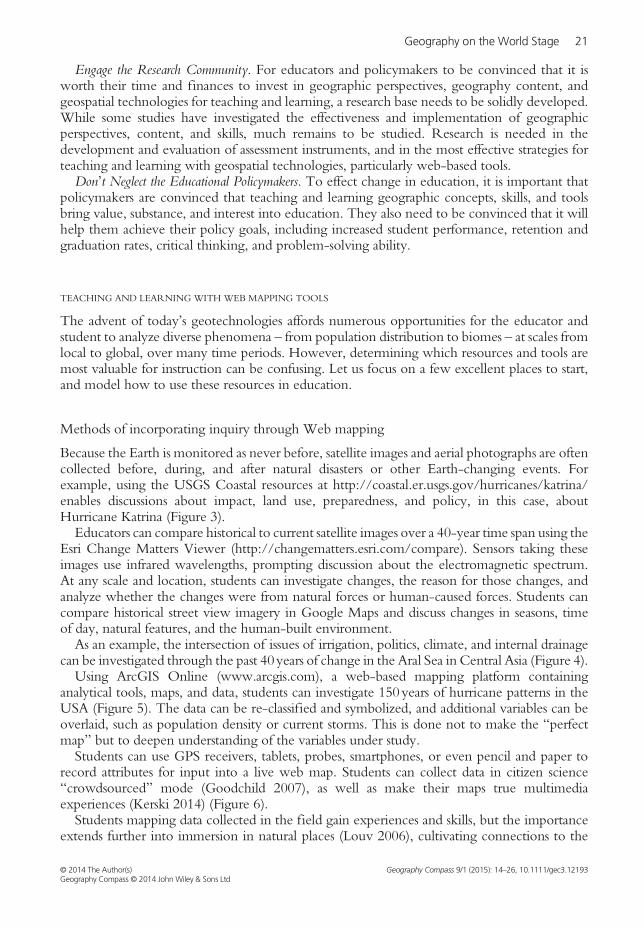
Esri Change Matters Viewer (http://changematters.esri.com/compare). Sensors taking theseimages use infrared wavelengths, prompting discussion about the electromagnetic spectrum.At any scale and location, students can investigate changes, the reason for those changes, andanalyze whether the changes were from natural forces or human-caused forces. Students cancompare historical street view imagery in Google Maps and discuss changes in seasons, timeof day, natural features, and the human-built environment.As an example, the intersection of issues of irrigation, politics, climate, and internal drainage
can be investigated through the past 40years of change in the Aral Sea in Central Asia (Figure 4).Using ArcGIS Online (www.arcgis.com), a web-based mapping platform containing
analytical tools, maps, and data, students can investigate 150years of hurricane patterns in theUSA (Figure 5). The data can be re-classified and symbolized, and additional variables can beoverlaid, such as population density or current storms. This is done not to make the “perfectmap” but to deepen understanding of the variables under study.Students can use GPS receivers, tablets, probes, smartphones, or even pencil and paper to
record attributes for input into a live web map. Students can collect data in citizen science“crowdsourced” mode (Goodchild 2007), as well as make their maps true multimediaexperiences (Kerski 2014) (Figure 6).Students mapping data collected in the field gain experiences and skills, but the importance
extends further into immersion in natural places (Louv 2006), cultivating connections to the
© 2014 The Author(s)Geography Compass © 2014 John Wiley & Sons Ltd
Geography Compass 9/1 (2015): 14–26, 10.1111/gec3.12193
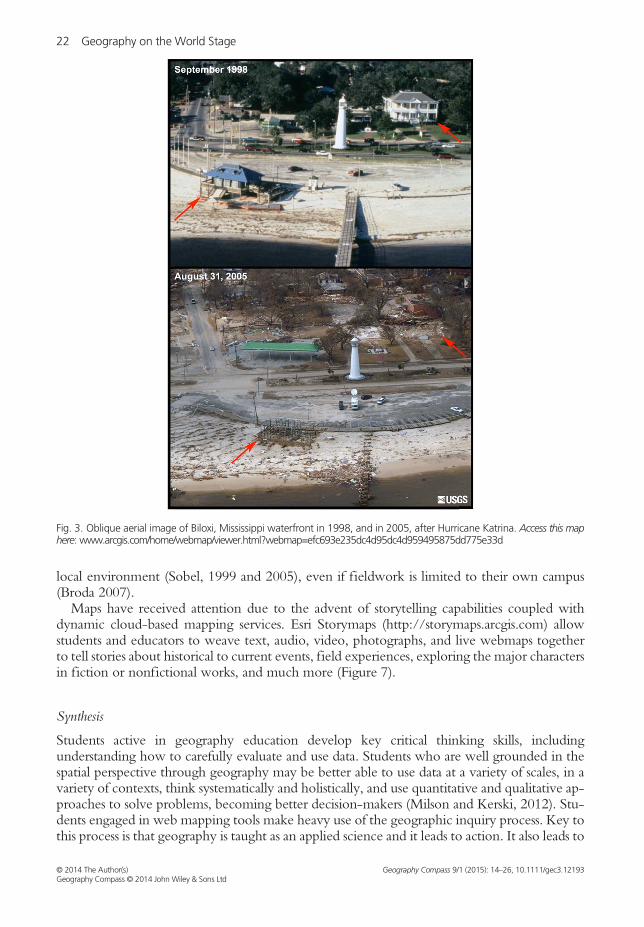
Fig. 3. Oblique aerial image of Biloxi, Mississippi waterfront in 1998, and in 2005, after Hurricane Katrina. Access this maphere: www.arcgis.com/home/webmap/viewer.html?webmap=efc693e235dc4d95dc4d959495875dd775e33d
22 Geography on the World Stage
local environment (Sobel, 1999 and 2005), even if fieldwork is limited to their own campus(Broda 2007).Maps have received attention due to the advent of storytelling capabilities coupled with
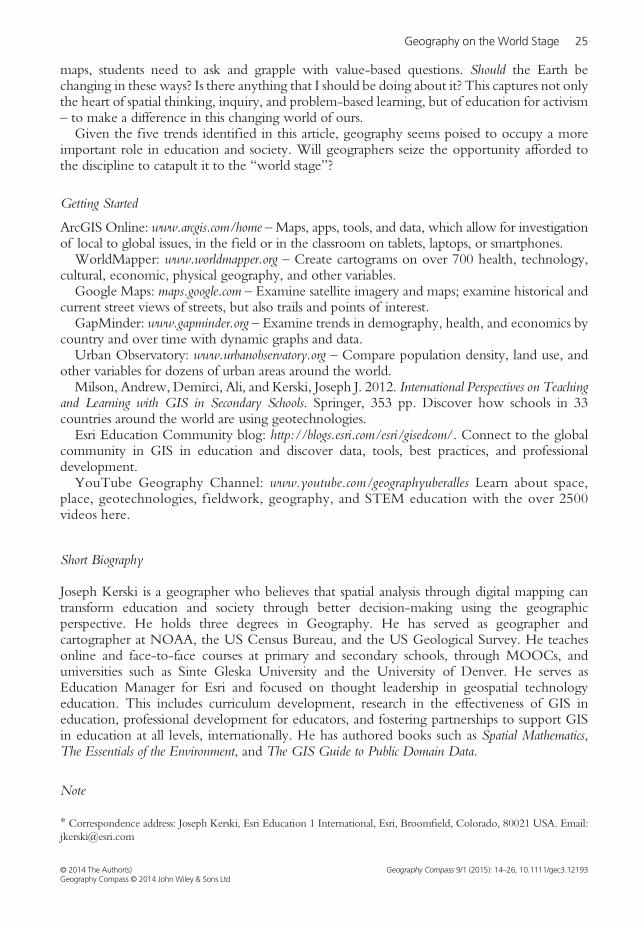
dynamic cloud-based mapping services. Esri Storymaps (http://storymaps.arcgis.com) allowstudents and educators to weave text, audio, video, photographs, and live webmaps togetherto tell stories about historical to current events, field experiences, exploring the major charactersin fiction or nonfictional works, and much more (Figure 7).
Synthesis
Students active in geography education develop key critical thinking skills, includingunderstanding how to carefully evaluate and use data. Students who are well grounded in thespatial perspective through geography may be better able to use data at a variety of scales, in avariety of contexts, think systematically and holistically, and use quantitative and qualitative ap-proaches to solve problems, becoming better decision-makers (Milson and Kerski, 2012). Stu-dents engaged in web mapping tools make heavy use of the geographic inquiry process. Key tothis process is that geography is taught as an applied science and it leads to action. It also leads to
© 2014 The Author(s)Geography Compass © 2014 John Wiley & Sons Ltd
Geography Compass 9/1 (2015): 14–26, 10.1111/gec3.12193
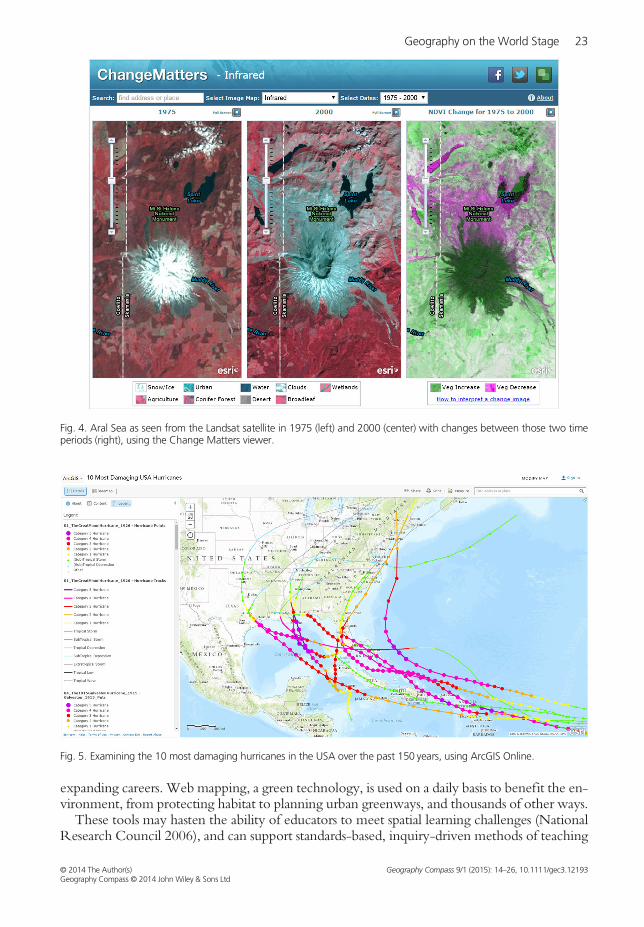
Fig. 4. Aral Sea as seen from the Landsat satellite in 1975 (left) and 2000 (center) with changes between those two timeperiods (right), using the Change Matters viewer.
Fig. 5. Examining the 10 most damaging hurricanes in the USA over the past 150 years, using ArcGIS Online.
Geography on the World Stage 23
expanding careers. Web mapping, a green technology, is used on a daily basis to benefit the en-vironment, from protecting habitat to planning urban greenways, and thousands of other ways.These tools may hasten the ability of educators to meet spatial learning challenges (National
Research Council 2006), and can support standards-based, inquiry-driven methods of teaching
© 2014 The Author(s)Geography Compass © 2014 John Wiley & Sons Ltd
Geography Compass 9/1 (2015): 14–26, 10.1111/gec3.12193
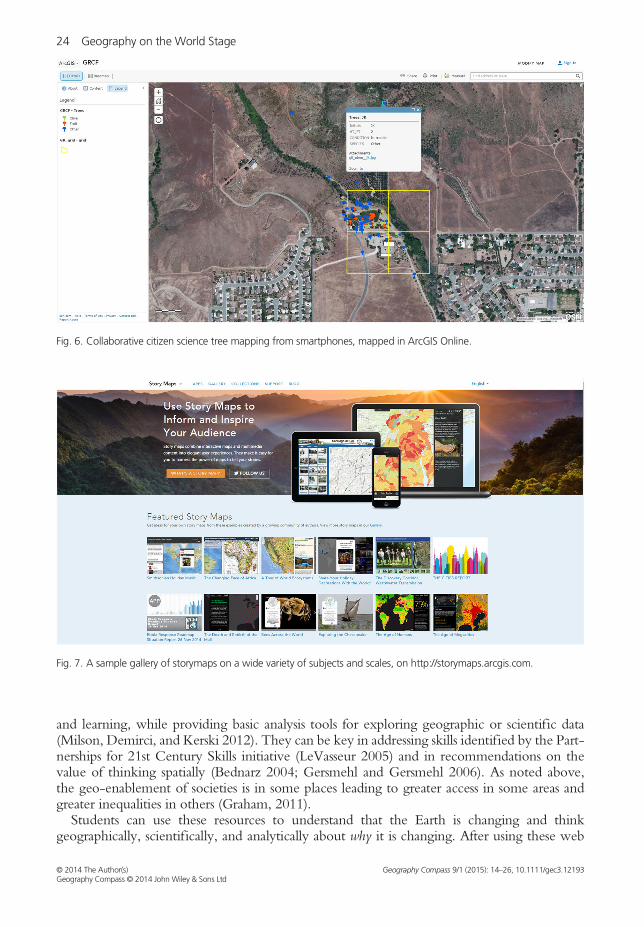
Fig. 6. Collaborative citizen science tree mapping from smartphones, mapped in ArcGIS Online.
Fig. 7. A sample gallery of storymaps on a wide variety of subjects and scales, on http://storymaps.arcgis.com.
24 Geography on the World Stage
and learning, while providing basic analysis tools for exploring geographic or scientific data(Milson, Demirci, and Kerski 2012). They can be key in addressing skills identified by the Part-nerships for 21st Century Skills initiative (LeVasseur 2005) and in recommendations on thevalue of thinking spatially (Bednarz 2004; Gersmehl and Gersmehl 2006). As noted above,the geo-enablement of societies is in some places leading to greater access in some areas andgreater inequalities in others (Graham, 2011).Students can use these resources to understand that the Earth is changing and think
geographically, scientifically, and analytically about why it is changing. After using these web
© 2014 The Author(s)Geography Compass © 2014 John Wiley & Sons Ltd
Geography Compass 9/1 (2015): 14–26, 10.1111/gec3.12193
Geography on the World Stage 25
maps, students need to ask and grapple with value-based questions. Should the Earth bechanging in these ways? Is there anything that I should be doing about it? This captures not onlythe heart of spatial thinking, inquiry, and problem-based learning, but of education for activism– to make a difference in this changing world of ours.Given the five trends identified in this article, geography seems poised to occupy a more
important role in education and society. Will geographers seize the opportunity afforded tothe discipline to catapult it to the “world stage”?
Getting Started
ArcGIS Online: www.arcgis.com/home –Maps, apps, tools, and data, which allow for investigationof local to global issues, in the field or in the classroom on tablets, laptops, or smartphones.WorldMapper: www.worldmapper.org – Create cartograms on over 700 health, technology,
cultural, economic, physical geography, and other variables.Google Maps: maps.google.com – Examine satellite imagery and maps; examine historical and
current street views of streets, but also trails and points of interest.GapMinder: www.gapminder.org – Examine trends in demography, health, and economics by
country and over time with dynamic graphs and data.Urban Observatory: www.urbanobservatory.org – Compare population density, land use, and
other variables for dozens of urban areas around the world.Milson, Andrew, Demirci, Ali, and Kerski, Joseph J. 2012. International Perspectives on Teaching
and Learning with GIS in Secondary Schools. Springer, 353 pp. Discover how schools in 33countries around the world are using geotechnologies.Esri Education Community blog: http://blogs.esri.com/esri/gisedcom/. Connect to the global
community in GIS in education and discover data, tools, best practices, and professionaldevelopment.YouTube Geography Channel: www.youtube.com/geographyuberalles Learn about space,
place, geotechnologies, f ieldwork, geography, and STEM education with the over 2500videos here.
Short Biography
Joseph Kerski is a geographer who believes that spatial analysis through digital mapping cantransform education and society through better decision-making using the geographicperspective. He holds three degrees in Geography. He has served as geographer andcartographer at NOAA, the US Census Bureau, and the US Geological Survey. He teachesonline and face-to-face courses at primary and secondary schools, through MOOCs, anduniversities such as Sinte Gleska University and the University of Denver. He serves asEducation Manager for Esri and focused on thought leadership in geospatial technologyeducation. This includes curriculum development, research in the effectiveness of GIS ineducation, professional development for educators, and fostering partnerships to support GISin education at all levels, internationally. He has authored books such as Spatial Mathematics,The Essentials of the Environment, and The GIS Guide to Public Domain Data.
Note
* Correspondence address: Joseph Kerski, Esri Education 1 International, Esri, Broomfield, Colorado, 80021 USA. Email:[email protected]
© 2014 The Author(s)Geography Compass © 2014 John Wiley & Sons Ltd
Geography Compass 9/1 (2015): 14–26, 10.1111/gec3.12193
26 Geography on the World Stage
References
Al-Hader, M. and Rodzi, A. 2009. The smart city infrastructure development and monitoring. Theoretical and EmpiricalResearches in Urban Management 2 (11), pp. 87–94.
Bednarz, S. W. 2004. Geographic information systems: A Tool to support geography and environmental education.GeoJournal 60, pp. 191–199.
Bednarz, S. W., Heffron, S. and Huynh, N. T. 2014. A road map for 21st century geography education: Geographyeducation research. J-Reading: Journal of Research and Didactics in Geography. 1 (3), pp. 81–86.
Broda, H. 2007. Schoolyard-Enhanced Learning: Using the Outdoors as an Instructional Tool. Portland, Maine, USA: StenhousePublishers, pp. 192.
Capraro, R. and Slough, S. W. 2013. Why PBL? Why STEM? Why now? An introduction to STEM project-based learning, inSTEM Project Based Learning. Dordrecht: Springer, pp. 1–15.
Dangermond, J. 2002. Taking the pulse of the planet with GIS. Arcnews. Redlands, California, USA: Spring 2002.DiBiase, D., DeMers, M., Johnson, A., Kemp, K., Luck, A. T., Plewe, B. and Wentz, E. 2007. Introducing the first editionof the geographic information science and technology body of knowledge. Cartography and Geographic Information Science34 (2), pp. 113–120.
Dobson, J. E. 2007. Bring back geography! ArcNews. Redlands, California, USA: Spring 2007.Edelson, D. C. 2012. Geo-education: Preparation for 21st Century Decisions. ArcNews. Summer. http://www.esri.com/news/arcnews/summer12articles/geo-education-preparation-for-21st-century-decisions.html.Gersmehl, P. and Gersmehl, C. 2006.Wanted: A concise list of neurologically defensible and assessable spatial thinking skills.Research in Geographic Education 8, pp. 5–38.
Gewin, V. 2004. Mapping opportunities. Nature 427, pp. 376–377.Goodchild, M. F. 2007. Citizens as sensors: The world of volunteered geography. GeoJournal 69, pp. 211–221.Graham, M. 2011. Time machines and virtual portals: The spatialities of the digital divide. Progress in Development Studies11(3), pp. 211–227.
Grossner, K. 2012. Finding the spatial in order to teach it. In: Kastens, K. A. and Manduca, C. A. (eds) Earth and Mind:A Synthesis of Research on Thinking and Learning in the Geosciences, Geological Society of America. Boulder, Colorado USA:Geological Society of America pp. 87–89.
Hong, J. E. 2014. Promoting teacher adoption of GIS using teacher-centered and teacher-friendly design. Journal ofGeography 113 (4), pp. 139–151.
Janelle, D. G., Hespanha, S. R., Goodchild, F. and Goodchild, M. F. 2009. Workshops and national dissemination ofgeographic analysis in the social sciences: The CSISS experience in the USA. Journal of Geography in Higher Education33 (1), pp. S88–S103.
Jukes, I., McCain, T. and Crockett, L. 2010. Understanding the Digital Generation: Teaching and Learning in the New DigitalLandscape. CreateSpace, pp. 174.
Kerski, J. J. 2015. Opportunities and Challenges in Using Geospatial Technologies for Education, In: Muñiz-Solari, O.,Demirci, A., van der Schee, J. (eds) Geospatial Technologies and Geography Education in a Changing World, Japan: Springer.
Kerski, J. J. 2014.Mapping your field data.ArcUser.Winter 2014. www.esri.com/esri-news/arcuser/winter-2014/mapping-your-field-data.LeVasseur, M. 2005. Geography: A 21st Century Skill. Cable in the Classroom. October. Access Learning, pp. 3.Milson, A., Demirci, A. and Kerski, J. J. 2012. International Perspectives on Teaching and Learning with GIS in Secondary Schools.Netherlands: Springer.
Milson, A. and Kerski, J. J. 2012.Around the world with geospatial technologies. Social Education 76(2): 105-108.Washington DC:National Council for the Social Studies.
National ResearchCouncil. 2006. Learning to Think Spatially—GIS as a Support System in the K-12 Curriculum. WashingtonDC: The National Academies Press, pp. 313.
Natoli, S. J., Boehm, R., Kracht, J. B., Lanegran, D., Monk, J. J. and Morrill, R. W. 1984.Guidelines for geographic education:Elementary and secondary schools. Washington, DC: Association of American Geographers.
Pattison, W. D. 1964. The four traditions of geography. Journal of Geography 63 (5), pp. 211–216.Sinton, D. S. 2006. Understanding Place: GIS and Mapping Across the Curriculum. Redlands, CA: Esri Press, pp. 282.Sobel, D. 1999. Beyond Ecophobia: Reclaiming the Heart in Nature Education. The Orion Society, 45 p.Sobel, D. 2005. Place-based Education. The Orion Society, 96 pp.Wasik, B. 2013. Welcome to the programmable world.Wired. 14 May 2013. www.wired.com/gadgetlab/2013/05/inter-net-of-things/all/
© 2014 The Author(s)Geography Compass © 2014 John Wiley & Sons Ltd
Geography Compass 9/1 (2015): 14–26, 10.1111/gec3.12193


![Tópicos 2] geo 2° ano geo](https://img.pdfslide.net/doc/110x75/5572601dd8b42a761d8b4c36/topicos-2-geo-2-ano-geo.jpg)