Embed Size (px)
Citation preview
1
Geo FactsheetNumber 162www.curriculumpress.co.uk
Hurricanes: A Predictable Hazard?Hurricanes, (tropical cyclones/typhoons) are powerful tropical stormscapable of unleashing tremendous destruction in the form of strong windsand torrential rainfall. Every year they result in death, homelessness andloss of livelihood from Japan in the east, through India and Bangladesh, toAmerica and the Caribbean in the west.
Despite their ferocity and awesome power, many people would argue thathurricanes are, to a large extent, predictable hazards.
What is the hurricane hazard?
Annual average: 50 - 60 in Nothern Hemisphere20 - 30 in Southern Hemisphere15,000 killed or injured each year15% coastal population at risk
Fig 1. Hurricane
EYE
What is a hurricane?Viewed from space, hurricanes characteristically exhibit a catherine-wheelspiral of cloud around a central ‘eye’ (Fig 1).• 300 - 500 km across• wind speed 120+ km/h
1970
1991
1864
1965
1942
1963
1780
1977
1998
1906
1965
1971
1996
1930
1974
1963
1949
1900
1960
1959
DATES
12-13 Nov
30Apr
5 Oct
11-12 May, 1-2 Jun
16 Oct
28-29 May
10-16 Oct
19 Nov
26 Oct - 4 Nov
18 Sep
15 Dec
29 Sep
29 Oct
3 Sep
14-19 Sep
2-7 Oct
5 Dec
10-21 Sep
10 Oct
27 Sep
CASUALTIES (000)
200
131
70
47
40
22
20-22
20
11
10
10
10
9.5
8
8
7
7
6-8
6
5
PARTICULARS
Cyclone and storm surge; 100 thousand missing
Cyclone; left as many as 9 million homeless. Thousands of survivors diedfrom hunger and water-borne disease
Cyclone
Cyclone
Cyclone
Cyclone
“The Great Hurricane of 1780”completely flattened Barbados, Martinique& St Eustatius; deadliest western hemisphere Hurricane on record
Cyclone and storm surge
MITCH. Deadliest Atlantic storm in 200 years. Left 2-3 million peopleleft homeless
Typhoon with storm surge
Cyclone
Cyclone and storm surge off the Bay of Bengal
Supercyclone swept in from Bay of Bengal. Left over 10M homeless
Hurricane
FIFI. Struck northern part of Honduras and left 100,000 homeless
FLORA. Casualties in Haiti and Cuba
Typhoon struck fishing fleet
Galveston Hurricane. Hurricane and tidal surge. Deadliest in US history
Cyclone and storm surge
VERA left 1.5 million homeless
AREA
East Pakistan
SE Bangladesh
Calcutta, India
East Pakistan
Bengal, India
East Pakistan
Barbados, West Indies
Andhra Pradesh, India
Honduras, Nicaragua,Guatemala
Hong Kong, China
Karachi, Pakistan
Orissa State, India
Orissa State, India
Dominican Republic
Honduras
Caribbean
Off Korea
Galveston, Texas
East Pakistan
Honshu, Japan
Hurricanes bring exceptionally strong winds and very heavy rainfall. Thevery strong winds, which often gust to over 200km/h, destroy homes,flatten crops and trees, and damage overhead power and telephone lines.In countries dependent on tree crops such as bananas, a hurricane can beabsolutely devastating economically. Hurricanes can dump huge quantitiesof rainfall, often in excess of 200mm, in a matter of a few hours, leading towidespread flooding and often triggering landslides. It is these secondaryhazards – the floods and the landslides – which are responsible for most ofthe deaths and damage associated with hurricanes (Table 1).
Table 1. Top twenty global hurricane disasters
2
162 Hurricanes: A Predictable Hazard? Geo Factsheetwww.curriculumpress.co.uk
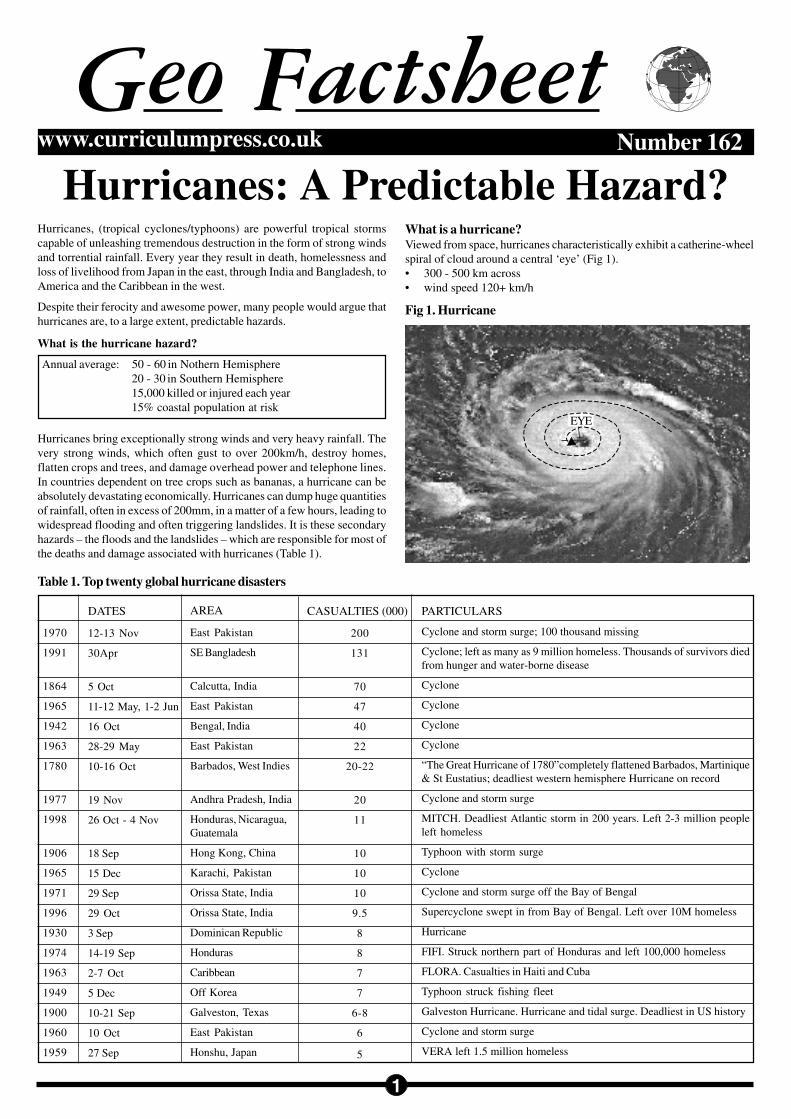
Fig 2. Hurricane formation areas and typical tracks
Equator
zone where corioliseffect is theoreticallytoo low for hurricanesto form
Peruvian coldocean current
Benguela coldocean current location of Typhoon
Varmei 2001
Tropic ofCapricorn
Tropic ofCancer
PacificOceanAtlantic
Ocean
Indian Ocean
PacificOcean
= Hurricane formation areas and typical tracks
• In cross-section a hurricane is a spinning vortex of rapidly rising air.The ‘spinning’ motion results from the coriolis effect, which is causedby the rotation of the Earth about its axis. The coriolis effect is zero atthe Equator and increases poleward. This explains why the sourceareas for hurricanes tend to lie either side of the Equator, generallybetween 5o and 25o north and south.
Given the requirements for hurricane formation – warm, tropical oceansbetween 5-25 degrees north and south of the Equator – it could be statedthat at least spatially hurricanes are fairly predictable.
What is hazard prediction?Scientists strive to reduce the impact of natural hazards by attempting topredict or forecast when, where and how large an event will occur. Peoplecan then be warned or evacuated to safety. Defence measures can be put inplace to reduce the impact of the event.
Prediction works well for some natural hazards, but less well for others.For example, there are usually several weeks or months warning of animpending volcanic eruption. Minor earthquakes, steam eruptions, increasesin surface heat flow indicated by melting snow and ice, and the physicalbulging of the volcano all help to provide scientists with evidence that avolcanic eruption is imminent. However, earthquake prediction is muchmore unreliable and as yet no universally accepted precursors exist.
Hurricanes are generally considered to be a predictable hazard becausethey can be clearly seen and tracked by radar and satellite, and warningscan be issued. However, as this Factsheet will show, hurricane predictionis not as straightforward as it may seem, which is why so many people areadversely affected by them.
In what ways are hurricanes predictable?There are several reasons why hurricanes can be considered to be predictablehazards.1. Hurricanes are formed in the Tropics over oceans (Fig 2)• Hurricanes are only formed when the water temperature exceeds 26.5oC.
At this temperature and above, the air is unstable and has the potentialto rise. This explains why they are found in the Tropics.
It also explains why they are not found, for example, off the west coastof Africa where the cold Benguela ocean current keeps the watertemperature well below 26.5oC.
• Hurricanes derive their energy from the sea. Rapidly rising moist aircools and condenses, releasing latent heat. This heat ‘fuels’ the storm,increasing its power and intensity. Without the moist oceanic airhurricanes lose their fuel supply and becomes less powerful.
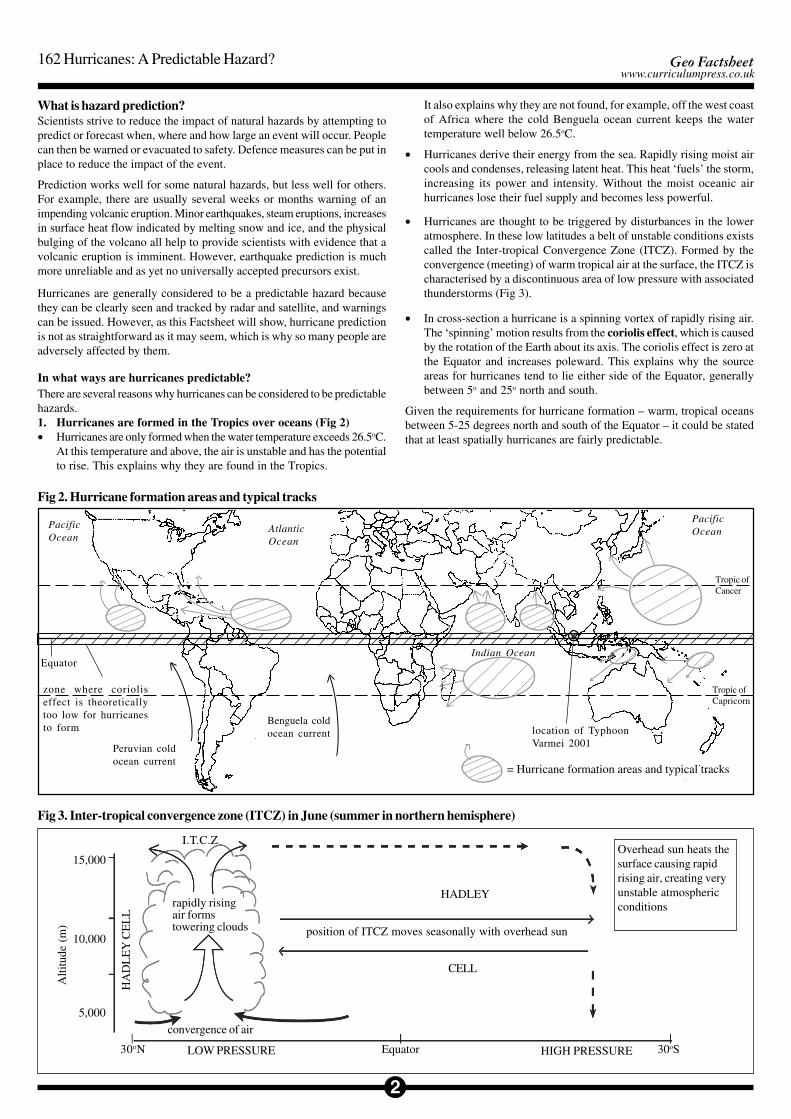
• Hurricanes are thought to be triggered by disturbances in the loweratmosphere. In these low latitudes a belt of unstable conditions existscalled the Inter-tropical Convergence Zone (ITCZ). Formed by theconvergence (meeting) of warm tropical air at the surface, the ITCZ ischaracterised by a discontinuous area of low pressure with associatedthunderstorms (Fig 3).
Fig 3. Inter-tropical convergence zone (ITCZ) in June (summer in northern hemisphere)
LOW PRESSURE HIGH PRESSURE 30oS30oN Equator
CELL
HADLEY
position of ITCZ moves seasonally with overhead sun
HA
DL
EY
CE
LL
15,000
10,000
5,000
Alti
tude
(m
)
convergence of air
rapidly risingair formstowering clouds
I.T.C.ZOverhead sun heats thesurface causing rapidrising air, creating veryunstable atmosphericconditions
Geo Factsheet
3
162 Hurricanes: A Predictable Hazard?www.curriculumpress.co.uk
Typhoon Varmei, South China Sea, 2001In December 2001, Typhoon Varmei, with winds in excess of 140km/h,hit several unsuspecting US Navy ships in the South China Sea to thesouth of the Malay Peninsular. Typhoon Varmei passed between Malaysiaand Borneo just 150km north of the Equator in a zone where hurricanesare not expected to exist due to the absence of a marked coriolis effect. So,why did it form outside the expected hurricane formation zone?
Scientists believe that the hurricane resulted from a freak sequence ofevents with a recurrence interval of one in every 400 years. A strongblast of air from Asia, called a ‘monsoon surge’, funnelled rapidly downthe South China Sea towards the Equator. Typically, the surge windschange direction as they cross the equator in response to the change inthe coriolis effect, which is positive (deflects to the right) in the northernhemisphere and negative (deflects to the left) in the southern hemisphere.In December 2001, a winter monsoon weather system with a cluster ofthunderstorms happened to be located in the area where the monsoonsurge winds change direction and scientists believe that this combinationcreated enough spin to initiate Typhoon Varmei.
(A more detailed report on Typhoon Varmei can be found atwww.jpl.nasa.gov/earth/features/typhoon varmei.cfm )
Table 2. Tropical storms and hurricanes in the Atlantic, Caribbeanand Gulf of Mexico by month
1944 - 2000Tropical storms
& Hurricanes
Total Average
3 0.1
8 0.1
31 0.5
50 0.9
151 2.6
198 3.5
100 1.8
26 0.5
4 0.1
571 10.0
Month
January - April
May
June
July
August
September
October
November
December
Year
1944 - 2000Hurricanes
Total Average
0 0.0
2 <0.05
11 0.2
22 0.4
95 1.6
129 2.3
60 1.1
16 0.3
2 <0.05
337 5.9
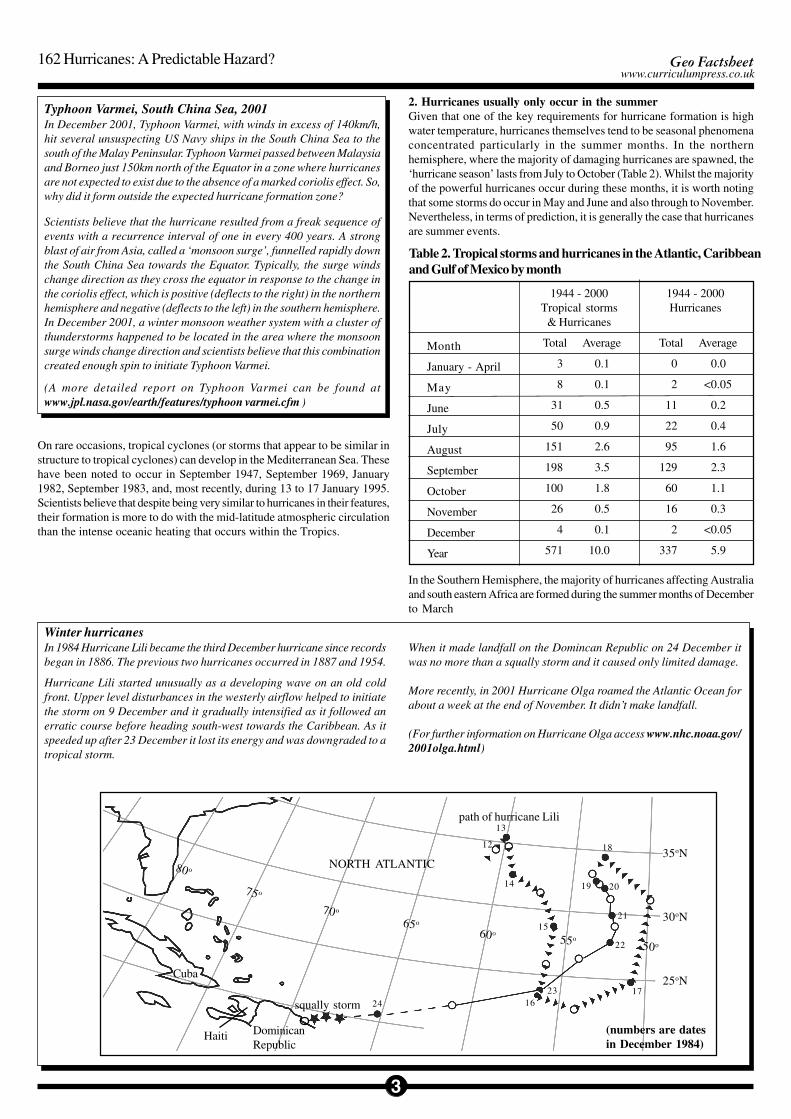
Winter hurricanesIn 1984 Hurricane Lili became the third December hurricane since recordsbegan in 1886. The previous two hurricanes occurred in 1887 and 1954.
Hurricane Lili started unusually as a developing wave on an old coldfront. Upper level disturbances in the westerly airflow helped to initiatethe storm on 9 December and it gradually intensified as it followed anerratic course before heading south-west towards the Caribbean. As itspeeded up after 23 December it lost its energy and was downgraded to atropical storm.
When it made landfall on the Domincan Republic on 24 December itwas no more than a squally storm and it caused only limited damage.
More recently, in 2001 Hurricane Olga roamed the Atlantic Ocean forabout a week at the end of November. It didn’t make landfall.
(For further information on Hurricane Olga access www.nhc.noaa.gov/2001olga.html)
NORTH ATLANTIC
Cuba
DominicanRepublic
Haiti
80 o
75 o
70o
65o
60o55o
50o
35oN
30oN
25oN
12
13
14
15
1617
18
19 20
21
22
2324
(numbers are datesin December 1984)
In the Southern Hemisphere, the majority of hurricanes affecting Australiaand south eastern Africa are formed during the summer months of Decemberto March
On rare occasions, tropical cyclones (or storms that appear to be similar instructure to tropical cyclones) can develop in the Mediterranean Sea. Thesehave been noted to occur in September 1947, September 1969, January1982, September 1983, and, most recently, during 13 to 17 January 1995.Scientists believe that despite being very similar to hurricanes in their features,their formation is more to do with the mid-latitude atmospheric circulationthan the intense oceanic heating that occurs within the Tropics.
2. Hurricanes usually only occur in the summerGiven that one of the key requirements for hurricane formation is highwater temperature, hurricanes themselves tend to be seasonal phenomenaconcentrated particularly in the summer months. In the northernhemisphere, where the majority of damaging hurricanes are spawned, the‘hurricane season’ lasts from July to October (Table 2). Whilst the majorityof the powerful hurricanes occur during these months, it is worth notingthat some storms do occur in May and June and also through to November.Nevertheless, in terms of prediction, it is generally the case that hurricanesare summer events.
path of hurricane Lili
squally storm

Geo Factsheet
4
162 Hurricanes: A Predictable Hazard?www.curriculumpress.co.uk
Do El Niño and La Niña events affect hurricanes?El Nino and La Nina are terms applied to changes in the large scaleocean-atmospheric climate resulting from changes in sea surfacetemperatures in the Pacific Ocean. Together, they form the ENSO (ElNiño Southern Oscillation). El Niño represents a relative warming of thePacific Ocean sea surface temperatures and La Niña represents a relativecooling. Temperatures oscillate between these two extremes every fewyears.
One of the requirements for hurricane formation is a fairly uniformvertical profile of winds in the atmosphere. This will produce what iscalled a low ‘wind shear’. High wind shear is when there is considerablevariation in winds with altitude. When there is a high wind shear,hurricanes are less likely to form.
Winds are largely determined by pressure patterns, which are in turnaffected by surface temperatures. As surface temperatures oscillate aspart of the ENSO, it is logical to expect pressure patterns and winds tovary also from the normal pattern. During the extremes of temperaturevariation (El Niño and La Niña events), the ‘normal’ vertical profile ofwinds becomes altered and this influences the likelihood (and thereforethe frequency) of hurricanes.
Research has shown that during an El Niño event, wind shear is increasedover the tropical Atlantic thereby suppressing hurricane formation. Overthe eastern Pacific the opposite occurs, with wind shear decreasing andhurricane formation being promoted.
During a La Niña event, the exact opposite occurs. There tend to be moreAtlantic hurricanes (due to a lower wind shear) and fewer eastern Pacifichurricanes (due to a higher wind shear).
El Niño and La Niña also influence where the Atlantic hurricanes form.During El Niño fewer hurricanes and major hurricanes develop in thedeep Tropics from African easterly waves. During La Niña morehurricanes form in the deep Tropics from African easterly waves. Thesesystems have a much greater likelihood of becoming major hurricanes,and of eventually threatening the U.S. and Caribbean Islands.
Therefore, the chances of the U.S.A. and the Caribbean Islandsexperiencing a hurricane increases substantially during a La Niña event,and decreases during an El Niño event.
Whilst monitoring techniques are still to be perfected, it is interesting tonote that during the last strong El Niño episode in 1997 there were only3 Atlantic hurricanes compared to 10 in 1998, 8 in 1999, 8 in 2000 and9 in 2001. In 2002, during a moderate El Niño episode, there were only4 hurricanes. It therefore seems reasonable to predict fewer Atlantichurricanes during an El Niño episode than at other times.
(For further information on the affect of the ENSO on hurricanes accessthe Climate Prediction Center at http://www.cpc.ncep.noaa.gov/products/analysis_monitoring/ensostuff/ensofaq.html#NINA )
Hurricane tracking in Hong KongHurricanes are monitored by scientists at the Hong Kong MeteorologicalOffice using enhanced infra-red satellite images produced every hour andradar images when the storm is within 500km of the territory. In the past,reconnaissance aircraft have provided accurate wind speed data but flightswere stopped in 1987.
Weather charts are plotted every six hours to place the hurricane in thecontext of large scale weather systems, which can have a profound effecton the future intensity and course of a hurricane.
Over the western North Pacific, most of the tropical cyclones form alongthe southern or southwestern flank of the subtropical ridge of high pressurewhere the ‘steering current’ flows to the northwest. This explains thepredominant north-westward storm tracks observed in this part of theworld. However, fluctuations in the ‘steering current’ caused by changesin the high pressure area, together with internal changes within the stormitself, can lead to unexpected and eccentric hurricane tracks.
Forecasting and prediction make use of past records to predict likelycourses of hurricanes approaching Hong Kong. Additionally, numericalcomputer models are used to help predict both the course and the intensityof hurricanes. However, each hurricane is essentially unique both in itsown structure and dynamics and in its meteorological setting. The scienceof tropical cyclone forecasting is by no means perfect.
Another problem related to Hong Kong concerns its geographical setting.Most tropical cyclones approach the coast of southern China on a west-northwestward track. With the orientation of the coastline at such anoblique angle to the storm track and Hong Kong being such a small target,a deviation of only 10 degrees in the direction of storm movement isenough to divert the storm to Hainan Island instead of a direct hit onHong Kong.
Faced with an uncertain and ever-changing situation, forecasters need tokeep a close watch and be prepared to make timely updates and intelligentdecisions. By the same token, the public should be aware of theuncertainties involved and be prepared to respond to the latestdevelopment as indicated by the warning bulletins.
(Additional information about forecasting hurricanes in Hong Kong canbe accessed at the Hong Kong Meteorological Office at http://www.hko.gov.hk/informtc/tc.htm )
In recent years, scientists have become aware of significant oscillations in Pacific Ocean sea surface temperatures, which affect global weather patterns.Increasing evidence now suggests a link between these events – known as El Niño and La Niña - and the frequency of hurricanes.
3. Hurricanes can be tracked and their courses predictedAs Fig 2 indicates, hurricanes tend to follow curved paths away from theirsource areas. The direction of movement (generally from east to west) isdetermined by the easterly Trade Winds that dominate in the low latitudes.The curvature of the hurricane paths is due to the coriolis effect.
Meteorologists have developed powerful computer tracking programmesto help forecast hurricane paths, and satellite and radar systems help tomaintain a careful watch on a hurricane’s progress. Tracking stations existin the main hurricane ‘hot spots’ such as Miami in the USA, Hong Kong,Australia and Japan.
Hurricane Isabel (2003) came ashore exactly wher it was predicted (OuterBarrier Islands) and at almost exactly the time. It was a caergory 2 storm bythe time it came ashore (again exactly as predicted). Vastly improvedcomputer models, very easy tracking and the position of other weathersystems which controlled its path also contributed to the successfulprediction.
Geo Factsheet162 Hurricanes: A Predictable Hazard?www.curriculumpress.co.uk
5
Acknowledgements; This Factsheet was researched and written by Simon Ross a well known author. Curriculum Press, Bank House, 105 King Street, Wellington, Shropshire, TF1 1NU. Geopress Factsheets may be copied freeof charge by teaching staff or students, provided that their school is a registered subscriber.No part of these Factsheets may be reproduced, stored in a retrieval system, or transmitted, in any other form or by any other means, without the prior permission of the publisher. ISSN 1351-5136
Further researchAccess the National Hurricane Center’s website at www.nhc.noaa.gov/pastall.shtml to find archive data for past hurricanes. Click the most recentyear to find detailed information about hurricanes affecting America.Conduct your own research on the predictability of hurricanes in yourchosen year by examining the months when hurricanes occurred and thenature of the tracks taken by the hurricanes. Comment on the level ofpredictability and identify any exceptions to the general rules.
Internet websitesAn internet search will reveal many sites. One of the best is the NationalHurricane Center at www.nhc.noaa.gov , which has huge amounts of archiveinformation about individual events and a great deal of general informationabout hurricanes.
The National Oceanic and Atmospheric Administration’s website is athttp://hurricanes.noaa.gov.
The Hong Kong Meteorological Office at http://www.hko.gov.hk/informtc/tcSmap.htm also provides a good deal of useful information and gives aslightly different perspective for a different part of the world.
Coastal communities at risk from hurricanes are informed about thepotential dangers associated with hurricanes and advised what to do in theevent of an approaching storm. Warnings are issued over the radio andtelevision and people may be encouraged to evacuate their homes to moveto hurricane shelters on higher ground (as in Bangladesh) or inland awayfrom the coast (as in the case of the USA).
In many instances hurricanes do follow ‘typical’ curved paths therebymaking it relatively straightforward to forecast which areas are at risk.However, this is not always the case as Hurricane Mitch demonstrated in1998 (see Factsheet 62). Furthermore, as hurricanes approach populatedcoastal areas, forecasters can only identify a broad area at risk, which isperfectly understandable given the size of hurricanes and the possibilitythat they might alter their course as they approach the coast.
To summarise, hurricane tracking and the use of computer models linked tosatellite and radar observation can be used to forecast and predict areas atrisk. There can be no doubt that such predictions have reduced the potentialdeath toll, especially in MEDCs where the wherewithal exists to react andrespond to warnings. However, not all hurricanes follow predictable coursesas Hurricane Mitch demonstrated, and even when predictions are made thesheer scale of the storms rules out precise pin-pointing of those areas atgreatest risk.
ConclusionTo a large extent it is a reasonable assertion that hurricanes are predictablehazards. They are restricted to certain parts of the world, having distinct‘source’ areas over tropical oceans. Their occurrence is also largelypredictable in that they are summer phenomena, being concentrated betweenJuly and October in the Northern Hemisphere and December to March inthe Southern Hemisphere. They tend to follow typical tracks in responseto the prevailing winds and the coriolis effect enabling computer models tohelp predict the courses of individual storms.
However, there have been a number of historical exceptions to the rules;hurricanes are not absolutely predictable. Each storm has its unique set ofcharacteristics and exists within a unique meteorological setting. It istherefore important not to become complacent and expect all hurricanes tofollow an expected evolution. There is much to be done to improve hurricanetracking and forecasting and it is still very difficult for scientists to predictaccurately the conditions associated with individual hurricanes or theirlikely effects upon communities.
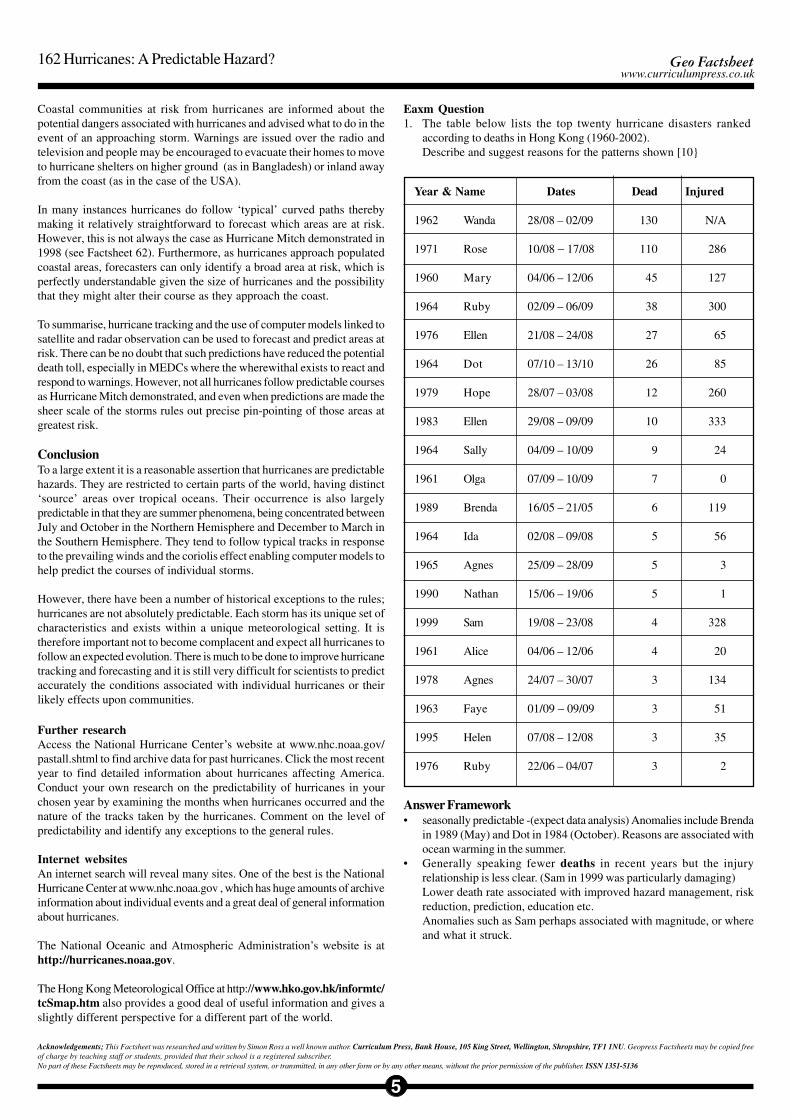
Eaxm Question1. The table below lists the top twenty hurricane disasters ranked
according to deaths in Hong Kong (1960-2002).Describe and suggest reasons for the patterns shown [10}
Year & Name
1962 Wanda
1971 Rose
1960 Mary
1964 Ruby
1976 Ellen
1964 Dot
1979 Hope
1983 Ellen
1964 Sally
1961 Olga
1989 Brenda
1964 Ida
1965 Agnes
1990 Nathan
1999 Sam
1961 Alice
1978 Agnes
1963 Faye
1995 Helen
1976 Ruby
Dates
28/08 – 02/09
10/08 − 17/08
04/06 – 12/06
02/09 – 06/09
21/08 – 24/08
07/10 – 13/10
28/07 – 03/08
29/08 – 09/09
04/09 – 10/09
07/09 – 10/09
16/05 – 21/05
02/08 – 09/08
25/09 – 28/09
15/06 – 19/06
19/08 – 23/08
04/06 – 12/06
24/07 – 30/07
01/09 − 09/09
07/08 – 12/08
22/06 – 04/07
Dead
130
110
45
38
27
26
12
10
9
7
6
5
5
5
4
4
3
3
3
3
Injured
N/A
286
127
300
65
85
260
333
24
0
119
56
3
1
328
20
134
51
35
2
Answer Framework• seasonally predictable -(expect data analysis) Anomalies include Brenda
in 1989 (May) and Dot in 1984 (October). Reasons are associated withocean warming in the summer.
• Generally speaking fewer deaths in recent years but the injuryrelationship is less clear. (Sam in 1999 was particularly damaging)Lower death rate associated with improved hazard management, riskreduction, prediction, education etc.Anomalies such as Sam perhaps associated with magnitude, or whereand what it struck.