Embed Size (px)
DESCRIPTION
GEO Outreach to the Balkans - Results of the BalkanGEONet project - Vesna Crnojevic-Bengin UNIVERSITY OF NOVI SAD, Serbia. GEO-IX, Foz de Igiuacu, November 2012. Background. GEO outreach to Balkans assessed based on the results of the ongoing FP7 BalkanGEONet project - PowerPoint PPT Presentation
Citation preview
GEO-IX, Foz de Iguacu, November 2012.
GEO Outreach to the Balkans- Results of the BalkanGEONet project -
Vesna Crnojevic-BenginUNIVERSITY OF NOVI SAD, Serbia
GEO-IX, Foz de Igiuacu, November 2012.
GEO-IX, Foz de Iguacu, November 2012.
Background
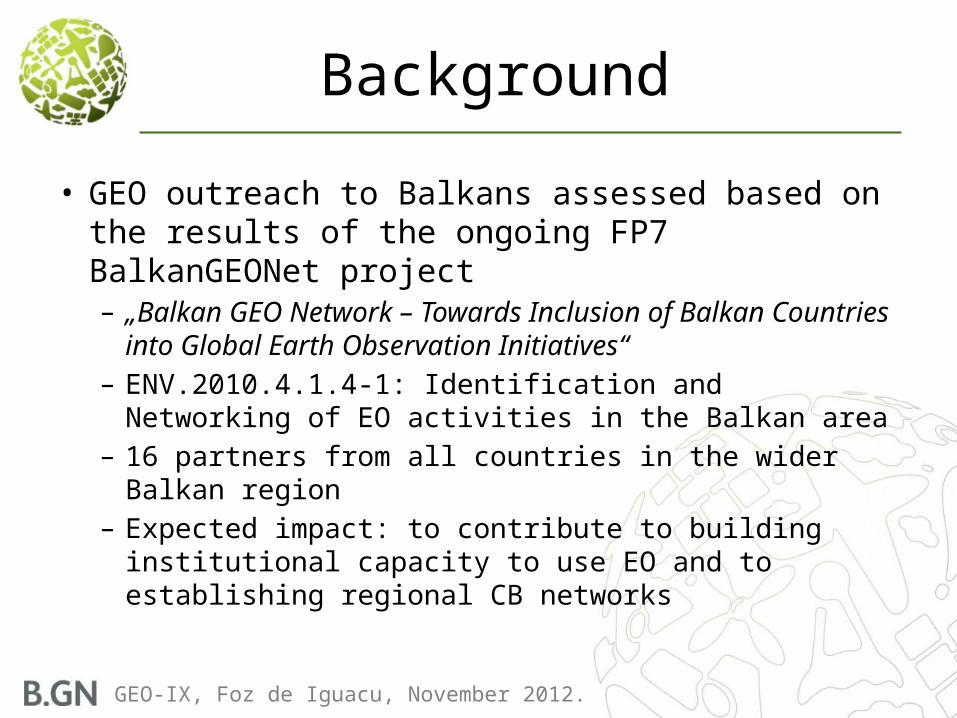
• GEO outreach to Balkans assessed based on the results of the ongoing FP7 BalkanGEONet project– „Balkan GEO Network – Towards Inclusion of Balkan
Countries into Global Earth Observation Initiatives“– ENV.2010.4.1.4-1: Identification and Networking of EO
activities in the Balkan area– 16 partners from all countries in the wider Balkan region– Expected impact: to contribute to building institutional
capacity to use EO and to establishing regional CB networks

GEO-IX, Foz de Iguacu, November 2012.
Outline
• BalkanGEONet methodology for gap analysis• Results of the gap analysis used to evaluate the
impact of GEO to the region
GEO-IX, Foz de Iguacu, November 2012.
B.GN Approach
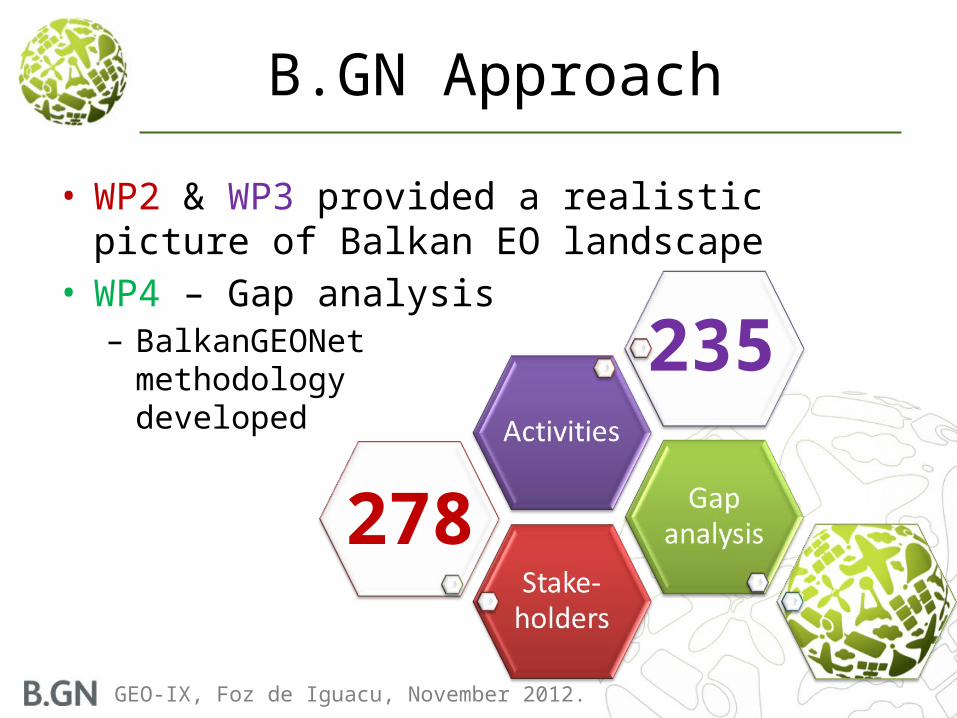
• WP2 & WP3 provided a realistic picture of Balkan EO landscape
• WP4 – Gap analysis– BalkanGEONet
methodologydeveloped
278
235
GEO-IX, Foz de Iguacu, November 2012.
B.GN Gap Analysis
GEO-IX, Foz de Iguacu, November 2012.
Background
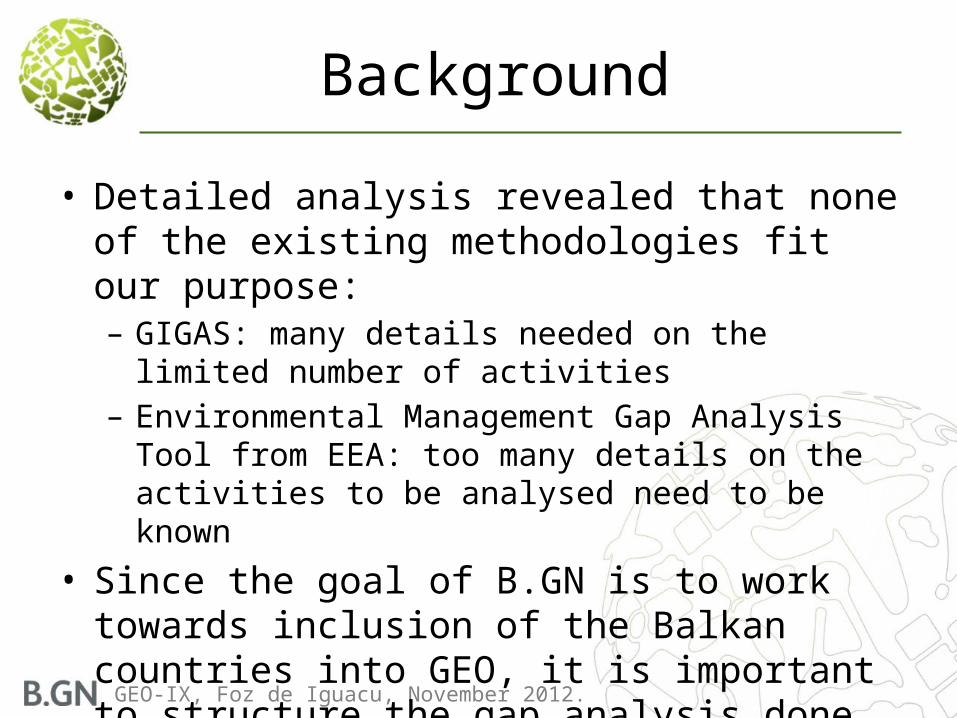
• Detailed analysis revealed that none of the existing methodologies fit our purpose:– GIGAS: many details needed on the limited number of
activities– Environmental Management Gap Analysis Tool from EEA:
too many details on the activities to be analysed need to be known
• Since the goal of B.GN is to work towards inclusion of the Balkan countries into GEO, it is important to structure the gap analysis done within B.GN along the lines of GEO actions.

GEO-IX, Foz de Iguacu, November 2012.
B.GN Methodology
• Structured wrt. GEO Action 19.11, Task US-09-01a.
• Our goal: – To assess the potential available – To define the directions of future development
• Our approach: – Opportunity assessment: identifying where investments
would add value and leverage existing strengths– Structural gap analysis across geographic, observational
and domain variables– Carefull development of indicators

GEO-IX, Foz de Iguacu, November 2012.
Indicators for General GA
Indicators Source
Number of Organizations involved with EO WP2 Survey
Number of Providers / Producers WP2 Survey
Number of Users WP2 Survey
Types of Organizations WP2 Survey
Problems regarding Exchange and Use of EO Data WP2 Survey
Assessment of Challenges and Obstacles WP2 Survey
Assessment of Importance of technical Challenges WP2 Survey
Assessment of Importance of global EO System WP2 Survey

GEO-IX, Foz de Iguacu, November 2012.
Indicators for “Providers/Producers” Group
Indicators Source
Geographical Territory covered WP2 SurveyWillingness to Collaboration and Data Sharing WP2 SurveyWillingness to GEOSS Registration WP2 SurveyData Availability to others WP2 SurveyData Availability through Internet WP2 SurveyAvailability of Metadata WP2 SurveyAwareness of End-User Needs WP2 SurveyTime Duration to Requests for Data Needs WP2 SurveyRedundancies of EO Data / Applications WP2 SurveyCollaboration with other Providers / Producers WP2 SurveyNumber of EO Data Users related to Provider / Producer WP2 Survey
Compatibility of Data WP2 Survey

GEO-IX, Foz de Iguacu, November 2012.
Indicators for “Users” Group
Indicators Source
Data Sharing Policy WP2 Survey
Standardization regarding EO Data WP2 Survey
Partnerships and Cooperation WP2 Survey
Use of Geo Portals WP2 Survey
Export of Products or Services WP2 Survey
Rating of ICT Equipment WP2 Survey
Increase of Investment into EO-related Activities WP2 Survey
Assessment of Services of EO Data Providers / Producers WP2 Survey
Numbers of Activities (Projects) WP3 Data Management
Information dissemination (web-based, languages,…) Internet research
Publications in selected international journals Internet/Literature review

GEO-IX, Foz de Iguacu, November 2012.
Indicators for “Activities”Number of ongoing activities (projects) in 2009
Number of ongoing activities (projects) in 2010
Number of ongoing activities (projects) in 2011
Number of activities (projects) for environmental monitoring
Number of activities (projects) for civil security
Number of activities (projects) for political coordination
Number of activities (projects) for information spreading
Number of activities (projects) for the development of EO technology
Number of activities (projects) for other purposes
Number of Global/European activities (projects)
Number of Super-National activities (projects)
Number of National activities (projects)
Number of Regional activities (projects)

GEO-IX, Foz de Iguacu, November 2012.
Integration of geographical aspects
Country/SBA Disasters Health Energy Climate Water Weather Ecosystems Agriculture Biodiversity
Albania
Bulgaria
BIH
Montenegro
FYROM
Croatia
Slovenia
Serbia
Romania
Greece
Non-GEO countries
GEO countries
All Balkan countries

GEO-IX, Foz de Iguacu, November 2012.
Quantifying the Indicators
• The evaluation for each indicator has been calculated by averaging the survey inputs.
• E.g. if the average mark was 3 (60%), a score above 75% or 3.75 indicates high relevance of the issue for Balkan stakeholders while a score below 45% or 2.25 indicates low importance of the issue:
Score < 45%: low relevance of the respective issueScore 45%- 59%: moderate relevance of the respective issueScore 60% - 74%: considerable relevance of the respective issue Score 75% – 84%: high relevance of the respective issueScore ≥ 85%: very high relevance of the respective issue

GEO-IX, Foz de Iguacu, November 2012.
B.GN Results
…selected to highlight the impact of GEO

GEO-IX, Foz de Iguacu, November 2012.
Number of Stakeholders
Types of data Non-GEO countries
GEO countries
Remote sensing 67 110In-situ 46 63Other 56 79Unknown 7 13Total 176 265
• 50 % more stakeholders in GEO countries!• Similar difference exists for producers/providers and users

GEO-IX, Foz de Iguacu, November 2012.
Type of EO Data
• GEO member countries:– Rely more on remote sensing and satellite data than on
in-situ and other types of data
• Non-GEO countries:– Rely more on in-situ data collection since it requires less
investment to deploy.

GEO-IX, Foz de Iguacu, November 2012.
Stakeholders Across SBAa
• GEO outreach reflected through number of organisations

GEO-IX, Foz de Iguacu, November 2012.
SBA Coverage Across Countries
• Membership to GEO significantly reflected
Country/SBA Disast. Health Ener. Clim. Wat. Weath. Ecosys. Agri. Biodiv.
NON-GEO countriesAlbania 10,6% 12,0% 10,2% 6,0% 14,7% 9,3% 11,0% 10,2% 8,2%
BIH 8,0% 6,5% 13,6% 6,0% 8,4% 9,3% 5,9% 9,1% 5,2%Bulgaria 10,6% 8,3% 4,5% 8,4% 7,4% 11,6% 11,9% 8,0% 9,3%FYROM 4,4% 1,9% 1,1% 1,2% 0,0% 2,3% 1,7% 2,3% 1,0%
Monteneg. 6,2% 12,0% 6,8% 8,4% 7,4% 2,3% 9,3% 8,0% 11,3%GEO countries
Croatia 7,1% 18,5% 10,2% 13,3% 15,8% 14,0% 15,3% 8,0% 14,4%Greece 5,3% 7,4% 5,7% 9,6% 4,2% 7,0% 8,5% 8,0% 5,2%
Romania 8,0% 3,7% 1,1% 7,2% 4,2% 2,3% 5,1% 2,3% 4,1%Serbia 11,5% 11,1% 15,9% 14,5% 12,6% 9,3% 10,2% 14,8% 17,5%
Slovenia 14,2% 11,1% 14,8% 13,3% 16,8% 20,9% 13,6% 17,0% 17,5%Turkey 14,2% 7,4% 15,9% 12,0% 8,4% 11,6% 7,6% 12,5% 6,2%

GEO-IX, Foz de Iguacu, November 2012.
Type of Stakeholders
• GEO outreach mirrored onto type of organisations
GEO-countries Non-GEO countries
Comm.Gov.
Ac.Public
Sci.Other
NGOInt.
Gov.Comm.
Public
Ac. Sci.
NGOInt.Oth.

GEO-IX, Foz de Iguacu, November 2012.
Does your organization provide and/or use EO data?
• Most EO players both provide and use EO data – Action needed!• Similar for GEO and non-GEO countries• Outliers: e.g. FYROM, Greece and Romania, where use of EO data
dominates over production.
Country/ answer
A1 A2 A3 A4 A5 A6 Total
Albania 4,8% 42,9% 23,8% 23,8% 0,0% 4,8% 100,0%
BIH 4,4% 47,8% 13,0% 0,0% 17,4% 17,4% 100,0%
Bulgaria 3,7% 59,3% 22,2% 3,7% 3,7% 7,4% 100,0%
FYROM 0,0% 38,5% 53,9% 7,7% 0,0% 0,0% 100,0%
Montenegro 0,0% 29,2% 41,7% 8,3% 16,7% 4,2% 100,0%
Croatia 13,3% 43,3% 30,0% 3,3% 6,7% 3,3% 100,0%
Greece 11,8% 23,5% 47,1% 11,8% 0,0% 5,9% 100,0%
Romania 10,5% 26,3% 63,2% 0,0% 0,0% 0,0% 100,0%
Serbia 0,0% 44,1% 17,7% 17,7% 11,8% 8,8% 100,0%
Slovenia 2,6% 38,5% 46,2% 5,1% 5,1% 2,6% 100,0%
Turkey 0,0% 53,8% 3,8% 19,2% 11,5% 11,5% 100,0%
NON-GEO 2,8% 44,4% 28,7% 8,3% 8,3% 7,4% 100,0%
GEO 5,4% 40,0% 32,7% 9,7% 6,7% 5,4% 100,0% Wider Balkan Area
4,4% 42,5% 31,5% 9,2% 7,3% 6,2% 100,0%
A1 Yes, we only provide EO data A2 Yes, we both provide and use EO data A3 Yes, we only use EO data A4 No, but we would like to use EO data A5 No, but we would like to learn if EO data can be used to enhance our business A6 No

GEO-IX, Foz de Iguacu, November 2012.
Does your organization provide and/or use EO data?
• Potential new users of EO data (answers A4 and A5): 16.5% !• Potential is similar for GEO and non-GEO countries• Some countries show remarkable ambition to use EO data:
Albania (23.8%), Montenegro (25.0%), Serbia (29.5%), Turkey (30.7%) !
Country/ answer
A1 A2 A3 A4 A5 A6 Total
Albania 4,8% 42,9% 23,8% 23,8% 0,0% 4,8% 100,0%
BIH 4,4% 47,8% 13,0% 0,0% 17,4% 17,4% 100,0%
Bulgaria 3,7% 59,3% 22,2% 3,7% 3,7% 7,4% 100,0%
FYROM 0,0% 38,5% 53,9% 7,7% 0,0% 0,0% 100,0%
Montenegro 0,0% 29,2% 41,7% 8,3% 16,7% 4,2% 100,0%
Croatia 13,3% 43,3% 30,0% 3,3% 6,7% 3,3% 100,0%
Greece 11,8% 23,5% 47,1% 11,8% 0,0% 5,9% 100,0%
Romania 10,5% 26,3% 63,2% 0,0% 0,0% 0,0% 100,0%
Serbia 0,0% 44,1% 17,7% 17,7% 11,8% 8,8% 100,0%
Slovenia 2,6% 38,5% 46,2% 5,1% 5,1% 2,6% 100,0%
Turkey 0,0% 53,8% 3,8% 19,2% 11,5% 11,5% 100,0%
NON-GEO 2,8% 44,4% 28,7% 8,3% 8,3% 7,4% 100,0%
GEO 5,4% 40,0% 32,7% 9,7% 6,7% 5,4% 100,0% Wider Balkan Area
4,4% 42,5% 31,5% 9,2% 7,3% 6,2% 100,0%
A1 Yes, we only provide EO data A2 Yes, we both provide and use EO data A3 Yes, we only use EO data A4 No, but we would like to use EO data A5 No, but we would like to learn if EO data can be used to enhance our business A6 No

GEO-IX, Foz de Iguacu, November 2012.
Scientific Activity
• Top 10 institutions per country• High-impact journals, 2006 - 2012
Country / Number of Org.
1 2 3 4 5 6 7 8 9 10
Albania Low Medium Low High Low Low Low Low Low Low
BIH Low Low Low Low Low Low Low Low Low Low
Bulgaria High High Low Excellent Excellent Low Excellent High Low Low
FYROM Low Low Low Low Low Low Low
Montenegro Medium Low Low Low Low Low Low Low Low Low
Croatia Excellent High High Low Low Low Excellent High Low Low
Greece Excellent High Excellent Low Low Low Low Medium Low Medium
Romania Low Low Low Excellent High Excellent Low Low High Low
Serbia Medium Low Low High Medium High Medium Low Low
Slovenia High Low Medium Medium Medium Medium Excellent Low Low High

GEO-IX, Foz de Iguacu, November 2012.
Web-Based Disseminaiton
• Important indicator of the degree of international integration• Top 10 institutions per country
Country / Org. No. 1 2 3 4 5 6 7 8 9 10
Albania 2 3 1 2 1 1 1 2 1 3BIH 1 2 3 2 2 2 3 2 3 1
Bulgaria 1 2 1 1 1 2 1 1 2 1FYROM 3 3 1 2 2 0 3
Montenegro 3 1 2 2 2 2 3 2 3 3Croatia 2 1 3 1 3 1 2 2 2 2Greece 1 1 1 1 1 2 1 1 1 2
Romania 1 1 3 1 1 1 2 2 2 2Serbia 1 1 3 3 2 2 2 1 1
Slovenia 2 2 1 1 1 2 2 1 1 1
1fully available, local language + English
2available in local language, partialy in English
3 local language only
0 no web page
GEO-IX, Foz de Iguacu, November 2012.
Conclusion
• Results clearly illustrate the impact of GEO to the countries in the wider Balkan region
• B.GN methodology is scalable and applicable to any other region
• It can be used to evaluate the level of current and importance of future GEO outreach, and to indicate directions where future efforts should be focused, e.g.:– Capacity building across various geographic, observational
and domain (SBA) categories– Outreach to contributors and users of GEOSS – Raising awarenes of decision- and policy-makers

GEO-IX, Foz de Iguacu, November 2012.
Thank you!
more details can be found onwww.BalkanGEO.net