Embed Size (px)
Citation preview

GEO-PROC-95-02 - 31

DISCLAIMER
This report was prepared as an account of work sponsored by an agency of the United States Government. Neither the United States Government nor any agency Thereof, nor any of their employees, makes any warranty, express or implied, or assumes any legal liability or responsibility for the accuracy, completeness, or usefulness of any information, apparatus, product, or process disclosed, or represents that its use would not infringe privately owned rights. Reference herein to any specific commercial product, process, or service by trade name, trademark, manufacturer, or otherwise does not necessarily constitute or imply its endorsement, recommendation, or favoring by the United States Government or any agency thereof. The views and opinions of authors expressed herein do not necessarily state or reflect those of the United States Government or any agency thereof.

DISCLAIMER Portions of this document may be illegible in electronic image products. Images are produced from the best available original document.
Proceedings 17th NZ Geothermal Workshop 1995 185
STUDY OF WATER REINJECTION ON THE KAMOJANG GEOTHERMAL RESERVOIR PERFORMANCE, INDONESIA
R.S. DARWIS', T. TAMPUBOLON', R. SIMATUPANG' AND D. ASDASSAH~
PERT AMIN4 Exploration and Production Directorate, Jakarta, Indonesia Petroleum Engineering Institut Teknologi Bandung, Bandung, Indonesia 2
SUMMARY - A reservoir simulation model study was developed to investigate effects of water reinjection into the performance of Kamojang geothemal field. Several cases includxng the existing injection wells and rates, the effect of injection rates, location and depth of proposed injection wells were run to study the temperature, pressure and fluid drstribution in the reservoir and its effect into the reservoir and production performance for 30 years of predrction. The results show that the reservoir pressure and temperature drops are very small (4 bar and 5 OC, respectively) at the end of the prelction time; therefore, the production target of 140 MW for 30 years can still be accomplished.
1. INTRODUCTION
The purpose of this study is to investigate the effects of cold water injection (condensed water from the power plant) on the performance of the reservoir, i.e., pressure. temperature and fluid drstribution, as well as its energy recovev.
Injection of water into the vapour dominated reservoir can prolong the productive life of the resources. Tlus is because that the reservoir become depleted in fluid before the rock. as a heat source, is cooled. Therefore, reinjection into such a reservoir is essential in order to prolong its productive life and maximise energy recovery.
In practising the water injection, several constraints have to carefully be considered. They are as the following: 1. Selection of the suitable well location and depth. 2. Problems associated with injection rates. 3. Temperature of the injected water.
A numerical reservoir simulator has recently been undertaken to investigate the above matters. The objective of this paper is to describe the numerical simulation run and presents detailed results of the work.
2. GENERAL INTRODUCTION TO KAMOJANG FIELD
The geothermal energy development in Kamojang field started early in 1918 by the Dutch Administration. Five exploration wells (Kh4.l-1 to KMJ-5) were drilled between the year of 1926 to 1929. There were no essential development actions since 1929 up to 1964.
In 1964, however; under the agreement with the New Zealand government, five additional exploration wells (KMJ-6 to KMJ-10) were drilled to further develop the field. Nine additional wells (KMJ-11 to KMJ-19) were added as exploitation wells to recover thermal energy for generating electricity (PLTP).
Based on the Presidential Decree (KEPRES) No. 16/1974 and strengthened by the KEPRES No. 22/1981, PERTAMINA was given a duty to develop the geothermal energy in Indonesia. To implement such a duty, up to well KMJ-56 have been drilled since 1979 to 1993 in Kamojang field to fulfill the generating 140 MW electricity.
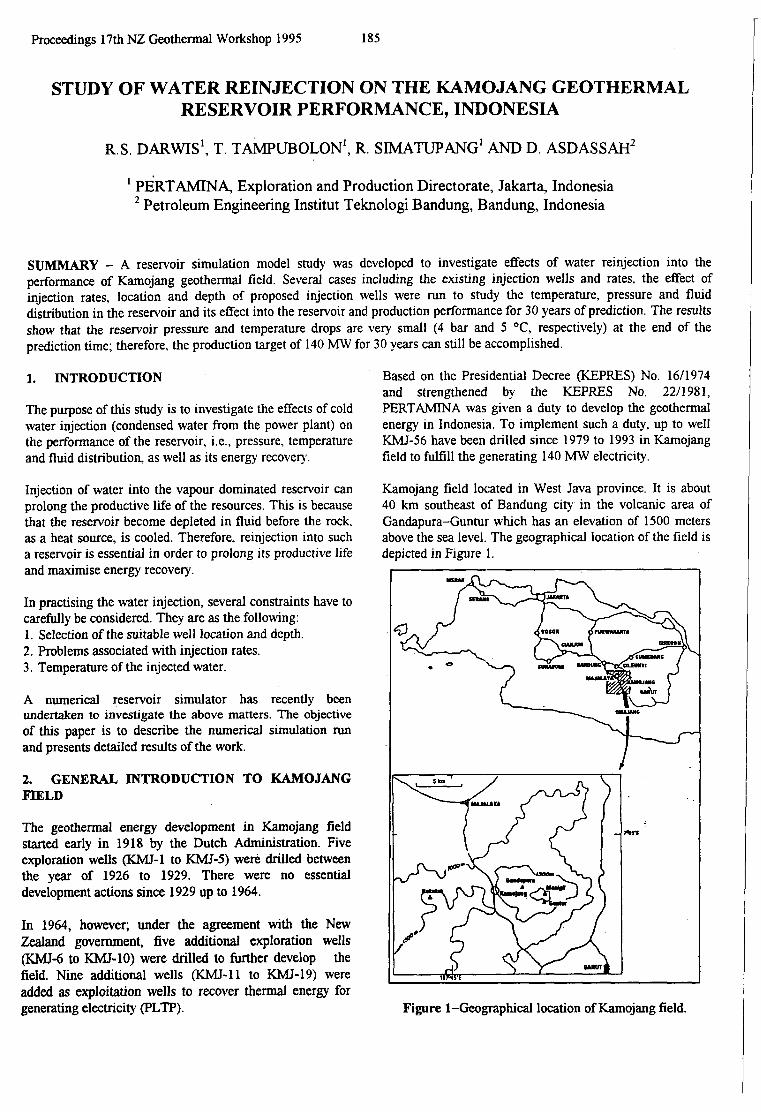
Kamojang field located in West Java province. It is about 40 km southeast of Bandung city in the volcanic area of Gandapura-Guntur which has an elevation of 1500 meters above the sea level. The geograplucal location of the field is depicted in Figure 1.
.- \"I"'
Figure 1-Geographical location of Kamojang field.
186
The structural geology of Kamojang field is controlled by a volcanic depression (Pangkalan volcanic depression) and commonly normal fault systems. The faults provide permeable media for fluid flow and heat transfer in the reservoir.
3. RESERVOIR MODELLING
To assess the reservoir performance under various exploitation (injection and production) and natural state conditions, a reservoir model for Kamojang field had been constructed. The three dimensional block model of the reservoir is constructed to approximate the conceptual model of the field.
0 10 20 30 40 so SO
PRESSURE (Ear)
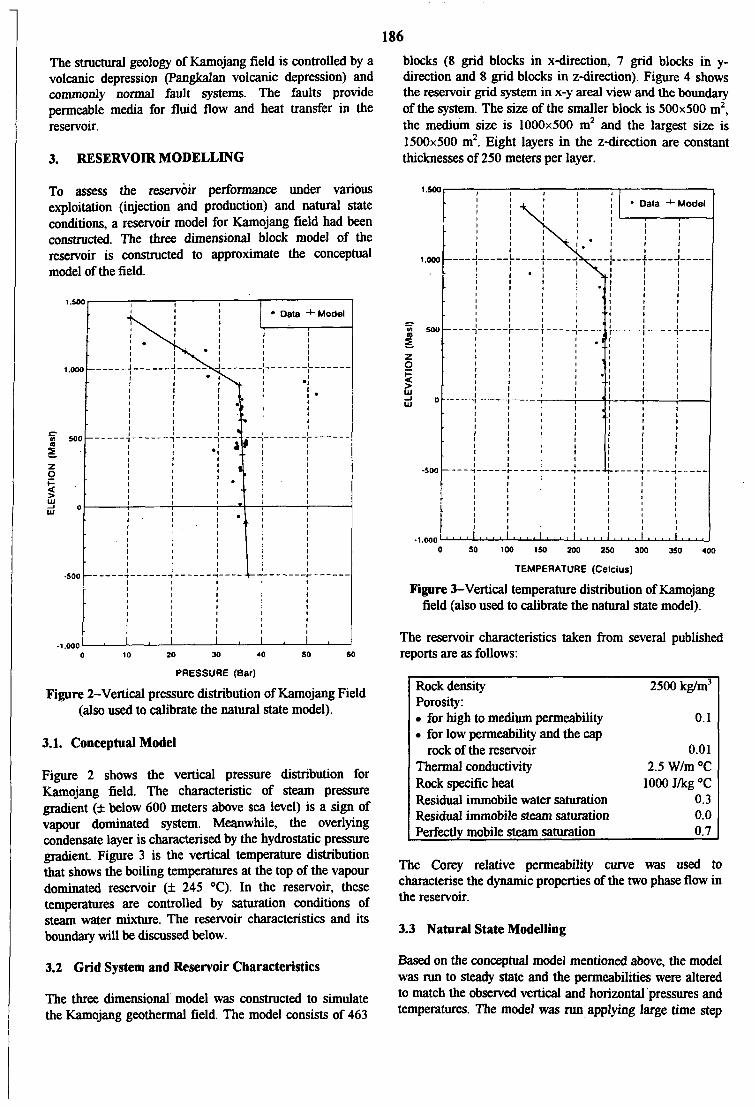
Figure 2-Vertical pressure distribution of Kamojang Field (also used to calibrate the natural state model).
3.1. Conceptual Model
Figure 2 shows the vertical pressure distribution for Kamojang field. The characteristic of steam pressure gradient (f below 600 meters above sea level) is a sign of vapour dominated system. Meanwhile, the overlying condensate layer is characterised by the hydrostatic pressure gradient. Figure 3 is the vertical temperature distribution that shows the boiling temperatures at the top of the vapour dominated reservoir (* 245 "C). In the reservoir, these temperatures are controlled by saturation conditions of steam water mixture. The reservoir characteristics and its boundary will be discussed below.
3.2 Grid System and Reservoir Characteristics
The three dimensional model was constructed to simulate the Kamojang geothermal field. The model consists of 463
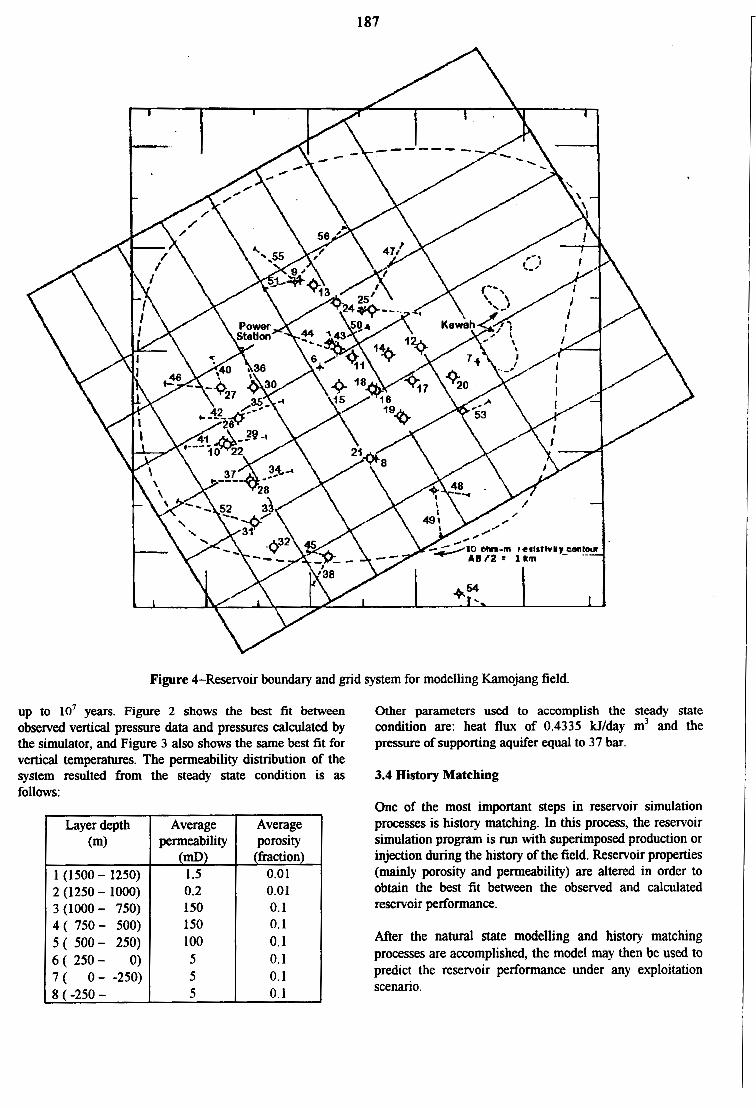
blocks (8 grid blocks in x-direction, 7 grid blocks in y- direction and 8 grid blocks in z-direction). Figure 4 shows the reservoir grid system in x-y areal view and the boundary of the system. The size of the smaller block is 500x500 m2, the medium size is 1000x500 m2 and the largest size is 1500x500 m2. Eight layers in the z-direction are constant thicknesses of 250 meters per layer.
0 SO 100 150 200 250 300 350 I
TEMPERATURE (Celcius)
Figure 3-Vertical temperature distribution of Kamojang field (also used to calibrate the natural state model).
I
The reservoir characteristics taken from several published reports are as follows:
Rock density Porosity:
for high to medium permeability for low permeability and the cap rock of the reservoir
Thermal conductivity Rock specific heat Residual immobile water saturation Residual immobile steam saturation Perfectly mobile steam saturation
2500 kg/m3
0.1
0.01 2.5 Wlm "C
1000 Jkg "C 0.3 0.0 0.7
The Corey relative permeability curve was used to characterise the dynamic properties of the two phase flow in the reservoir.
3.3 Natural State Modelling
Based on the conceptual model mentioned above, the model was run to steady state and the permeabilities were altered to match the observed vertical and horizontal pressures and temperatures. The model was run applying large time step
187
Layer depth (m)
Figure 4-Reservoir boundary and grid system for modelling Kamojang field.
Average permeability
up to lo7 years. Figure 2 shows the best fit between observed vertical pressure data and pressures calculated by the simulator, and Figure 3 also shows the same best fit for vertical temperatures. The permeability distribution of the system resulted from the steady state condition is as follows:
. .
1 (1 500 - 1250) 1.5 2 (1250 - 1000) 3 (IO00 - 750) 4 ( 750- 500) 5 ( 500- 250) 6 ( 250- 0) 7 ( 0 - -250) 8 ( -250 -
0.2 150 150 100 5 5 5
Average porosity
(fraction) 0.01 0.01 0.1 0.1 0.1 0.1 0.1 0.1
Other parameters used to accomplish the steady state condition are: heat flux of 0.4335 kJ/day m3 and the pressure of supporting aquifer equal to 37 bar.
3.4 History Matching
One of the most important steps in reservoir simulation processes is history matching. In this process, the reservoir simulation program is run with superimposed production or injection during the history of the field. Reservoir properties (mainly porosity and permeability) are altered in order to obtain the best fit between the observed and calculated reservoir performance.
After the natural state modelling and history matching processes are accomplished, the model may then be used to predict the reservoir performance under any exploitation scenario.
188 lO.oo0 -- - -..----- -I-...---- .._ -f DATA - MODEL
I
P 1.000
9, E
P loa
! I- I
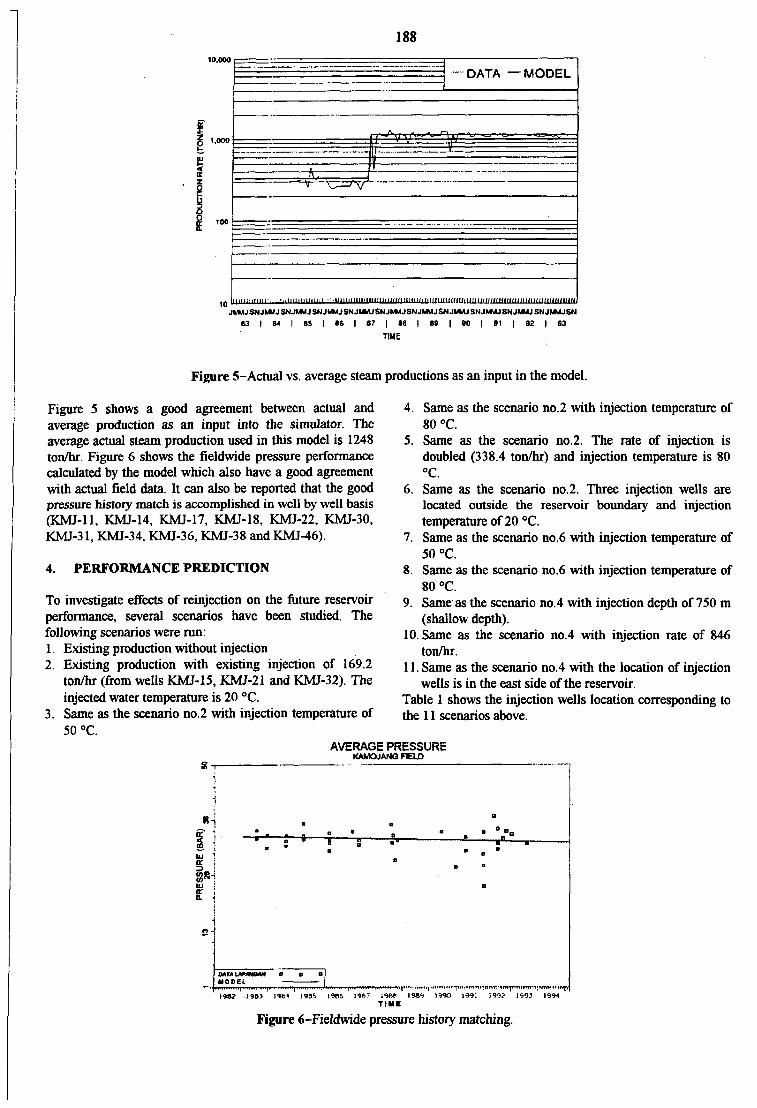
Figure 5-Actual vs. average steam productions as an input in the model.
Figure 5 shows a good agreement between actual and average production as an input into the simulator. The average actual steam production used in th is model is 1248 t o m . Figure 6 shows the fieldwide pressure performance calculated by the model which also have a good agreement with actual field data. It can also be reported that the good pressure history match is accomplished in well by well basis (KMJ-11, KMJ-14, KMJ-17, KMJ-18, KMJ-22, KMJ-30, KUI-31, KMJ-34, KMJ-36, KMJ-38 and KMJ-46).
4. PERFORMANCE PREDICTION
To investigate effects of reinjection on the future reservoir performance, several scenarios have been studied. The following scenarios were run: 1. Existing production without injection 2. Existing production with existing injection of 169.2
t o m (from wells KMJ-15, KMJ-21 and KMJ-32). The injected water temperature is 20 "C.
3. Same as the scenario no.2 with injection temperature of 50 "C.
4. Same as the scenario no.2 with injection temperature of 80 "C.
5. Same as the scenario no.2. The rate of injection is doubled (338.4 t o m ) and injection temperature is 80 "C.
6. Same as the scenario no.2. Three injection wells are located outside the reservoir boundary and injection temperature of 20 "C.
7. Same as the scenario no.6 with injection temperature of 50 "C.
8. Same as the scenario no.6 with injection temperature of 80 "C.
9. Same as the scenario 110.4 with injection depth of 750 m (shallow depth).
10.Same as the scenario no.4 with injection rate of 846 ton/hr.
11. Same as the scenario no.4 with the location of injection wells is in the east side of the reservoir.
Table 1 shows the injection wells location corresponding to the 11 scenarios above.
AVERAGE PRESSURE - ---. W A N 0 LlEU)
4 Zj
-LL mrAuH))ow D D
1 ljgl 19bJ 1 5 6 4 1935 1986 19H7 a 9 M l9Eq 1990 199: 1942 1513 199
T IME
Figure 6-Fieldwide pressure history matching.
189
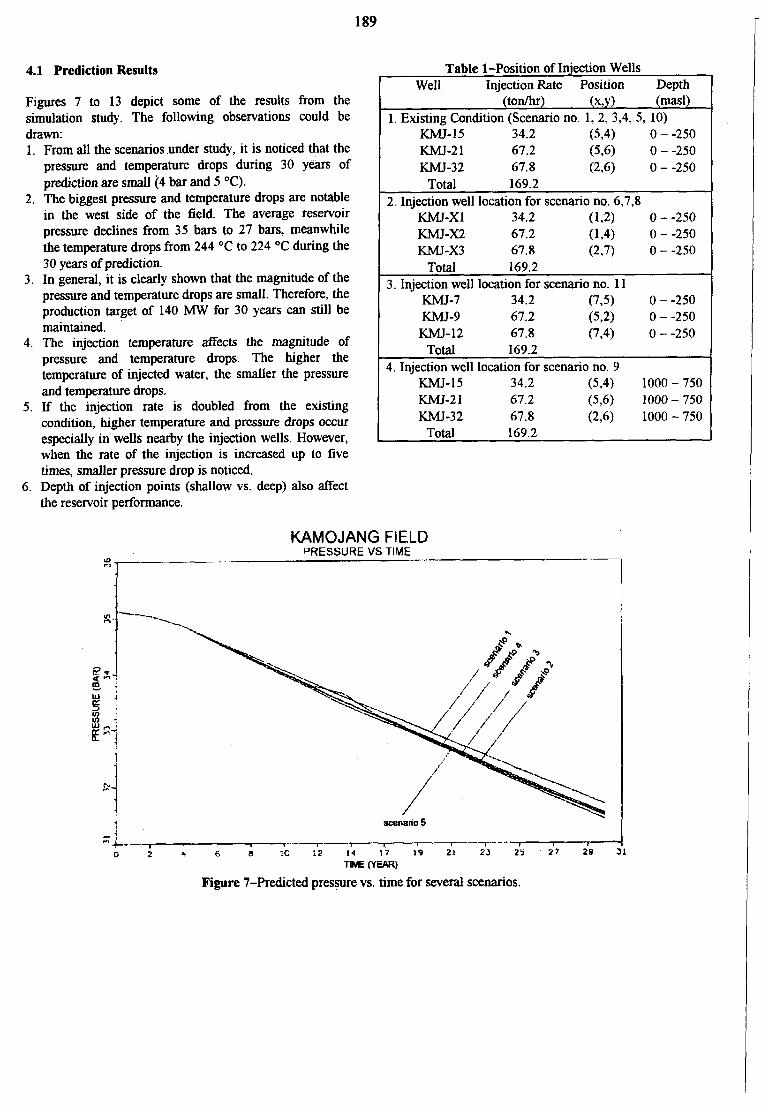
4.1 Prediction Results
Figures 7 to 13 depict some of the results from the simulation study. The following observations could be drawn: 1. From all the scenarios under study, it is noticed that the
pressure and temperature drops during 30 years of prediction are small (4 bar and 5 "C).
2. The biggest pressure and temperature drops are notable in the west side of the field. The average reservoir pressure declines from 35 bars to 27 bars, meanwhile the temperature drops from 244 "C to 224 OC during the 30 years of prediction.
3. In general, it is clearly shown that the magnitude of the pressure and temperature drops are small. Therefore, the production target of 140 MW for 30 years can still be maintained.
4. The injection temperature affkcts the magnitude of pressure and temperature drops. The higher the temperature of injected water, the smaller the pressure and temperature drops.
5 . If the injection rate is doubled from the existing condition, higher temperature and pressure drops occur especially in wells nearby the injection wells. However, when the rate of the injection is increased up to five times, smaller pressure drop is noticed.
6. Depth of injection points (shallow vs. deep) also affect the reservoir performance.
Table 1-Position of Injection Wells Well Injection Rate Position Depth
(ton/hr) (X,Y) (mal) 1. Existing Condrtion (Scenario no. 1, 2, 3,4, 5 , 10)
KUT-15 34.2 (5,4) 0--250 KMJ-2 1 67.2 (5,6) 0 - -250 KMJ-32 67.8 (2,6) 0 - -250
Total 169.2 2. Injection well location for scenario no. 6,7,8
KMJ-XI 34.2 (1,2) 0--250 KMJ-m 67.2 (1,4) 0 - -250 KMJ-x3 67.8 (2-7) 0 - -250
Total 169.2 3. Injection well location for scenario no. 11
KMJ-7 34.2 (73) 0 - -250 KMJ-9 67.2 (5,2) 0 --250 KMJ-12 67.8 (7,4) 0 - -250
Total 169.2 1. Injection well location for scenario no. 9
KMJ-15 34.2 (5,4) 1000 - 750 KMJ-2 1 67.2 (5,6) 1000 - 750 KMJ-32 67.8 (2,6) 1000 - 750
Total 169.2
KAMOJANG FIELD -- -. . PRESSURE VS TIME
1
1 I -7----
I I
0 2 * 6 8 IC i2 14 1 7 19 21 23 2 5 2 7 29 . ThlE Iyw)
Figure 7-Predicted pressure vs. time for several scenarios.
190
KAMOJANG FIELD TEMPERATURE VS TIME
n pl 1 . . I
-,, . ---- -T"-- , I I I I -1- --I I I
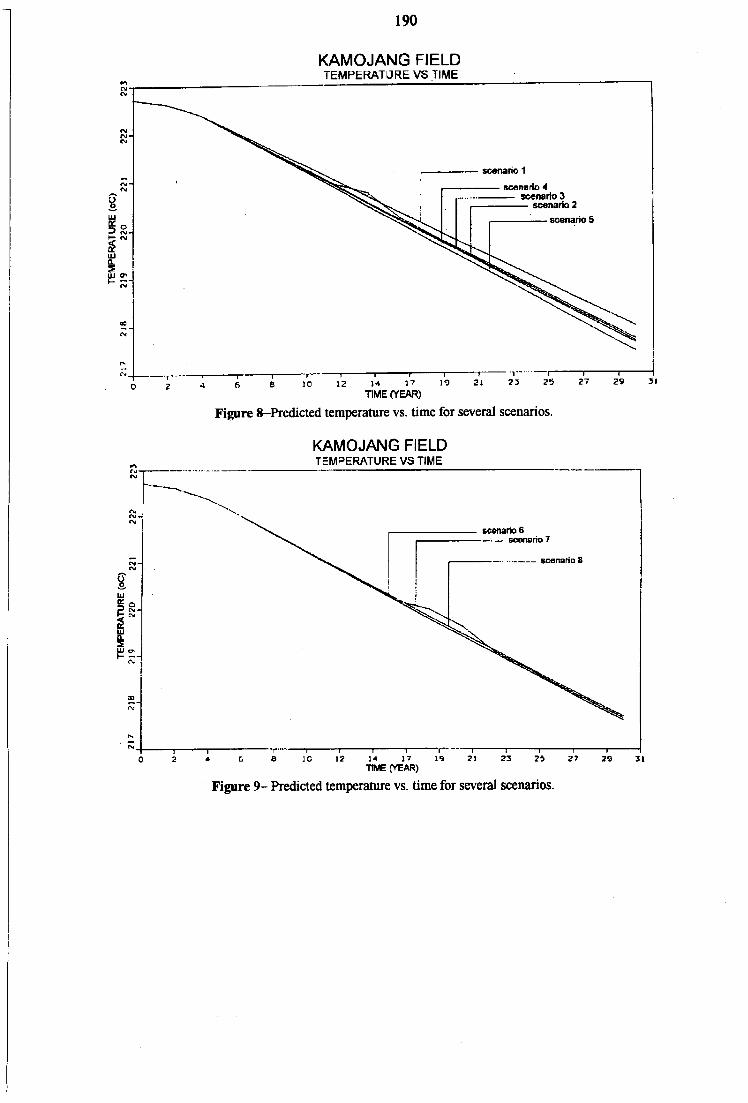
Figure 8-Predicted temperature vs. time for several scenarios.
2 4 A a io iz 14 17 19 z i 23 2s 27 zv TIME (YEAR)
KAMOJANG FIELD
1 ---..- TEMPERATURE VS TIME _._
scenario 6 -. - m r i o 7 \r --. ..--- scenario8
I I 1 I I 2 4 G 8 IC 12 14 17 19 21 23 25 2 7 29 51
I--- I
'r"" z I 8
TIME W A R )
Figure 9- Prdcted temperature vs. time for several scenarios.
I
l Y 1
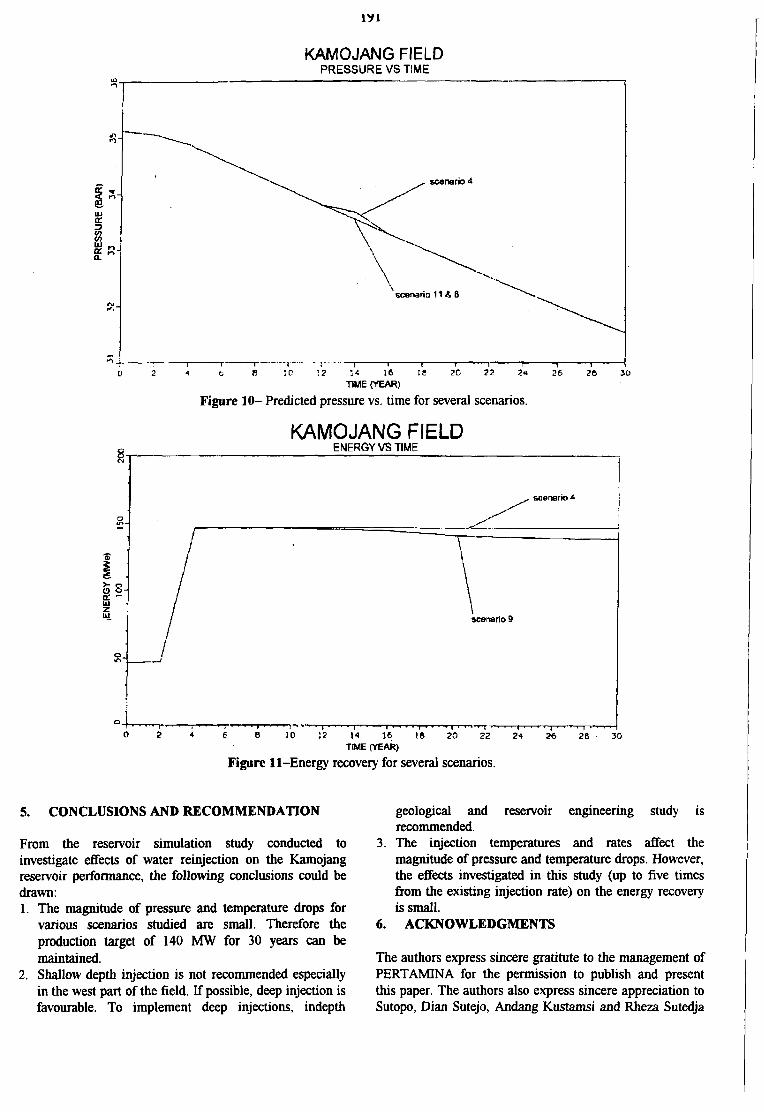
KAMOJANG FIELD PRESSURE VS TIME
h
Figure 10- Predicted pressure vs. time for several scenarios.
KAMOJANG FIELD ENERGY VS TIME
/ scenarw4 L
\ -
I \ scenario 9
5. CONCLUSIONS AND RECOMMENDATION
From the reservoir simulation study conducted to investigate effects of water reinjection on the Kamojang reservoir performance, the following conclusions could be drawn: 1. The rnagmtude of pressure and temperature drops for
various scenarios studied are small. Therefore the production target of 140 h4W for 30 years can be maintained.
2. Shallow depth injection is not recommended especially in the west part of the field. If possible, deep injection is favourable. To implement deep injections, indepth
geological and reservoir engineering study is recommended.
3. The injection temperatures and rates af€ect the magnitude of pressure and temperature drops. However, the effects investigated in this study (up to five times from the existing injection rate) on the energy recovery is small.
6. ACKNOWLEDGMENTS
The authors express sincere gratitute to the management of PERTAMINA for the permission to publish and present th is paper. The authors also express sincere appreciation to Sutopo, Dian Sutejo, Andang Kustamsi and R h e a Sutedja
192
for their helps during the study and preparing the 3. PERTAMINA. (1994). Study of Condensed Water manuscript. Reinjection into the Kamojang Reservoir Performance.
Final Report. 7. REFERENCES 4. Robert, D. (1988). Subsurface Study on the
Optimization of the Development of Kawah Kamojang 1. Barnett, B. (1988). Reservoir Assessment of the Geothermal Field. BeicipIGeoservices.
2. GENZL. (1986). Kamojang Reinjection Study. Final Kamojang Geothermal Field. GENZLISMS.
Report.
37
35
33
27
25
23
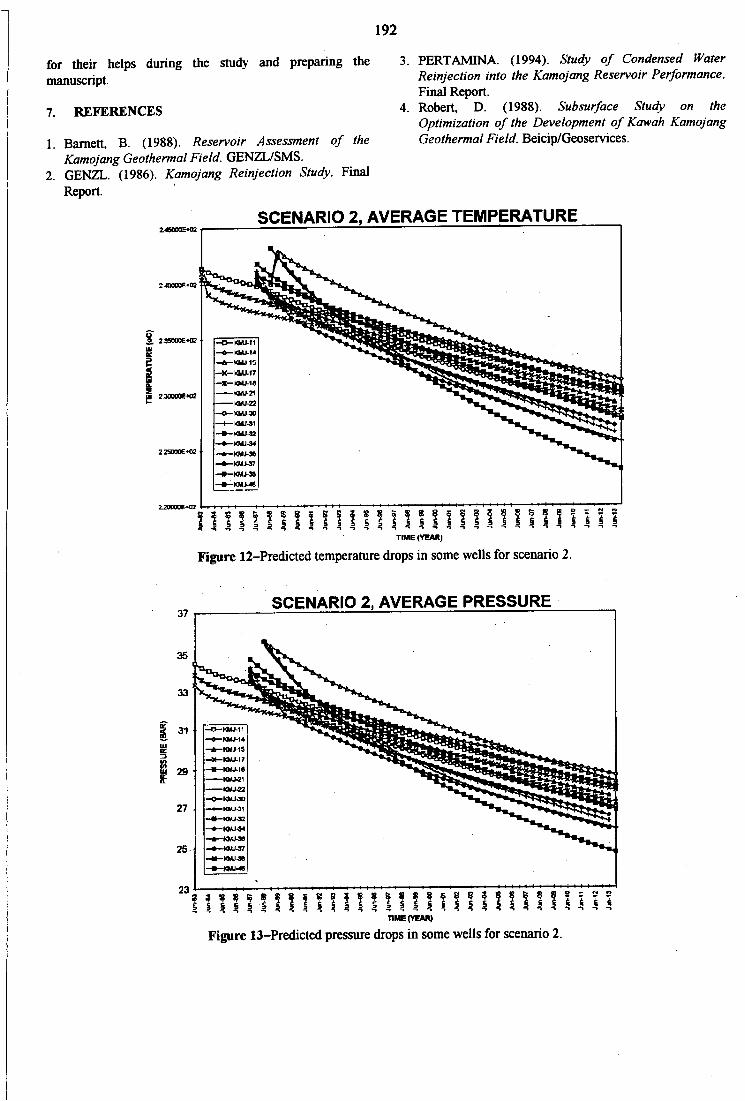
SCENARIO 2, AVERAGE TEMPERATURE
~ 5 9 f f f t f $ 2 f ~ f ~ ~ ~ f f f 5 ~ ~ ~ ~ ~ ~ ~ ~ ~ ~ TIME (YEAR)
Figure 12-Predicted temperature drops in some wells for scenario 2.
SCENARIO 2, AVERAGE PRESSURE
$ S I P ? 1 8
Figure 13-Predicted pressure drops in some wells for scenario 2. TIME Crrrvy