Embed Size (px)
Citation preview
ARTICLE
Geochemical aspects of molybdenum and precious metalsdistribution in the Sar Cheshmeh porphyry copper deposit,Iran
Behnam Shafiei & Jamshid Shahabpour
Received: 15 January 2011 /Accepted: 25 November 2011 /Published online: 9 December 2011# Springer-Verlag 2011
Abstract Constraints on hypogene distribution of Mo andprecious metals (Au and Ag) in the Sar Cheshmeh porphyrycopper deposit indicated that much of the metals tend to beconcentrated within the Cu-rich potassic core as well as withstrongly phyllic alteration. The gradual increase in metalconcentrations from weak potassic alteration to strongpotassic and phyllic alteration zones is observed that couldbe related to cumulative effects of the early to the late stagesof alteration and mineralization which is increased veindensity and metal deposition. Comparison between inter-element relationships in hypogene ore types indicated thatprecious metals and Cu positively correlate over a widerange of values, indicating a spatial and temporal associa-tion of precious metals with Cu sulfides. In contrast, thesympathetic relationship of Mo with Cu and precious metalsis only present in low-grade ores which are deposited inweak potassic alteration zone. This suggests contemporane-ous deposition of minor Mo with Cu and precious metalsduring the early stage of mineralization. In the transitionalstages of mineralization, significant portion of Mo deposi-tion occurred independent of Cu and precious metals which
is supported by negative correlation between Mo and Cu(also with precious metals) in silicified ores. In the late stageof mineralization, where the highest values of the metals hadoccurred with sericitization, differences in the distribution ofthe metals and inter-element relationships are significantthat could be attributed to the heterogeneous distributionof Mo, Cu, and precious metals during the evolution of theporphyry system. The hypogene metal arrangement indicatedthat ores with the highest values of Cu and precious metals arenot essentially enriched in Mo.
Keywords Mo .Au . Porphyry Cu . Sar Cheshmeh . Iran
Introduction
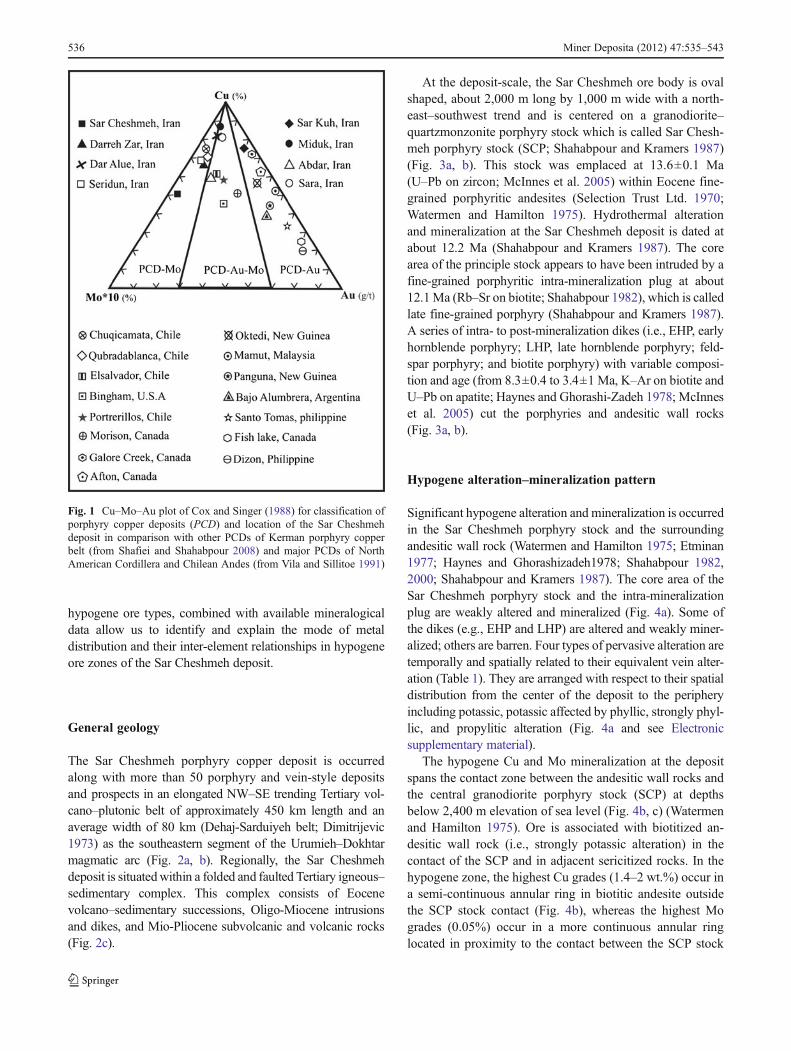
Most porphyry Cu deposits contain minor economic quan-tities of Mo and Au, and the huge tonnage of mined ores ofporphyry Cu deposits provides large quantities of Mo andAu as by-products. The Sar Cheshmeh deposit as a perfecttype–example of Mo-rich porphyry copper deposit (Fig. 1)contains ∼1,200 million tonnes of ore reserves with anaverage of 0.69 wt.% Cu, 0.03 wt.% Mo, 0.06 g/t Au, and1.22 g/t Ag (Porter 1998; Shahabpour 2000; Shafiei andShahabpour 2008) and is presently the largest producer ofCu and Mo in Iran owned by National Iranian CopperIndustries Company. In the context of hypogene alterationand mineralization patterns as well as hydrothermal evolution,the Sar Cheshmeh deposit is well studied (e.g., Watermen andHamilton 1975; Etminan 1977; Haynes and Ghorashi-Zadeh1978; Shahabpour 1982, 2000; Shahabpour and Kramers1987), but the geochemical distribution of Mo, Au, and Agin hypogene alteration and mineralization zones are still poor-ly documented. In the current study, a comprehensive data-base of Mo, Au, Ag, and Cu contents related to various
Electronic supplementary material The online version of this article(doi:10.1007/s00126-011-0393-0) contains supplementary material,which is available to authorized users.
B. Shafiei (*)Department of Geology, Faculty of Sciences,Golestan University,Gorgan, Irane-mail: [email protected]
J. ShahabpourDepartment of Geology, Faculty of Sciences, Shaheed BahonarUniversity of Kerman,Kerman, Irane-mail: [email protected]
Miner Deposita (2012) 47:535–543DOI 10.1007/s00126-011-0393-0
hypogene ore types, combined with available mineralogicaldata allow us to identify and explain the mode of metaldistribution and their inter-element relationships in hypogeneore zones of the Sar Cheshmeh deposit.
General geology
The Sar Cheshmeh porphyry copper deposit is occurredalong with more than 50 porphyry and vein-style depositsand prospects in an elongated NW–SE trending Tertiary vol-cano–plutonic belt of approximately 450 km length and anaverage width of 80 km (Dehaj-Sarduiyeh belt; Dimitrijevic1973) as the southeastern segment of the Urumieh–Dokhtarmagmatic arc (Fig. 2a, b). Regionally, the Sar Cheshmehdeposit is situatedwithin a folded and faulted Tertiary igneous–sedimentary complex. This complex consists of Eocenevolcano–sedimentary successions, Oligo-Miocene intrusionsand dikes, and Mio-Pliocene subvolcanic and volcanic rocks(Fig. 2c).
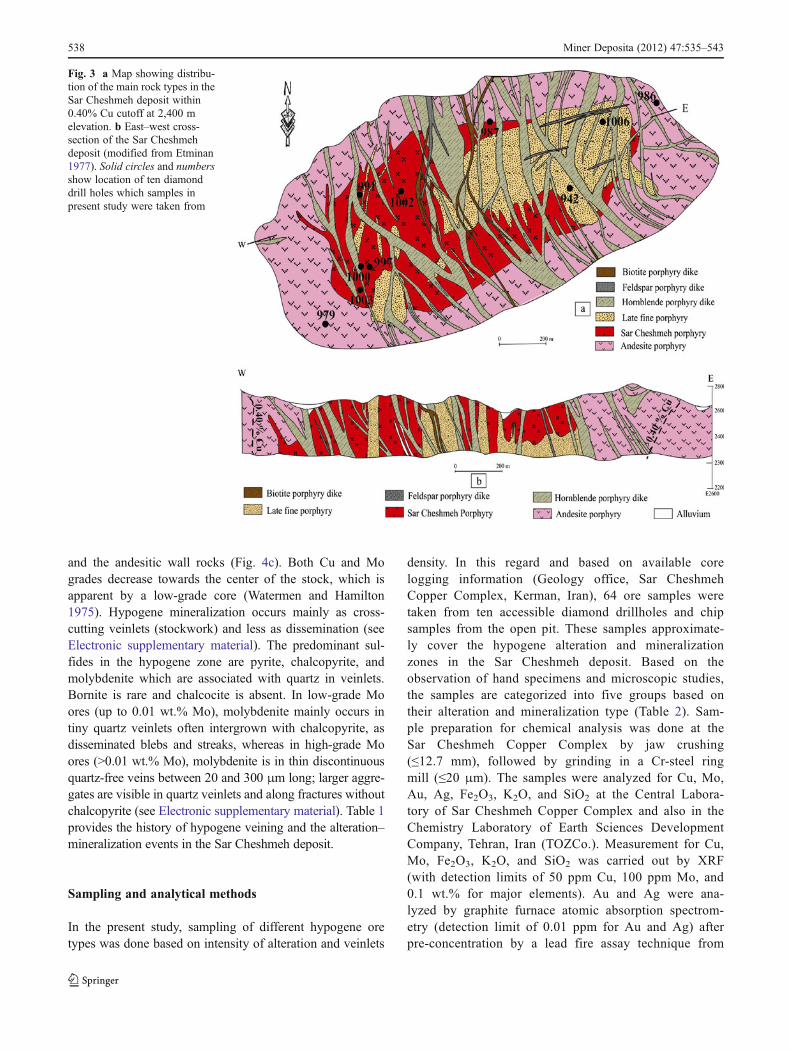
At the deposit-scale, the Sar Cheshmeh ore body is ovalshaped, about 2,000 m long by 1,000 m wide with a north-east–southwest trend and is centered on a granodiorite–quartzmonzonite porphyry stock which is called Sar Chesh-meh porphyry stock (SCP; Shahabpour and Kramers 1987)(Fig. 3a, b). This stock was emplaced at 13.6±0.1 Ma(U–Pb on zircon; McInnes et al. 2005) within Eocene fine-grained porphyritic andesites (Selection Trust Ltd. 1970;Watermen and Hamilton 1975). Hydrothermal alterationand mineralization at the Sar Cheshmeh deposit is dated atabout 12.2 Ma (Shahabpour and Kramers 1987). The corearea of the principle stock appears to have been intruded by afine-grained porphyritic intra-mineralization plug at about12.1Ma (Rb–Sr on biotite; Shahabpour 1982), which is calledlate fine-grained porphyry (Shahabpour and Kramers 1987).A series of intra- to post-mineralization dikes (i.e., EHP, earlyhornblende porphyry; LHP, late hornblende porphyry; feld-spar porphyry; and biotite porphyry) with variable composi-tion and age (from 8.3±0.4 to 3.4±1 Ma, K–Ar on biotite andU–Pb on apatite; Haynes and Ghorashi-Zadeh 1978; McInneset al. 2005) cut the porphyries and andesitic wall rocks(Fig. 3a, b).
Hypogene alteration–mineralization pattern
Significant hypogene alteration and mineralization is occurredin the Sar Cheshmeh porphyry stock and the surroundingandesitic wall rock (Watermen and Hamilton 1975; Etminan1977; Haynes and Ghorashizadeh1978; Shahabpour 1982,2000; Shahabpour and Kramers 1987). The core area of theSar Cheshmeh porphyry stock and the intra-mineralizationplug are weakly altered and mineralized (Fig. 4a). Some ofthe dikes (e.g., EHP and LHP) are altered and weakly miner-alized; others are barren. Four types of pervasive alteration aretemporally and spatially related to their equivalent vein alter-ation (Table 1). They are arranged with respect to their spatialdistribution from the center of the deposit to the peripheryincluding potassic, potassic affected by phyllic, strongly phyl-lic, and propylitic alteration (Fig. 4a and see Electronicsupplementary material).
The hypogene Cu and Mo mineralization at the depositspans the contact zone between the andesitic wall rocks andthe central granodiorite porphyry stock (SCP) at depthsbelow 2,400 m elevation of sea level (Fig. 4b, c) (Watermenand Hamilton 1975). Ore is associated with biotitized an-desitic wall rock (i.e., strongly potassic alteration) in thecontact of the SCP and in adjacent sericitized rocks. In thehypogene zone, the highest Cu grades (1.4–2 wt.%) occur ina semi-continuous annular ring in biotitic andesite outsidethe SCP stock contact (Fig. 4b), whereas the highest Mogrades (0.05%) occur in a more continuous annular ringlocated in proximity to the contact between the SCP stock
Fig. 1 Cu–Mo–Au plot of Cox and Singer (1988) for classification ofporphyry copper deposits (PCD) and location of the Sar Cheshmehdeposit in comparison with other PCDs of Kerman porphyry copperbelt (from Shafiei and Shahabpour 2008) and major PCDs of NorthAmerican Cordillera and Chilean Andes (from Vila and Sillitoe 1991)
536 Miner Deposita (2012) 47:535–543

Fig. 2 a Map showing regional distribution of the Cenozoic volcano-plutonic rocks (Urumieh-Dokhtar belt) and location of the Kermanporphyry copper belt in the southeast of Iran (simplified from Shafieiet al. 2009). b Geological subdivision map of the Kerman region andlocation of the Sar Cheshmeh deposit and other porphyry copper deposits
in Dehaj-Sarduiyeh belt (simplified andmodified fromDimitrijevic 1973;Saric and Mijalkovic 1973). c Geological map of Pariz area in centralpart of Dehaj-Sarduiyeh belt showing location of the Sar Cheshmehand other porphyry copper deposits in this area (modified fromEtminan 1977)
Miner Deposita (2012) 47:535–543 537
and the andesitic wall rocks (Fig. 4c). Both Cu and Mogrades decrease towards the center of the stock, which isapparent by a low-grade core (Watermen and Hamilton1975). Hypogene mineralization occurs mainly as cross-cutting veinlets (stockwork) and less as dissemination (seeElectronic supplementary material). The predominant sul-fides in the hypogene zone are pyrite, chalcopyrite, andmolybdenite which are associated with quartz in veinlets.Bornite is rare and chalcocite is absent. In low-grade Moores (up to 0.01 wt.% Mo), molybdenite mainly occurs intiny quartz veinlets often intergrown with chalcopyrite, asdisseminated blebs and streaks, whereas in high-grade Moores (>0.01 wt.% Mo), molybdenite is in thin discontinuousquartz-free veins between 20 and 300 μm long; larger aggre-gates are visible in quartz veinlets and along fractures withoutchalcopyrite (see Electronic supplementary material). Table 1provides the history of hypogene veining and the alteration–mineralization events in the Sar Cheshmeh deposit.
Sampling and analytical methods
In the present study, sampling of different hypogene oretypes was done based on intensity of alteration and veinlets
density. In this regard and based on available corelogging information (Geology office, Sar CheshmehCopper Complex, Kerman, Iran), 64 ore samples weretaken from ten accessible diamond drillholes and chipsamples from the open pit. These samples approximate-ly cover the hypogene alteration and mineralizationzones in the Sar Cheshmeh deposit. Based on theobservation of hand specimens and microscopic studies,the samples are categorized into five groups based ontheir alteration and mineralization type (Table 2). Sam-ple preparation for chemical analysis was done at theSar Cheshmeh Copper Complex by jaw crushing(≤12.7 mm), followed by grinding in a Cr-steel ringmill (≤20 μm). The samples were analyzed for Cu, Mo,Au, Ag, Fe2O3, K2O, and SiO2 at the Central Labora-tory of Sar Cheshmeh Copper Complex and also in theChemistry Laboratory of Earth Sciences DevelopmentCompany, Tehran, Iran (TOZCo.). Measurement for Cu,Mo, Fe2O3, K2O, and SiO2 was carried out by XRF(with detection limits of 50 ppm Cu, 100 ppm Mo, and0.1 wt.% for major elements). Au and Ag were ana-lyzed by graphite furnace atomic absorption spectrom-etry (detection limit of 0.01 ppm for Au and Ag) afterpre-concentration by a lead fire assay technique from
Fig. 3 a Map showing distribu-tion of the main rock types in theSar Cheshmeh deposit within0.40% Cu cutoff at 2,400 melevation. b East–west cross-section of the Sar Cheshmehdeposit (modified from Etminan1977). Solid circles and numbersshow location of ten diamonddrill holes which samples inpresent study were taken from
538 Miner Deposita (2012) 47:535–543
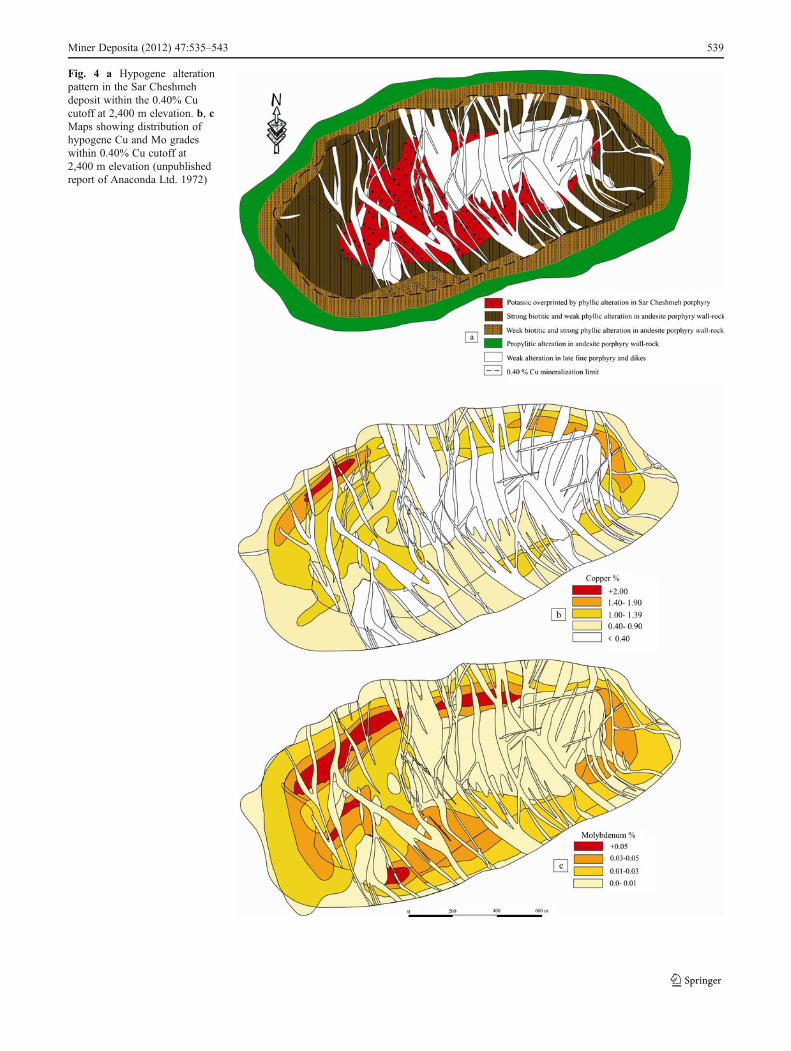
Fig. 4 a Hypogene alterationpattern in the Sar Cheshmehdeposit within the 0.40% Cucutoff at 2,400 m elevation. b, cMaps showing distribution ofhypogene Cu and Mo gradeswithin 0.40% Cu cutoff at2,400 m elevation (unpublishedreport of Anaconda Ltd. 1972)
Miner Deposita (2012) 47:535–543 539
25 g sample powder. The detailed sample descriptionand analytical data are shown in the Electronic supple-mentary material.
Results
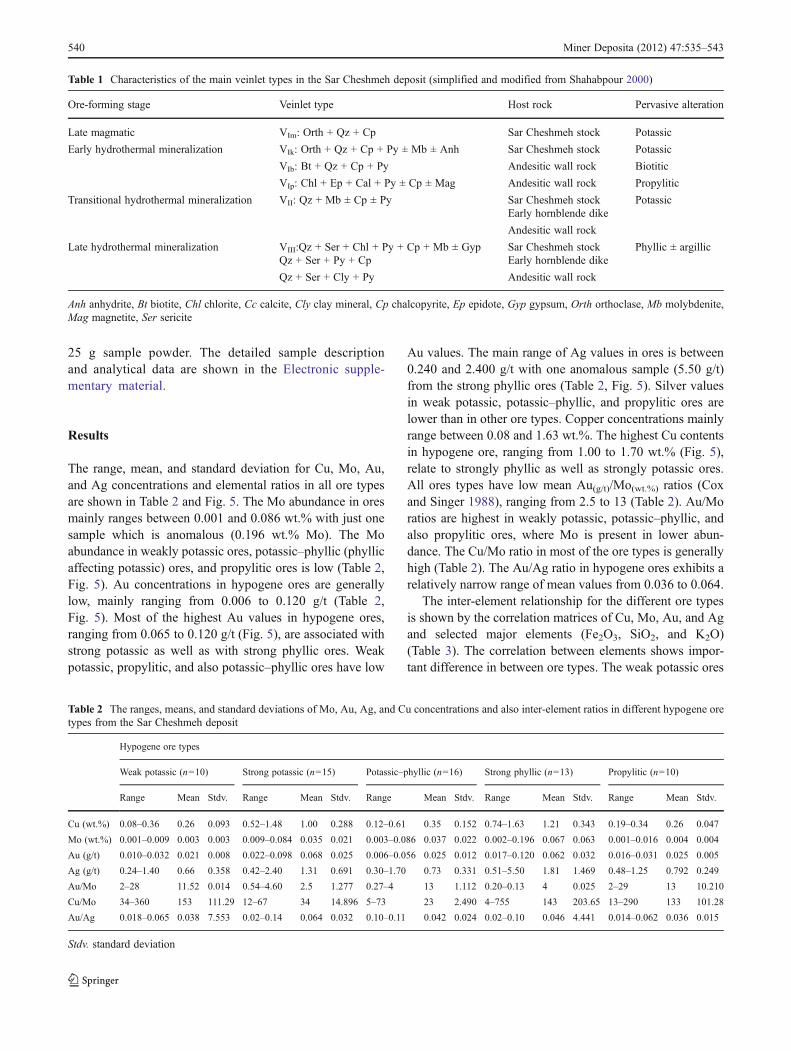
The range, mean, and standard deviation for Cu, Mo, Au,and Ag concentrations and elemental ratios in all ore typesare shown in Table 2 and Fig. 5. The Mo abundance in oresmainly ranges between 0.001 and 0.086 wt.% with just onesample which is anomalous (0.196 wt.% Mo). The Moabundance in weakly potassic ores, potassic–phyllic (phyllicaffecting potassic) ores, and propylitic ores is low (Table 2,Fig. 5). Au concentrations in hypogene ores are generallylow, mainly ranging from 0.006 to 0.120 g/t (Table 2,Fig. 5). Most of the highest Au values in hypogene ores,ranging from 0.065 to 0.120 g/t (Fig. 5), are associated withstrong potassic as well as with strong phyllic ores. Weakpotassic, propylitic, and also potassic–phyllic ores have low
Au values. The main range of Ag values in ores is between0.240 and 2.400 g/t with one anomalous sample (5.50 g/t)from the strong phyllic ores (Table 2, Fig. 5). Silver valuesin weak potassic, potassic–phyllic, and propylitic ores arelower than in other ore types. Copper concentrations mainlyrange between 0.08 and 1.63 wt.%. The highest Cu contentsin hypogene ore, ranging from 1.00 to 1.70 wt.% (Fig. 5),relate to strongly phyllic as well as strongly potassic ores.All ores types have low mean Au(g/t)/Mo(wt.%) ratios (Coxand Singer 1988), ranging from 2.5 to 13 (Table 2). Au/Moratios are highest in weakly potassic, potassic–phyllic, andalso propylitic ores, where Mo is present in lower abun-dance. The Cu/Mo ratio in most of the ore types is generallyhigh (Table 2). The Au/Ag ratio in hypogene ores exhibits arelatively narrow range of mean values from 0.036 to 0.064.
The inter-element relationship for the different ore typesis shown by the correlation matrices of Cu, Mo, Au, and Agand selected major elements (Fe2O3, SiO2, and K2O)(Table 3). The correlation between elements shows impor-tant difference in between ore types. The weak potassic ores
Table 1 Characteristics of the main veinlet types in the Sar Cheshmeh deposit (simplified and modified from Shahabpour 2000)
Ore-forming stage Veinlet type Host rock Pervasive alteration
Late magmatic VIm: Orth + Qz + Cp Sar Cheshmeh stock Potassic
Early hydrothermal mineralization VIk: Orth + Qz + Cp + Py ± Mb ± Anh Sar Cheshmeh stock Potassic
VIb: Bt + Qz + Cp + Py Andesitic wall rock Biotitic
VIp: Chl + Ep + Cal + Py ± Cp ± Mag Andesitic wall rock Propylitic
Transitional hydrothermal mineralization VII: Qz + Mb ± Cp ± Py Sar Cheshmeh stock PotassicEarly hornblende dike
Andesitic wall rock
Late hydrothermal mineralization VIII:Qz + Ser + Chl + Py + Cp + Mb ± Gyp Sar Cheshmeh stock Phyllic ± argillicQz + Ser + Py + Cp Early hornblende dike
Qz + Ser + Cly + Py Andesitic wall rock
Anh anhydrite, Bt biotite, Chl chlorite, Cc calcite, Cly clay mineral, Cp chalcopyrite, Ep epidote, Gyp gypsum, Orth orthoclase, Mb molybdenite,Mag magnetite, Ser sericite
Table 2 The ranges, means, and standard deviations of Mo, Au, Ag, and Cu concentrations and also inter-element ratios in different hypogene oretypes from the Sar Cheshmeh deposit
Hypogene ore types
Weak potassic (n010) Strong potassic (n015) Potassic–phyllic (n016) Strong phyllic (n013) Propylitic (n010)
Range Mean Stdv. Range Mean Stdv. Range Mean Stdv. Range Mean Stdv. Range Mean Stdv.
Cu (wt.%) 0.08–0.36 0.26 0.093 0.52–1.48 1.00 0.288 0.12–0.61 0.35 0.152 0.74–1.63 1.21 0.343 0.19–0.34 0.26 0.047
Mo (wt.%) 0.001–0.009 0.003 0.003 0.009–0.084 0.035 0.021 0.003–0.086 0.037 0.022 0.002–0.196 0.067 0.063 0.001–0.016 0.004 0.004
Au (g/t) 0.010–0.032 0.021 0.008 0.022–0.098 0.068 0.025 0.006–0.056 0.025 0.012 0.017–0.120 0.062 0.032 0.016–0.031 0.025 0.005
Ag (g/t) 0.24–1.40 0.66 0.358 0.42–2.40 1.31 0.691 0.30–1.70 0.73 0.331 0.51–5.50 1.81 1.469 0.48–1.25 0.792 0.249
Au/Mo 2–28 11.52 0.014 0.54–4.60 2.5 1.277 0.27–4 13 1.112 0.20–0.13 4 0.025 2–29 13 10.210
Cu/Mo 34–360 153 111.29 12–67 34 14.896 5–73 23 2.490 4–755 143 203.65 13–290 133 101.28
Au/Ag 0.018–0.065 0.038 7.553 0.02–0.14 0.064 0.032 0.10–0.11 0.042 0.024 0.02–0.10 0.046 4.441 0.014–0.062 0.036 0.015
Stdv. standard deviation
540 Miner Deposita (2012) 47:535–543
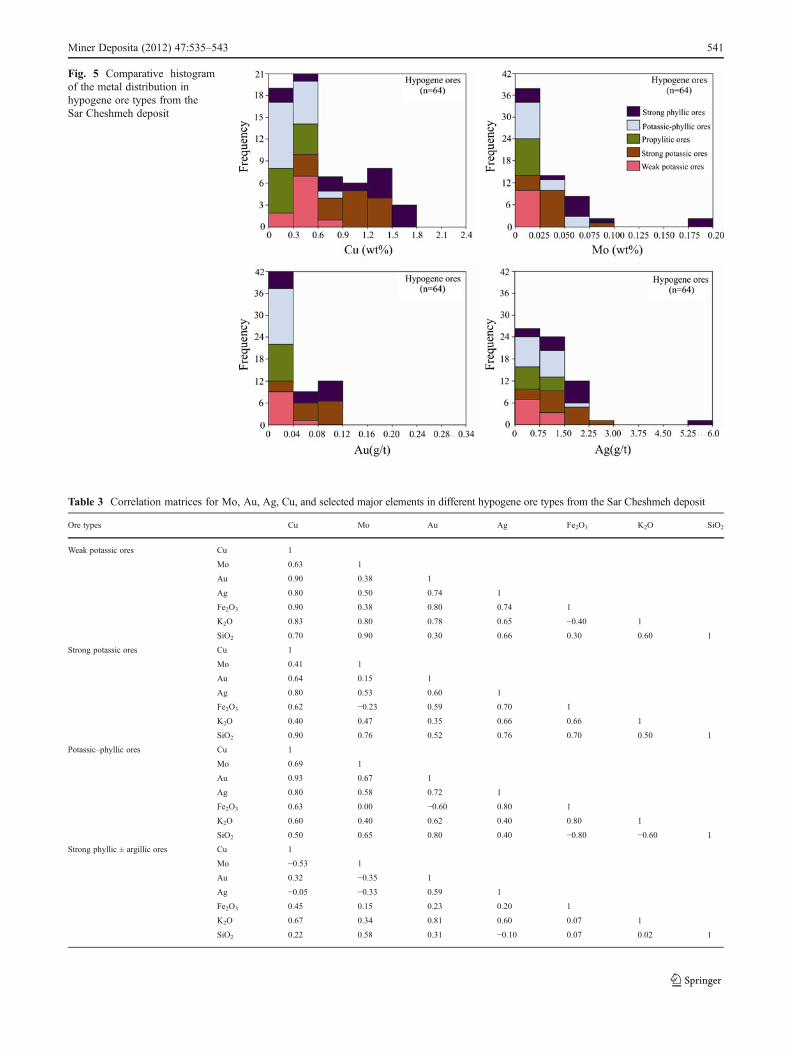
Fig. 5 Comparative histogramof the metal distribution inhypogene ore types from theSar Cheshmeh deposit
Table 3 Correlation matrices for Mo, Au, Ag, Cu, and selected major elements in different hypogene ore types from the Sar Cheshmeh deposit
Ore types Cu Mo Au Ag Fe2O3 K2O SiO2
Weak potassic ores Cu 1
Mo 0.63 1
Au 0.90 0.38 1
Ag 0.80 0.50 0.74 1
Fe2O3 0.90 0.38 0.80 0.74 1
K2O 0.83 0.80 0.78 0.65 −0.40 1
SiO2 0.70 0.90 0.30 0.66 0.30 0.60 1
Strong potassic ores Cu 1
Mo 0.41 1
Au 0.64 0.15 1
Ag 0.80 0.53 0.60 1
Fe2O3 0.62 −0.23 0.59 0.70 1
K2O 0.40 0.47 0.35 0.66 0.66 1
SiO2 0.90 0.76 0.52 0.76 0.70 0.50 1
Potassic–phyllic ores Cu 1
Mo 0.69 1
Au 0.93 0.67 1
Ag 0.80 0.58 0.72 1
Fe2O3 0.63 0.00 −0.60 0.80 1
K2O 0.60 0.40 0.62 0.40 0.80 1
SiO2 0.50 0.65 0.80 0.40 −0.80 −0.60 1
Strong phyllic ± argillic ores Cu 1
Mo −0.53 1
Au 0.32 −0.35 1
Ag −0.05 −0.33 0.59 1
Fe2O3 0.45 0.15 0.23 0.20 1
K2O 0.67 0.34 0.81 0.60 0.07 1
SiO2 0.22 0.58 0.31 −0.10 0.07 0.02 1
Miner Deposita (2012) 47:535–543 541

exhibited a significant inter-element positive correlation(Table 3). In these ores, Mo shows a moderate positive corre-lation with Cu, moderately weak correlation with Au as wellas Ag, and a strong positive correlation with K2O and SiO2. Incontrast, Au shows strong positive correlation with Cu, Ag,Fe2O3, and K2O (Table 3). In strong potassic ores, where oreswith highest values of metals are present, Mo is weakly tomoderately correlated with Au, SiO2, Cu, and Ag, whereas thecorrelation with K2O is strong. Similar to weak potassic ores,the strong potassic ores show a moderate to strong positivecorrelation between Au, Ag, Cu, K2O, and SiO2 (Table 3). Inpotassic–phyllic ores, there is a moderate to strong positivecorrelation between Cu, Mo, Au, and Ag (Table 3). In theseores, there is no correlation between Mo and Fe2O3 as well asbetween Mo and K2O, but Mo is strongly correlated withSiO2. Au and Cu showmoderate to strong positive correlationwith K2O and SiO2. In strong phyllic ores, where the highestvalues of Mo, Au, Ag, and Cu in hypogene zone are present,there is no relationship between Mo with Cu, Au, and Ag.Within these ores, Mo is positively correlated with SiO2 andK2O. In comparison with Mo, there are moderate positivecorrelations between Cu, Au, Ag, K2O, and Fe2O3 (Table 3).
Discussion
The observed upward gradual increase in the metal valuesfrom weak to strong potassic and also to strong phyllic ores
can be related to the increase in alteration intensity (increas-ing K2O and SiO2) and vein density (Etminan 1977;Shahabpour 2000; Hezarkhani 2006) (Fig. 6). The weak tomoderate positive correlation between Mo and Cu and alsobetween Mo and SiO2 in strong potassic ores indicates thatpart of the Mo mineralization occurred contemporaneouslywith Cu (VIk and also VIb veinlets). It seems that signifi-cant portions of Mo deposition in strong potassic alterationoccurred independent of Cu. This could be related to thecommon occurrence of molybdenite (without chalcopyrite)along the margins of the VII veinlets. Moreover, the struc-tural control on the part of Mo mineralization which isreflected in the occurrence of the highest Mo values alongthe contact of the potassically altered SCP stock with bio-titized andesitic wall rocks (Watermen and Hamilton 1975;Shahabpour 2000) indicates the different mode of molybde-nite distribution in strong potassic ores. Strong positivecorrelations between Au, Ag, Cu, Fe2O3, K2O, and SiO2
in weak to strong potassic and potassic–phyllic alterationsuggests that Au (with or without Ag) could be associatedwith Cu-bearing minerals. This is confirmed by the presenceof invisible gold as solid solution and/or trace impurity inchalcopyrite and also visible gold as inclusions in chalco-pyrite, pyrite, and quartz from the Sar Cheshmeh deposit(Salari-Rad et al. 1999). In strong phyllic ores, where thehighest values of the metals occurred, there are at least twopopulations of higher values for Mo, Cu, and Au (Fig. 6).The increase in metal concentrations from potassic to
Fig. 6 Factors controlling themetal distribution in hypogenemineralization zone of the SarCheshmeh deposit
542 Miner Deposita (2012) 47:535–543
phyllic could be related to cumulative effects of the early,transitional, and the late stages of alteration which increasedveinlet density.
Conclusions
Study on metals distribution within hypogene ore zones inthe Sar Cheshmeh porphyry copper deposit indicated thatdifferences in distribution of the metals are not significant.The highest values of Mo and precious metals are concen-trated into Cu-rich potassic core of the deposit and alsoassociated with strong phyllic ores which are developed inupper parts of porphyry system. In spite of similarity inhypogene metal distribution, the sympathetic relationshipbetween Mo and other metals (i.e., precious metals andCu) is only observed within hypogene ore zones which areformed at the early stage of mineralization that show lowvalues for all metals. In contrast, there is no direct relation-ship between Mo and precious metals and also between Moand Cu within hypogene high-grade ores which are formed inthe transitional and the late stage of mineralization. UnlikeMo, the precious metals and Cu vary sympathetically over awide range of hypogene grades, indicating the close associa-tion of the precious metals with Cu sulfides. The hypogenemetal arrangement and relationships between the metals notonly imply the contemporaneous deposition of proportions ofCu, Mo, and precious metals at the early stage of minerali-zation (in the form of VIk and VIb veinlets), but also suggestreconcentration of these metals due to cumulative effects ofthe early, transitional, and the late hydrothermal processes.This resulted in heterogeneous distribution of molybdeniteand chalcopyrite (VII and VIII veinlets) in potassic–phyllicand strong phyllic alteration zones which are developed in theupper parts of the porphyry system.
Acknowledgments The authors are sincerely grateful to Sar CheshmehCopper Complex for providing samples, sample preparation, andanalysis. This work was funded in part by Golestan University grantto B. Sh and partly supported by Research and Development Center ofNational Iranian Copper Industries Company. The authors would liketo thank Prof. Ryan Mathur (Department of Geology, Juniata College,Huntingdon, PA, USA) for proof reading and language polishing ofthe text. We gratefully acknowledge T. Ulrich and S. Rowins forconstructive reviews and valuable comments which helped to improvethe manuscript. The editor B. Lehmann and associate editor T. Bissigare thanked for helpful suggestions and diligent editorial handling.
References
Cox DP, Singer DA (1988) Distribution of gold in porphyry copperdeposits. USGS Bull 1877-C:C1
Dimitrijevic MD (1973) Geology of the Kerman Region. Geol SurvIran Rep 52:p334
Etminan H (1977) Le porphyre cuprifere de Sar Cheshmeh (Iran), roledes phases fluids dans les mechanisms d’alteration et de mineral-ization. Sci Terr Mem 34:78, In French
Haynes SJ, Ghorashi-Zadeh M (1978) Hydrothermal alteration, Cumineralization, and supergene pattern, Sar Cheshmeh, Iran. EconGeol 73:1391–1392 [Abs]
Hezarkhani A (2006) Hydrothermal evolution of the Sar Cheshmehporphyry Cu–Mo deposit, Iran: evidence from fluid inclusions. JAsian Earth Sci 28:409–422
McInnes BIA, Evans NJ, Fu FQ, Garwin S, Belousova E, Griffin WL,Bertens A, Sukarna D, Permanadewi S, Andrew RL, Deckart K(2005) Thermal history analysis of selected Chilean, Indonesian,and Iranian porphyry Cu-Mo-Au deposits. In: Porter TM (ed)Supper porphyry copper and gold deposits: a global perspective.PGC, Adelaide, 1: 27–40
Porter M (1998) An overview of the worlds porphyry and otherhydrothermal copper and gold deposits and their distribution. In:Porter M (ed) Porphyry and hydrothermal copper and gold depos-its: a global perspective. Perth, Conf Proc. Glenside, South Aus-tralia, Aus Min Found, 3–17
Salari-Rad MM, Tsunekawa M, Hirajima T, Yoneda T (1999) Goldoccurrence in the Sar Cheshmeh porphyry copper ore and itsbehavior during beneficiation. In: Proceeding of Copper99-Cobre99, International environment conference, v.II-Mineralprocessing/Environment 129–143
Saric V, Mijalkovic N (1973) Metallogenic map of Kerman region,1:500000 scale. In: Nedimovic R (ed) Exploration for ore depositsin Kerman region. Geol Surv Iran Rep 53:247
Selection Trust Ltd. (1970) Feasibility report for the Sar Cheshmehproject of Kerman Copper Industries. Unpublished geology andore reserves report 4: p120
Shafiei B, Shahabpour J (2008) Gold distribution in porphyrycopper deposits of Kerman region, southeastern Iran. J Sci19:247–260
Shafiei B, Haschke M, Shahabpour J (2009) Recycling of orogenic arccrust triggers porphyry Cu-mineralization in Kerman Cenozoicarc rocks, southeastern Iran. Miner Deposita 44:265–283
Shahabpour J (1982) Aspects of alteration and mineralization at the SarCheshmeh copper-molybdenum deposit, Kerman, Iran. Unpub-lished Ph.D. thesis, University of Leeds, England, p 342
Shahabpour J (2000) Behaviour of Cu and Mo in the Sar Cheshmehporphyry Cu deposit, Kerman, Iran. CIM Bull 93:44–52
Shahabpour J, Kramers JD (1987) Lead isotope data from the SarCheshmeh porphyry copper deposit, Kerman, Iran. Miner Depos-ita 22:278–281
Vila T, Sillitoe RH (1991) Gold-rich porphyry systems in theMaricunga belt, Northern Chile. Econ Geol 86:1238–1260
Watermen GC, Hamilton RL (1975) The Sar Cheshmeh porphyrycopper deposit. Econ Geol 70:568–576
Miner Deposita (2012) 47:535–543 543