Embed Size (px)
Citation preview
GEOCHEMICAL SOIL GAS SURVEYA Site Investigation of SW30-5-13-W2M
Weyburn Field, SASKATCHEWANMonitoring Project Number 2
Submitted to: Cameron and Jane Kerr
Submitted by: Paul Lafleur P.Eng., PresidentPetro-Find Geochem LtdSaskatoon SK S7K 7X3
Date: March 16, 2011
2
TABLE OF CONTENTS
1. Summary, p42. Introduction, p113. Property Description and Location, p154. Lineaments, Fractures/Faults Weyburn Reservoir, p185. Geochemical Soil Gas Surveys in Frozen Soils, p216. Methodology, p247. Geochemical Soil Gas Survey for Hydrocarbons, p268. Geochemical Soil Gas Survey for CO2, p289. Well Patterns – Oil Producers, CO2 Injectors and Water Injectors, p3210.Carbon Isotope Analysis of CO2, p3611.Results and Interpretation, p4012.Statement of Qualifications – Paul Lafleur, p50
List of Figures
Figure 1. Location Kerr Property, p11Figure 2. Kerr Property in Midst of Weyburn Field, p13Figure 2A. Kerr Quarter Section in Relation to Pipelines, p14Figure 2B. Kerr Quarter Section – Infrastructure, p15Figure 2C. Surface Lineament Distribution of Weyburn Field, p16Figure 3. Soil Survey Locations, p17Figure 4A. Lineaments Interpreted as High-Angle Faults – Traces Imposedon 1997 Air Photo, p18Figure 4B. Schematic of Growing Ice Lens, p20Figure 4C. Sampling Frozen Soil, p22Figure 4D. Sampling Equipment, p24Figure 4E. CO2 Concentrations in Soils, p27Figure 5A. Existing and Future EOR Area, p31Figure 5B. CO2 Flooding Program (as of December 2010), p32Figure 5C. Wells in Vicinity of Kerr Property, p33Figure 5D. Saline Injection Well Kerr Property, p34Figure 5E. Wells in SW Corner of Kerr Property, p35Figure 5F. Kerr Property Relative to Water Injection (WI), WaterAlternating CO2 (WAG) and CO2 Injection Wells, p36Figure 6. Delta CCO2 Pre- and Post-Injection of CO2, IEA WeyburnProject, p37Figure 7. Delta Carbon (%) for Pre-And Post-Injection CO2, p38
3
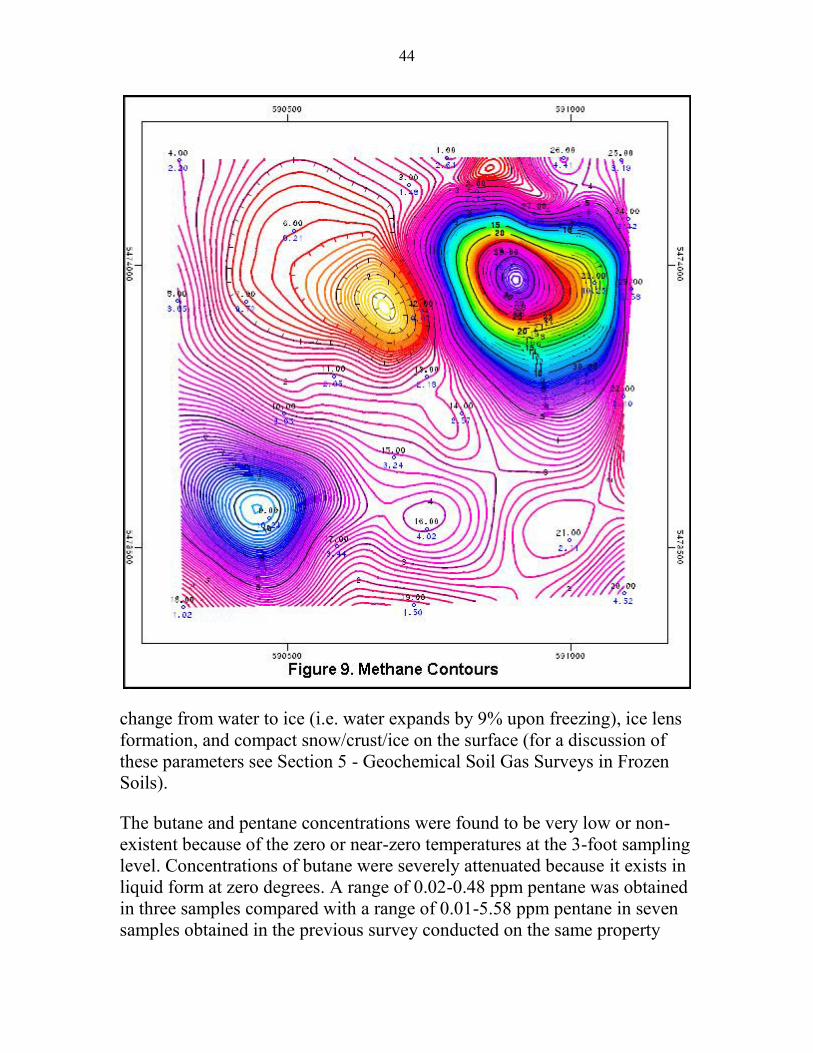
Figure 7A. Detection of Anthropogenic CO2 Horizontally Along FaultsUsing Stable Carbon Isotopes, p39Figure 8. CO2 Contours, p40Figure 9. Methane Contours, p44Figure 9A. C2+ Contours, p45Figure 10. Plot Ethane vs Methane, p46
List of Tables
Table 1. U.S. Exposure Standards for CO2, p30Table 2. Comparison Delta13C Values for CO2 Gas Between Weyburn andPembina EOR Operations and Kerr Property Surveys, p47
Appendices
Tab 1. Data - Hydrocarbon and CO2 Analysis of Soil GasTab 2. Data - Analysis of Stable Carbon Isotopes in CO2Tab 3 Examples of Lineament StudiesTab 4. Complexity of Enhanced Oil Recovery Operations in the Vicinity ofthe Kerr Property; Individual Ownership PlanTab 5. Contour Maps of CO2, Methane and C2+
Exhibits (both in tube)
Exhibit 1. Methane, Ethane+ and CO2 Contour Maps on ClearExhibit 2. Base Map with Sample Locations
4
1. Summary
Major Findings:
1. Soil gas surveys were found to be feasible in the winter but thehydrocarbon and CO2 concentrations in frozen soils wereseverely attenuated in comparison with a survey of the sameproperty in August 2010.
2. Notwithstanding the effects of the frozen soils three majoranomalies for each of CO2, methane and C2+ were found,particularly in the vicinity of the Kerr residence (now abandoned)and near the producing and abandoned oil wells in the SW cornerof the property.
3. The provenance of the CO2 in the soil gases found on the Kerrproperty is clearly the anthropogenic CO2 injected into thereservoir. Results clearly confirm the findings of an August 2010soil gas survey conducted by Petro-Find. Stable carbon isotopes ofthe CO2 and methane/ethane ratios were the determinativefactors.
4. A major soil gas anomaly of CO2 with a DeltaCCO2 of -23.5 inthe immediate vicinity of an oil well and a nearby abandoned oilwell in the SW corner of the Kerr property clearly shows that atleast one of the wells is leaking and that the CO2 is anthropogenic.
5. An almost exact correlation of methane to thermogenic ethaneconcentrations fingerprints essentially all the CO2 found in thesoil gas as anthropogenic.
6. Additional evidence, both empirical and interpretative, also linksthe CO2 found in soil gas with the anthropogenic CO2 injectedinto the Weyburn reservoir.
7. The CO2 and light hydrocarbons found in soils on the Kerrproperty are attributable to leaky wells, vertical/ lateral escape byfast flow paths along fracture/fault systems, and leakage in theform of plumes migrating to the surface by micro-fractures.
Cam and Jane Kerr initiated this second study mainly because they felt that awinter investigation would contribute to a better year-round picture of CO2leakage and its effects this could have on the health and safety of peopleliving in the Weyburn field area. A previous soil gas survey by Petro-Find ofthe same property was conducted in August 2010, which was provided toCenovus and the Saskatchewan Ministry of Energy and Resources in
5
October 2010 and released to the press January 11, 2011. The Kerrs haveremained concerned about the lack of surface monitoring for CO2 seepageover the Weyburn Pool since 2005.
A 30-sample soil gas survey on the Kerr property during the winter foundanomalous concentrations as high as 10,668 ppm for CO2 and 30 ppm formethane. However, the concentrations of both CO2 and the lighthydrocarbons except for methane and ethane were severely attenuated infrozen soils when compared to the results of a soil gas survey conductedAugust 2010 when concentrations of CO2 in soil gas reached as high as110,000 ppm. To the author’s knowledge, this is the first time a soil gassurvey has been conducted under winter conditions to assess CO2 in soilsover a reservoir undergoing EOR.
The surface of the property was sampled by a proprietary probe using acordless drill. Winter conditions made drilling somewhat more difficult thanin the summer because of the frozen soils and snow up to two feet deep. Thesnow was cleared away and a pre-drill 24 inches long was used to penetratethe icy ground surface. The probe was then inserted into the hole and drilledto the normal 3-foot depth, well below the A-and B-zones of the soil profileto avoid contamination by biogenic CO2 and methane.
In frozen soils CO2 concentrations in soil gas were drastically attenuatedbecause of various impermeable barriers, which impeded the migration fromthe deeper subsurface. The reduced concentrations in soils at three-footdepth were mainly due to barriers caused by the loss of porosity/permeability and ice lenses.
The provenance of the CO2 in the soil gases found on the Kerr property isclearly the Synfuels anthropogenic CO2, which is being injected into thereservoir. Results confirm the findings of the August 2010 soil gas surveyconducted by Petro-Find. The source of the CO2 in soil gas is firmlyestablished by: An average Delta 13CCO2 that compares with the last previously
known value (2001) for the CO2 in reservoir fluids. The analysis in2001 of CO2 from produced fluids would be the same as the CO2 inthe reservoir as well as for the soil gas CO2, which would havemigrated from the reservoir along fast-flow paths.
A major shift from baseline values of Delta 13C of the CO2 inproduced fluids from -12 to -14 established in 2000 before CO2
6
injection began to an average value of -23.1 found in this soil gassurvey. The analysis in 2000 of CO2 from produced fluids would bethe same as the CO2 in the reservoir as well as for the soil gas CO2,which would have migrated from the reservoir along fast-flow paths.
A much heavier carbon isotope ratio (i.e. less negative) than forbiogenic CO2.
A major soil gas anomaly of CO2 (Figure 8) with a Delta 13CCO2 of-23.5 in the immediate vicinity of an oil well and a nearby abandonedoil well in the SW corner of the Kerr property clearly shows that atleast one of the wells is leaking and that the CO2 is anthropogenic.
An almost exact correlation of methane to thermogenic ethaneconcentrations fingerprints essentially all the CO2 found in the soilgas as anthropogenic.
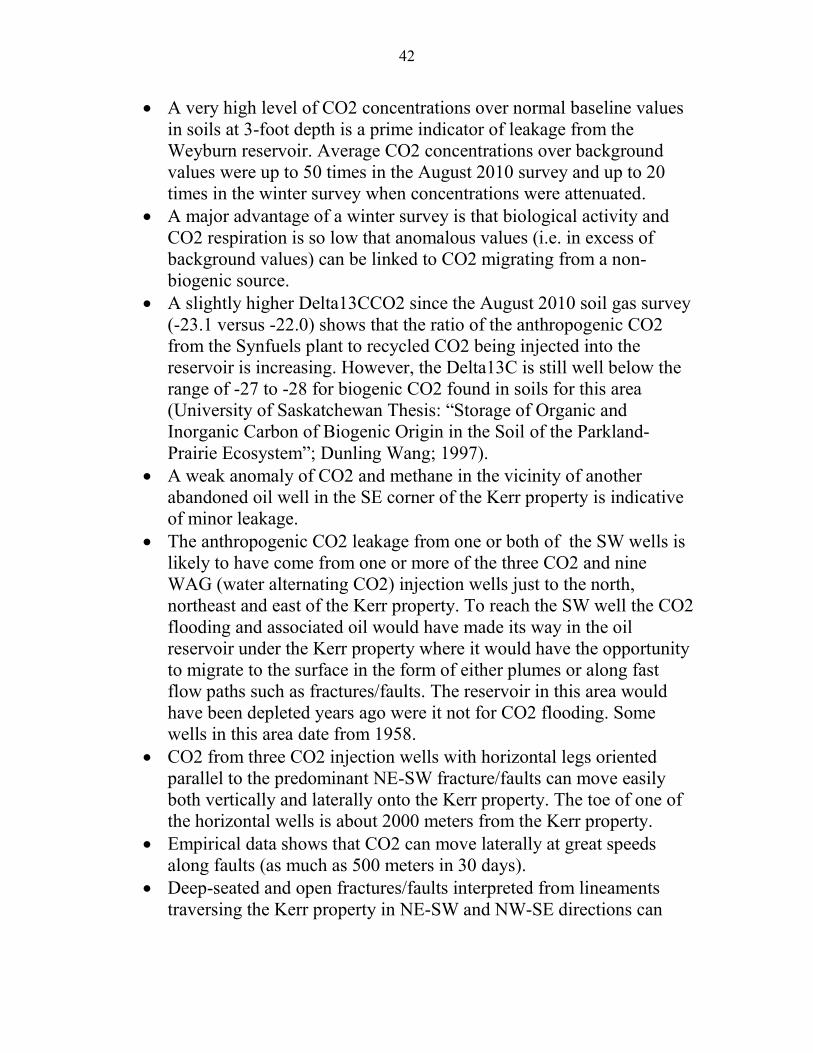
The following additional evidence, both empirical and interpretative, linksthe CO2 found in soil gas with the anthropogenic CO2 injected into theWeyburn reservoir: A very high level of CO2 concentrations over normal baseline values
in soils at 3-foot depth is a prime indicator of leakage from theWeyburn reservoir. Average CO2 concentrations over backgroundvalues were up to 50 times in the August 2010 survey and up to 20times in the winter survey when concentrations were attenuated.
A major advantage of a winter survey is that biological activity andCO2 respiration is so low that anomalous values (i.e. in excess ofbackground values) can be linked to CO2 migrating from a non-biogenic source.
A slightly higher Delta13CCO2 since the August 2010 soil gas survey(-23.1 versus -22.0) shows that the ratio of the anthropogenic CO2from the Synfuels plant to recycled CO2 being injected into thereservoir is increasing. However, the Delta13CCO2 is still well belowthe range of -27 to -28 for biogenic CO2 found in soils for this area(University of Saskatchewan Thesis: “Storage of Organic andInorganic Carbon of Biogenic Origin in the Soil of the Parkland-Prairie Ecosystem”; Dunling Wang; 1997).
A weak anomaly of CO2 and methane in the vicinity of anotherabandoned oil well in the SE corner of the Kerr property is indicativeof minor leakage.
The anthropogenic CO2 leakage from one or both of the SW wells islikely to have come from one or more of the three CO2 and nine
7
WAG (water alternating CO2) injection wells just to the north,northeast and east of the Kerr property. To reach the SW well the CO2flooding and associated oil would have made its way in the oilreservoir under the Kerr property where it would have the opportunityto migrate to the surface in the form of either plumes or along fastflow paths such as fractures/faults. The reservoir in this area wouldhave been depleted years ago were it not for CO2 flooding. Somewells date from 1958.
CO2 from three CO2 injection wells with horizontal legs orientedparallel to the predominant NE-SW fracture/faults can move easilyboth vertically and laterally onto the Kerr property. The toe of one ofthe horizontal wells is about 2000 meters from the Kerr property.
Empirical data shows that CO2 can move laterally at great speedsalong faults (as much as 500 meters in 30 days).
Deep-seated and open fractures/faults interpreted from lineamentstraversing the Kerr property in NE-SW and NW-SE directions canprovide the means for CO2 and hydrocarbons to escape both verticallyand laterally to the surface.
A portion of the anomalous CO2 and light hydrocarbons found insoils over the entire property is the result of upward migration in theform of plumes through the subsurface from the reservoir without thebenefit of fast flow paths such as faults. Accordingly, the currentsurface patterns could be an exact replica (given some time lag) of theconcentration patterns at the reservoir level.
The molecular size of CO2 presents no barrier to upward migration asheavier pentane is able to migrate from the reservoir to the surface.
Soil gas sampling at a three-foot depth, well below the A- and B-zones of the soil profile where biogenic CO2 is mainly produced,assures that almost all the CO2 measured comes from another source,i.e. from the reservoir.
Sloughs and humic areas on the down thrown side of faults whereanaerobic conditions favor production of biogenic CO2 are simplyavoided. Petro-Find proprietary passive probes can sample sloughsbut these were not used in either the winter or summer soil gassurveys.
Macroseeps provides direct evidence of the existence of open faults,which can provide easy access to the surface for CO2 as well.Leakages of oil or macroseeps observed in the gravel pits (August
8
2010 report) can only have found their way to the surface by one ormore open faults that have intersected the Weyburn oil reservoir.
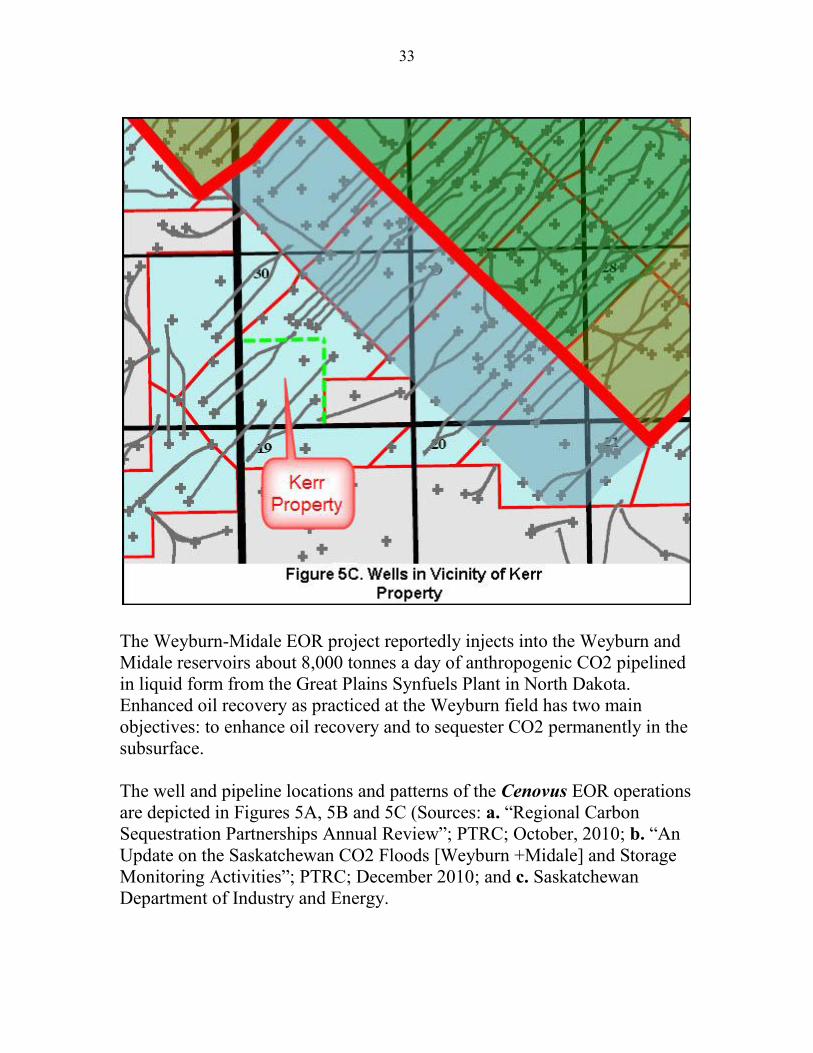
The Weyburn-Midale EOR project reportedly injects into the Weyburn andMidale reservoirs about 8,000 tonnes a day of anthropogenic CO2 pipelinedin liquid form from the Great Plains Synfuels Plant in North Dakota.Enhanced oil recovery as practiced at the Weyburn field has two mainobjectives: to enhance oil recovery and to sequester CO2 permanently in thesubsurface.
The CO2 in a supercritical state is directed to injection wells strategicallyplaced within a pattern of wells to optimize the areal sweep of the reservoir.The injected CO2 becomes miscible with residual oil forming a concentratedoil bank. Water (brine) injection sweeps the oil from the injection sites to theproducing wells. Also used are WAG (water alternating gas) wells, whichinject alternatively CO2 and brine from the same well to mitigate thetendency for the lower viscosity CO2 to channel its way ahead of thedisplaced oil.
The higher-grade anomalies of CO2, methane and C2+ were found in thenortheast section of the property where the Kerr residence is located. CO2anomalies were also found in the northwest and southwest and both methaneand C2+ anomalies were located in the northeast and southwest. As noted inthe August 2010 Survey the contours of CO2, methane and C2+concentrations can exhibit different patterns from time to time because of thedynamic nature of EOR operations with alternating water and CO2injections.
High coincident anomalies of CO2, methane and C2+ in the vicinity of anoperating oil well and an abandoned well in the SW corner of the Kerrproperty and stable carbon isotopes strongly indicates that at least one ofthese wells is leaking and that the source is anthropogenic. No leakage wasdetected in the August 2010 survey because sampling points were not asclose to the wells. A minor leakage of CO2 and methane was noted in thevicinity of an abandoned oil well in the SE corner of the Kerr property.
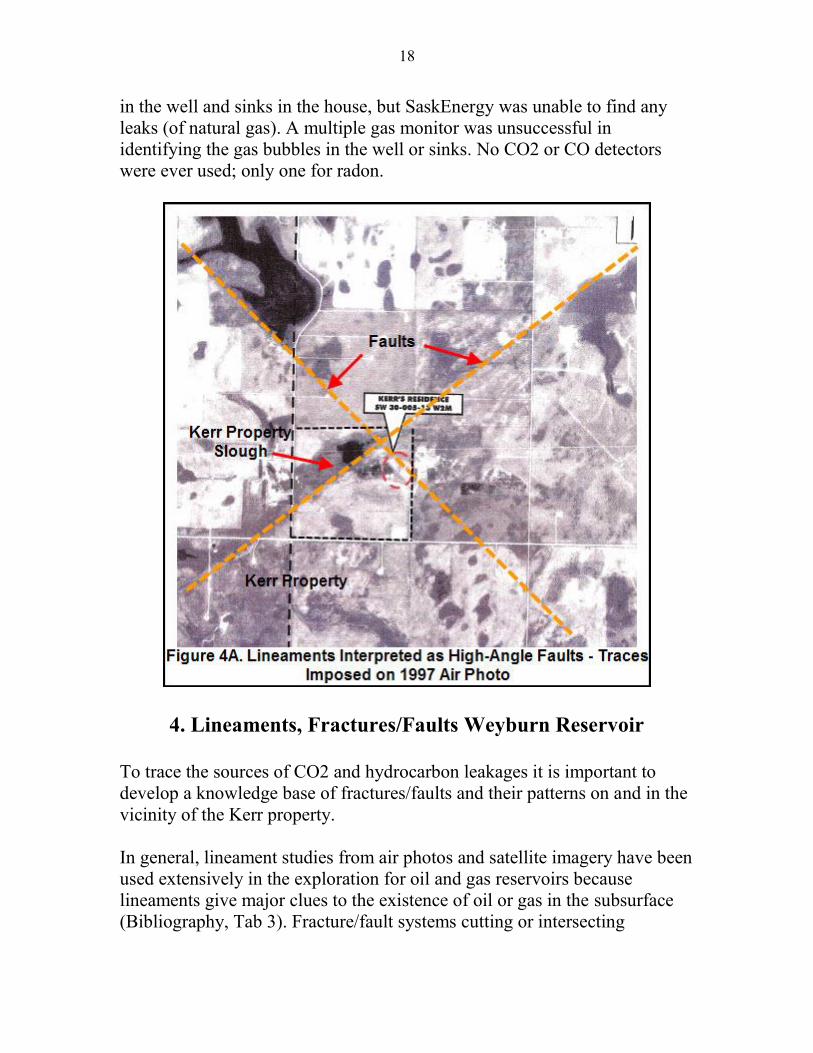
Two major lineaments that intersect just north of the Kerr residence areinterpreted as faults (Figure 4A). The coincidence of the high anomalies ofCO2, methane and C2+ with their intersection indicates that the faults areopen. Moreover, the faults are interpreted to be high angle because of their
9
linearity and deep seated because of their length. The north side of the NE-SW fault appears to have been downthrown as well as the east side of theNW-SE fault because of the location of the ponds and naturally occurringsloughs.
The interpretation of lineaments as deep-seated faults demonstrates that theoverlying thick cap rock of anhydrite and shale aquitards have beenbreached and may not be as an impermeable barrier to the upward mobilityof reservoir gases as is generally thought. Some of the faults are interpretedto be of the open kind, which can act as conduits for light hydrocarbonsand CO2 as well as the heavier hydrocarbons in the form of oil to reach thesurface. The fact that oil in the form of blue sheen was found in the gravelpits near the intersection of the faults last summer (August 2010 Report)provides further evidence that the faults are open rather than closed.
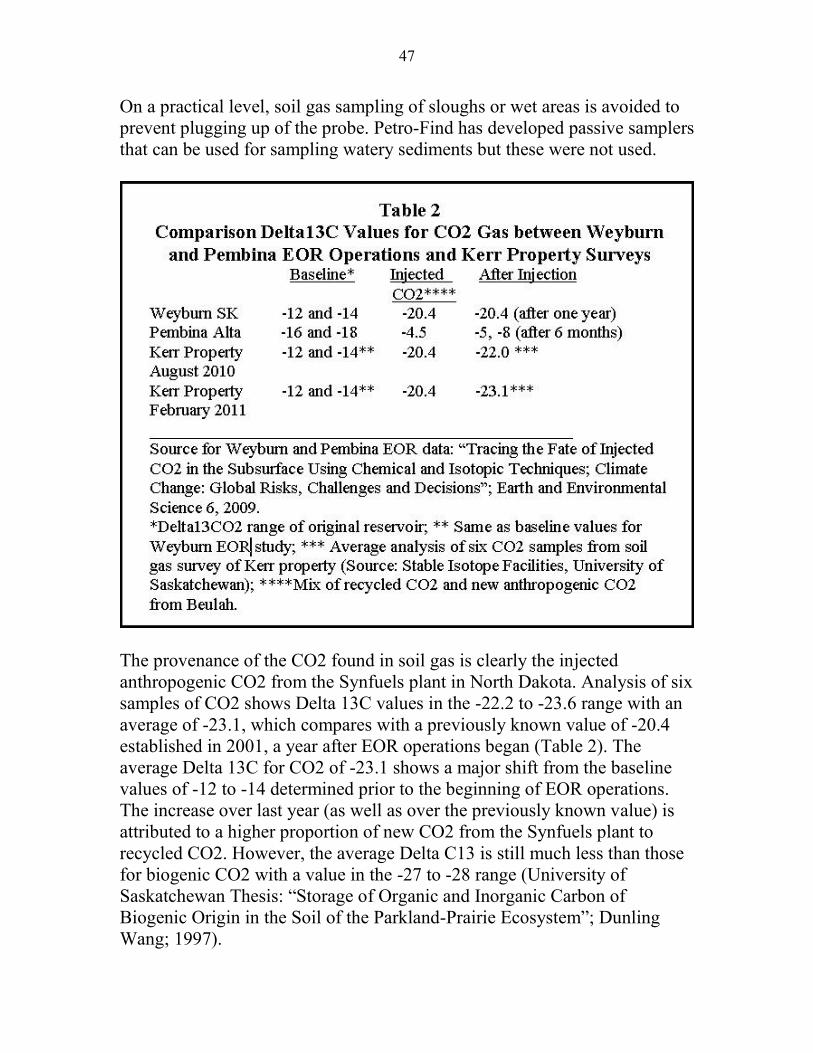
The provenance of the CO2 found in soil gas is clearly the injectedanthropogenic CO2 from the Synfuels plant, North Dakota. Analysis of sixsamples of CO2 in soil gas shows Delta 13C values in the -22.2 to -23.6range with an average of -23.1, which compares with a previously knownvalue of -20.4 established in 2001, a year after EOR operations began (Table2). In 2001 the Delta 13C of the CO2 from produced fluids would be thesame for the CO2 in the reservoir as well as for the CO2 in soil gas becausethe CO2 migrates from the reservoir to the surface along fast-flow paths.The average Delta 13C of -23.1 shows a major shift from the baseline valuesof -12 to -14 for the produced fluids determined prior to the beginning ofEOR operations. The increase over last year (as well as over the previouslyknown value) is attributed to a higher proportion of new CO2 from theSynfuels plant to recycled CO2. However, the average Delta C13 is stillmuch less than those for biogenic CO2 with a range in value between -27 to-28 (University of Saskatchewan Thesis: “Storage of Organic and InorganicCarbon of Biogenic Origin in the Soil of the Parkland-Prairie Ecosystem”;Dunling Wang; 1997).
The Petro-Find soil gas method assures that the data is highly accurate andrepeatable. Other methods, such as the closed chamber and probe/infra-red,do not always produce as good a result. A closed chamber unit, which isplaced essentially on top of the ground, is not that useful because it measuresconcentrations and fluxes of both biogenic and anthropogenic CO2. Someunits can measure CO2 concentrations only up to 5,000 ppm. Theprobe/infra-red method usually requires frequent calibration in the field and
10
can only measure CO2 and methane, not the other light hydrocarbons.Subsequent sampling using the same probe for measurement of otheranalytes can result in dilution with ambient air.
The survey clearly shows the usefulness of geochemical soil gas surveys inassessing EOR projects for leakage of CO2 and light hydrocarbons. Soil gassurveys may also be able to determine the extent and patterns of CO2flooding operations at depth. It can be concluded that the CO2 and the lighthydrocarbons have penetrated the supposedly impermeable anhydrite caprock and have found their way to the surface by micro fractures in the formof plumes and by fast-flow conduits such as faults and fractures.
In the author’s opinion a mathematical simulation, conducted in the contextof the IEA study(“IEA GHG Weyburn CO2 Monitoring & Storage Project),cannot predict with any accuracy the containment of CO2 over a period of5,000 years based on data obtained over only a short monitoring period(2001-2004) and sampling of only 5% of the Weyburn/Midale reservoirarea.
Near the abandoned Kerr home the CO2 concentration is about 2,700 ppm,but at about 350 meters to the NW of the house it is 10,000 ppm (at theepicenter of a major anomaly). The Recommended Exposure Limit (REL)for the workplace, based on a time-weighted average (TWA) is 5,000 ppmover a 10-hour workday during a 40-hour week (Table 1). For someoneremaining in the home for 24 hours per day, which can happen in winter, thelimiting threshold is half the workday value, or 2,500 ppm.
Had the Kerrs still lived in their home (now abandoned because of healthconcerns), CO2 could have entered in dangerous concentrations through thecrawl space due to negative pressures caused by a natural gas heatingfurnace. Further soil gas could be drawn into the home from warmer airrising and other mechanical exhausts such as bath fans, clothes dryers, rangehoods and water heaters. It should be noted that the concentration of CO2 insoils near the Kerr residence could change rapidly on a daily basis becauseof the dynamic movement of CO2 in the EOR operations. There is no dangerfor persons in open air where CO2 from the soil quickly dissipates.
11
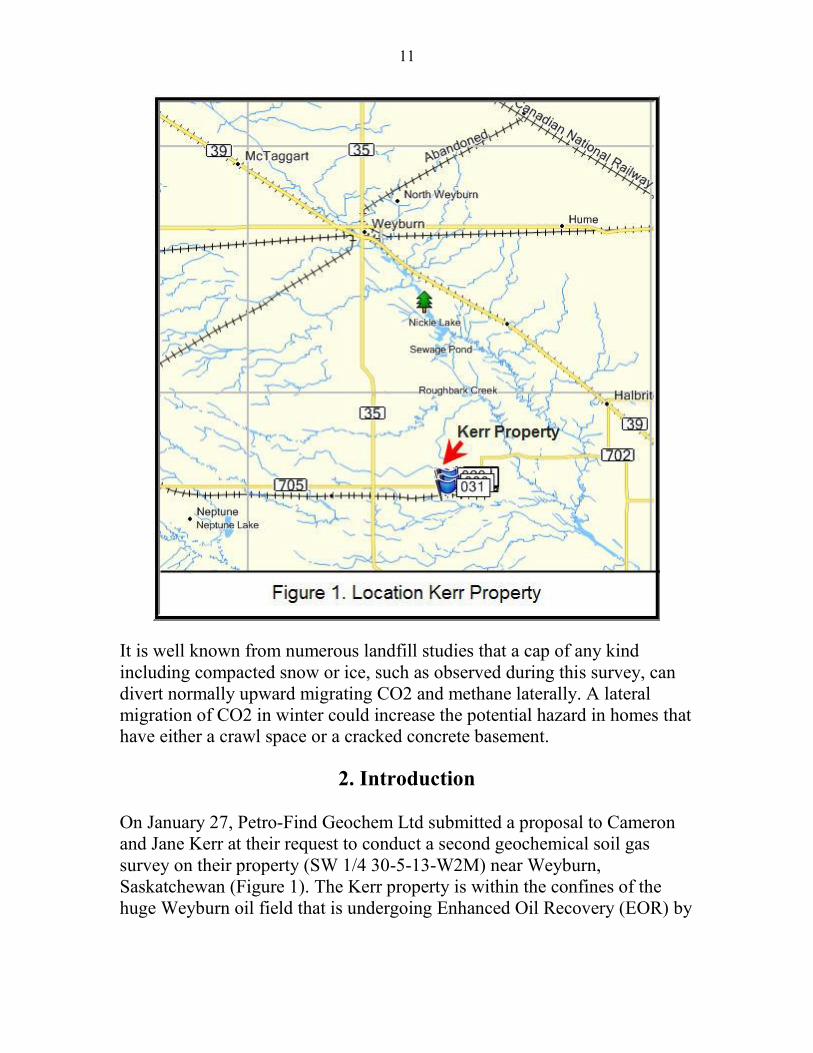
It is well known from numerous landfill studies that a cap of any kindincluding compacted snow or ice, such as observed during this survey, candivert normally upward migrating CO2 and methane laterally. A lateralmigration of CO2 in winter could increase the potential hazard in homes thathave either a crawl space or a cracked concrete basement.
2. Introduction
On January 27, Petro-Find Geochem Ltd submitted a proposal to Cameronand Jane Kerr at their request to conduct a second geochemical soil gassurvey on their property (SW 1/4 30-5-13-W2M) near Weyburn,Saskatchewan (Figure 1). The Kerr property is within the confines of thehuge Weyburn oil field that is undergoing Enhanced Oil Recovery (EOR) by
12
Cenovus Energy (Figures 2 and 5C). The proposal was accepted by theKerrs on January 28.
Cam and Jane Kerr initiated this second study mainly because they felt that awinter investigation would contribute to a better year-round picture of CO2leakage and its effects on the health and safety of people living in theWeyburn field area. A previous soil gas survey by Petro-Find of the sameproperty was conducted in August 2010, which was provided to Cenovusand the Saskatchewan Ministry of Energy and Resources in October 2010and released to the press January 11, 2011. The Kerrs have remainedconcerned about the lack of surface monitoring for CO2 seepage over theWeyburn Pool since 2005.
Discovered in 1954, the Weyburn Field underwent primary production until1964 when it was water flooded to enhance oil recovery. Multi-leghorizontal drilling beginning in 1991 further increased oil recovery. Startingin 2000, oil production was again enhanced by a massive Enhanced OilRecovery (EOR) project. The CO2 produced by lignite gasification in NorthDakota (Synfuels) is pipelined in liquid form and injected into the Weyburnreservoir. Injection into the reservoir is at a reported rate of 8,000 tons a day(total for Weyburn and adjacent Midale fields) to reduce the oil viscosity.Water also injected into the oil reservoir sweeps the low-viscosity oil tohorizontal and vertical production wells. Both CO2 and water are separatedfrom the produced oil and re-injected. The EOR project is currently operatedby Cenovus (formerly Encana); the adjacent EOR project at Midale isoperated by Apache Canada.
Prior to CO2 injection, baseline studies of the reservoir were conducted in2000. Under this program, sampling of produced fluids and gases wassupervised by the field staff of Pan Canadian Resources (now calledCenovus) in cooperation with researchers from the University of Calgary.Analysis of the samples was undertaken primarily by the University ofCalgary. The analytical results were then transferred to other research teamswithin the IEA GHG Weyburn CO2 Monitoring and Storage Project thatrequired this data.
As part of the IEA, a consortium of companies and organizations under themanagement of the Petroleum Technology Research Center (PTRC)conducted four soil gas surveys in successive years from 2001 to 2004 of a
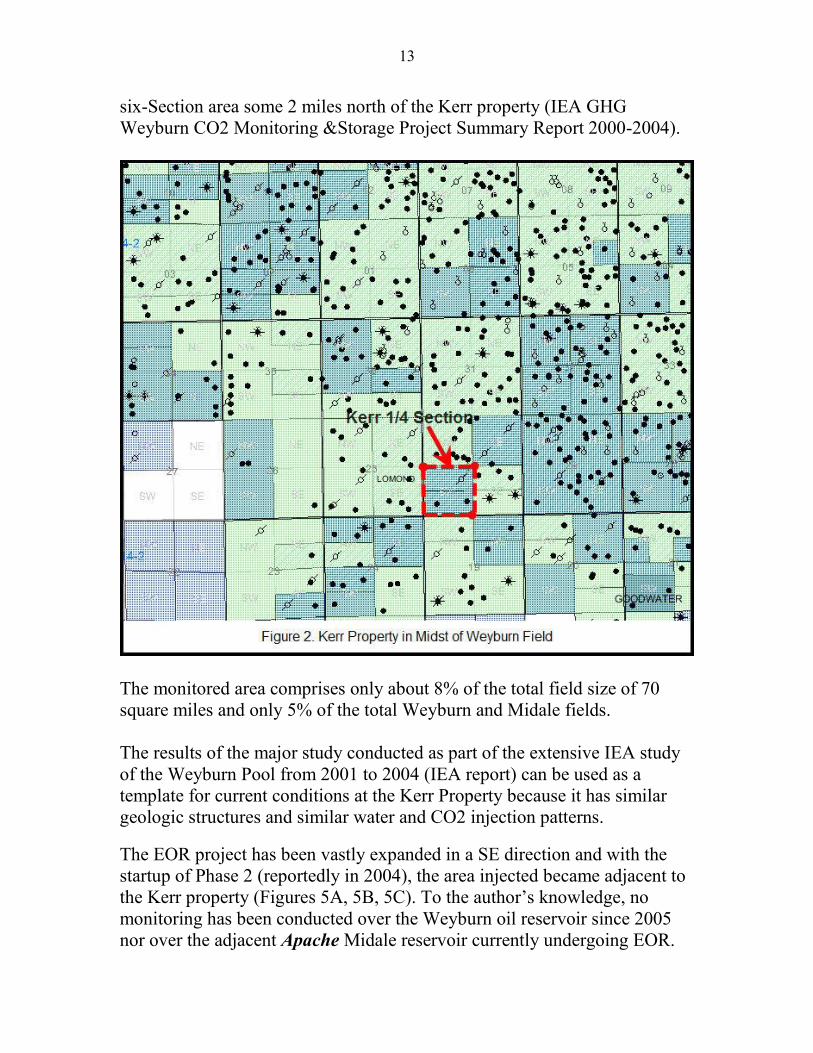
13
six-Section area some 2 miles north of the Kerr property (IEA GHGWeyburn CO2 Monitoring &Storage Project Summary Report 2000-2004).
The monitored area comprises only about 8% of the total field size of 70square miles and only 5% of the total Weyburn and Midale fields.
The results of the major study conducted as part of the extensive IEA studyof the Weyburn Pool from 2001 to 2004 (IEA report) can be used as atemplate for current conditions at the Kerr Property because it has similargeologic structures and similar water and CO2 injection patterns.
The EOR project has been vastly expanded in a SE direction and with thestartup of Phase 2 (reportedly in 2004), the area injected became adjacent tothe Kerr property (Figures 5A, 5B, 5C). To the author’s knowledge, nomonitoring has been conducted over the Weyburn oil reservoir since 2005nor over the adjacent Apache Midale reservoir currently undergoing EOR.
14
The field work was conducted by Paul Lafleur and Rudy Willick onFebruary 10. All soil gas analysis for hydrocarbons and CO2 was performedin Petro-Find’s laboratory by Rudy Willick (Chemical Technologist andManager) and completed on February 17. Rudy Willick is a graduate of theSaskatchewan Institute of Applied Science and Technology in ChemicalTechnology. Stable carbon isotope analysis of CO2 by the University ofSaskatchewan was completed on March 12. This report, including thecontouring of data and interpretation, was drafted by Paul Lafleur PEng,President of Petro-Find Geochem Ltd.
15
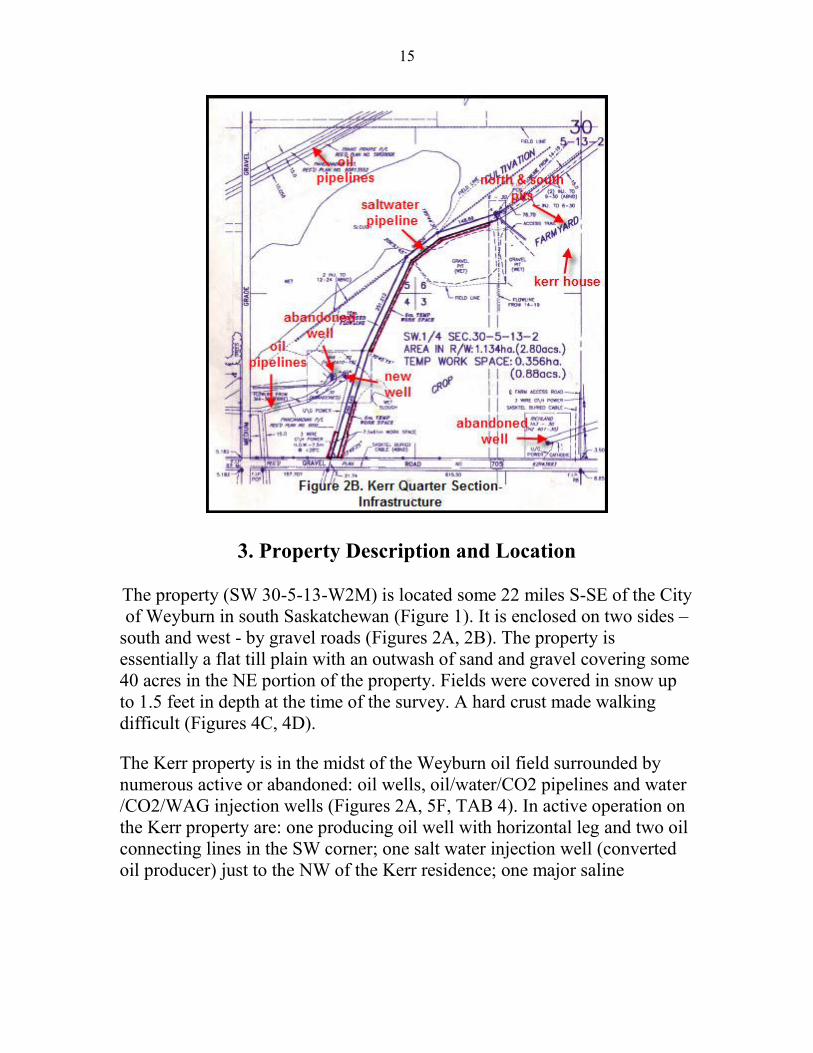
3. Property Description and Location
The property (SW 30-5-13-W2M) is located some 22 miles S-SE of the Cityof Weyburn in south Saskatchewan (Figure 1). It is enclosed on two sides –
south and west - by gravel roads (Figures 2A, 2B). The property isessentially a flat till plain with an outwash of sand and gravel covering some40 acres in the NE portion of the property. Fields were covered in snow upto 1.5 feet in depth at the time of the survey. A hard crust made walkingdifficult (Figures 4C, 4D).
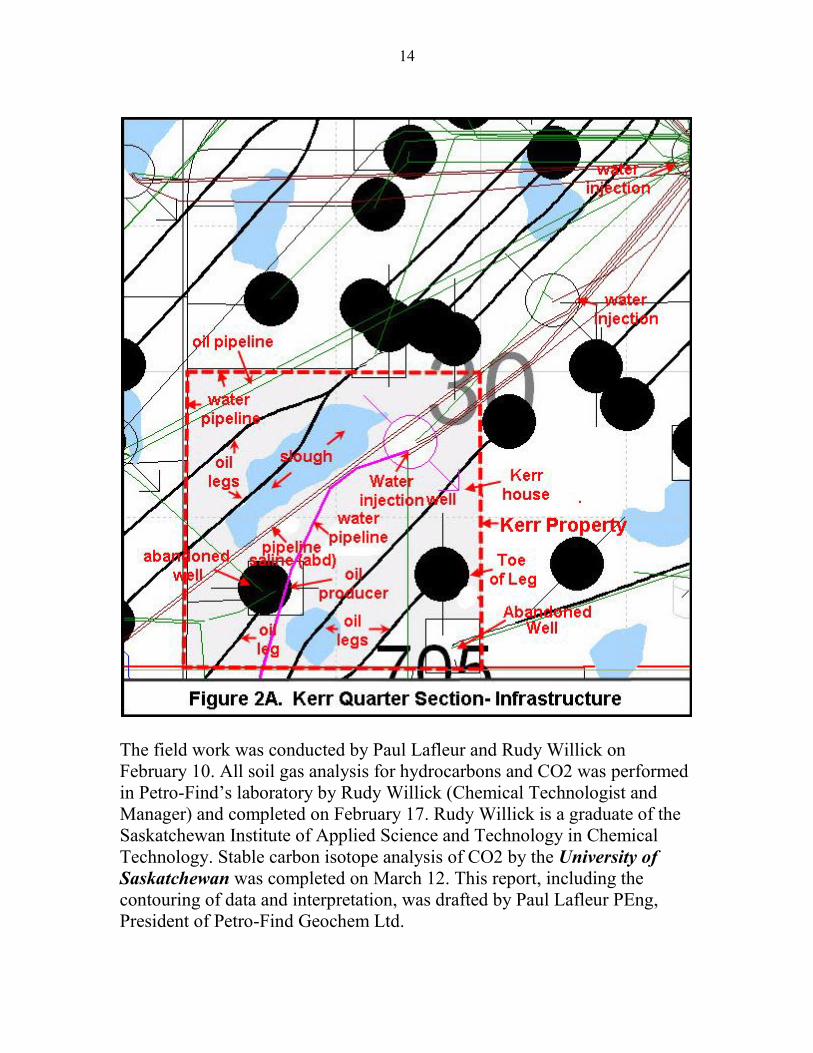
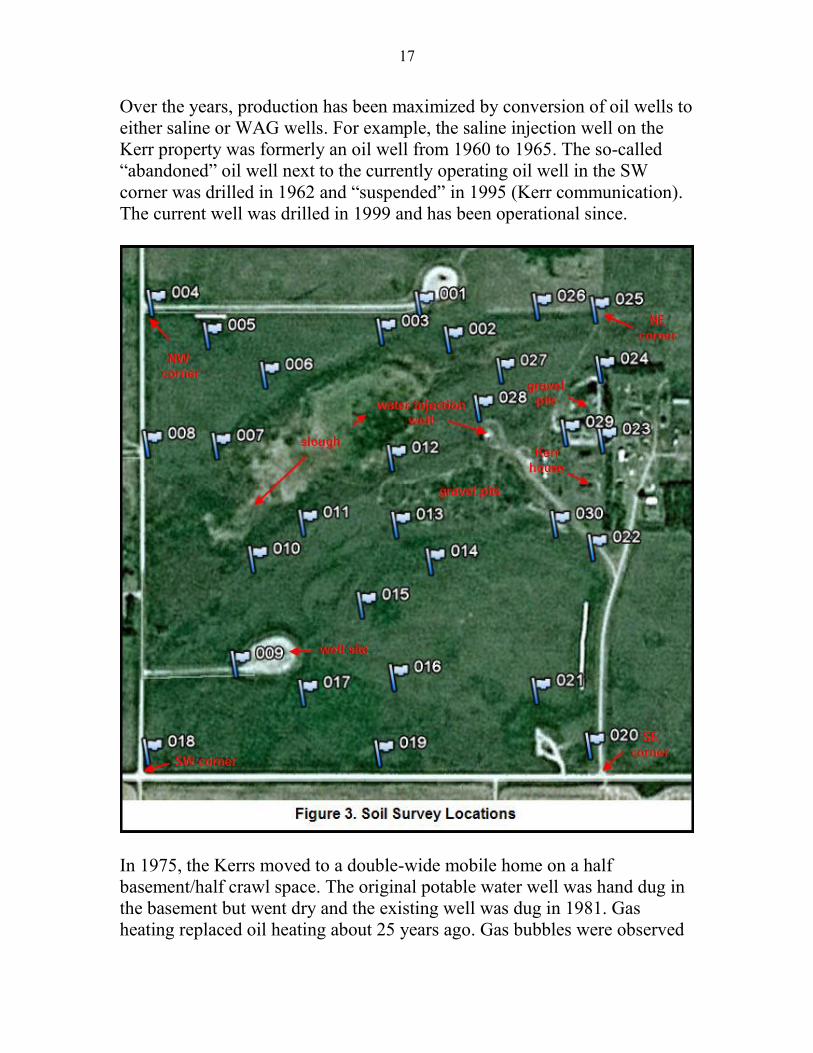
The Kerr property is in the midst of the Weyburn oil field surrounded bynumerous active or abandoned: oil wells, oil/water/CO2 pipelines and water/CO2/WAG injection wells (Figures 2A, 5F, TAB 4). In active operation onthe Kerr property are: one producing oil well with horizontal leg and two oilconnecting lines in the SW corner; one salt water injection well (convertedoil producer) just to the NW of the Kerr residence; one major saline
16
water pipeline traversing the property from the NE to the SW; a major oilpipeline traversing the NW corner; and a saline water line on the west andpart of the north boundaries. Other infrastructure that are or appear to beinactive include two abandoned oil wells in the SW and SE corners; fourlegs from oil wells outside the Kerr property boundary; an emulsion oil linegoing due south from the water injection well; and an abandoned salinewater pipeline that traverses the property from the NE to the SW. Allpipelines are reported to be at 4-5 feet below the surface.
17
Over the years, production has been maximized by conversion of oil wells toeither saline or WAG wells. For example, the saline injection well on theKerr property was formerly an oil well from 1960 to 1965. The so-called“abandoned” oil well next to the currently operating oil well in the SWcorner was drilled in 1962 and “suspended” in 1995 (Kerr communication).The current well was drilled in 1999 and has been operational since.
In 1975, the Kerrs moved to a double-wide mobile home on a halfbasement/half crawl space. The original potable water well was hand dug inthe basement but went dry and the existing well was dug in 1981. Gasheating replaced oil heating about 25 years ago. Gas bubbles were observed
18
in the well and sinks in the house, but SaskEnergy was unable to find anyleaks (of natural gas). A multiple gas monitor was unsuccessful inidentifying the gas bubbles in the well or sinks. No CO2 or CO detectorswere ever used; only one for radon.
4. Lineaments, Fractures/Faults Weyburn Reservoir
To trace the sources of CO2 and hydrocarbon leakages it is important todevelop a knowledge base of fractures/faults and their patterns on and in thevicinity of the Kerr property.
In general, lineament studies from air photos and satellite imagery have beenused extensively in the exploration for oil and gas reservoirs becauselineaments give major clues to the existence of oil or gas in the subsurface(Bibliography, Tab 3). Fracture/fault systems cutting or intersecting
19
reservoirs can provide major conduits for hydrocarbons and CO2 to migrateor escape to the surface. Macroseeps (such as those found in the Kerr gravelpits - see August 2010 report) are associated with open faults. All oil and gasreservoirs leak to a certain extent, especially along fractures/faults. Howdoes the geologist recognize surface lineaments?
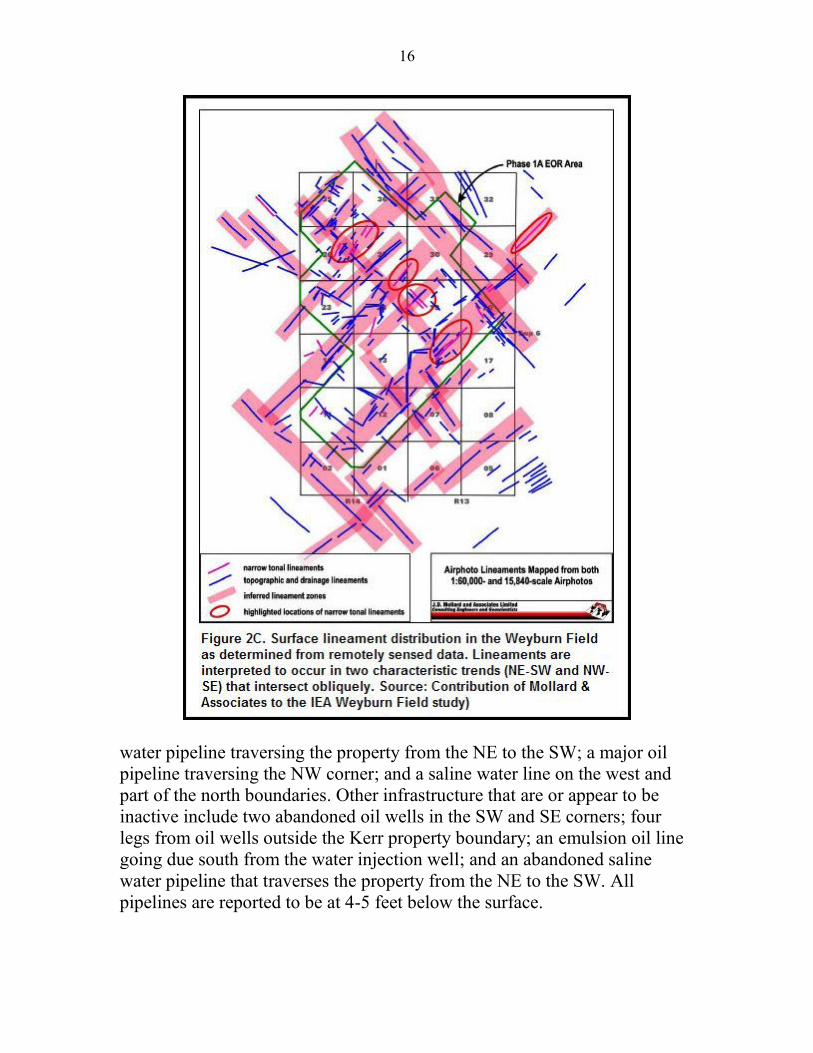
A paper entitled “Application of Satellite and Airphoto Remote Sensing toMap Fracture Zone and Faults in the International Energy Agency (IEA)Weyburn CO2 Monitoring and Storage Project Canada” (Penner, Cosfordand Mollard) states that “The 200x200km IEA Weyburn regional study areais characterized by systematic NE-SW and NW-SE oriented remotely sensedlineaments and lineament zones and minor N-S and E-W trends. Viewed insatellite and air photo imagery, surface lineaments in this young glaciatedlandscape appear as discontinuously aligned linear escarpments, valleys andsmaller surface drainage depressions that vary in length and relief. In somelocations, subtle linear tonal features can be identified in the soil and naturalvegetation. Clusters of co-linear individual lineaments that are aligned in thesame direction within narrow tracts define longer lineament zones.”
Figure 2c (Source: Mollard and Associates) depicts the surface lineamentdistribution as determined from remotely sensed data of a portion of theWeyburn Field some 2 miles north of the Kerr property. The existence andthe same orientation of lineaments in the Kerr property area can be easilypicked from air photos (4A).
The Weyburn Reservoir has always been characterized in literature as afractured reservoir. “Weyburn oil reserves lay within a thin zone of fracturedcarbonates in the Midale beds of the Mississippian Charles Formation…Thedominant fracture set within the reservoir strikes NE-SW sub parallel to theregional trajectories of maximum horizontal stress. Horizontal wells withinthe EnCana (now Cenovus - author’s note) Weyburn Field are orientedparallel to the predominant fracture direction.” (The Leading Edge July2009). Methods of investigating fault and fracture distribution have involvedsurface lineament studies using remote sensing data and air photos as wellas 2D seismic data and high resolution aeromagnetic data.
Petro-find has found in the course of its hydrocarbon exploration activitiesthat elongated low lying areas or lineaments are prime targets for explorationof oil and gas. That is because low lying areas with associated high
20
concentrations of CO2 and light hydrocarbons indicate that they are surfacerepresentations of open fractures/faults that have allowed these gases toescape from a reservoir to the surface. Conversely, very low concentrationsof gases in linear and elongated low lying areas indicate closed faults.
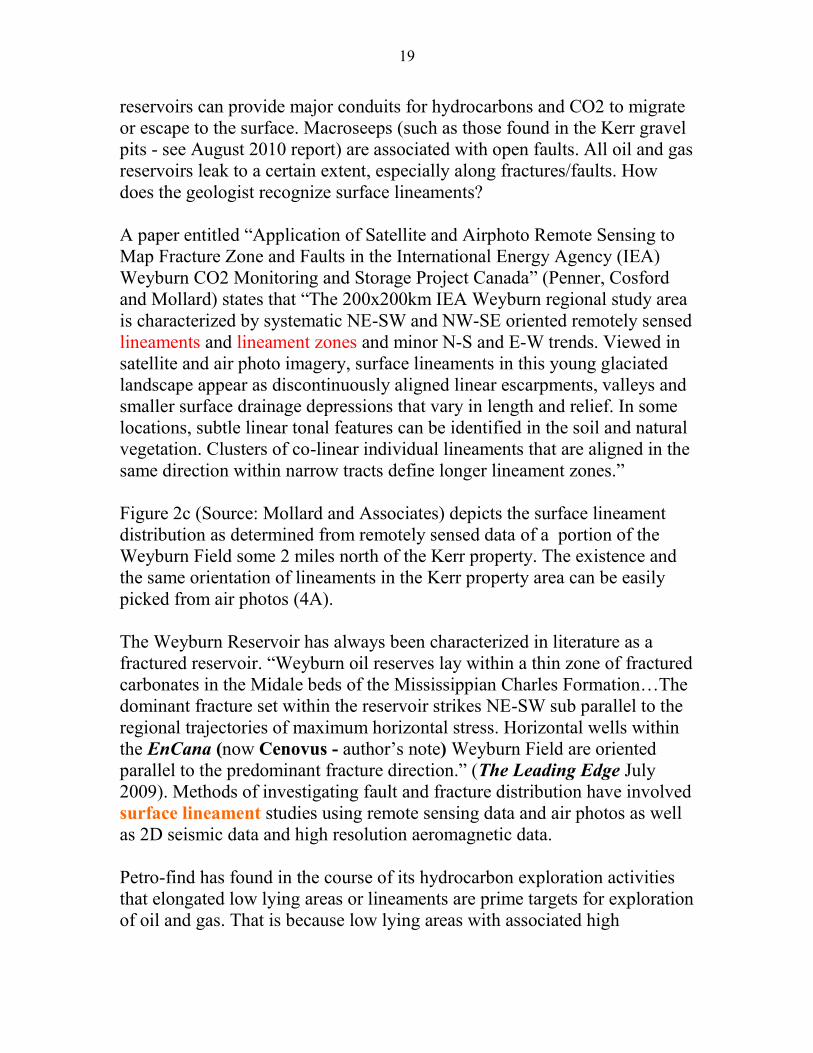
All reservoirs also naturally leak to a certain extent through micro fracturesnot seen by seismic. Micro fractures allow microseeps to migrate from the
reservoir in the form of plumes to the surface where they can be qualifiedand quantified by geochemical soil gas methods.
The elongated low lying areas may have resulted from the erosion of weakand fractured areas by the gouging and bulldozing action of the lastcontinental glacier. The ice loading from an estimated 10,000 foot thickglacier lasting 2 million years and its retreat causing isostatic rebound12,000 years ago has left a major imprint on the Canadian landscape. New
21
fractures/faults could have been created as a result and old fractures/faultsre-activated. The elongated areas may have developed in tills since theretreat of the glacier and it is possible that some faults may be still active.This factor alone should have given any geologist pause to think that leakageof injected CO2 is highly possible from EOR operations in obviously faultedareas.
Two lineaments interpreted as faults cross just NE of the Kerr house (Figure4A). The elongated slough running NE-SW at the north end of the Kerrproperty is interpreted to be the surface expression of a major fracture/faultsystem beneath the glacial till. This lineament lines up with a row of waterinjection and WAG wells as well as one CO2 injection well both on an offthe Kerr property to the NE (Figure 5C). Lakes and sloughs along these twolineaments are interpreted to be on the down thrown side of normal faults.Care was taken not to sample the sloughs themselves (although this can bedone with passive samplers) because they are likely to yield a mix ofbiogenic and anthropogenic CO2. Soil gas sampling is not done in wetsediments because the soil gas probe has a tendency to plug up.
5. Geochemical Soil Gas Surveys in Frozen Soils
An understanding of how and why soils freeze is important to theinterpretation of soil gas data obtained in winter soil gas surveys. Much ofthe following is based on Petro-Find’s experience in conducting soil gassurveys for exploration of oil/gas in winter when soils are normally frozen atone-meter depth or more.
Several factors are responsible for the attenuation of CO2 and the lightalkanes/alkenes in soil gas when soils are frozen. The main effect of freezingof pore water in soils is the reduction of soil porosity and permeability,which negatively affects the concentration levels of any hydrocarbons andCO2 in soil gas emanating from a deep source. A major advantage of awinter survey is that the biological activity and CO2 respiration is so lowthat anomalous values (i.e. in excess of background values) can be linked toCO2 migrating from a non-biogenic source.
Other factors that can contribute to the attenuation of hydrocarbons and CO2concentrations in frozen soils include:
a. Reduced advection (i.e. mass flow from pressure differences) due toa cap of snow pack and ice cover;
22
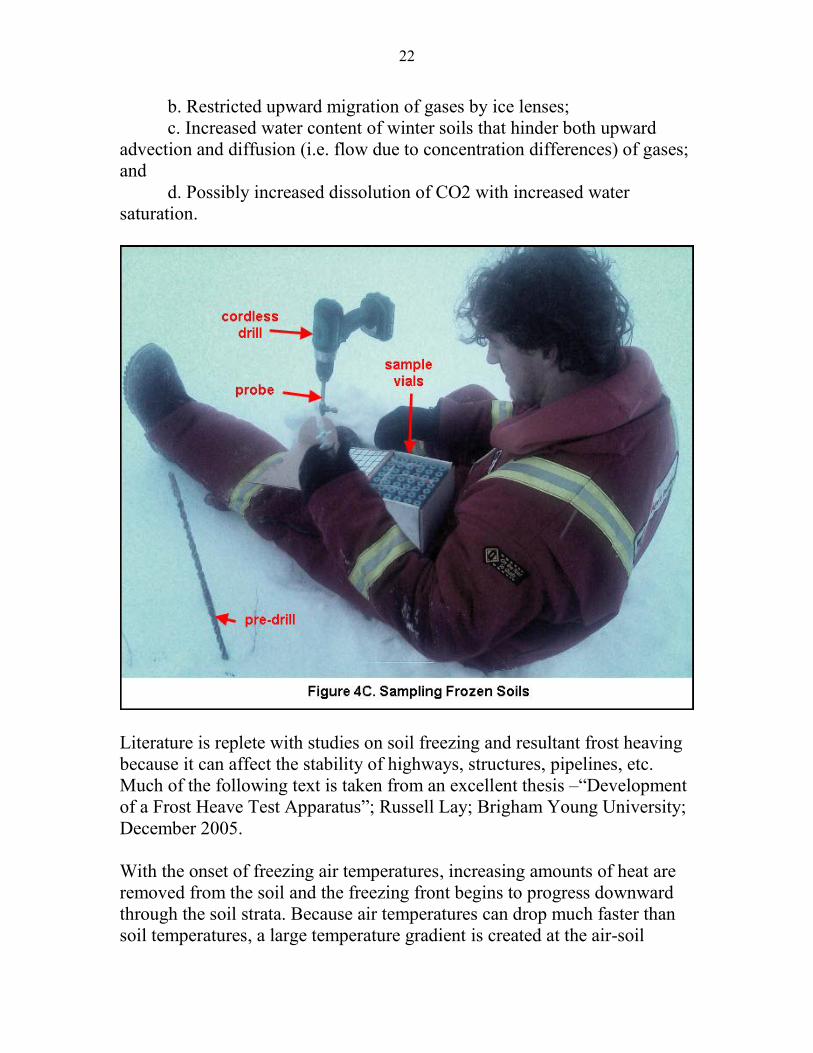
b. Restricted upward migration of gases by ice lenses;c. Increased water content of winter soils that hinder both upward
advection and diffusion (i.e. flow due to concentration differences) of gases;and
d. Possibly increased dissolution of CO2 with increased watersaturation.
Literature is replete with studies on soil freezing and resultant frost heavingbecause it can affect the stability of highways, structures, pipelines, etc.Much of the following text is taken from an excellent thesis –“Developmentof a Frost Heave Test Apparatus”; Russell Lay; Brigham Young University;December 2005.
With the onset of freezing air temperatures, increasing amounts of heat areremoved from the soil and the freezing front begins to progress downwardthrough the soil strata. Because air temperatures can drop much faster thansoil temperatures, a large temperature gradient is created at the air-soil
23
interface. Large temperature differences cause the frost front to move rapidlydownward through the soil nearest the surface. An increase in volume by 9percent as water changes phases from liquid to ice results in reducedporosity and permeability, which negatively affects an upward gasmigration.
Steady-state conditions occur when the energy extracted from the soil in thevicinity of the freezing front is equal to the energy provided by theunderlying soil in the form of latent heat of crystallization released by wateras it freezes. At this time, further frost penetration ceases, and ice lensingoccurs. The ability of the soil to supply water to the ice lens diminishes asthe water in the region below the freezing front is exhausted. When thewater supply to the growing ice lens becomes limited, the latent heat ofcrystallization may not equal the heat being removed from the soil, causingthe frost front to continue downward until the conditions need to form an icelens are again met. In this way, a series of lenses form perpendicular to thedirection of heat flow, separated by layers of frozen soil. “An ice lens willeffectively block any vertical movement of water or solutes through thesoil” (Source: “What’s Happening to Your Soil Under the Snow?”; BetterFarming; Pat Lynch)
The ability of water to move through the soil matrix ultimately controls thegrowth of ices lenses. The transport of water from the warmer underlyingsoil towards the frost front is the result of three main mechanisms: vapordifferences, osmosis and capillary rise, the latter being the most importantfactor. Before the soil begins to freeze, water on the surfaces of the soilparticles and in the pore spaces between soil particles form a network ofchannels through which water and gases are able to flow. As the freezingfront passes through the soil, ice crystals nucleate in the pore water betweenthe particles. The formation of ice in the pores cause unfrozen water films onthe surface of the particles to become thinner so that the effective radius ofthe capillaries forming the unfrozen water network within the freezing soildecreases. Although the reduced water content causes a dramatic increase incapillary suction, the permeability of the soil rapidly diminishes as thechannels become increasingly tortuous and narrow as the freezingprogresses. A schematic depicting features of freezing soil is shown inFigure 4B.
Ground water in frost susceptible soils is sucked up from the water table bycapillary action (Guidance Note; Terram Ltd; Tony Jay; September 2002). It
24
is drawn into the soil above what is known as the capillary zone. This soil ismoist but not saturated i.e. there is a mixture of soil, water and air. When themoisture in the capillary zone freezes and is held by solid ice as lenses, thecapillary forces are no longer in balance and more water is drawn up fromthe water table. This extra water, in its turn, becomes frozen and the processof capillary rise and freezing of groundwater becomes continuous onethroughout the duration of the freeze period. The amount of water held ina frozen condition in the capillary zone can be many times more thanthe non-frozen saturation level for the soil. CO2 is attenuated under theseconditions.
It is well known that the artificial freezing of soils finds application incontrolling groundwater and isolation of subsurface contamination of gasesand fluids.
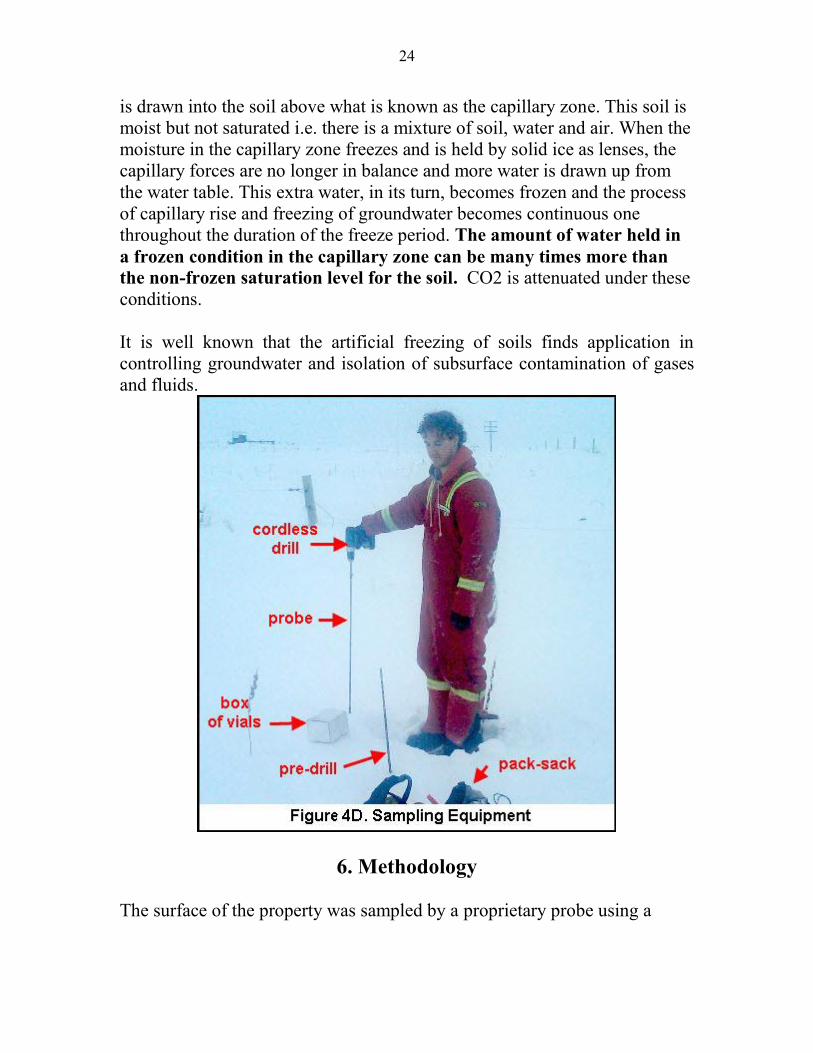
6. Methodology
The surface of the property was sampled by a proprietary probe using a
25
cordless drill. Winter conditions made drilling somewhat more difficult thanin the summer because of the frozen soils and snow up to two feet deep(Figures 4C, 4D). The snow was cleared away and a pre-drill 24 inches longwas used to penetrate the icy ground surface. The probe was then insertedinto the hole and drilled to the normal 3-foot depth, well below the A-and B-zones to avoid contamination by biogenic CO2 and methane.
A syringe was used to purge the probe of ambient air and extract a 24 ccsample, which was injected into a previously evacuated vial (to 1/5 torr or0.0003 bar). The evacuation system is of Petro-Find’s own design. To avoidany breakage in transit to Petro-Find’s laboratory in Saskatoon, the vialswere inserted into holes cut into Styrofoam and placed in firm boxes.
A GPS (Garmin CSX) was used to record the coordinates of each samplingpoint. The GPS was loaded with a Garmin Topo Canada map for additionalguidance in the field. All coordinates were recorded in a field notebook toprovide backup.
All analysis of light hydrocarbons and CO2 was performed in Petro-Find’sstate-of-the-art lab at Innovation Place, Saskatoon. In the lab the septum waspierced with a syringe and 3cc was withdrawn for injection into a gaschromatograph equipped with FID and TCD detectors. The analytes werethe C1-C5 alkanes, C2-C4 Alkenes and the fixed gas, CO2. A major peakbetween butane and pentane has remained unidentified. Analysis wasperformed by a qualified chemical analyst using a high-end gaschromatograph. To obtain a high linear dynamic the gas chromatograph wascalibrated each day with all the individual gases expected to be measured.
The coordinates and analytical data were downloaded to a computer andsaved as an EXCEL file. Petro-Find’s state-of-the-art software program wasused to produce contour maps of CO2, methane and C2+ (sum total of allthe C2-C5 analytes) concentrations (Figures 8, 9, 9A, and Exhibits 1 and 2).The scattered data points were contoured by a triangular, non-griddedcomputer program. Contours were printed on clear film for overlay on apreviously prepared georeferenced base map. All printing was done in-house.
After analysis for hydrocarbons and CO2 in Petro-find’s laboratory six vialswere sent to the University of Saskatchewan for analysis of stable carbonisotopes C12 and C13 in CO2 and determination of Delta13CCO2.
26
Petro-Find uses the soil gas probe exclusively for sampling of soil gas. Othersampling methods exist for monitoring of CO2 leakages at the surface andnear-surface. In situ methods using a probe and infra-red analyzer canmeasure CO2 directly in soil gas. However, after two years of experienceusing the in situ method, Petro-Find abandoned this approach becauseresults were found to be unreliable. Calibration in the field of the variousinstruments used was always a problem. The sampling of tight clay soils bythe infra-red in situ method usually drains the soil gas available around theprobe end and a second extraction from the same probe for analysis of otheranalytes, such as radon and the sulphur species, can result in errors. This isbecause the high vacuum created by a hand or internal pump pulls ambientair down from around the annulus of the probe thus diluting the sample.
Other monitoring techniques used elsewhere include the accumulationchamber method, which measure the total CO2 concentration and flux at thesoil-atmosphere interface. As these essentially sit on top of the ground theymeasure both upward migrating CO2 from the subsurface as well asbiogenic CO2 produced in the A- and B-horizons by respiration andmicrobial activity. They cannot be used in winter when the soil is frozen andthe surface soil is icy. Some chamber methods cannot measure CO2concentrations above 5,000 ppm and therefore are not suitable for measuringany substantial breakthroughs of CO2 from EOR operations.
7. Geochemical Soil Gas Survey for Hydrocarbons
Modern geochemical methods, such as Petro-Find soil gas surveys, areimportant tools for finding hydrocarbon reservoirs because they are directindicators of hydrocarbons as well as carbon dioxide(http://www.gasoilgeochem.com ). Light hydrocarbons and CO2 (about thesame molecular weight as propane) naturally escape as microseeps fromreservoirs and travel vertically to the surface where they can be detected andanalyzed by gas chromatograph. Concentration patterns or surface anomaliesof these microseeps can be reliably related to petroleum/gas accumulationsat depth. Open and closed fractures/faults in such surveys can be detected atthe surface by linear high or low concentrations in soils, respectively.
The fact that the relative amount of light alkanes and alkenes in soil gas hasabout the same relative composition as the gas in the underlying reservoirprovides a reliable indicator of the type of reservoir the anomaly represents.Some principal indicators of reservoir content are: percentage of methane
27
(C1) in total light hydrocarbons (C1-C5); ratio of methane to ethane; andethane+ or the sum of the ethane to pentane concentrations. In general, thenear-surface anomaly or surface expression of a hydrocarbon reservoirdecreases in intensity once the reservoir undergoes production because ofdeclines in pressure. These pressures are renewed after either water or CO2flooding but the surface patterns may be different.
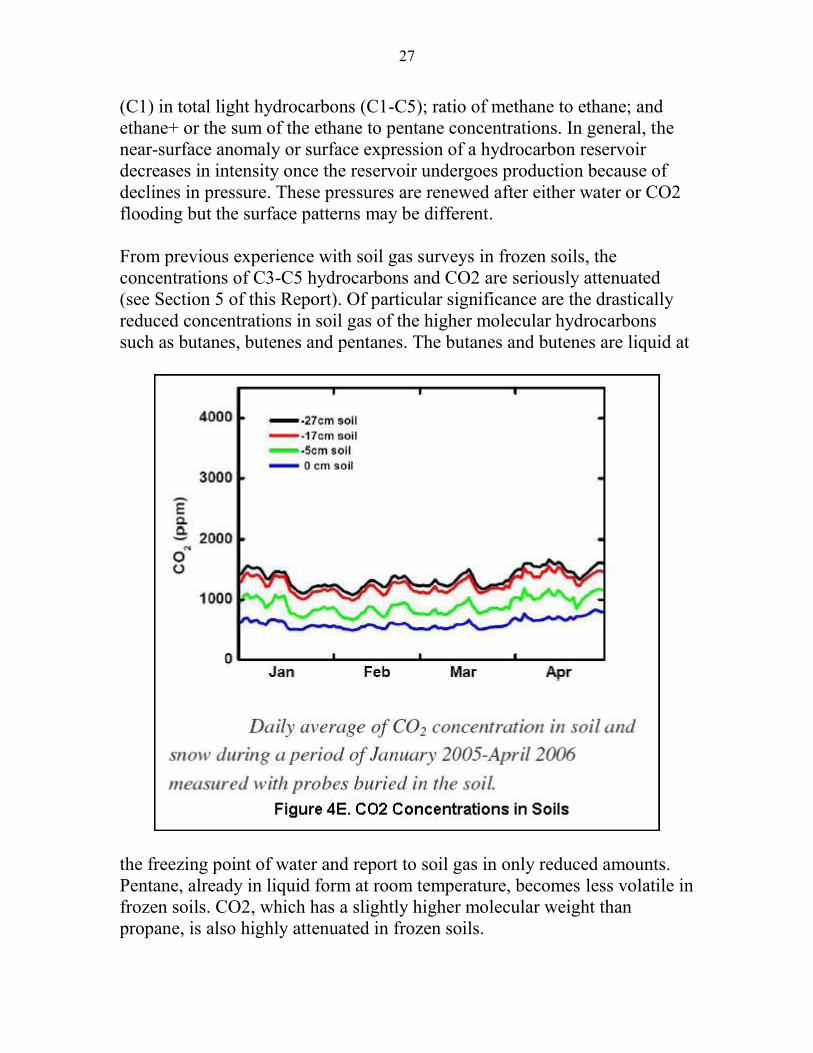
From previous experience with soil gas surveys in frozen soils, theconcentrations of C3-C5 hydrocarbons and CO2 are seriously attenuated(see Section 5 of this Report). Of particular significance are the drasticallyreduced concentrations in soil gas of the higher molecular hydrocarbonssuch as butanes, butenes and pentanes. The butanes and butenes are liquid at
the freezing point of water and report to soil gas in only reduced amounts.Pentane, already in liquid form at room temperature, becomes less volatile infrozen soils. CO2, which has a slightly higher molecular weight thanpropane, is also highly attenuated in frozen soils.
28
8. Geochemical Soil Gas Survey for CO2
CO2 concentrations in soil gas are drastically attenuated in frozen soilsbecause of various barriers, which impede migration from the deepersubsurface. The reduced concentrations are mainly due to barriers caused bythe loss of porosity/permeability due to freezing of water and the formationof ice lenses in the subsurface (see Section 5).
Petro-Find believes that its geochemical soil gas method is the most cost-effective tool for the surface monitoring of CO2 leakages from EOR andother sequestration sites in winter. Its proprietary probe can penetrate frozensoils that have hard ice lens formation. The depth of sampling is three feet,which is well below the biologically active A-and B-horizons of the soilprofile, even though respiration and microbial activity is only a fraction ofthat in non-frozen soils. Compacted snow and ice at the surface minimizesbarometric pumping, which causes wide swings in CO2 concentrations at upto 18 inches in depth due to an exchange of CO2 with the atmosphere.
The changing patterns of CO2 and light hydrocarbon concentrations are bestdepicted by contours, which are printed on clear substrate for overlay onbase maps so that they may be correlated with actual ground locations. Atriangular, non-gridded computer program provides accurate contouring ofconcentrations
The Weyburn-Midale EOR project currently injects into the Weyburn andMidale reservoirs about 8,000 tonnes a day of anthropogenic CO2 pipelinedin liquid form from the Great Plains Synfuels Plant in North Dakota. TheCO2 supply is reported to be comprised of 96% CO2, 2.3% C2+hydrocarbons, 0.9% hydrogen sulphide, 0.7% methane, 0.1% carbonmonoxide, and minor amounts of nitrogen, oxygen and water (Source: TheIEA Weyburn CO2 Monitoring and Storage Project; Final Report of theEuropean Research Team; British Geological Survey; 2005).
Enhanced oil recovery as practiced at the Weyburn field has two mainobjectives: to enhance oil recovery and to sequester CO2 permanently in thesubsurface. While the enhanced oil recovery process is contributing in amajor way to oil recovery, it can be shown that CO2 has escaped from theWeyburn reservoir. CO2 plumes can take some time to reach the surface butleakage can quickly reach the surface in high concentrations by means ofimproperly plugged wells, open fractures/faults and other fast-flow paths. A
29
reliable and effective monitoring system using geochemical soil gas surveyscan ensure that sequestration is a safe and acceptable method for thepermanent disposal of CO2. Repetitive surveys over a long period of timegive assurances that there is no leakage at the surface.
The fractured nature of some reservoirs mitigates their use for EORsequestration. If CO2 reaches the shallow subsurface or migrates out of theground into the ambient air, health and environmental risks can arise. Astudy by Mollard and Associates as part of the Weyburn study showedconsiderable faulting and fracturing in the area of the Weyburn reservoir(The IEA Weyburn CO2 Monitoring and Storage Project). A lineamentstudy of the Kerr property two miles to the south of the Mollard study showstwo major lineaments traversing the Kerr property that are interpreted to befractures and faults (Figure 4A).
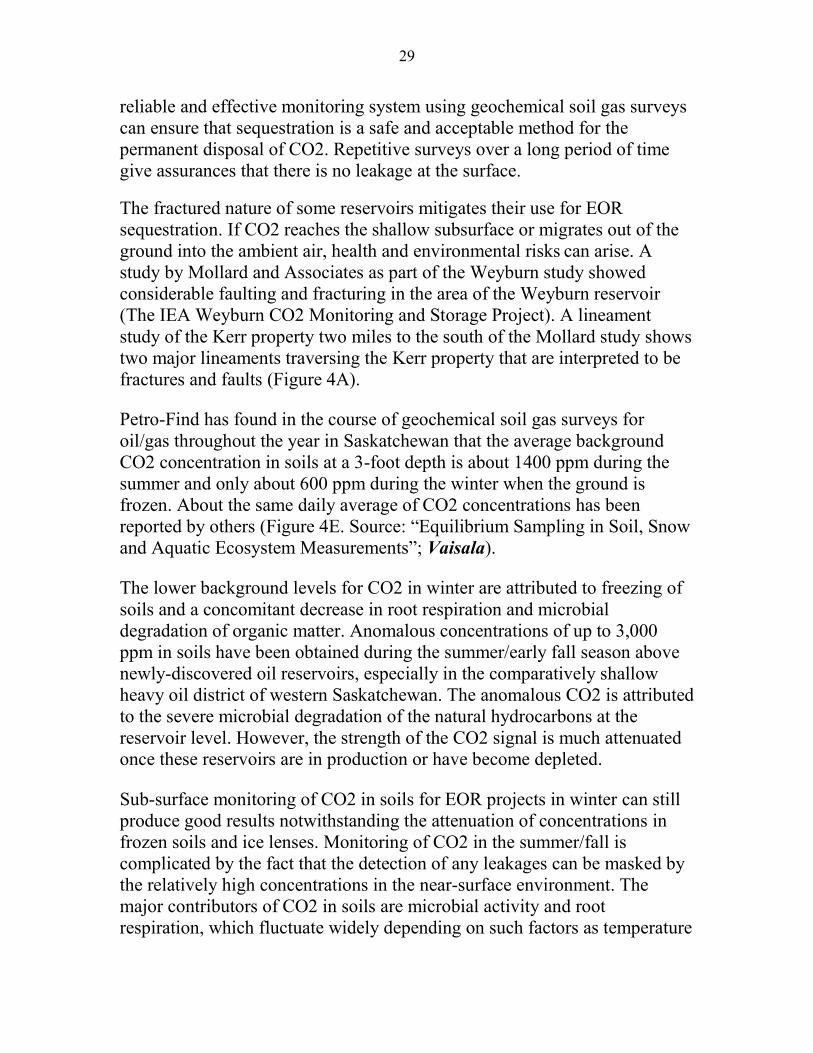
Petro-Find has found in the course of geochemical soil gas surveys foroil/gas throughout the year in Saskatchewan that the average backgroundCO2 concentration in soils at a 3-foot depth is about 1400 ppm during thesummer and only about 600 ppm during the winter when the ground isfrozen. About the same daily average of CO2 concentrations has beenreported by others (Figure 4E. Source: “Equilibrium Sampling in Soil, Snowand Aquatic Ecosystem Measurements”; Vaisala).
The lower background levels for CO2 in winter are attributed to freezing ofsoils and a concomitant decrease in root respiration and microbialdegradation of organic matter. Anomalous concentrations of up to 3,000ppm in soils have been obtained during the summer/early fall season abovenewly-discovered oil reservoirs, especially in the comparatively shallowheavy oil district of western Saskatchewan. The anomalous CO2 is attributedto the severe microbial degradation of the natural hydrocarbons at thereservoir level. However, the strength of the CO2 signal is much attenuatedonce these reservoirs are in production or have become depleted.
Sub-surface monitoring of CO2 in soils for EOR projects in winter can stillproduce good results notwithstanding the attenuation of concentrations infrozen soils and ice lenses. Monitoring of CO2 in the summer/fall iscomplicated by the fact that the detection of any leakages can be masked bythe relatively high concentrations in the near-surface environment. Themajor contributors of CO2 in soils are microbial activity and rootrespiration, which fluctuate widely depending on such factors as temperature
30
and moisture. Compacted snow with icy layers results in less effectivebarometric pumping, which in summer can cause wide variations in CO2concentrations at the near-surface (maximum 1.5 foot depth) due to anexchange of CO2 with the atmosphere. The groundwater degassing of CO2still contributes to background values. Some off-gassing of CO2 fromorganic carbon such as coal or lignite in the subsurface can also make acontribution.
High concentrations of biogenic CO2 are usually observed in humic soils insloughs and wet areas during most of the year due to anaerobic conditions.On a practical level, soil gas sampling of sloughs at any time of the year isavoided because probes become plugged in water-saturated sediments(although passive samplers have been developed for this purpose). It can beexpected that some of the biogenic CO2 is converted to methane in sloughsand humic soils. A linear plot of methane versus ethane averageconcentrations in a soil gas survey can show whether the methane isthermogenic or biogenic and whether the CO2 is anthropogenic or biogenic.
It is important to assess the CO2 concentrations in soils because of thepossible harm to humans, flora and fauna. It is well known that humanhealth can be impacted at very low levels. Humans can die of asphyxiation ifthe concentration of CO2 in air is as little as 50,000 ppm (5%) (Source: TheIEA Weyburn CO2 Monitoring and Storage Project, Final Report of theEuropean Research Team, 2005). This can be a major problem for homessituated over high leakage areas because of the negative pressures caused bywinter heating and other utilities.
In the first report of the IEA GHG Weyburn CO2 Monitoring and StorageProject in 2004 the Recommended Exposure Limit (REL) for the workplace,
31
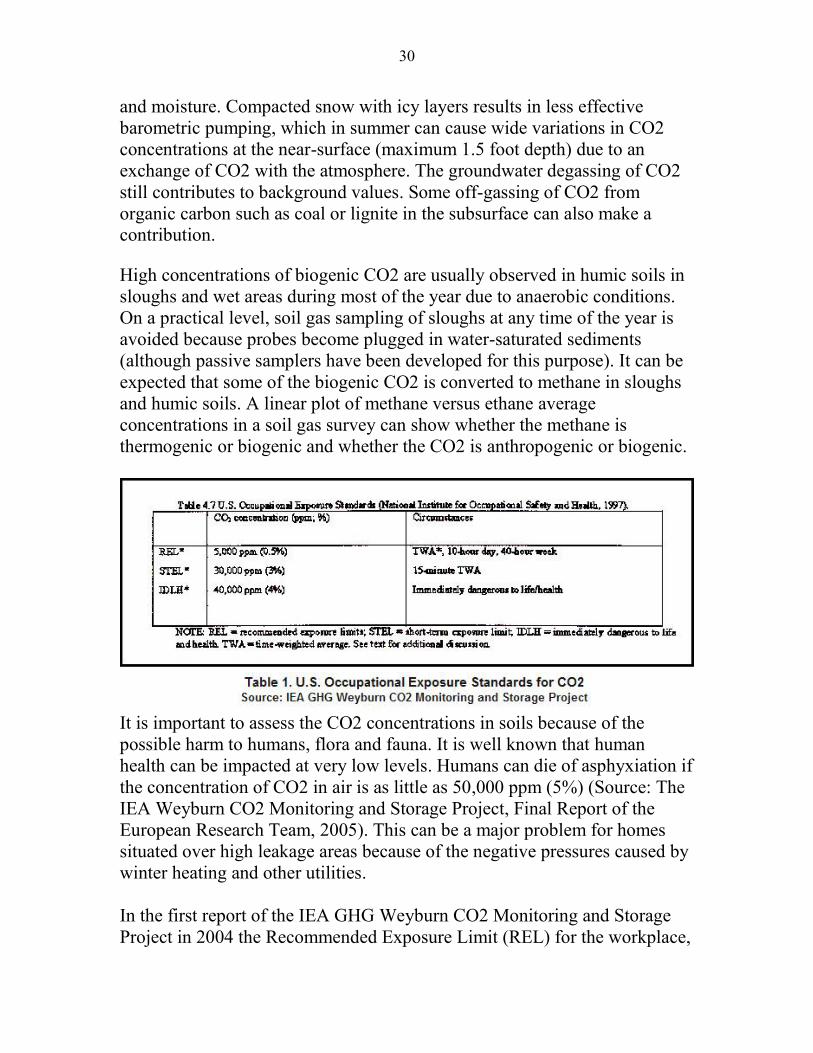
based on a time-weighted average (TWA), was 5,000 ppm over a 10-hourworkday during a 40-hour week (Table 1). The Short-Term Exposure Limit,a 15-minute time-weighted average of 30,000 ppm, “should not be exceededat any time.” A 40,000 ppm concentration is regarded as “ImmediatelyDangerous to Life or Health”. The report further noted that more restrictiverequirements might be expected for a domestic building, where people mayspend a longer time indoors. For someone remaining in the home for 24hours per day the limiting threshold is half the workday value, or 2,500 ppm.
The Minnesota Department of Health “has set workplace safety standards of10,000 ppm for an 8-hour period and 30,000 ppm for a 15 minute period.This means the average concentration over an 8-hour period should notexceed 10,000 ppm and the average concentration over a 15 minute periodshould not exceed 30,000 ppm.” According to the report, carbon dioxide cancause headache, dizziness, nausea and other symptoms at high levels. Thiscould occur when exposed to levels above 5,000 ppm for many hours. Ateven higher levels, CO2 can cause asphyxiation as it replaces oxygen in theblood and exposure to concentrations of around 40,000 ppm is immediatelydangerous to life and health.
32
It is well known from numerous landfill studies that an impermeable cap ofany kind including compacted snow or ice can divert normally upwardmigrating CO2 and methane laterally. Lateral migration of CO2 in wintercould increase the potential hazard in homes that have either a crawl spaceor a cracked concrete basement. “When an impermeable or nearlyimpermeable cover exists or when a permeable cover is overlain with snowor it is nearly saturated with moisture, horizontal lateral subsurfacemigration may be the path of least resistance”(Source: “Evaluating LandfillGas Emissions from Closed or Abandoned Facilities”; USA EnvironmentalProtection Agency).
9. Well Patterns – Oil Producers, CO2 Injectors and WaterInjectors
To trace the sources of any leakages of CO2 and hydrocarbons it isimportant to develop a knowledge base of types, locations and patterns ofwells and pipelines in the vicinity of the Kerr property. A study of surfacefacilities that separate and recycle the fluids and gases completes the picture.
33
The Weyburn-Midale EOR project reportedly injects into the Weyburn andMidale reservoirs about 8,000 tonnes a day of anthropogenic CO2 pipelinedin liquid form from the Great Plains Synfuels Plant in North Dakota.Enhanced oil recovery as practiced at the Weyburn field has two mainobjectives: to enhance oil recovery and to sequester CO2 permanently in thesubsurface.
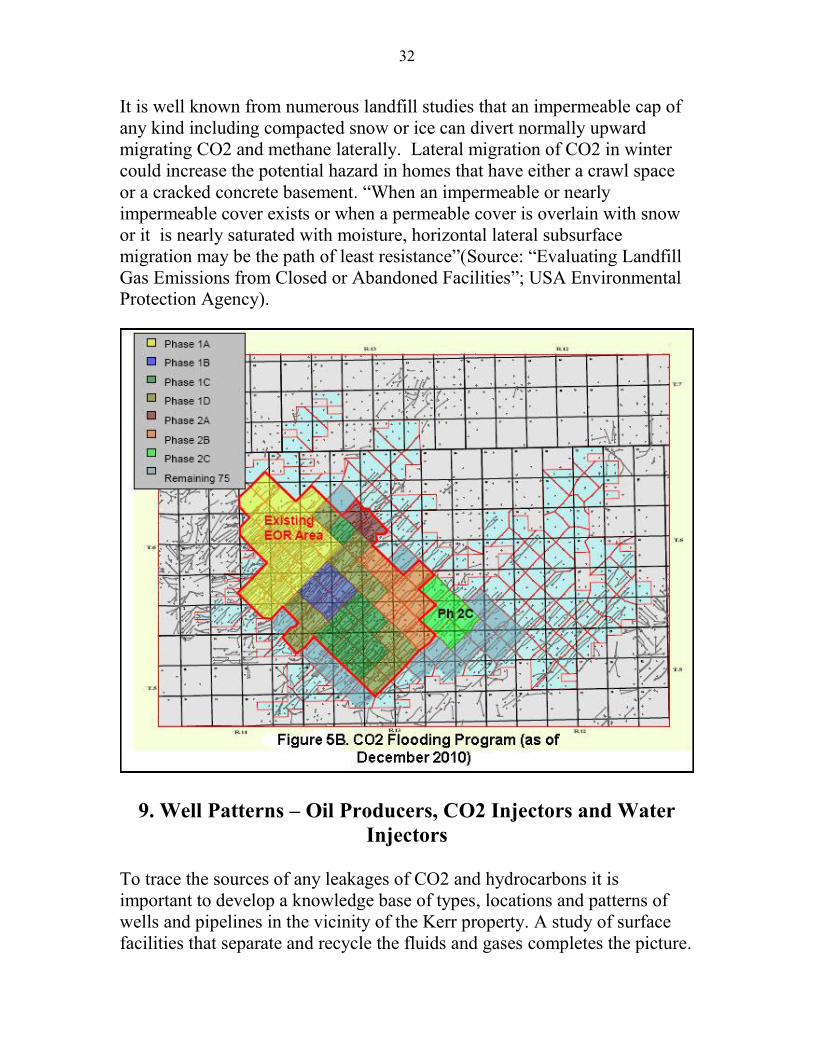
The well and pipeline locations and patterns of the Cenovus EOR operationsare depicted in Figures 5A, 5B and 5C (Sources: a. “Regional CarbonSequestration Partnerships Annual Review”; PTRC; October, 2010; b. “AnUpdate on the Saskatchewan CO2 Floods [Weyburn +Midale] and StorageMonitoring Activities”; PTRC; December 2010; and c. SaskatchewanDepartment of Industry and Energy.
34
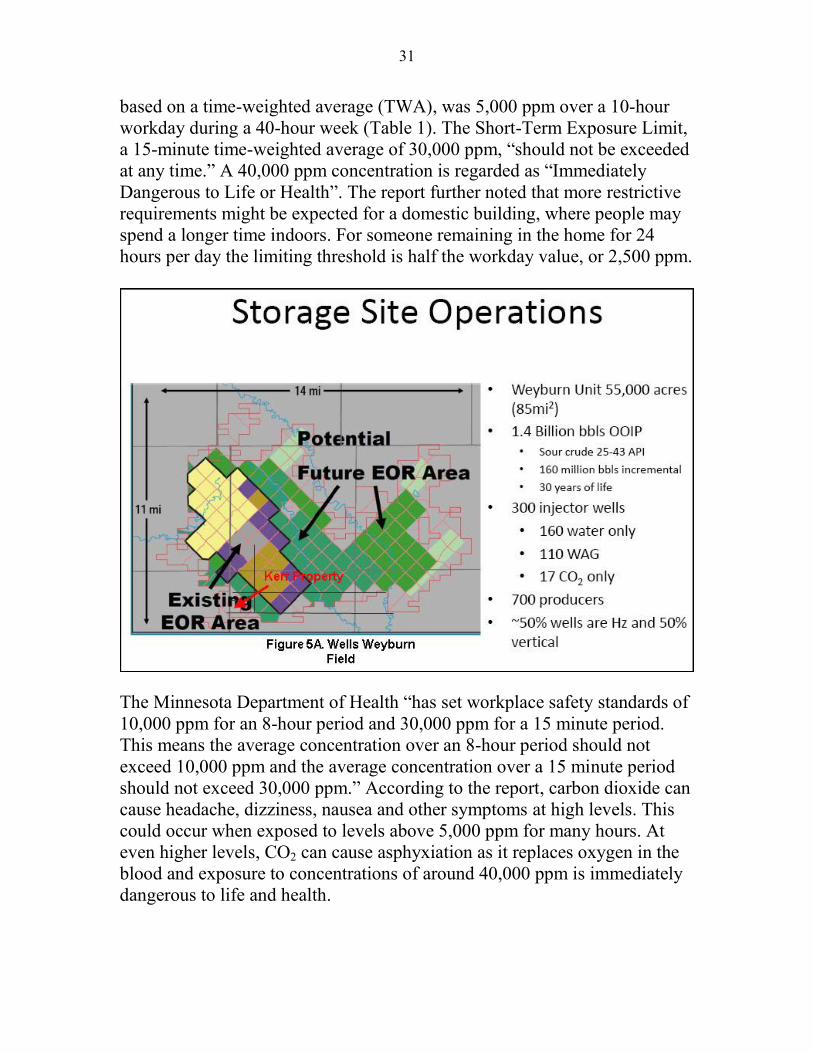
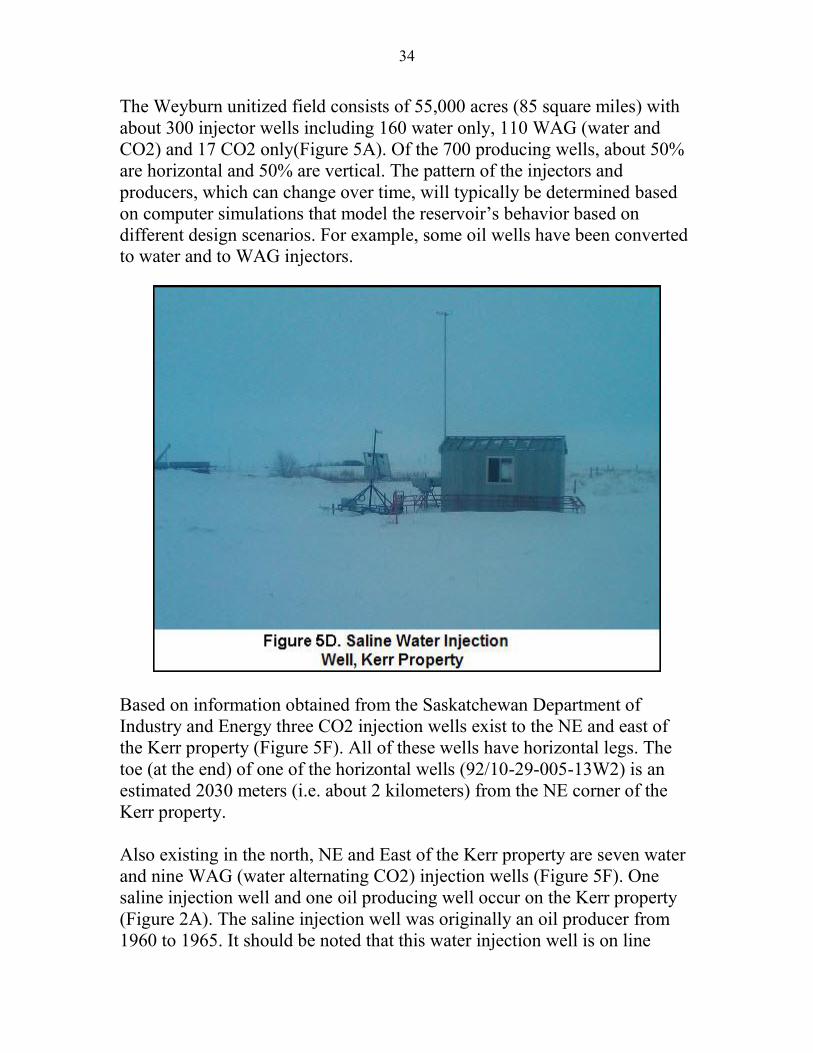
The Weyburn unitized field consists of 55,000 acres (85 square miles) withabout 300 injector wells including 160 water only, 110 WAG (water andCO2) and 17 CO2 only(Figure 5A). Of the 700 producing wells, about 50%are horizontal and 50% are vertical. The pattern of the injectors andproducers, which can change over time, will typically be determined basedon computer simulations that model the reservoir’s behavior based ondifferent design scenarios. For example, some oil wells have been convertedto water and to WAG injectors.
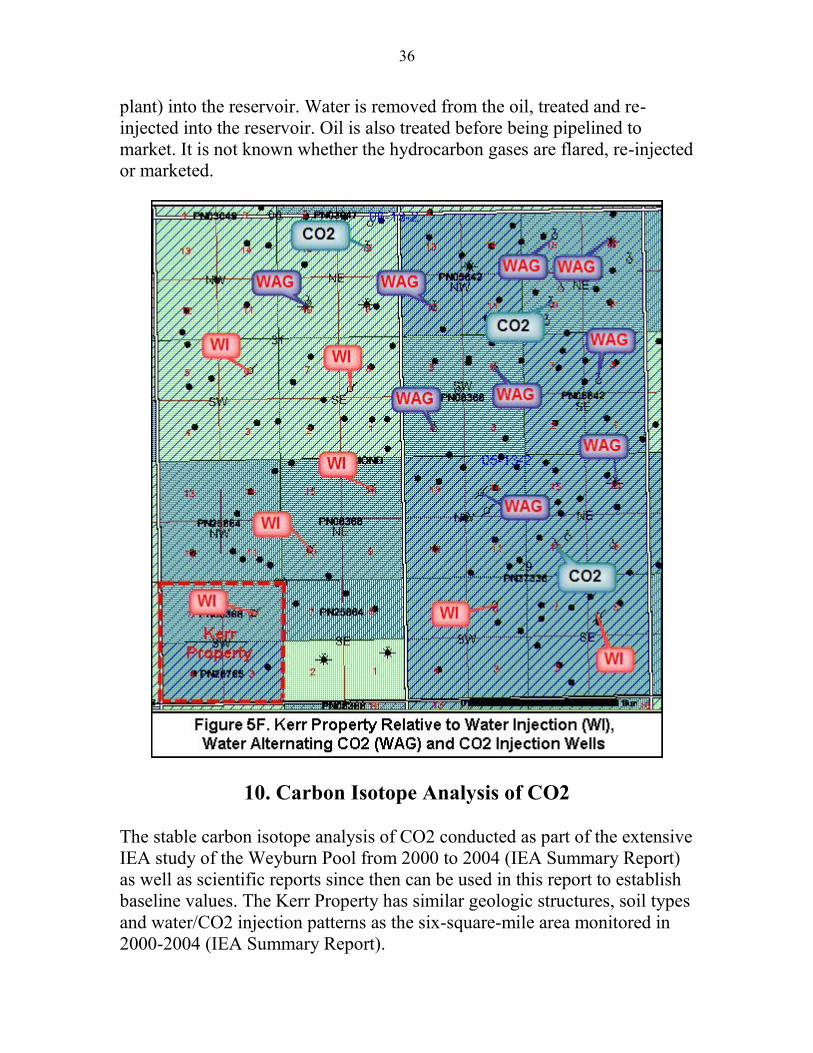
Based on information obtained from the Saskatchewan Department ofIndustry and Energy three CO2 injection wells exist to the NE and east ofthe Kerr property (Figure 5F). All of these wells have horizontal legs. Thetoe (at the end) of one of the horizontal wells (92/10-29-005-13W2) is anestimated 2030 meters (i.e. about 2 kilometers) from the NE corner of theKerr property.
Also existing in the north, NE and East of the Kerr property are seven waterand nine WAG (water alternating CO2) injection wells (Figure 5F). Onesaline injection well and one oil producing well occur on the Kerr property(Figure 2A). The saline injection well was originally an oil producer from1960 to 1965. It should be noted that this water injection well is on line
35
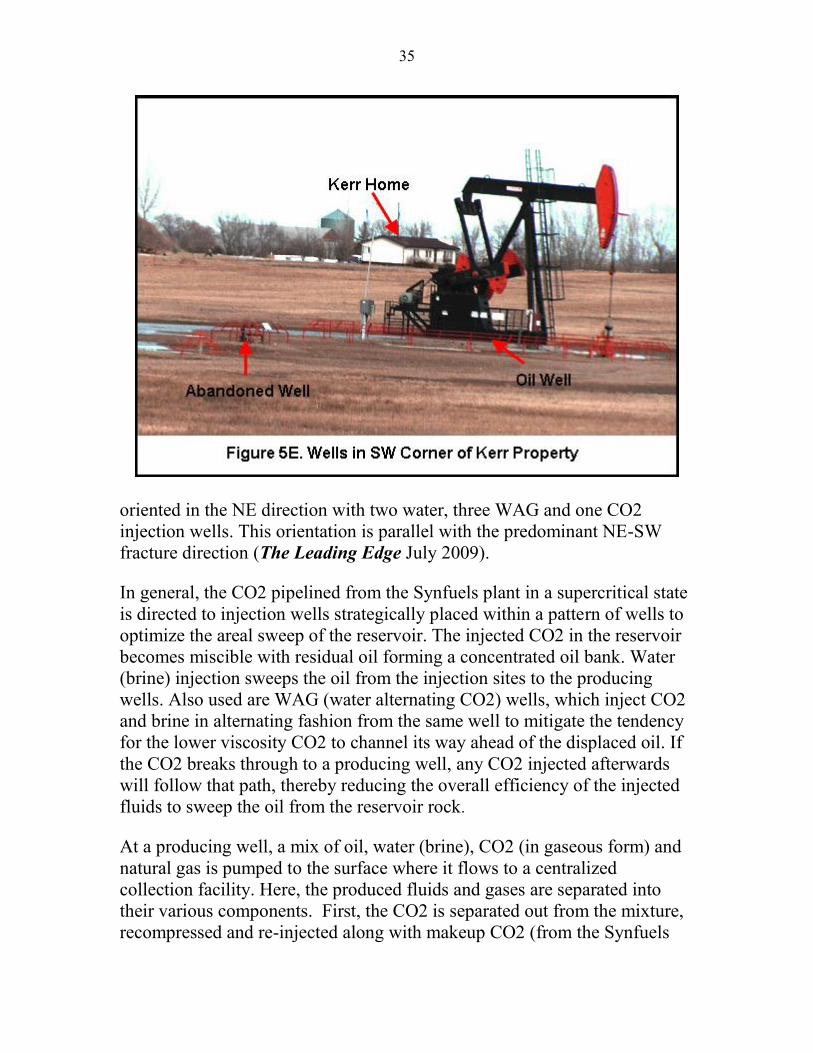
oriented in the NE direction with two water, three WAG and one CO2injection wells. This orientation is parallel with the predominant NE-SWfracture direction (The Leading Edge July 2009).
In general, the CO2 pipelined from the Synfuels plant in a supercritical stateis directed to injection wells strategically placed within a pattern of wells tooptimize the areal sweep of the reservoir. The injected CO2 in the reservoirbecomes miscible with residual oil forming a concentrated oil bank. Water(brine) injection sweeps the oil from the injection sites to the producingwells. Also used are WAG (water alternating CO2) wells, which inject CO2and brine in alternating fashion from the same well to mitigate the tendencyfor the lower viscosity CO2 to channel its way ahead of the displaced oil. Ifthe CO2 breaks through to a producing well, any CO2 injected afterwardswill follow that path, thereby reducing the overall efficiency of the injectedfluids to sweep the oil from the reservoir rock.
At a producing well, a mix of oil, water (brine), CO2 (in gaseous form) andnatural gas is pumped to the surface where it flows to a centralizedcollection facility. Here, the produced fluids and gases are separated intotheir various components. First, the CO2 is separated out from the mixture,recompressed and re-injected along with makeup CO2 (from the Synfuels
36
plant) into the reservoir. Water is removed from the oil, treated and re-injected into the reservoir. Oil is also treated before being pipelined tomarket. It is not known whether the hydrocarbon gases are flared, re-injectedor marketed.
10. Carbon Isotope Analysis of CO2
The stable carbon isotope analysis of CO2 conducted as part of the extensiveIEA study of the Weyburn Pool from 2000 to 2004 (IEA Summary Report)as well as scientific reports since then can be used in this report to establishbaseline values. The Kerr Property has similar geologic structures, soil typesand water/CO2 injection patterns as the six-square-mile area monitored in2000-2004 (IEA Summary Report).
37
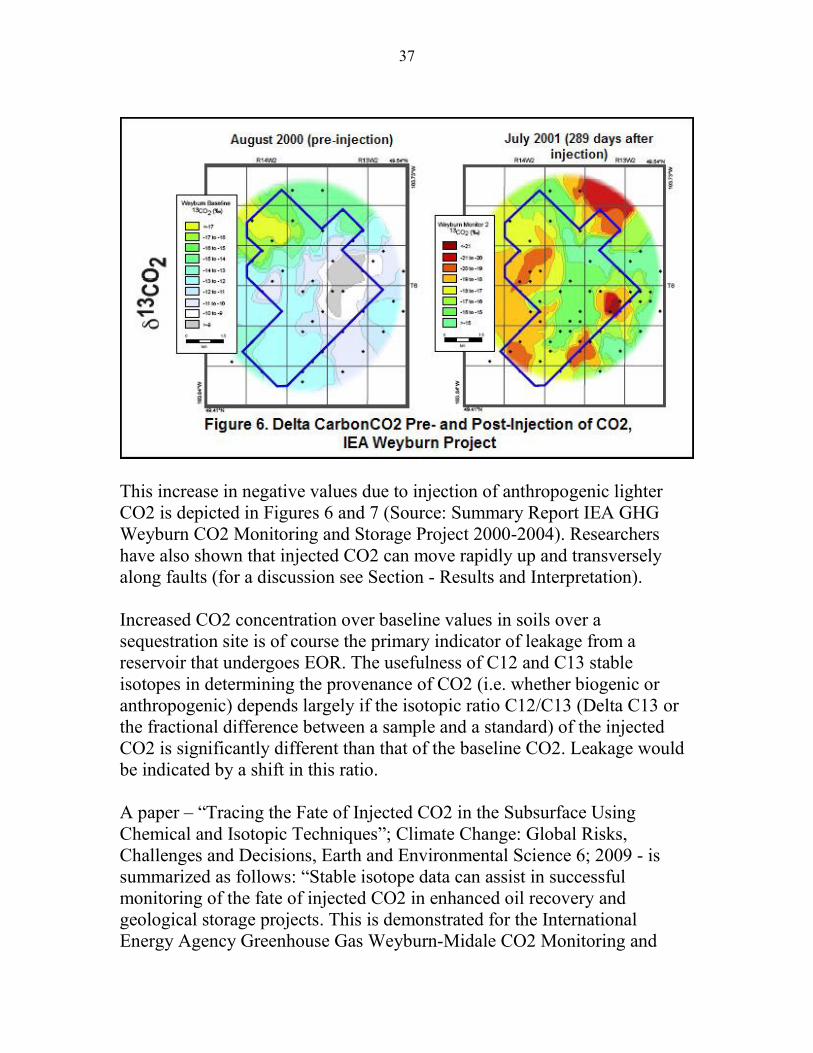
This increase in negative values due to injection of anthropogenic lighterCO2 is depicted in Figures 6 and 7 (Source: Summary Report IEA GHGWeyburn CO2 Monitoring and Storage Project 2000-2004). Researchershave also shown that injected CO2 can move rapidly up and transverselyalong faults (for a discussion see Section - Results and Interpretation).
Increased CO2 concentration over baseline values in soils over asequestration site is of course the primary indicator of leakage from areservoir that undergoes EOR. The usefulness of C12 and C13 stableisotopes in determining the provenance of CO2 (i.e. whether biogenic oranthropogenic) depends largely if the isotopic ratio C12/C13 (Delta C13 orthe fractional difference between a sample and a standard) of the injectedCO2 is significantly different than that of the baseline CO2. Leakage wouldbe indicated by a shift in this ratio.
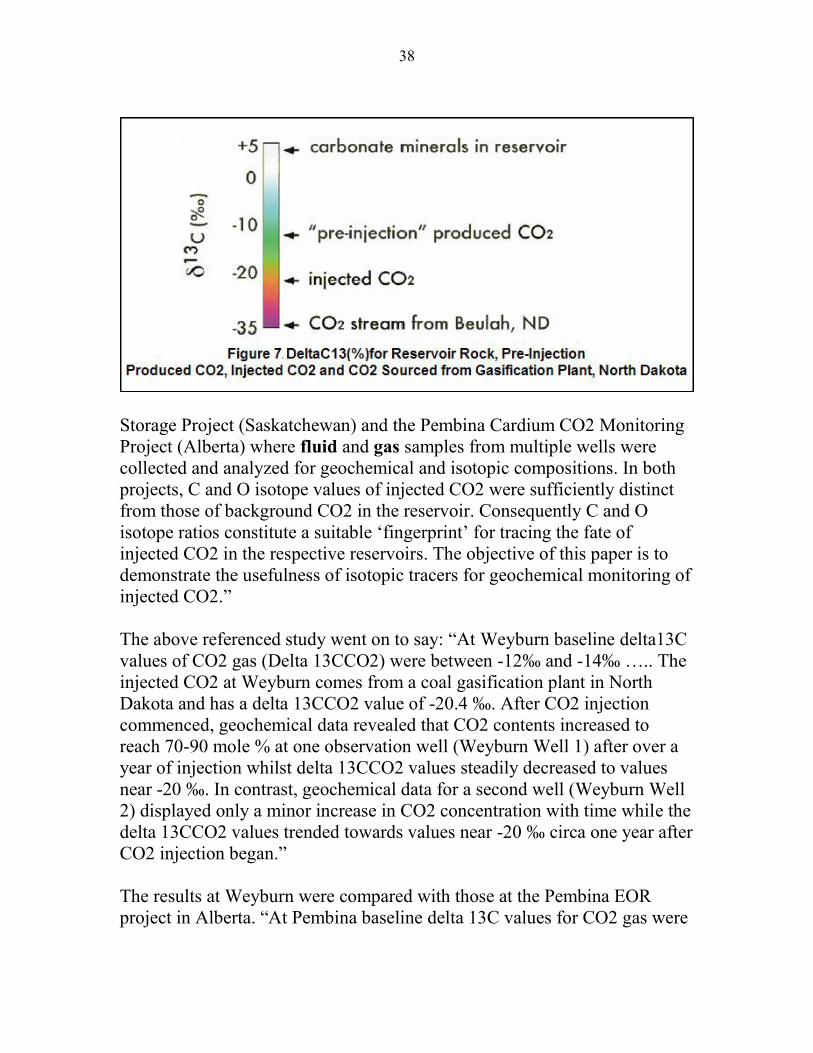
A paper – “Tracing the Fate of Injected CO2 in the Subsurface UsingChemical and Isotopic Techniques”; Climate Change: Global Risks,Challenges and Decisions, Earth and Environmental Science 6; 2009 - issummarized as follows: “Stable isotope data can assist in successfulmonitoring of the fate of injected CO2 in enhanced oil recovery andgeological storage projects. This is demonstrated for the InternationalEnergy Agency Greenhouse Gas Weyburn-Midale CO2 Monitoring and
38
Storage Project (Saskatchewan) and the Pembina Cardium CO2 MonitoringProject (Alberta) where fluid and gas samples from multiple wells werecollected and analyzed for geochemical and isotopic compositions. In bothprojects, C and O isotope values of injected CO2 were sufficiently distinctfrom those of background CO2 in the reservoir. Consequently C and Oisotope ratios constitute a suitable ‘fingerprint’ for tracing the fate ofinjected CO2 in the respective reservoirs. The objective of this paper is todemonstrate the usefulness of isotopic tracers for geochemical monitoring ofinjected CO2.”
The above referenced study went on to say: “At Weyburn baseline delta13Cvalues of CO2 gas (Delta 13CCO2) were between -12‰ and -14‰ ….. Theinjected CO2 at Weyburn comes from a coal gasification plant in NorthDakota and has a delta 13CCO2 value of -20.4 ‰. After CO2 injectioncommenced, geochemical data revealed that CO2 contents increased toreach 70-90 mole % at one observation well (Weyburn Well 1) after over ayear of injection whilst delta 13CCO2 values steadily decreased to valuesnear -20 ‰. In contrast, geochemical data for a second well (Weyburn Well2) displayed only a minor increase in CO2 concentration with time while thedelta 13CCO2 values trended towards values near -20 ‰ circa one year afterCO2 injection began.”
The results at Weyburn were compared with those at the Pembina EORproject in Alberta. “At Pembina baseline delta 13C values for CO2 gas were

39
between -16 and -18 ‰ …... CO2 injected at Pembina is trucked in daily andhas a mean delta 13C value of -4.5 ± 2 ‰ depending on the source of the
CO2. Geochemical data for one observation well (Pembina Well 1) revealedthat CO2 concentrations increased rapidly as CO2 injection began tomaximum values around 90% within 6 months of injection. At the same timedelta13CCO2 values increased rapidly towards values of -5 ‰. Geochemicaldata for a second observation well (Pembina Well 2) showed negligiblechanges in CO2 concentration with time while delta13C values trendedtowards -8 ‰ over a period of 6 months after injection began.”
The study concluded: “Regulatory and safety issues dictate that successfulCCS projects will require the ability to trace the fate of CO2 in thereservoir… Carbon isotope ratios are an effective tool to trace the movementand reaction of injected CO2 in mature oil fields, provided that the injectionCO2 is isotopically distinct.”
The concentration patterns of CO2 in soils near the Kerr residence couldchange rapidly on a daily basis because of the dynamic movement of CO2 inthe EOR operations. Empirical data shows that CO2 moves horizontally very
40
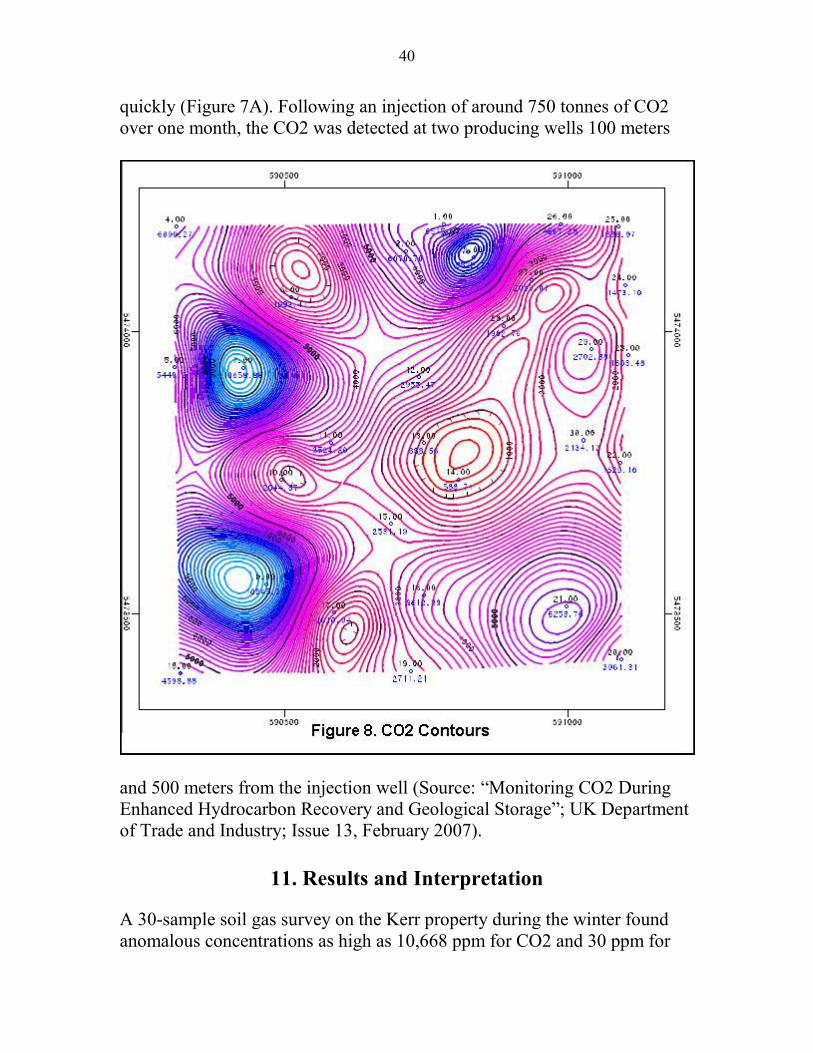
quickly (Figure 7A). Following an injection of around 750 tonnes of CO2over one month, the CO2 was detected at two producing wells 100 meters
and 500 meters from the injection well (Source: “Monitoring CO2 DuringEnhanced Hydrocarbon Recovery and Geological Storage”; UK Departmentof Trade and Industry; Issue 13, February 2007).
11. Results and Interpretation
A 30-sample soil gas survey on the Kerr property during the winter foundanomalous concentrations as high as 10,668 ppm for CO2 and 30 ppm for
41
methane (Tab 1, Figures 8, 9 and 9A). Notwithstanding these highanomalous values, the concentrations of both CO2 and the lighthydrocarbons except for methane were severely attenuated in frozen soilswhen compared to the results of a survey in August 2010 whenconcentrations of CO2 in soil gas reached as high as 110,000 ppm. To theauthor’s knowledge, this is the first time a soil gas survey has beenconducted under winter conditions to assess CO2 in soils over a reservoirundergoing EOR.
The provenance of the CO2 in the soil gases found on the Kerr property isclearly the Synfuels anthropogenic CO2, which is being injected into thereservoir. Results confirm the findings of the August 2010 soil gas surveyconducted by Petro-Find. The source of the CO2 in soil gas is firmlyestablished by: An average Delta 13CCO2 that compares with the last previously
known value (2001) for the CO2 in reservoir fluids. The analysis in2001 of CO2 from produced fluids would be the same as the CO2 inthe reservoir as well as for the soil gas CO2, which would havemigrated from the reservoir along fast-flow paths.
A major shift from baseline values of Delta 13C of the CO2 inproduced fluids from -12 to -14 established in 2000 before CO2injection began to an average value of -23.1 found in the soil gas. Theanalysis in 2000 of CO2 from produced fluids would be the same asfor the CO2 in the reservoir as well as for the soil gas CO2, whichwould have migrated from the reservoir along fast-flow paths.
A much heavier carbon isotope ratio (i.e. less negative) than forbiogenic CO2.
A major soil gas anomaly of CO2 (Figure 8) with a Delta 13CCO2 of-23.5 in the immediate vicinity of the oil well and a nearby abandonedoil well in the SW corner of the Kerr property clearly shows that atleast one of the wells is leaking and that the CO2 is anthropogenic.
An almost exact correlation of methane to thermogenic ethaneconcentrations fingerprints almost all the CO2 found in the soil gas asanthropogenic.
The following additional evidence, both empirical and interpretative, linksthe CO2 found in soil gas with the anthropogenic CO2 injected into theWeyburn reservoir:
42
A very high level of CO2 concentrations over normal baseline valuesin soils at 3-foot depth is a prime indicator of leakage from theWeyburn reservoir. Average CO2 concentrations over backgroundvalues were up to 50 times in the August 2010 survey and up to 20times in the winter survey when concentrations were attenuated.
A major advantage of a winter survey is that biological activity andCO2 respiration is so low that anomalous values (i.e. in excess ofbackground values) can be linked to CO2 migrating from a non-biogenic source.
A slightly higher Delta13CCO2 since the August 2010 soil gas survey(-23.1 versus -22.0) shows that the ratio of the anthropogenic CO2from the Synfuels plant to recycled CO2 being injected into thereservoir is increasing. However, the Delta13C is still well below therange of -27 to -28 for biogenic CO2 found in soils for this area(University of Saskatchewan Thesis: “Storage of Organic andInorganic Carbon of Biogenic Origin in the Soil of the Parkland-Prairie Ecosystem”; Dunling Wang; 1997).
A weak anomaly of CO2 and methane in the vicinity of anotherabandoned oil well in the SE corner of the Kerr property is indicativeof minor leakage.
The anthropogenic CO2 leakage from one or both of the SW wells islikely to have come from one or more of the three CO2 and nineWAG (water alternating CO2) injection wells just to the north,northeast and east of the Kerr property. To reach the SW well the CO2flooding and associated oil would have made its way in the oilreservoir under the Kerr property where it would have the opportunityto migrate to the surface in the form of either plumes or along fastflow paths such as fractures/faults. The reservoir in this area wouldhave been depleted years ago were it not for CO2 flooding. Somewells in this area date from 1958.
CO2 from three CO2 injection wells with horizontal legs orientedparallel to the predominant NE-SW fracture/faults can move easilyboth vertically and laterally onto the Kerr property. The toe of one ofthe horizontal wells is about 2000 meters from the Kerr property.
Empirical data shows that CO2 can move laterally at great speedsalong faults (as much as 500 meters in 30 days).
Deep-seated and open fractures/faults interpreted from lineamentstraversing the Kerr property in NE-SW and NW-SE directions can
43
provide the means for CO2 and hydrocarbons to escape both verticallyand laterally to the surface.
A portion of the anomalous CO2 and light hydrocarbons found insoils over the entire property is the result of upward migration in theform of plumes through the subsurface from the reservoir without thebenefit of fast flow paths such as faults. Accordingly, the currentsurface patterns could be an exact replica (given some time lag) of theconcentration patterns at the reservoir level.
The molecular size of CO2 presents no barrier to upward migration asheavier pentane is able to migrate from the reservoir to the surface.
Soil gas sampling at a three-foot depth, well below the A- and B-zones of the soil profile where biogenic CO2 is mainly produced,assures that almost all the CO2 measured is from another source, i.e.from the reservoir.
Sloughs and humic areas on the down thrown side of faults whereanaerobic conditions favor production of biogenic CO2 are simplyavoided. Petro-Find proprietary passive probes can sample sloughsbut these were not used in either the winter or summer soil gassurveys.
Macroseeps provides direct evidence of the existence of open faults,which can provide easy access to the surface for CO2 as well.Leakages of oil or macroseeps observed in the gravel pits (August2010 report) can only have found their way to the surface by one ormore open faults that have intersected the Weyburn oil reservoir.
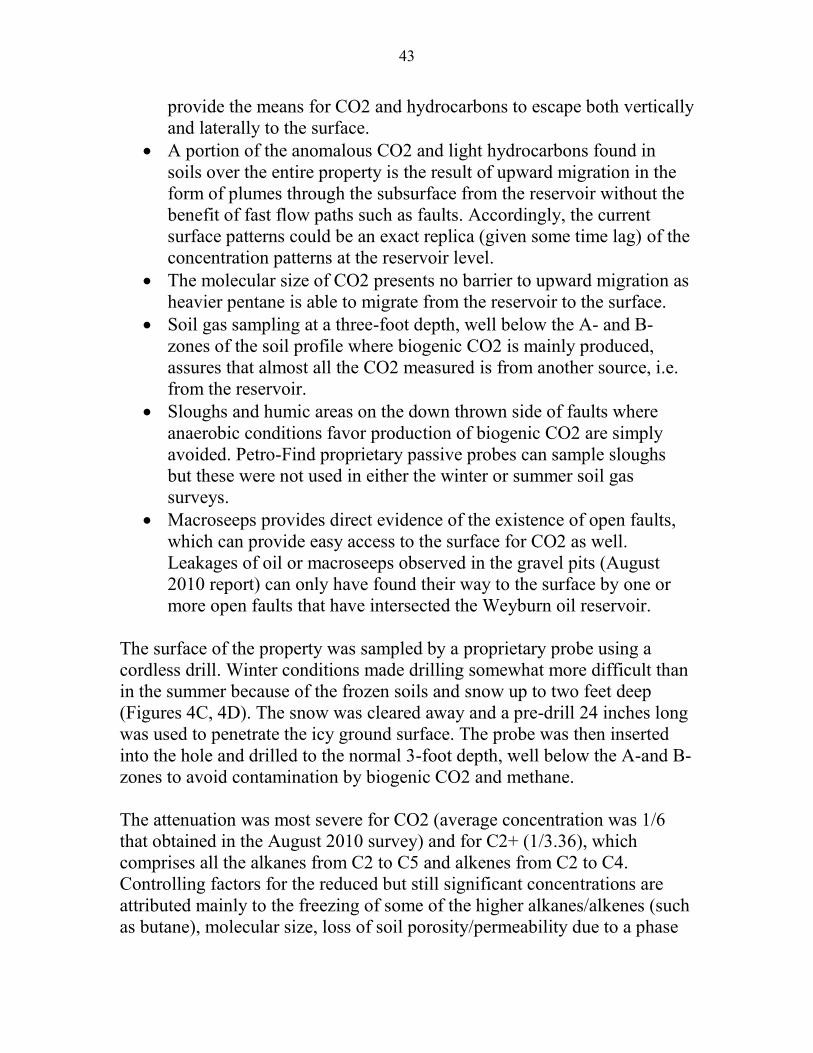
The surface of the property was sampled by a proprietary probe using acordless drill. Winter conditions made drilling somewhat more difficult thanin the summer because of the frozen soils and snow up to two feet deep(Figures 4C, 4D). The snow was cleared away and a pre-drill 24 inches longwas used to penetrate the icy ground surface. The probe was then insertedinto the hole and drilled to the normal 3-foot depth, well below the A-and B-zones to avoid contamination by biogenic CO2 and methane.
The attenuation was most severe for CO2 (average concentration was 1/6that obtained in the August 2010 survey) and for C2+ (1/3.36), whichcomprises all the alkanes from C2 to C5 and alkenes from C2 to C4.Controlling factors for the reduced but still significant concentrations areattributed mainly to the freezing of some of the higher alkanes/alkenes (suchas butane), molecular size, loss of soil porosity/permeability due to a phase
44
change from water to ice (i.e. water expands by 9% upon freezing), ice lensformation, and compact snow/crust/ice on the surface (for a discussion ofthese parameters see Section 5 - Geochemical Soil Gas Surveys in FrozenSoils).
The butane and pentane concentrations were found to be very low or non-existent because of the zero or near-zero temperatures at the 3-foot samplinglevel. Concentrations of butane were severely attenuated because it exists inliquid form at zero degrees. A range of 0.02-0.48 ppm pentane was obtainedin three samples compared with a range of 0.01-5.58 ppm pentane in sevensamples obtained in the previous survey conducted on the same property

45
during the hot weather month of August 2010. Pentane, already in liquidform at room temperature, becomes less volatile in frozen soils.Concentrations of methane and ethane were affected only marginally.
The higher-grade anomalies of CO2, methane and C2+ were found in thenortheast section of the property where the Kerr residence is located (Figures8, 9, 9A) as well as in the NW and SW corners. The two coincident highanomalies of methane and C2+ were found in the NE and SW. As noted inthe August 2010 Survey the contours of CO2, methane and C2+concentrations can exhibit different patterns from time to time because of the
46
dynamic nature of EOR operations with alternating water and CO2injections.
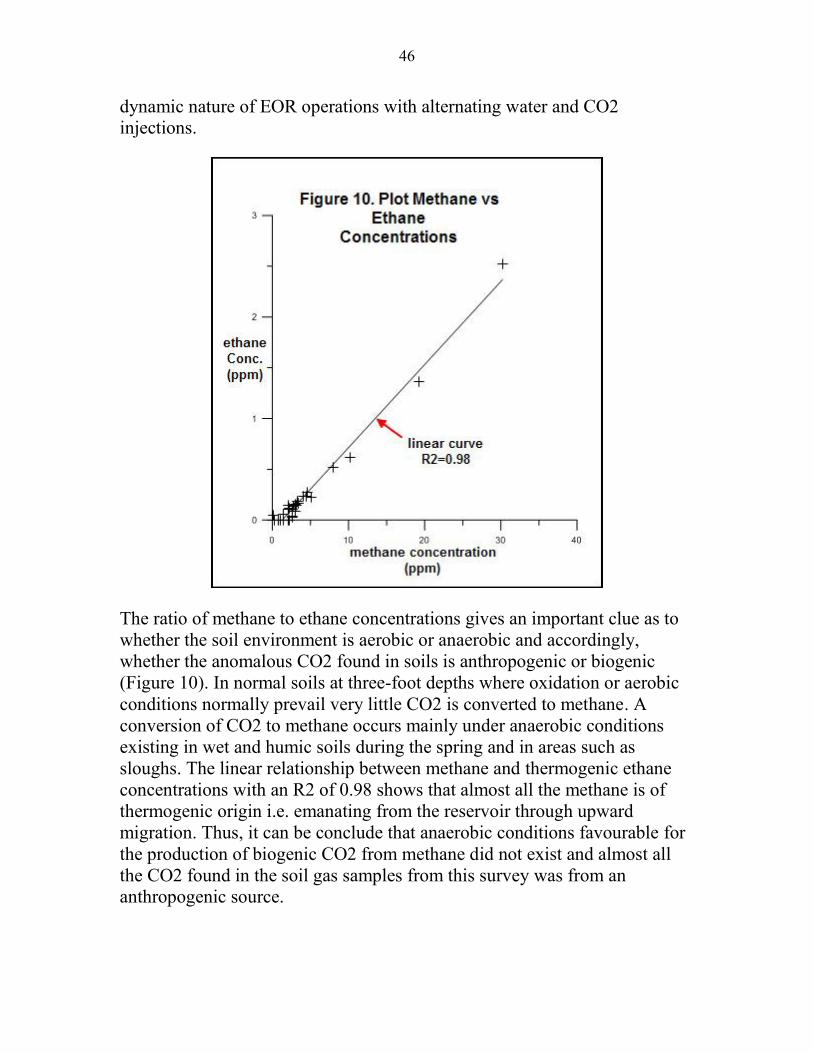
The ratio of methane to ethane concentrations gives an important clue as towhether the soil environment is aerobic or anaerobic and accordingly,whether the anomalous CO2 found in soils is anthropogenic or biogenic(Figure 10). In normal soils at three-foot depths where oxidation or aerobicconditions normally prevail very little CO2 is converted to methane. Aconversion of CO2 to methane occurs mainly under anaerobic conditionsexisting in wet and humic soils during the spring and in areas such assloughs. The linear relationship between methane and thermogenic ethaneconcentrations with an R2 of 0.98 shows that almost all the methane is ofthermogenic origin i.e. emanating from the reservoir through upwardmigration. Thus, it can be conclude that anaerobic conditions favourable forthe production of biogenic CO2 from methane did not exist and almost allthe CO2 found in the soil gas samples from this survey was from ananthropogenic source.
47
On a practical level, soil gas sampling of sloughs or wet areas is avoided toprevent plugging up of the probe. Petro-Find has developed passive samplersthat can be used for sampling watery sediments but these were not used.
The provenance of the CO2 found in soil gas is clearly the injectedanthropogenic CO2 from the Synfuels plant in North Dakota. Analysis of sixsamples of CO2 shows Delta 13C values in the -22.2 to -23.6 range with anaverage of -23.1, which compares with a previously known value of -20.4established in 2001, a year after EOR operations began (Table 2). Theaverage Delta 13C for CO2 of -23.1 shows a major shift from the baselinevalues of -12 to -14 determined prior to the beginning of EOR operations.The increase over last year (as well as over the previously known value) isattributed to a higher proportion of new CO2 from the Synfuels plant torecycled CO2. However, the average Delta C13 is still much less than thosefor biogenic CO2 with a value in the -27 to -28 range (University ofSaskatchewan Thesis: “Storage of Organic and Inorganic Carbon ofBiogenic Origin in the Soil of the Parkland-Prairie Ecosystem”; DunlingWang; 1997).
48
The Petro-Find soil gas method assures that the data is highly accurate andrepeatable. Other methods do not always produce as good a result. A closedchamber unit, which is placed essentially on top of the ground, is not thatuseful because it measures concentrations and fluxes of both biogenic andanthropogenic CO2. Some units can measure CO2 concentrations only up to5,000 ppm. The probe/infra-red method usually requires frequent calibrationin the field and can only measure CO2 and methane, not the other lighthydrocarbons. Subsequent sampling using the same probe for measurementof other analytes can result in dilution with ambient air.
The Weyburn reservoir has been known since its discovery as a typicallyfractured carbonate reservoir. A high concentration of light hydrocarbons insoil gas is indicative that the light hydrocarbons and CO2 (about the samemolecular weight as propane) naturally escape as microseeps in the form ofplumes that travel vertically in micro-fractures to the surface where they canbe detected and analyzed by gas chromatograph. Concentration patterns orsurface anomalies of these microseeps can be correlated with petroleum/gasaccumulations at depth. Open and closed fractures/faults in such surveys canbe detected at the surface by linear patterns of high or low concentrations insoils, respectively.
Two major lineaments that intersect just north of the Kerr residence areinterpreted as faults (Figure 4A). The coincidence of the high anomalies ofCO2, methane and C2+ with their intersection indicates that the faults areopen. Moreover, the faults are interpreted to be high angle because of theirlinearity and deep seated because of their length. The north side of the NE-SW fault appears to have been downthrown as well as the east side of theNW-SE fault because of the location of the ponds and naturally occurringsloughs.
The interpretation of lineaments as deep-seated faults demonstrates that theoverlying thick cap rock of anhydrite and shale aquitards have beenbreached and may not be as an impermeable barrier to the upward mobilityof reservoir gases as is generally thought. Some of the faults are interpretedto be of the open kind, which can act as conduits for light hydrocarbonsand CO2 as well as the heavier hydrocarbons in the form of oil to reach thesurface. The fact that oil in the form of blue sheen was found in the gravelpits near the intersection of the faults last summer (August 2010 Report)provides further evidence that the faults are open rather than closed.

49
To trace the sources of any leakages of CO2 and hydrocarbons it wasimportant to develop a knowledge base of types, locations and patterns ofwells and pipelines in the vicinity of the Kerr property. A study of surfacefacilities that separate and recycle the fluids and gases completed the picture.
Based on information obtained from the Saskatchewan Department ofIndustry and Energy three CO2 injection wells exist to the NE and east ofthe Kerr property (Figure 5F). All these wells have horizontal legs. The toe(at the end) of one of the horizontal wells (92/10-29-005-13W2) is anestimated 2030 meters (i.e. about 2 kilometers) from the NE corner of theKerr property (Figure 5F). The horizontal legs of CO2 injection wells areparallel to the predominant fracture direction, which is NE-SW (TheLeading Edge July 2009). Empirical data shows that CO2 can movelaterally at great speeds along faults (as much as 500 meters in 30 days).
Near the abandoned Kerr home the CO2 concentration is about 2,700 ppm,but at about 350 meters to the NW of the house it is 10,000 ppm (at theepicenter of a major anomaly). The Recommended Exposure Limit (REL)for the workplace, based on a time-weighted average (TWA) is 5,000 ppmover a 10-hour workday during a 40-hour week (Table 1). For someoneremaining in the home for 24 hours per day, which can happen in winter, thelimiting threshold is half the workday value, or 2,500 ppm.
Had the Kerrs still lived in their home (now abandoned because of healthconcerns) CO2 could have entered in dangerous concentrations through thecrawl space due to negative pressures caused by a natural gas heatingfurnace. Further soil gas could be drawn into the home from warmer airrising and other mechanical exhausts such as bath fans, clothes dryers, rangehoods and water heaters. It should be noted that the concentration of CO2 insoils near the Kerr residence could change rapidly on a daily basis becauseof the dynamic movement of CO2 in the EOR operations. There is no dangerfor persons in open air where CO2 from the soil quickly dissipates.
It is well known from numerous landfill studies that a cap of any kindincluding compacted snow or ice, such as observed during this survey, candivert normally upward migrating CO2 and methane laterally. Lateralmigration of CO2 in winter could increase the potential hazard in homes thathave either a crawl space or a cracked concrete basement.

50
It should be noted that the concentration of CO2 in soils near the Kerrresidence could change rapidly on a daily basis because of the dynamicmovement of CO2 in the Weyburn EOR operations. Empirical data showsthat CO2 moves horizontally very quickly. Following injection of around750 tonnes of CO2 over one month, the injected CO2 was detected at twoproducing wells 100 meters and 500 meters from the injection well (Source:Monitoring CO2 During Enhanced Hydrocarbon Recovery and GeologicalStorage; UK Department of Trade and Industry; Issue 13, February 2007).
The survey clearly shows the usefulness of geochemical soil gas surveys inassessing EOR projects for leakage of CO2 and light hydrocarbons. Soil gassurveys may also be able to determine the extent and patterns of CO2flooding operations at depth. It can be concluded that the CO2 and the lighthydrocarbons have penetrated the supposedly impermeable anhydrite caprock and have found their way to the surface by micro fractures in the formof plumes and by fast-flow conduits such as faults and fractures.
It is possible that given the high average concentration of CO2 in the soil gasthe groundwater on the Kerr property may be contaminated. CO2 dissolvesin water both as CO2 and as carbonic acid which is a reversible chemicalreaction. Metals can be leached out of the subsoil by carbonic acid andcontaminate potable groundwater. H2S and other sulphur compounds suchmercaptans, which are known to occur in the injected CO2 sourced fromNorth Dakota, are other possible contaminants. Water analysis of groundwaters over and around the Weyburn oil pool would need to be assessed toprove this hypothesis, but any analysis of this sort is outside the area ofPetro-Find’s expertise.
In the author’s opinion a mathematical simulation, conducted in the contextof the IEA study(“IEA GHG Weyburn CO2 Monitoring & Storage Project),cannot predict with any accuracy the containment of CO2 over a period of5,000 years based on data obtained over only a short monitoring period(2001-2004) and sampling of only 5% of the Weyburn/Midale reservoir.
12. Statement of Qualifications –Paul Lafleur
I, Paul Lafleur of 215 Mallin Crescent, Saskatoon, Saskatchewan, S7K7X3,phone number 306-931-3156 do hereby certify that:
51
I am a graduate Geological Engineer from the Colorado School of Minesand a graduate of the University of Western Ontario. I have had years ofexperience practicing my Profession as a geologist, engineer and mineraleconomist. During the last eight years I have been engaged as a GeologicalEngineer to conduct geochemical soil gas surveys for oil and gas. I amcurrently the President of Petro-Find Geochem Ltd of Saskatoon SK. Pauland Ruth Lafleur are the sole owners of the company.
I am a registered Professional Engineer with the:Association of Professional Engineers & Geoscientists of
Saskatchewan (APEGS).Association of Professional Engineers, Geologists and
Geophysicists of Alberta (APEGGA).
I have been granted permission by The Association of ProfessionalEngineers &Geoscientists of Saskatchewan to offer my services inSaskatchewan as a Consulting Engineer/Geoscientist in the following fields:
Geological Engineering: mineral and energy economics; application oftrace hydrocarbon and fixed gas analysis of soil gas to identify and
characterize the presence of hydrocarbons and minerals.
The APEGS Certificate of Authorization for Petro-Find Geochem Ltd isC1406.
Exploration Technologies, Inc. REMOTE SENSING AND SOIL GAS
GEOCHEMICAL STUDY, RAILROAD VALLEY, NYE COUNTY,
NEVADAEMOTE SENSING AND SOIL GAS GEOCHEMICAL STUDY, RAILROAD
VALLEY, NYE COUNTY, NEVADA

52
Appendices
Tab 1. Data - Hydrocarbon and CO2 Analysis of Soil GasTab 2. Data - Analysis of Stable Carbon Isotopes in CO2Tab 3. Examples of Lineament StudiesTab 4. Complexity of Enhanced Oil Recovery Operations in the Vicinity ofthe Kerr Property; Individual Ownership PlanTab 5. Contour Maps of CO2, Methane and C2+
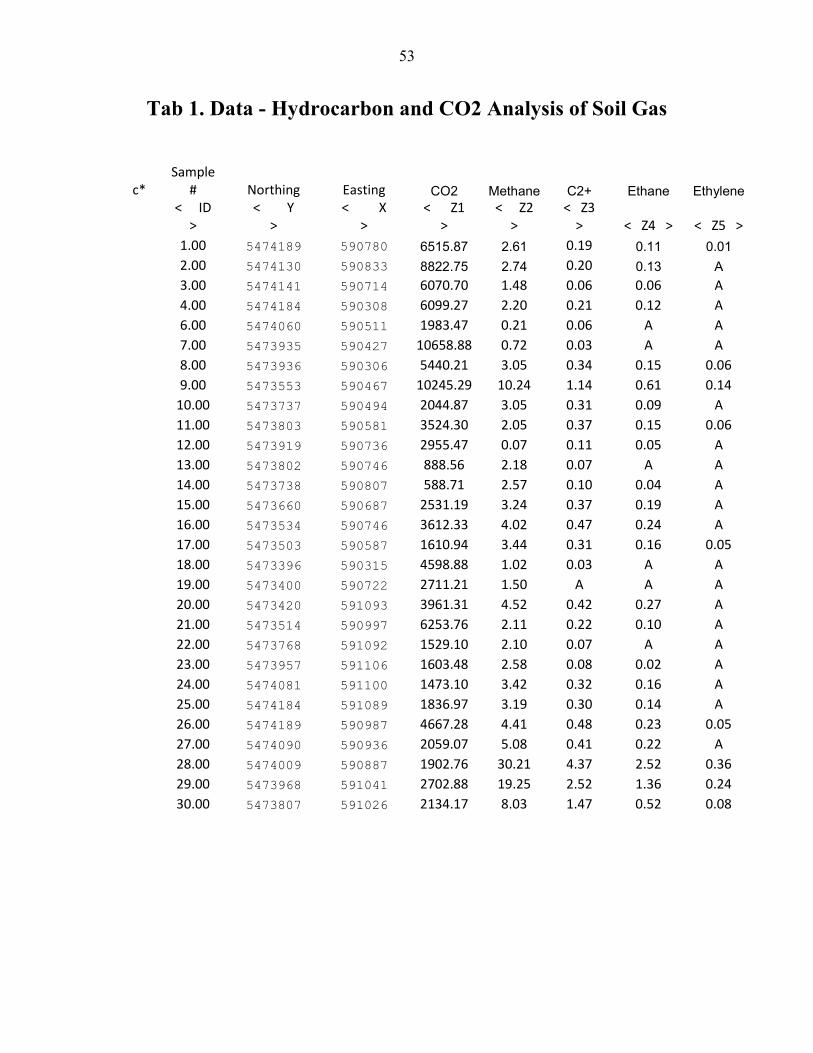
53
Tab 1. Data - Hydrocarbon and CO2 Analysis of Soil Gas
c*Sample
# Northing Easting CO2 Methane C2+ Ethane Ethylene< ID
>< Y
>< X
>< Z1
>< Z2
>< Z3
> < Z4 > < Z5 >1.00 5474189 590780 6515.87 2.61 0.19 0.11 0.012.00 5474130 590833 8822.75 2.74 0.20 0.13 A3.00 5474141 590714 6070.70 1.48 0.06 0.06 A4.00 5474184 590308 6099.27 2.20 0.21 0.12 A6.00 5474060 590511 1983.47 0.21 0.06 A A7.00 5473935 590427 10658.88 0.72 0.03 A A8.00 5473936 590306 5440.21 3.05 0.34 0.15 0.069.00 5473553 590467 10245.29 10.24 1.14 0.61 0.14
10.00 5473737 590494 2044.87 3.05 0.31 0.09 A11.00 5473803 590581 3524.30 2.05 0.37 0.15 0.0612.00 5473919 590736 2955.47 0.07 0.11 0.05 A13.00 5473802 590746 888.56 2.18 0.07 A A14.00 5473738 590807 588.71 2.57 0.10 0.04 A15.00 5473660 590687 2531.19 3.24 0.37 0.19 A16.00 5473534 590746 3612.33 4.02 0.47 0.24 A17.00 5473503 590587 1610.94 3.44 0.31 0.16 0.0518.00 5473396 590315 4598.88 1.02 0.03 A A19.00 5473400 590722 2711.21 1.50 A A A20.00 5473420 591093 3961.31 4.52 0.42 0.27 A21.00 5473514 590997 6253.76 2.11 0.22 0.10 A22.00 5473768 591092 1529.10 2.10 0.07 A A23.00 5473957 591106 1603.48 2.58 0.08 0.02 A24.00 5474081 591100 1473.10 3.42 0.32 0.16 A25.00 5474184 591089 1836.97 3.19 0.30 0.14 A26.00 5474189 590987 4667.28 4.41 0.48 0.23 0.0527.00 5474090 590936 2059.07 5.08 0.41 0.22 A28.00 5474009 590887 1902.76 30.21 4.37 2.52 0.3629.00 5473968 591041 2702.88 19.25 2.52 1.36 0.2430.00 5473807 591026 2134.17 8.03 1.47 0.52 0.08
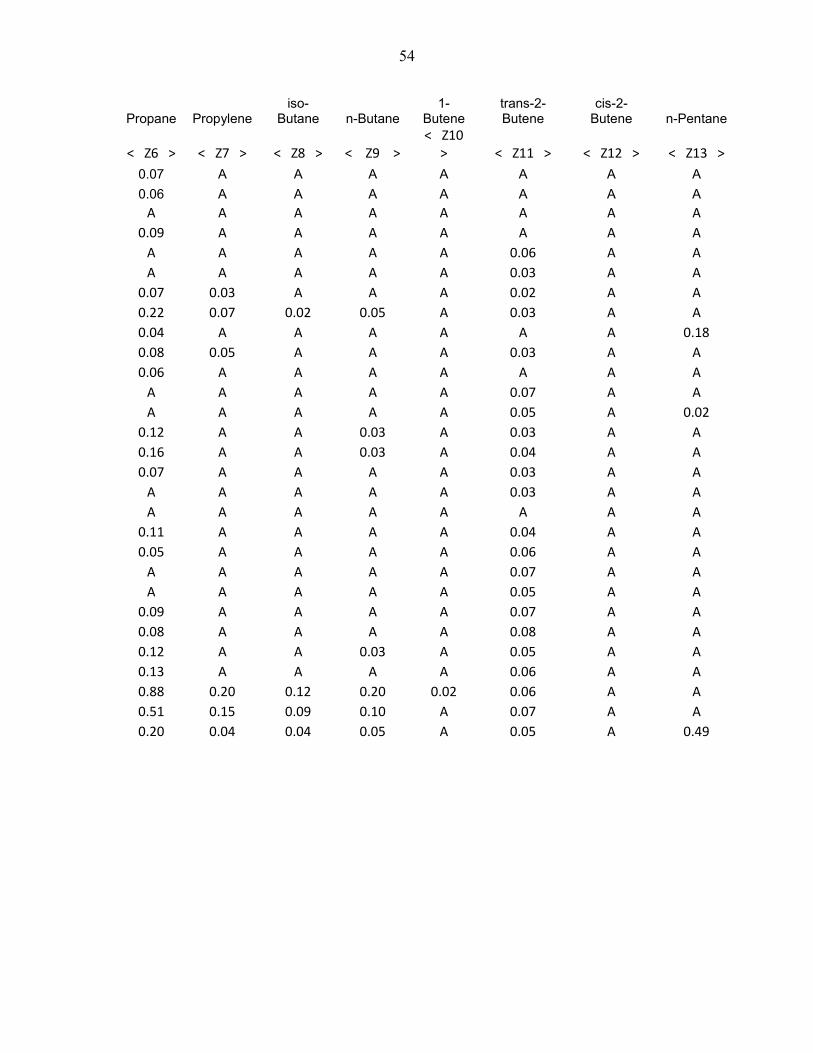
54
Propane Propyleneiso-Butane n-Butane
1-Butene
trans-2-Butene
cis-2-Butene n-Pentane
< Z6 > < Z7 > < Z8 > < Z9 >< Z10
> < Z11 > < Z12 > < Z13 >0.07 A A A A A A A0.06 A A A A A A A
A A A A A A A A0.09 A A A A A A A
A A A A A 0.06 A AA A A A A 0.03 A A
0.07 0.03 A A A 0.02 A A0.22 0.07 0.02 0.05 A 0.03 A A0.04 A A A A A A 0.180.08 0.05 A A A 0.03 A A0.06 A A A A A A A
A A A A A 0.07 A AA A A A A 0.05 A 0.02
0.12 A A 0.03 A 0.03 A A0.16 A A 0.03 A 0.04 A A0.07 A A A A 0.03 A A
A A A A A 0.03 A AA A A A A A A A
0.11 A A A A 0.04 A A0.05 A A A A 0.06 A A
A A A A A 0.07 A AA A A A A 0.05 A A
0.09 A A A A 0.07 A A0.08 A A A A 0.08 A A0.12 A A 0.03 A 0.05 A A0.13 A A A A 0.06 A A0.88 0.20 0.12 0.20 0.02 0.06 A A0.51 0.15 0.09 0.10 A 0.07 A A0.20 0.04 0.04 0.05 A 0.05 A 0.49

55
Tab 2. Data - Analysis of Stable Carbon Isotopes in CO2
56
Tab 3 Examples of Lineament Studies
1. “Both stratigraphic and structural traps in Osage County, Oklahoma werefound to remarkably follow the trends and positions of the surfacelineaments. The strike orientations of the subsurface structures mapped fromthe Mississippian Chat Formation were very consistent with those of thesurface lineaments and fracture traces. New exploration leads weredeveloped in Osage County, Oklahoma.” (AAPG Search and DiscoveryArticle #91021©1997 AAPG Annual Convention, Dallas, Texas).
2. “It was also observed that many producing oil and gas reservoirs inColorado and northwestern New Mexico, and almost all in the state ofArizona are positioned along and/or at the intersections of the surface majorfracture zones. A subtle association appears to exist between oil shows andsurface fracture zones and/or basement fault systems within northeasternArizona. As a result, this study suggests that the areas along or adjacent tothe surface fracture zones and/or basement fault systems in northeasternArizona be considered priority locations for exploratory drilling and/orgeophysical and geochemical surveys.”( AAPG Search and DiscoveryArticle #91021©1997 AAPG Annual Convention, Dallas, Texas)
3. “Generally, where productive, lineaments define dominantly northeast andnorthwest-trending fault systems and other structural features. Together withthickness variations, stratigraphic changes and overpressuring (up to 0.7psi/ft.), Bakken reservoirs have been created. Two recent major oildiscoveries, Elm Coulee and Parshall fields, have caused a renewal of thecyclic exploration effort of the Bakken.” (AAPG Search and DiscoveryArticle #90092©2009 AAPG Rocky Mountain Section, July 9-11, 2008,Denver, Colorado)
4. “Many of the fields within the Powder River Basin are structurallycontrolled by large-scale basement lineaments running along NE-SW andSE-NW trends. In the case of Fiddler Creek Field, the major control was aNE-SW trending lineament known as the Fiddler Creek Trend. This faultdownthrows to the SE, and provided shallow topographic drainage to funnelsediment through to the deeper basin. The westernmost part of the fieldoverlies the SE-NW trending Weston/Hat Creek Trend, which downthrowsto the SW and offsets the Newcastle Sandstone by ~300’ in the study area.”(AAPG Search and Discovery Article #90090©2009 AAPG AnnualConvention and Exhibition, Denver, Colorado, June 7-10, 2009).
57
5. “Estimates of Clinton net sand thickness range from 6 to 77 feet.Estimated ultimate reserves show SE to NW trends, parallel to certainlineaments.”(AAPG Search and Discovery Article #90095©2009 AAPGEastern Section Meeting, Evansville, Indiana, September 20-22, 2009)
6. “The correlation between surface linear features and subsurface structureswere assessed on a GIS platform, where all these thematic maps besidesatellite images could be stored, manipulated, overlaid and integrated in thecomputer. It was observed that the surface linear features were extremelyconsistent in orientation with the basement linears, and the overlying faultsin the basin. The interrelationship of faults, source rock and knownhydrocarbon bearing areas have been evaluated and it can be inferred thatthe possibility of occurrence of hydrocarbons is governed primarily on theavailability of source rocks and possible conduits/entrapment in the form ofhigh fault densities and /or structural cross trends. The superimposition ofsource rock thickness over the oil/gas field map reveals that, in general, thegeographic occurrences of oil/gas and source are the same. Wherever theydiffer they are associated with higher fault densities with preferentialalignment along the NE-SW fault density zones. This indicates that thefaults and their intersections have played an important role forenhanced fluid migration. Taking into consideration the above model andanalogy, the technique was applied to the rest of the Cambay Basin todecipher the lead areas for hydrocarbon exploration.”( AAPG Search andDiscover Article #90100©2009 AAPG International Conference andExhibition 15-18 November 2009, Rio de Janeiro, Brazil; SenguptaSiddhartha and Dave Harshvardhan)
7. “Prediction of Exploration Targets. Much of Nebraska’s underlyinggeology is obscured by the sand dune fields, open rangeland, andagricultural fields with no outcrop expression. In these areas, explorationpotential prediction must be based on the subtle surface evidence ofsubsurface geologic structure (expressed as drainage deviations, tonalanomalies, subtle topographic highs), fault and fracture patterns, andevidence of possible oil seeps…..Surface lineaments: these are generallyshorter in length, may consist of many short but aligned segments, and aretexturally distinct and well defined…..Commonly displayed as linear streamsegments…elongate lakes or topographic depressions; even a series ofaligned or elongate tonal and textural anomalies.” (Remote SensingGeomorphic & Exploration Potential Analysis of Nebraska)
58
8. “The excellent quality of the TM and radar imagery allowed the mappingof regional and local lineaments over the entire valley, including the largeplaya in the center of the basin. Combining this data with publishedinformation suggested a regional structural framework for the basin andestablished the geometric relationship of the known producing fields to thelineaments. The regional geochemical survey provided data of sufficientresolution to establish both magnitude and compositional correlations ofsignificant geochemical anomalies with lineaments, lineament intersections,and producing fields. The results of this study were presented at the FourthThematic Mapper Conference (Jones et al., 1985).”(Remote Sensing andSoil Gas Geochemical Study, Railroad Valley, Nye County, Nevada;Exploration Technologies, Inc)
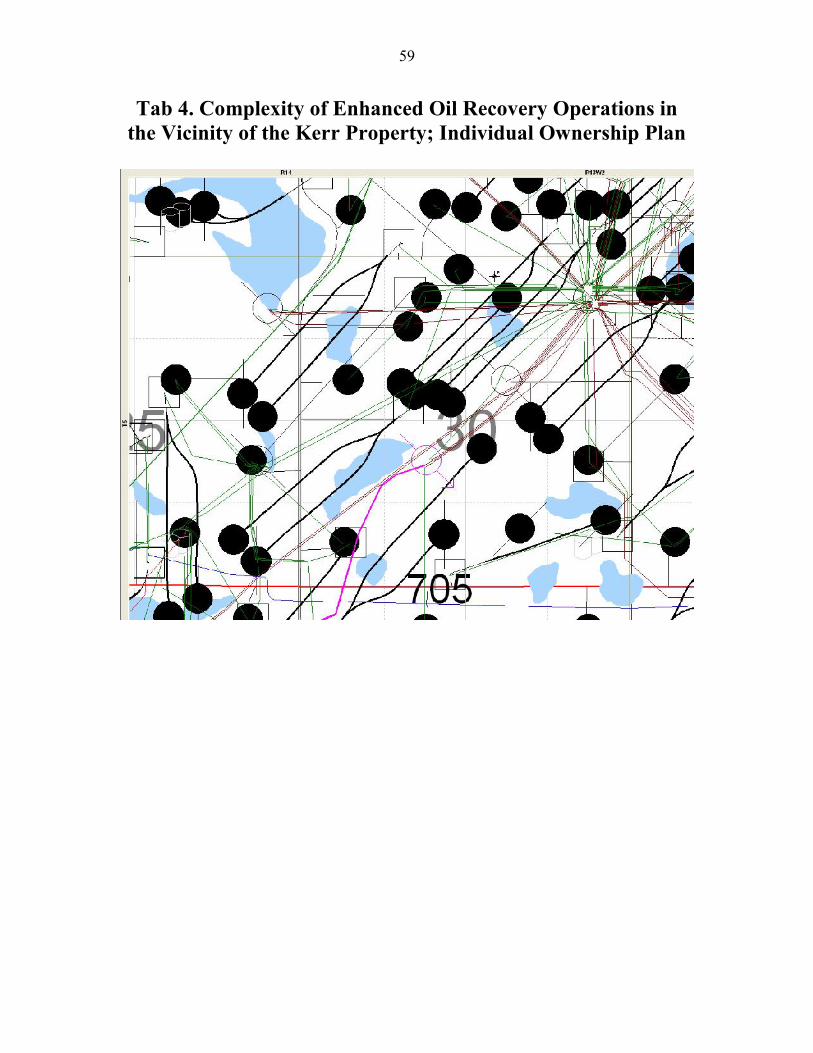
59
Tab 4. Complexity of Enhanced Oil Recovery Operations inthe Vicinity of the Kerr Property; Individual Ownership Plan
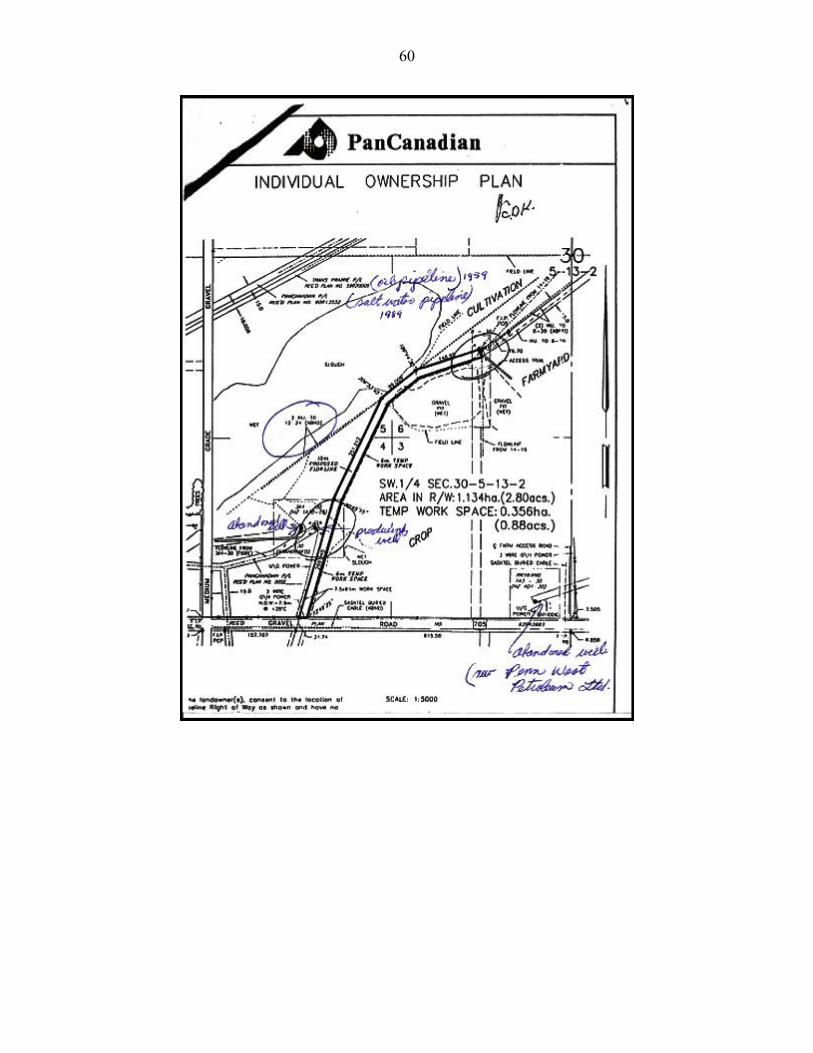
60
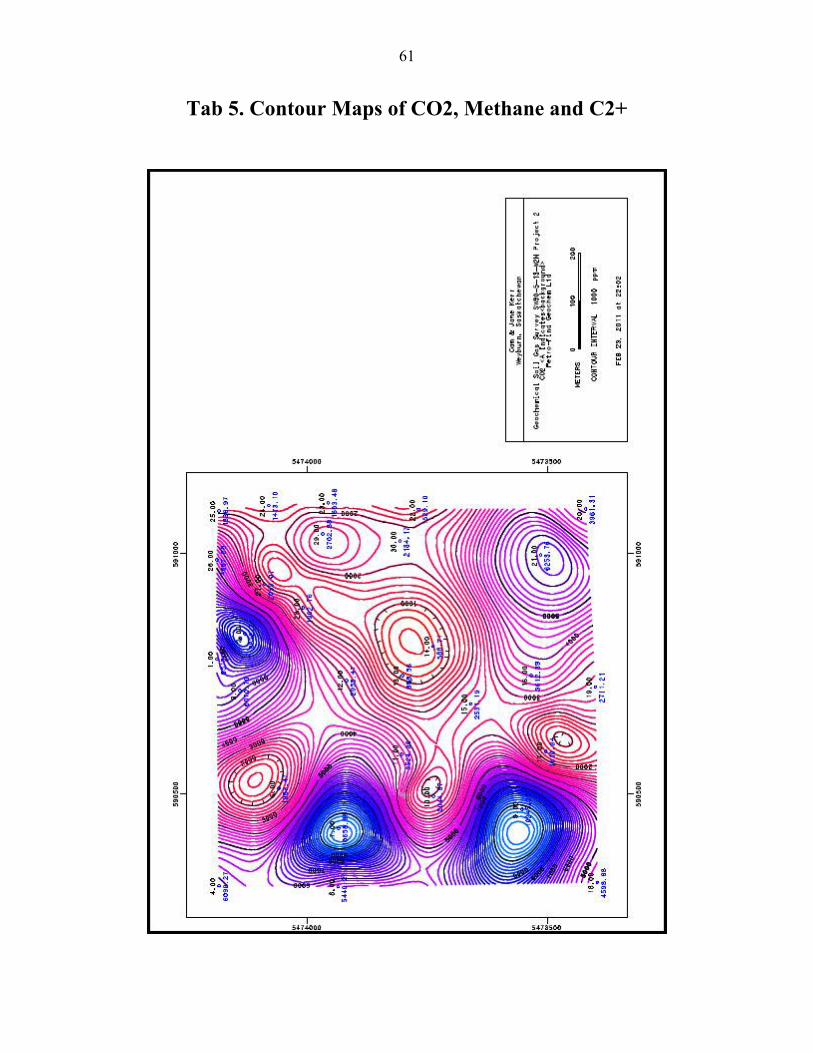
61
Tab 5. Contour Maps of CO2, Methane and C2+
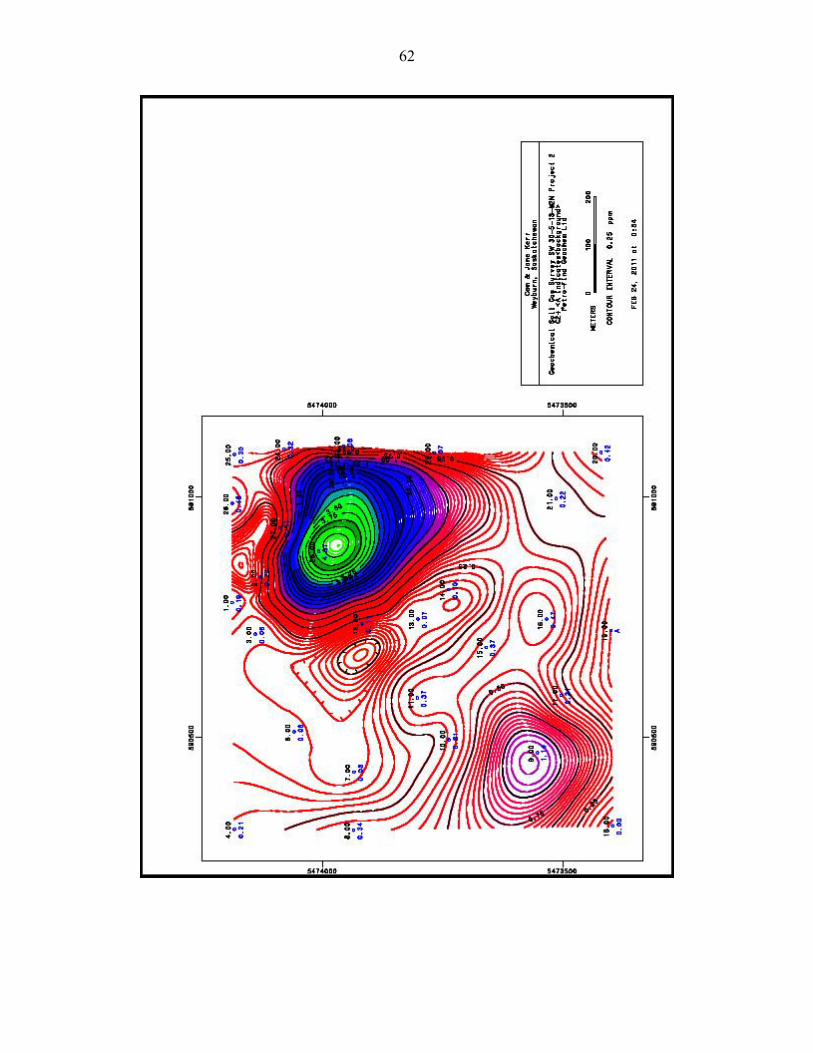
62

63

64