Embed Size (px)
DESCRIPTION
Research Methods
Citation preview

Quantitative Research Approach and Sampling
Dr. J. Teye
The Main Preoccupation of Quantitative Researchers
• Quantification is preoccupied with measurement, causality, generalization and replication.
• Measurement aims at determining specifically how much or how many of an item under consideration exists.
• Causality (determination of relationships between variables)
• Generalisation and replication.

The Process of Quantitative Research
It follows a deductive theory.
1 Theory or set of ideas
2 Hypotheses or set of concerns
3 Research design
4 Measures of concepts: operationalization
5 Select research sites
6 Select respondents: sampling
7 Questionnaire administration or collect data
8 Process data
9 Analyse data
11. Interpret data: findings and conclusion
11 Write up findings and conclusions ( Check whether analysis confirms theory)
Questionnaire Surveys
• Survey research is primarily aimed at collecting self-report information about a population.
• It is one of the commonest methods of collecting quantitative data .
• Though can be used for qualitative data as well, it is mostly for quantitative data.
Procedure
• Design Questionnaire and administer
By : Post, mail, email, face to face (structured interviewing)
Advantages of the self completion questionnaire
• Low cost
• Speed
• More convenient for respondents since they will be completed at the respondent’s own time
• Easy to interpret due to standardization
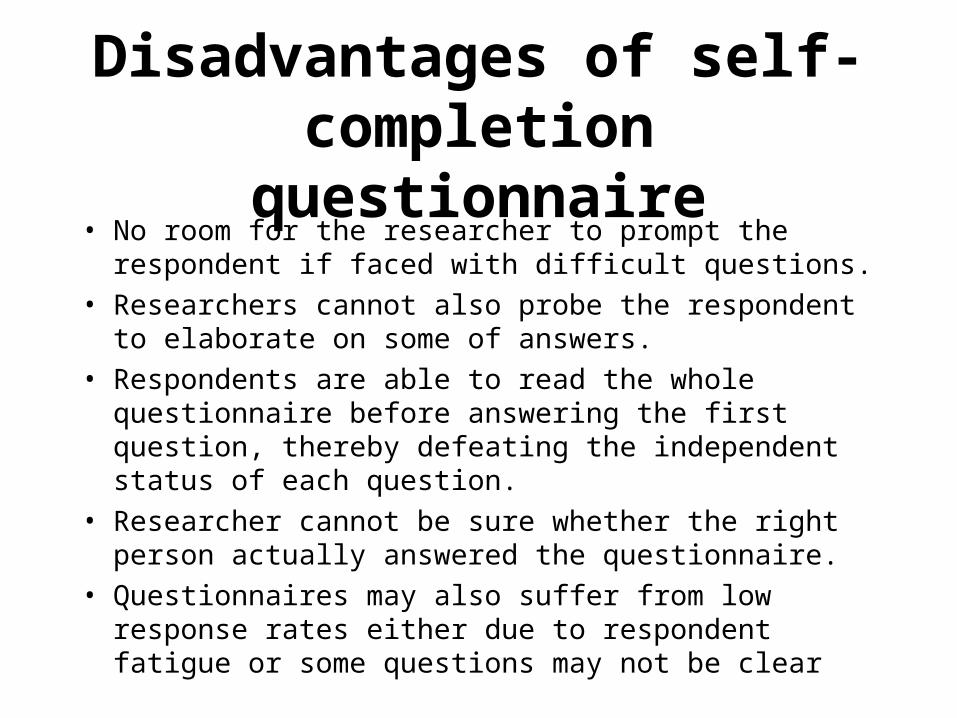
Disadvantages of self-completion questionnaire
• No room for the researcher to prompt the respondent if faced with difficult questions.
• Researchers cannot also probe the respondent to elaborate on some of answers.
• Respondents are able to read the whole questionnaire before answering the first question, thereby defeating the independent status of each question.
• Researcher cannot be sure whether the right person actually answered the questionnaire.
• Questionnaires may also suffer from low response rates either due to respondent fatigue or some questions may not be clear
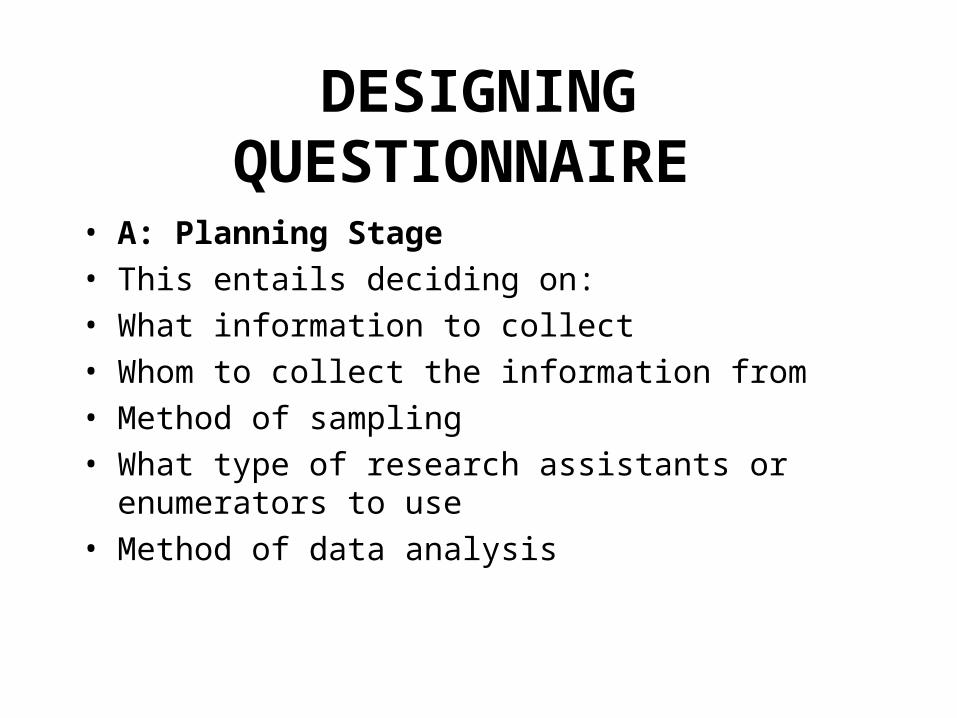
DESIGNING QUESTIONNAIRE
• A: Planning Stage
• This entails deciding on:
• What information to collect
• Whom to collect the information from
• Method of sampling
• What type of research assistants or enumerators to use
• Method of data analysis
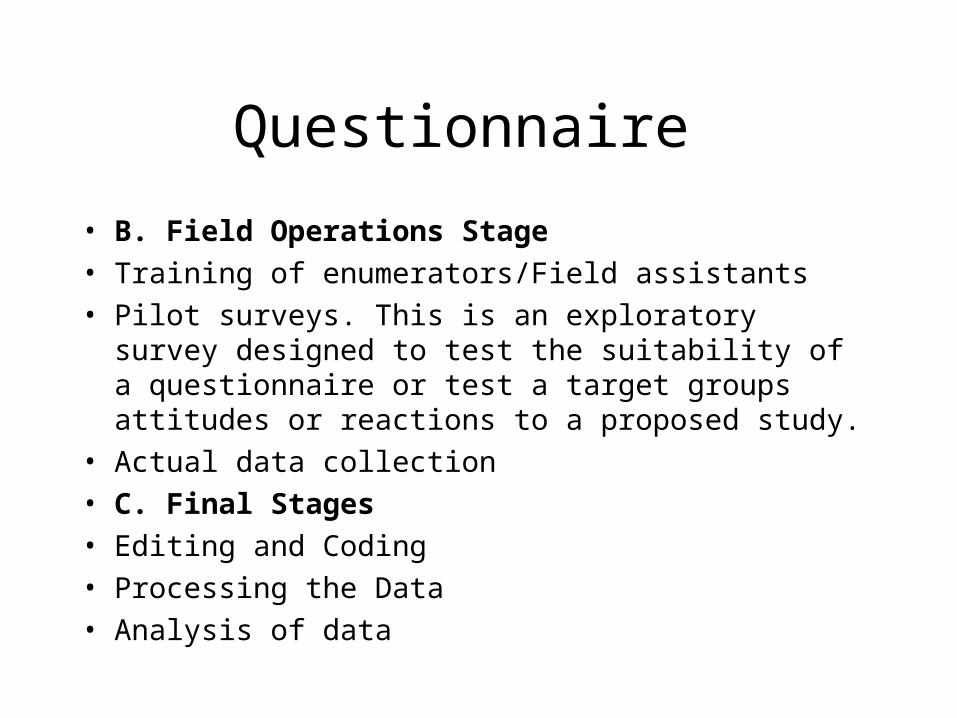
Questionnaire
• B. Field Operations Stage
• Training of enumerators/Field assistants
• Pilot surveys. This is an exploratory survey designed to test the suitability of a questionnaire or test a target groups attitudes or reactions to a proposed study.
• Actual data collection
• C. Final Stages
• Editing and Coding
• Processing the Data
• Analysis of data
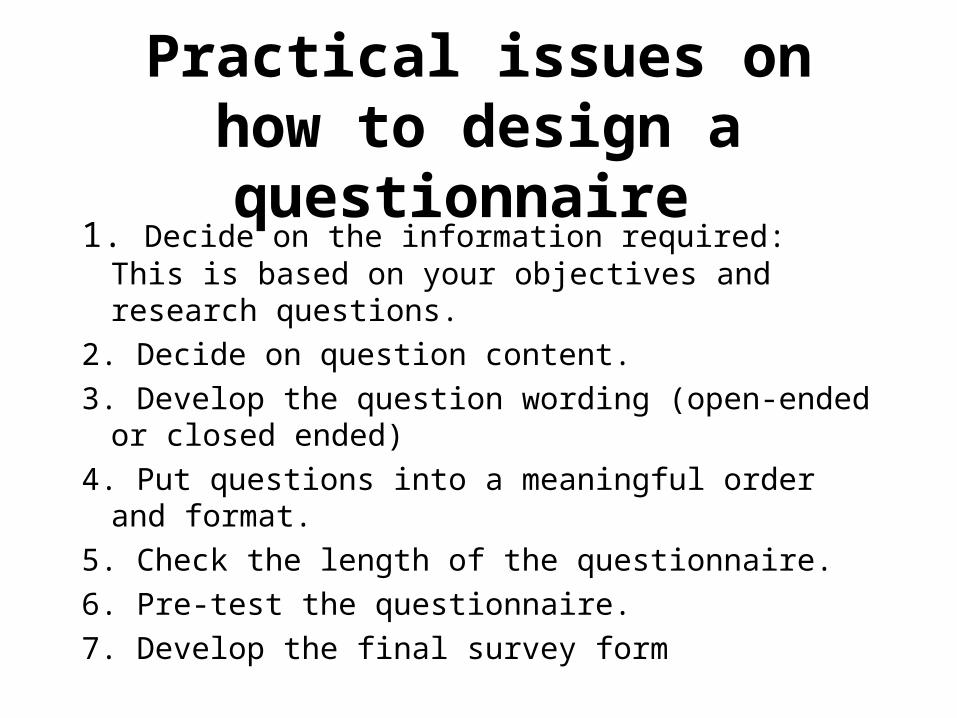
Practical issues on how to design a questionnaire
1. Decide on the information required: This is based on your objectives and research questions.
2. Decide on question content.
3. Develop the question wording (open-ended or closed ended)
4. Put questions into a meaningful order and format.
5. Check the length of the questionnaire.
6. Pre-test the questionnaire.
7. Develop the final survey form
Designing questionnaires
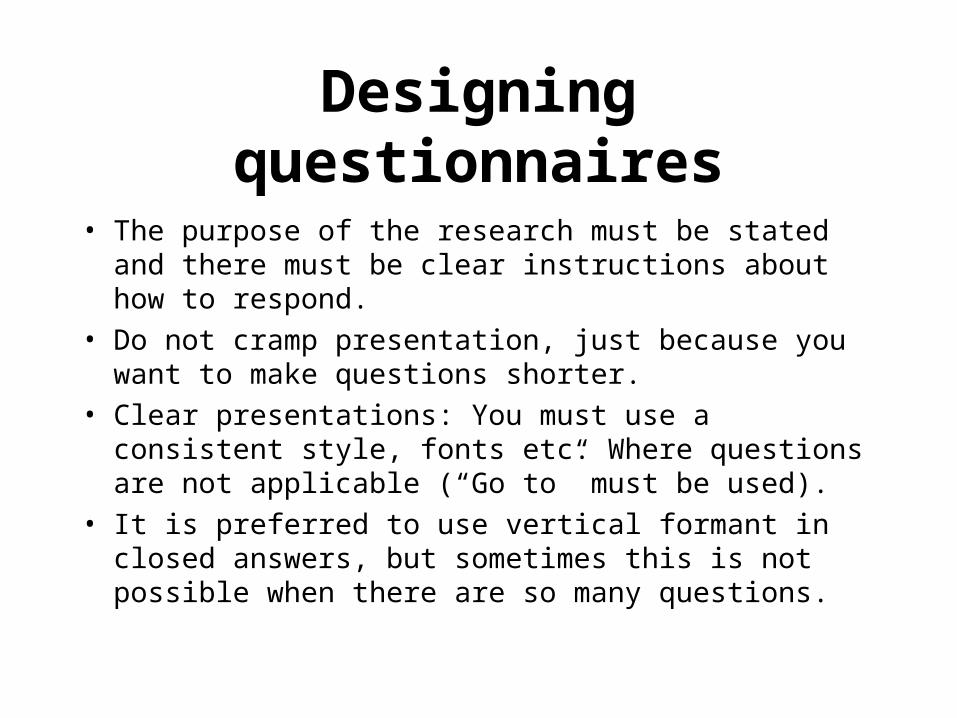
• The purpose of the research must be stated and there must be clear instructions about how to respond.
• Do not cramp presentation, just because you want to make questions shorter.
• Clear presentations: You must use a consistent style, fonts etc. Where questions are not applicable (“Go to” must be used).
• It is preferred to use vertical formant in closed answers, but sometimes this is not possible when there are so many questions.
Questionnaire
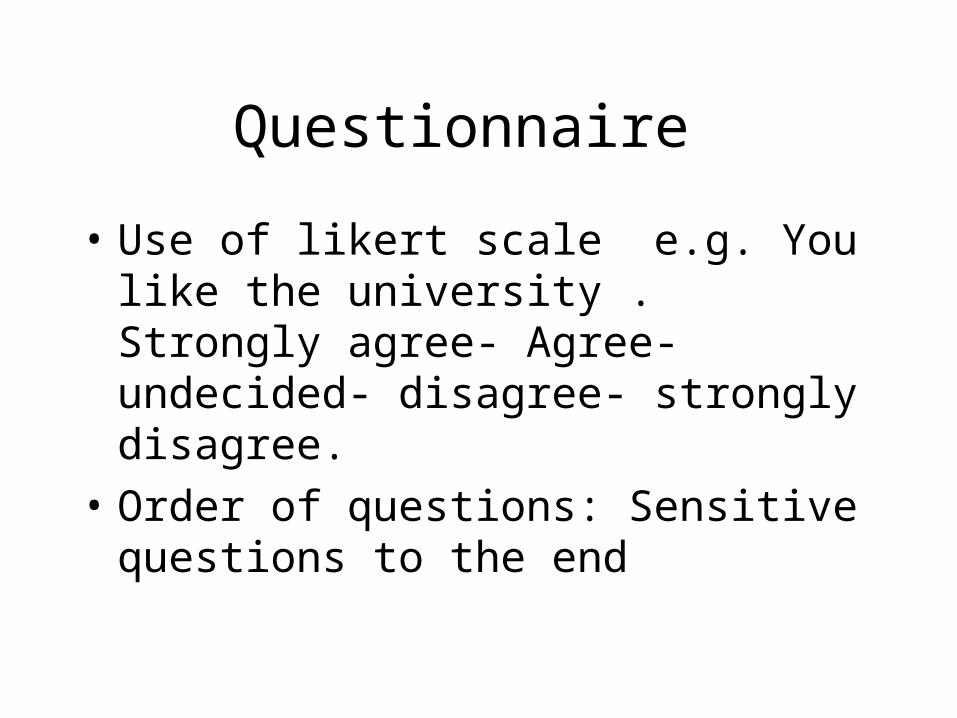
• Use of likert scale e.g. You like the university . Strongly agree- Agree- undecided- disagree- strongly disagree.
• Order of questions: Sensitive questions to the end

Rules on how to ask questions
• Avoid ambiguous and technical terms • Avoid long questions • Avoid double-barrelled questions • Also avoid general questions; be specific• Leading questions must also be avoided • Avoid questions that include so many negatives. E.g. State why you do not like the
idea of not attending lectures?
Correct question: State why you like attending lectures always.
Grid system can be used when one wants to ask several questions about the same issue.
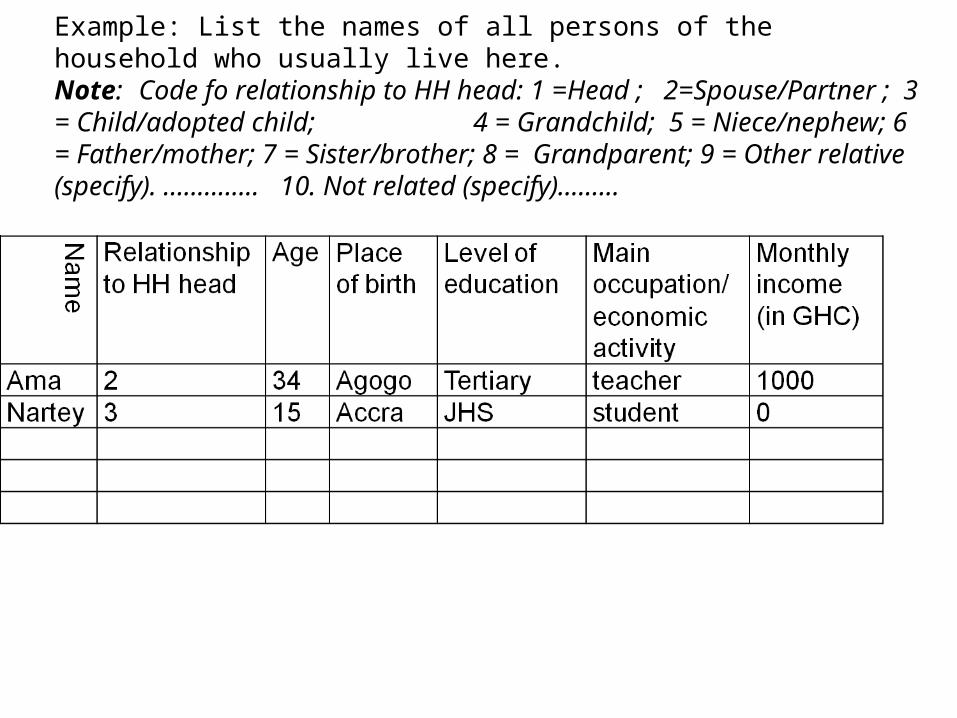
Example: List the names of all persons of the household who usually live here. Note: Code fo relationship to HH head: 1 =Head ; 2=Spouse/Partner ; 3 = Child/adopted child; 4 = Grandchild; 5 = Niece/nephew; 6 = Father/mother; 7 = Sister/brother; 8 = Grandparent; 9 = Other relative (specify). .............. 10. Not related (specify).........
Sampling Techniques
• Sampling is the procedure a researcher uses to gather people, places, or things to study.
• Sampling is necessarily because we cannot investigate the entire population
Basic concepts • Population:
• Sampling frame: The listing of all units in the population from which the sample is to be selected. Sometimes the sampling frame is not available.
• Probability sample: A sample that has been selected using random selection procedure so that each unit in the population has an equal chance of being selected.
• Non-probability sample:
• Probability and non-probability sampling
Simple Random sampling• Simple random sample is the most basic form of
probability sample. It gives each unit of the target population a known and equal probability of selection.
• Steps:
• Define the population from which sample will be selected.
• Select a sampling frame and decide on your sample size (n)
• Draw your sample for investigation. This can be done by using the lottery method, or by use of a table of random numbers or computer generated numbers.
• Strengths: Randomness, simple to use
• Weaknesses: Sampling frame; Heterogeneous population
Systematic Sampling• The first sampling unit is selected using a random number
of tables. All other units are selected systematically.
• To arrive at a systematic sample, we simply calculate the desired sampling fraction. e.g. if there are 100 units and we want to sample 20 of them then we divide 100 by 20 and get the sampling fraction 5. We then select every 5 th unit.
• Do not pre arrange the elements in a way that will influence the selection process.
• Method can be used even when there is no sampling frame. However, the technique may not be useful if there is inherent ordering of the sampling frame
Stratified sampling
• Sample frame is first divided into sub-groups or strata. A simple random sampling is then used to select units from each strata.
• 3 key questions:
-The bases of stratification (age, sex, gender).
-Number of strata
- Sample sizes within strata
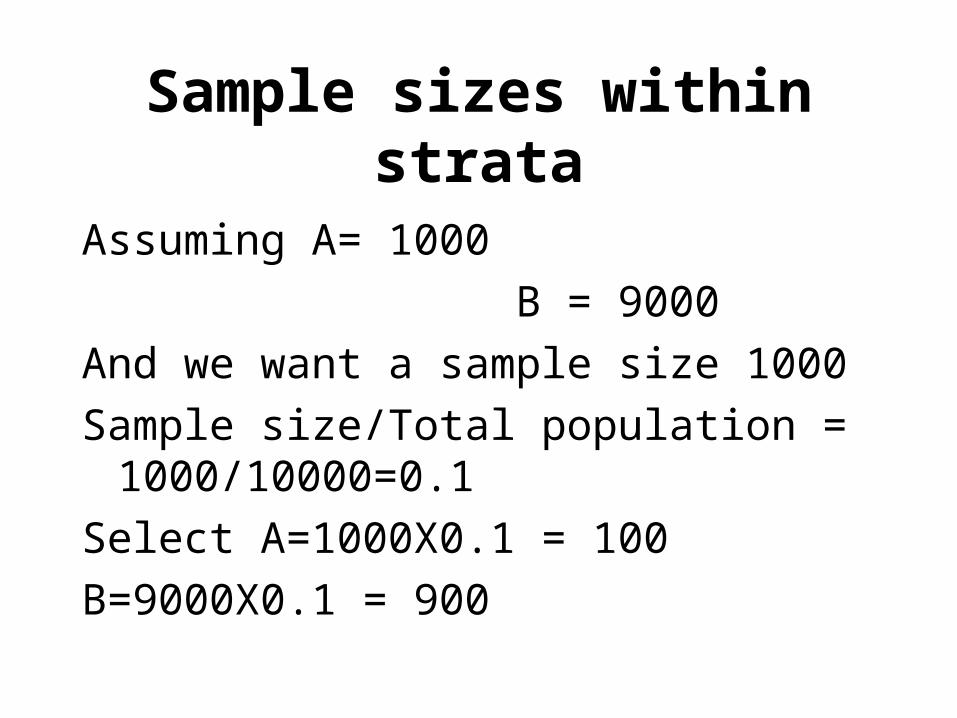
Sample sizes within strata
Assuming A= 1000
B = 9000
And we want a sample size 1000
Sample size/Total population = 1000/10000=0.1
Select A=1000X0.1 = 100
B=9000X0.1 = 900
Multi-Stage Sampling• This involves the selection of a sample of a
sample. • The units are first grouped into a number of larger
units (groups or clusters) from which a number of groups are selected. In the second stage, individual members are selected from selected clusters based on a simple random technique.
• For instance, if we want to select 400 secondary school students for a study on intention to travel outside Ghana
Cluster Sampling/ Area Sampling
• The method is just like the multi-stage sampling, but then at the first stage, we make conscious efforts to group the units into clusters that fall within the same area.
• Useful in dealing with dispersed population and also ensure representation
• Again in some cluster sampling, all units is the selected cluster may be investigated.
MULTI-PHASE SAMPLING
• Here, some facts which are considered basic are collected from all members of the sample in the first stage.
• In the second stage, only some of the members are asked more detailed questions.
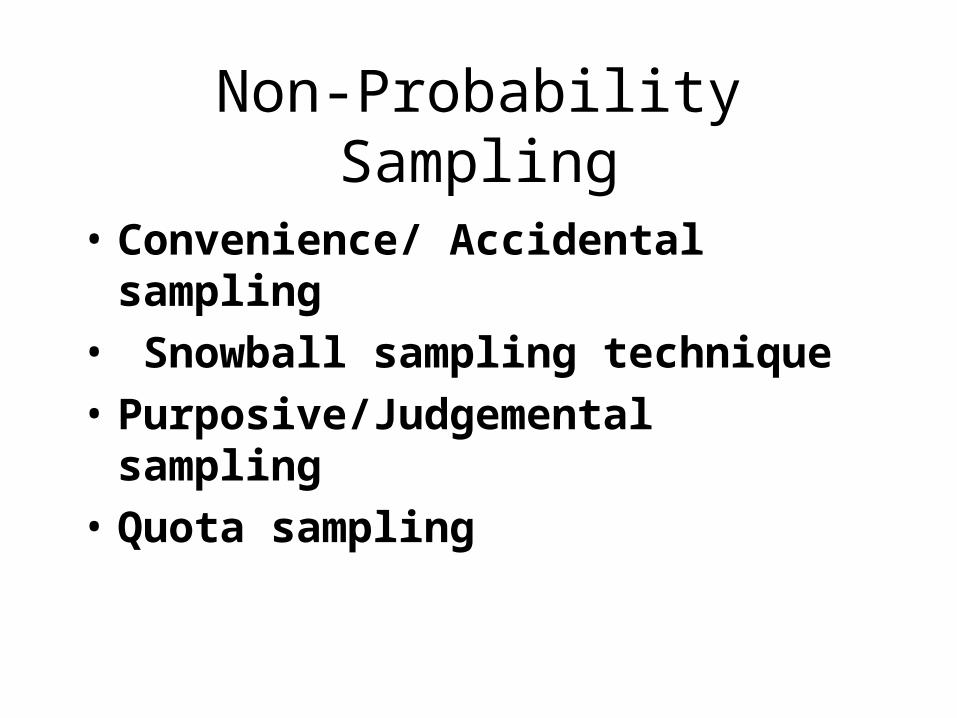
Non-Probability Sampling
• Convenience/ Accidental sampling
• Snowball sampling technique
• Purposive/Judgemental sampling
• Quota sampling
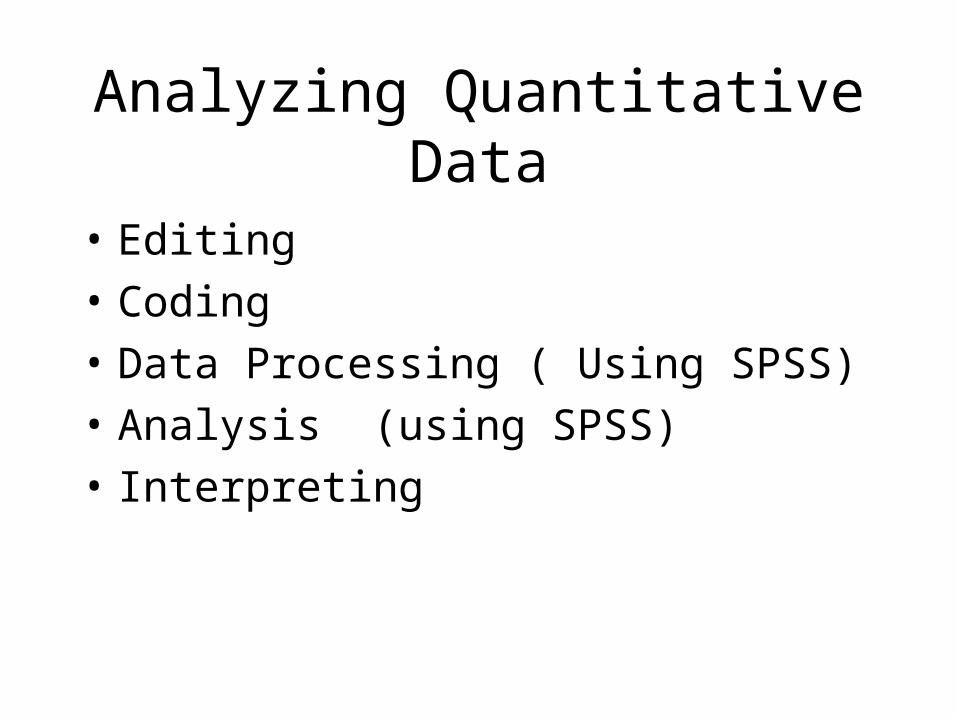
Analyzing Quantitative Data
• Editing
• Coding
• Data Processing ( Using SPSS)
• Analysis (using SPSS)
• Interpreting
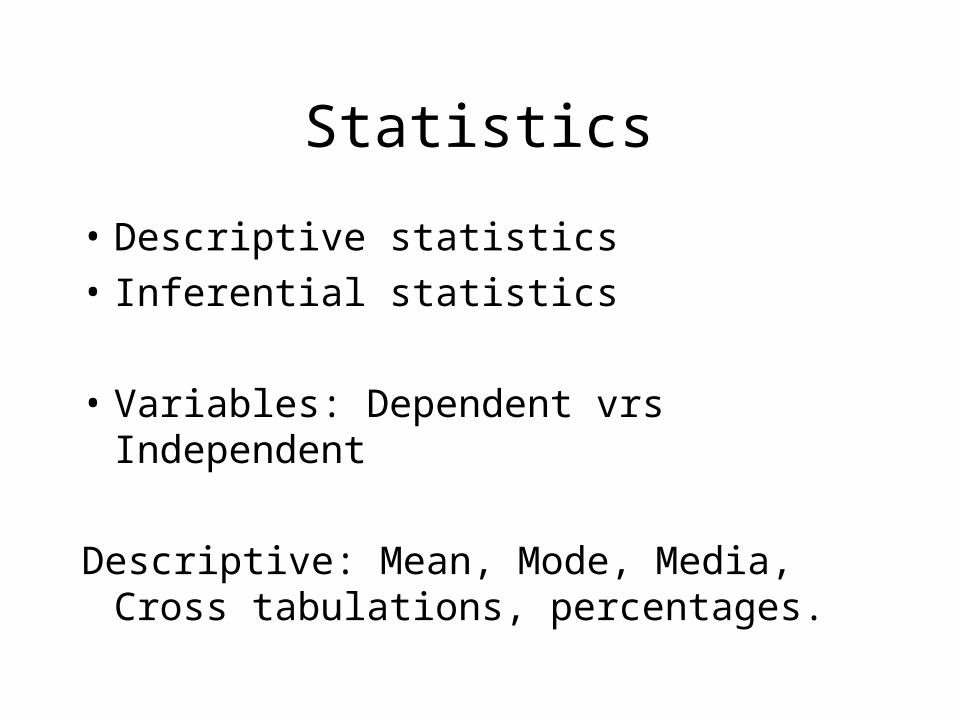
Statistics
• Descriptive statistics
• Inferential statistics
• Variables: Dependent vrs Independent
Descriptive: Mean, Mode, Media, Cross tabulations, percentages.
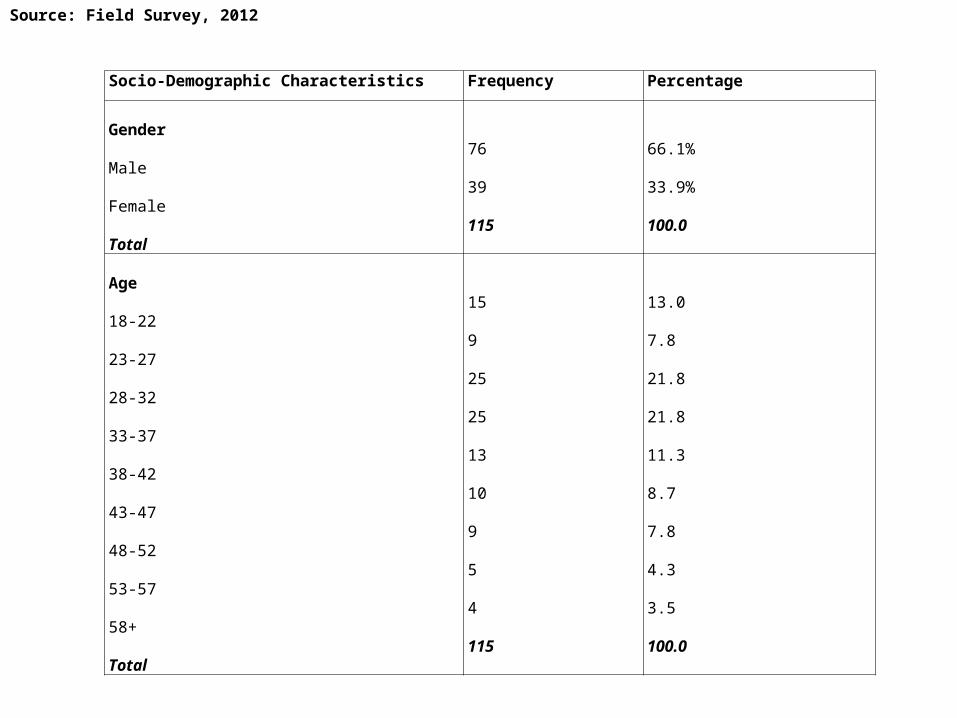
Socio-Demographic Characteristics Frequency Percentage
Gender
Male
Female
Total
76
39
115
66.1%
33.9%
100.0
Age
18-22
23-27
28-32
33-37
38-42
43-47
48-52
53-57
58+
Total
15
9
25
25
13
10
9
5
4
115
13.0
7.8
21.8
21.8
11.3
8.7
7.8
4.3
3.5
100.0
Source: Field Survey, 2012
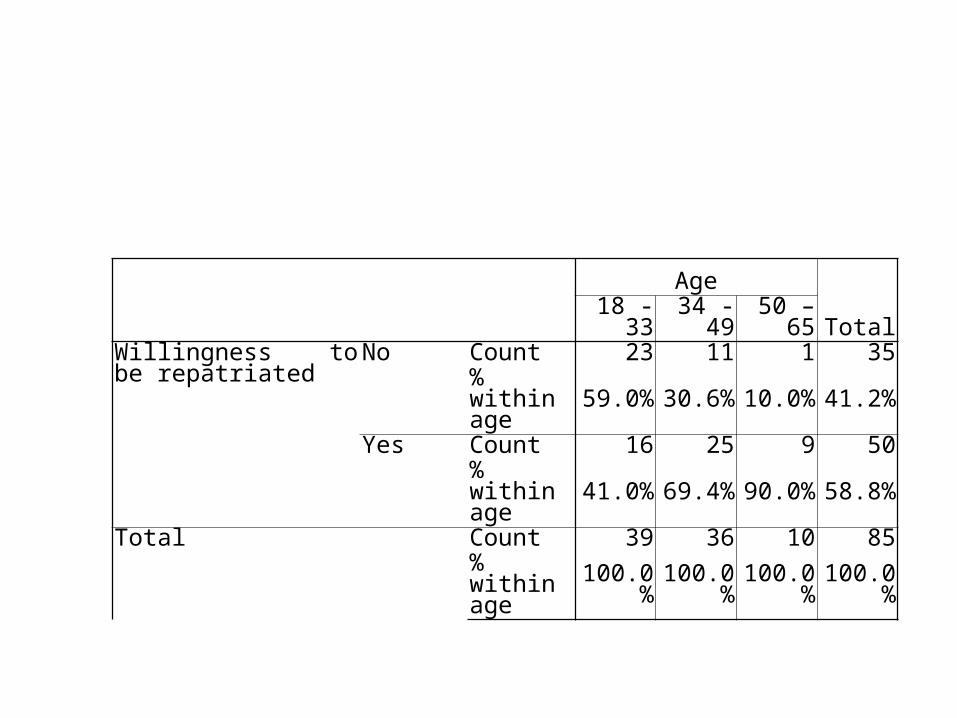
Age
Total18 - 33 34 - 49 50 – 65Willingness to be repatriated
No Count 23 11 1 35% within age 59.0% 30.6% 10.0% 41.2%
Yes Count 16 25 9 50% within age 41.0% 69.4% 90.0% 58.8%
Total Count 39 36 10 85% within age 100.0% 100.0% 100.0% 100.0%
Correlation and Regression Analysis
• Correlation
--Positive vrs negative
---Interpretation of coefficient of correlation
---Testing for the significance of coefficient of correlation
---Coefficient of determination
----Regression analysis
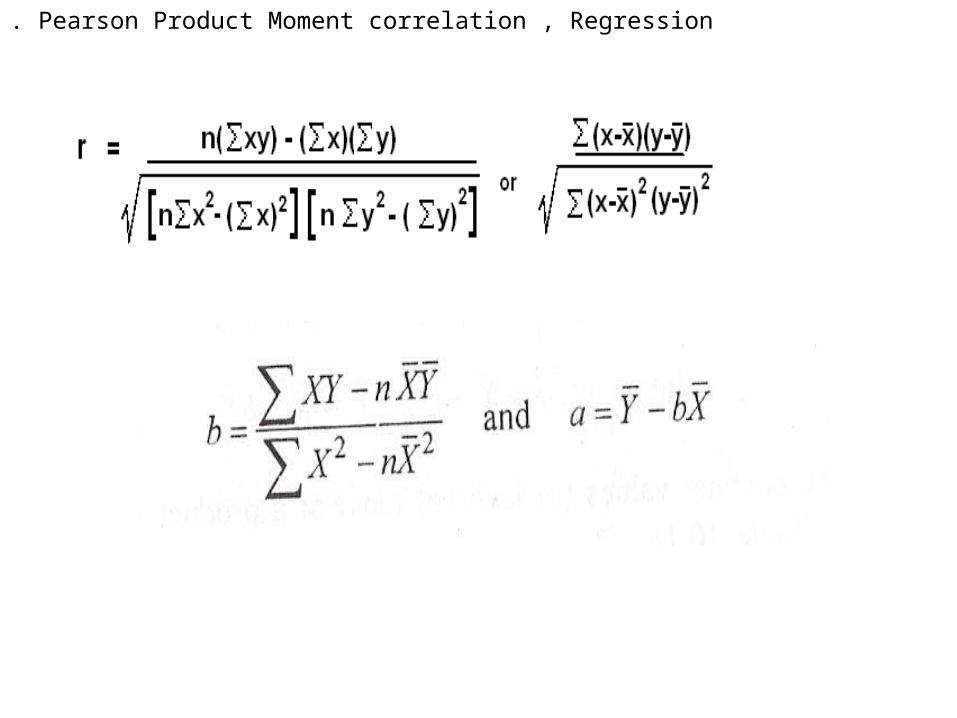
. Pearson Product Moment correlation , Regression
Question
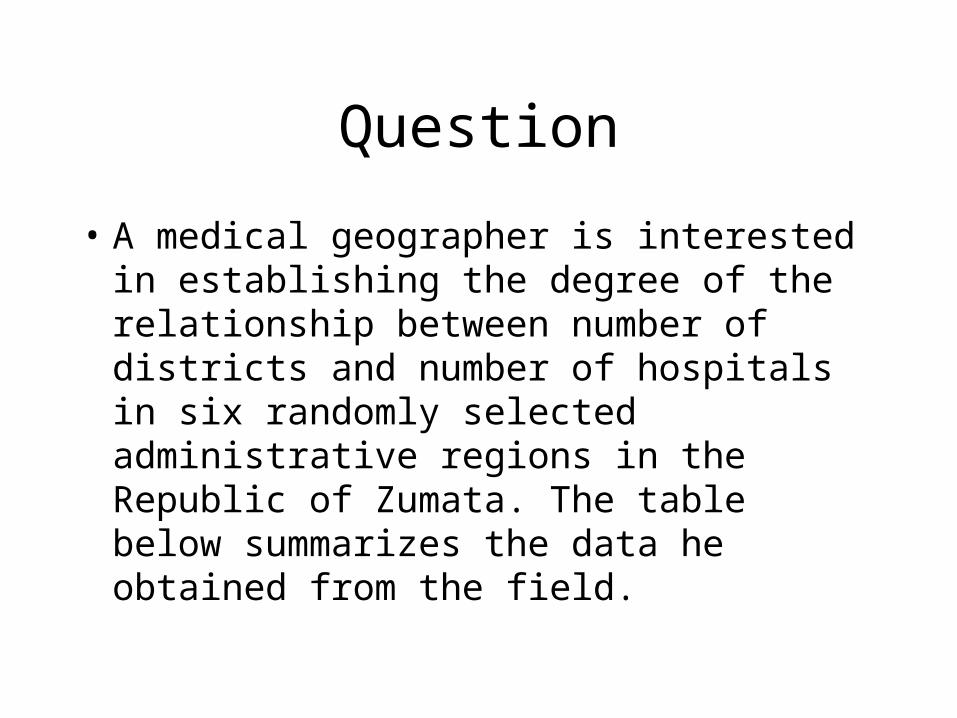
• A medical geographer is interested in establishing the degree of the relationship between number of districts and number of hospitals in six randomly selected administrative regions in the Republic of Zumata. The table below summarizes the data he obtained from the field.
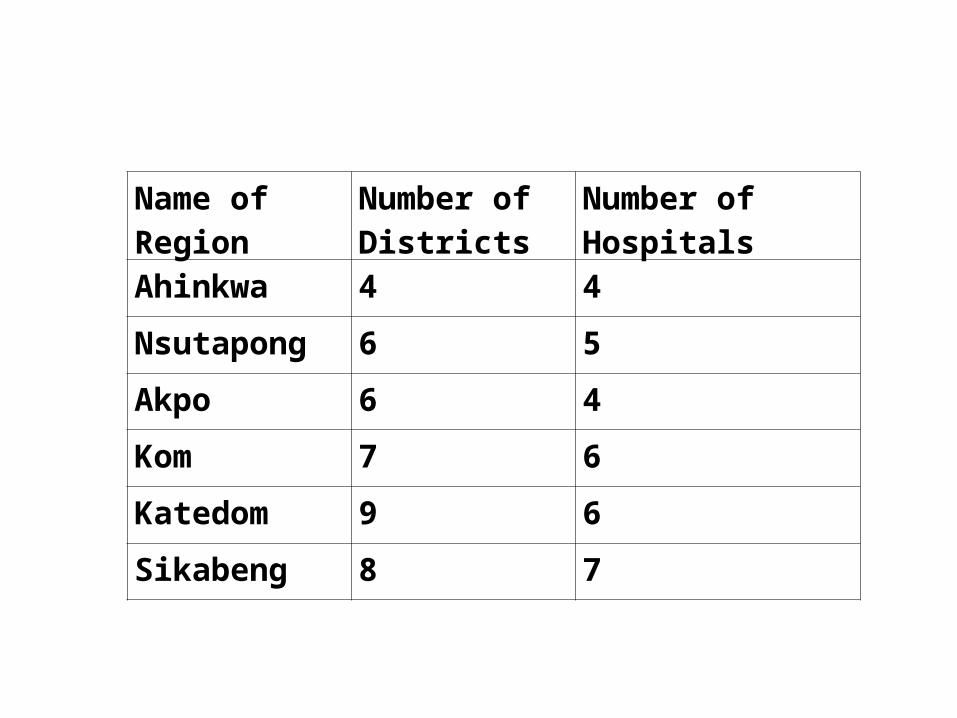
Name of Region
Number of Districts
Number of Hospitals
Ahinkwa 4 4
Nsutapong 6 5
Akpo 6 4
Kom 7 6
Katedom 9 6
Sikabeng 8 7
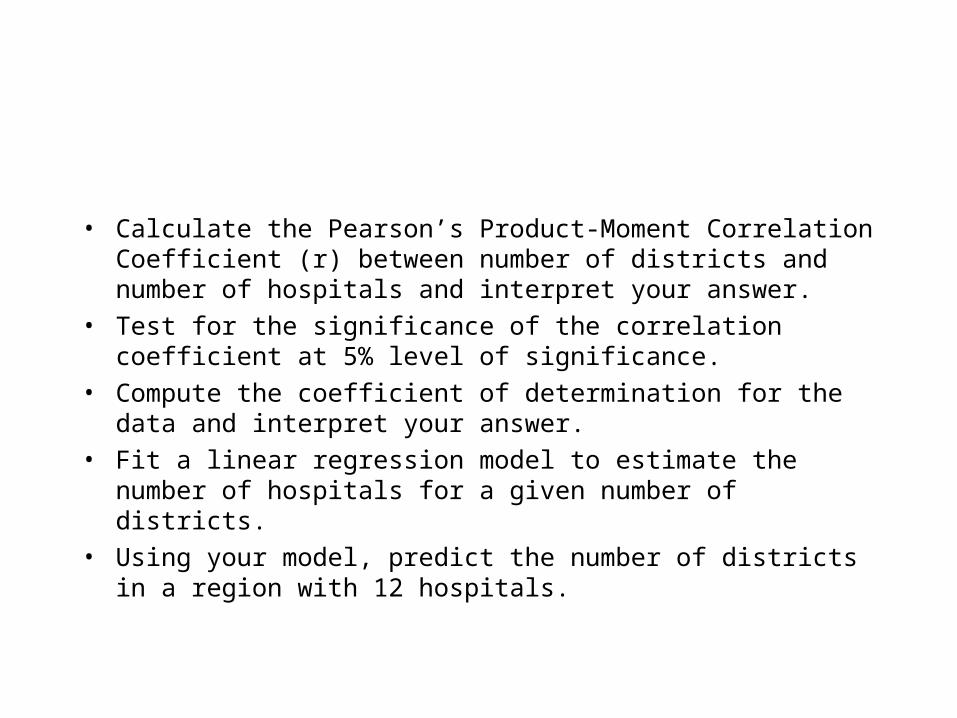
• Calculate the Pearson’s Product-Moment Correlation Coefficient (r) between number of districts and number of hospitals and interpret your answer.
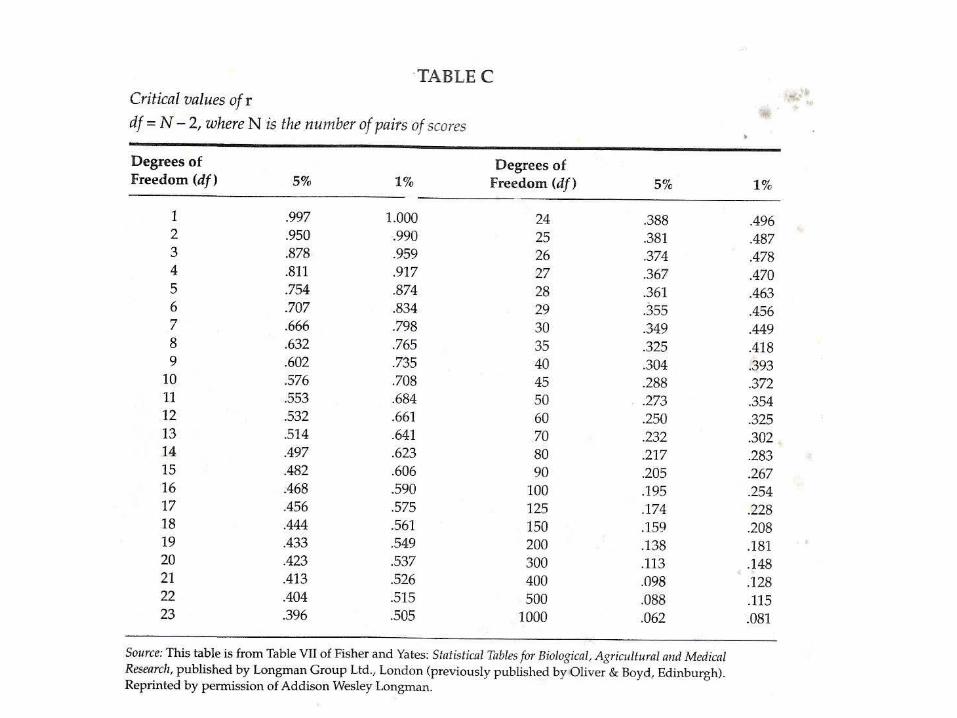
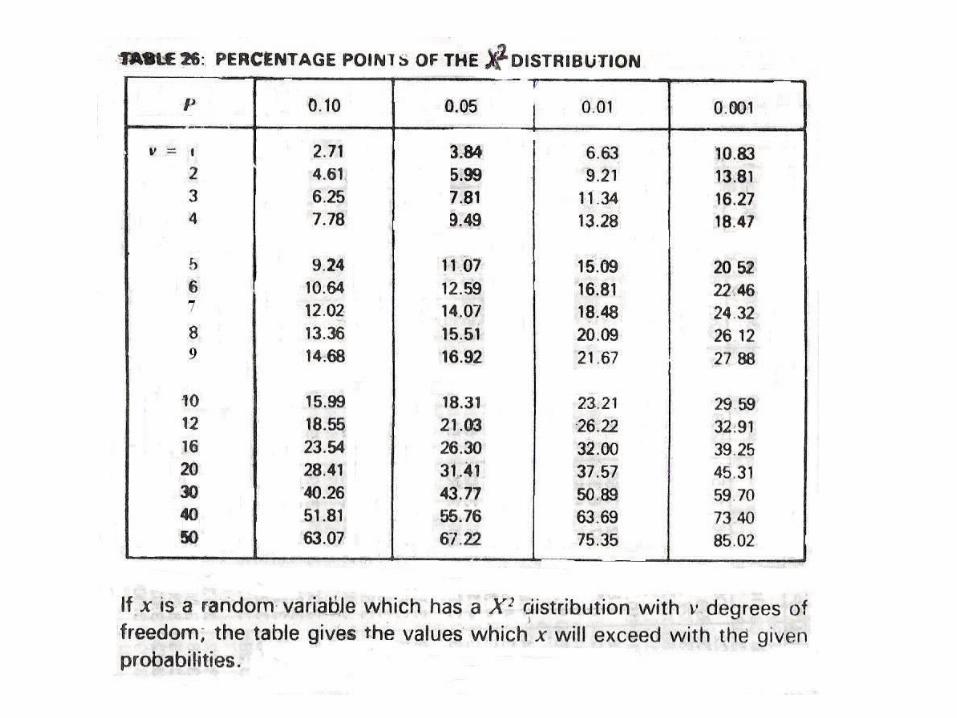
• Test for the significance of the correlation coefficient at 5% level of significance.
• Compute the coefficient of determination for the data and interpret your answer.
• Fit a linear regression model to estimate the number of hospitals for a given number of districts.
• Using your model, predict the number of districts in a region with 12 hospitals.