Embed Size (px)
DESCRIPTION
Geografiske informasjonssystemer (GIS) SGO1910 & SGO4930 Vår 2004. Foreleser: Karen O’Brien ([email protected]) Seminarleder: Gunnar Berglund ([email protected]). Course Objectives. To provide students with a basic understanding of geographic information science; - PowerPoint PPT Presentation
Citation preview
Geografiske informasjonssystemer Geografiske informasjonssystemer (GIS)(GIS)
SGO1910 & SGO4930SGO1910 & SGO4930 Vår 2004 Vår 2004
Foreleser: Karen O’Brien ([email protected])
Seminarleder: Gunnar Berglund ([email protected])

Course ObjectivesCourse Objectives
To provide students with a basic To provide students with a basic understanding of geographic understanding of geographic information science;information science;
To provide students with practical To provide students with practical experience in using ArcGIS software;experience in using ArcGIS software;
To apply both theory and practice to To apply both theory and practice to a real research project (”Oslo a real research project (”Oslo project”).project”).
Readings:Readings:
Longley, P. A., Goodchild, M. F., Maguire, Longley, P. A., Goodchild, M. F., Maguire, D. J., and D. W. Rhind. 2001. D. J., and D. W. Rhind. 2001. Geographic Geographic Information Systems and ScienceInformation Systems and Science. . Chichester: John Wiley and Sons, 454 pp.Chichester: John Wiley and Sons, 454 pp.
Reading for Oslo Project:Reading for Oslo Project:
Wessels, T. 2001. Losing control? Inequality and Social Divisions in Wessels, T. 2001. Losing control? Inequality and Social Divisions in Oslo. European Planning Studies, 9, 7, 889-906. Oslo. European Planning Studies, 9, 7, 889-906.
Wessels, T. 2000. Social polarisation and socio-economic Wessels, T. 2000. Social polarisation and socio-economic segregation in a welfare state: the case of Oslo. Urban Studies, 33, segregation in a welfare state: the case of Oslo. Urban Studies, 33, 11, 1947-1967. 11, 1947-1967.
GradingGrading
30% Six laboratory assignments (5 30% Six laboratory assignments (5 points each)points each)
20% Two mid-term quizzes (10 20% Two mid-term quizzes (10 points each) (Uke 6 & Uke 10) points each) (Uke 6 & Uke 10)
25% Final Project (25 points)25% Final Project (25 points) 25% Final Exam (25 points)25% Final Exam (25 points)
Lab AssignmentsLab Assignments
Submitted on your own home pageSubmitted on your own home page Due dates: two weeks after each labDue dates: two weeks after each lab Criteria for evaluation will be Criteria for evaluation will be
provided with each labprovided with each lab
GIS Labs GIS Labs
ArcGIS 8.0 (GIS)ArcGIS 8.0 (GIS) Excel (data base files)Excel (data base files) Hot Metal (web pages)Hot Metal (web pages) Adobe Photoshop (sizing maps and Adobe Photoshop (sizing maps and
pictures)pictures) WinZip (decompressing files)WinZip (decompressing files)

Mid-term quizzesMid-term quizzes
Each quiz worth 10 pointsEach quiz worth 10 points Multiple choice, true-false questions Multiple choice, true-false questions
based on readings and lecturesbased on readings and lectures 45 minutes to complete the quiz45 minutes to complete the quiz
ProjectProject
Identify a problem or question to address Identify a problem or question to address related to Oslo;related to Oslo;
Collect and edit data (including new data Collect and edit data (including new data with a GPS);with a GPS);
Use GIS to map and analyze data;Use GIS to map and analyze data; Present results.Present results.
Due: May 3rd, 2004Due: May 3rd, 2004
Final ExamFinal Exam
28. mai kl. 09:00 (3 timer) 28. mai kl. 09:00 (3 timer) Essays, short answer, multiple Essays, short answer, multiple
choice, true-falsechoice, true-false Based on lectures, readings, and labsBased on lectures, readings, and labs

Masters StudentsMasters Students a brief review of two academic articles that use a brief review of two academic articles that use
GIS in relation to the student’s field of interest GIS in relation to the student’s field of interest (urban geography, development geography, (urban geography, development geography, political geography, etc.);political geography, etc.);
a discussion of potential ways that GIS can a discussion of potential ways that GIS can contribute to their masters thesis (e.g., contribute to their masters thesis (e.g., mapping, analysis, etc.);mapping, analysis, etc.);
identification of data sources related to their identification of data sources related to their thesis (this can be general if no thesis topic has thesis (this can be general if no thesis topic has been chosen);been chosen);
an outline of the steps that need to be taken to an outline of the steps that need to be taken to use GIS in the thesis (for example, an outline of use GIS in the thesis (for example, an outline of the steps involved in making a map of Ghana the steps involved in making a map of Ghana showing population density and road networks).showing population density and road networks).

QuestionsQuestions
My office hours: Tuesdays, 9.30 – My office hours: Tuesdays, 9.30 – 11.00 (Room 321)11.00 (Room 321)
(or by appointment, at CICERO)(or by appointment, at CICERO) Lab assistance: Thursdays, 9.30 – Lab assistance: Thursdays, 9.30 –
11.0011.00

Why take this course?Why take this course?
GIS is a useful tool with a wide range GIS is a useful tool with a wide range of applications;of applications;
GIS is a skill that is in demand, with a GIS is a skill that is in demand, with a growing market;growing market;
Geographers have numerous Geographers have numerous advantages related to GIS;advantages related to GIS;
GIS is challenging (but fun!) GIS is challenging (but fun!)


What is a GIS?What is a GIS?
1.1. A computer system capable of holding A computer system capable of holding and using data describing places on the and using data describing places on the earth’s surface.earth’s surface.
2.2. An organized collection of computer An organized collection of computer hardware, software, geographic data, hardware, software, geographic data, and personnel designed to efficiently and personnel designed to efficiently capture, store, update manipulate, capture, store, update manipulate, analyze, and display all forms of analyze, and display all forms of geographically referenced information.geographically referenced information.
Geographic Information SystemGeographic Information System
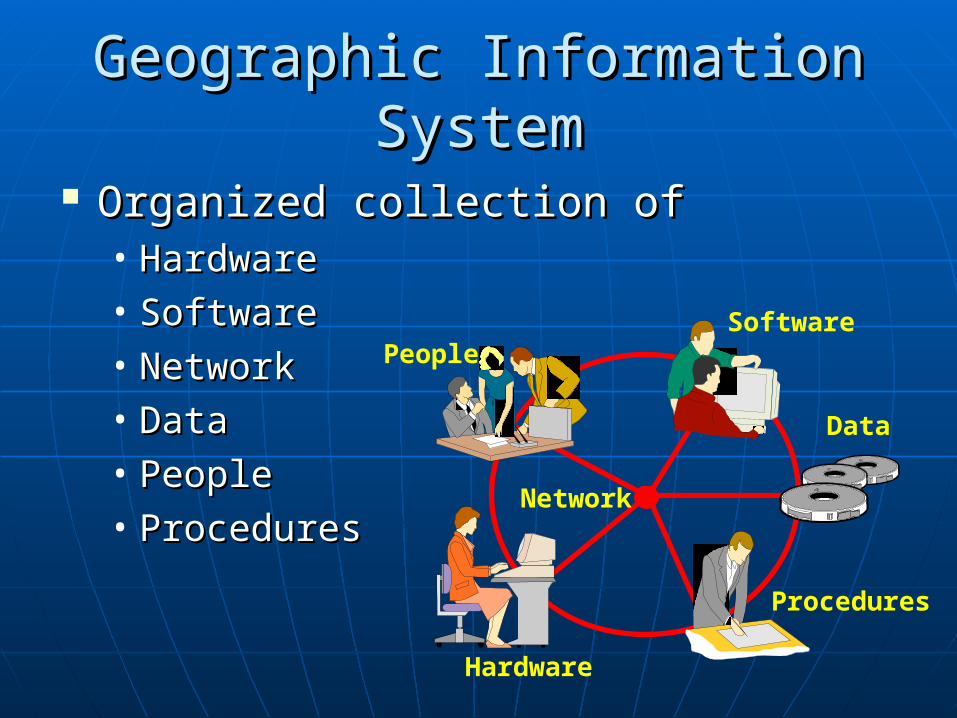
Organized collection ofOrganized collection of• HardwareHardware• SoftwareSoftware• NetworkNetwork• DataData• PeoplePeople• ProceduresProcedures
PeopleSoftware
Data
Procedures
Hardware
Network
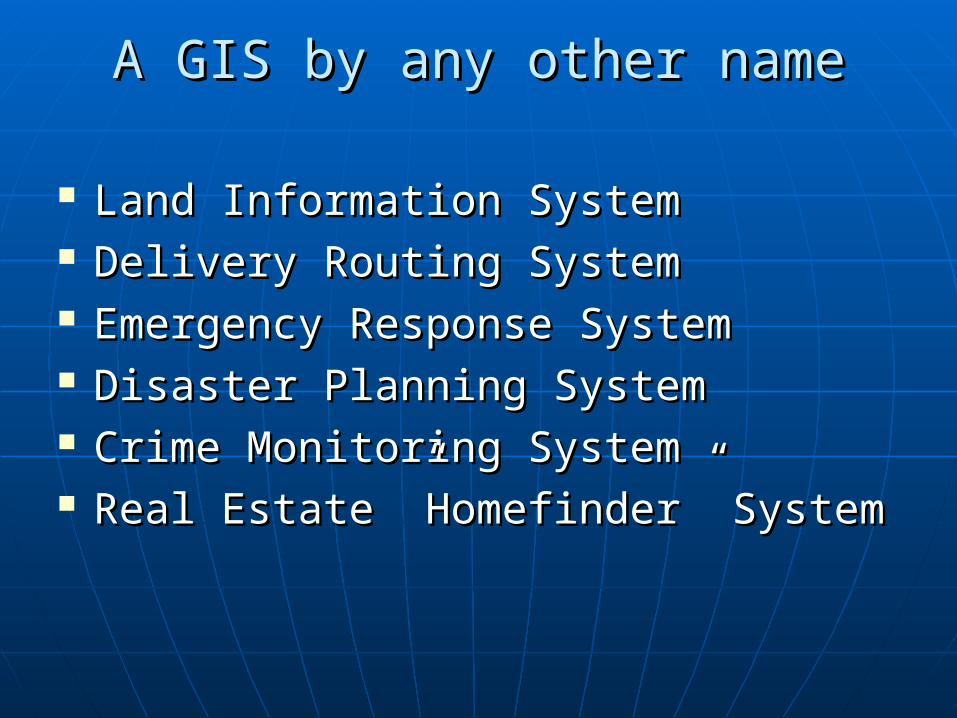
””A GIS by any other name”A GIS by any other name”
Land Information SystemLand Information System Delivery Routing SystemDelivery Routing System Emergency Response SystemEmergency Response System Disaster Planning SystemDisaster Planning System Crime Monitoring SystemCrime Monitoring System Real Estate ”Homefinder” SystemReal Estate ”Homefinder” System


Why is GIS Important?Why is GIS Important?
Provides a consistent framework for Provides a consistent framework for integrating spatial and other kinds of integrating spatial and other kinds of information within a single system (ideal information within a single system (ideal for interdisciplinary work).for interdisciplinary work).
Permits manipulation and display of Permits manipulation and display of geographical (digital) data in new ways.geographical (digital) data in new ways.
Makes connections between activities Makes connections between activities based on geographic location.based on geographic location.

What can a GIS do?What can a GIS do?
Location (Where is it...)Location (Where is it...) Condition (What is it...)Condition (What is it...) Trend (What has changed...)Trend (What has changed...) Pattern (What is the pattern...)Pattern (What is the pattern...) Routing (Which is the ’best’ way ...)Routing (Which is the ’best’ way ...) Modeling (What if...)Modeling (What if...)
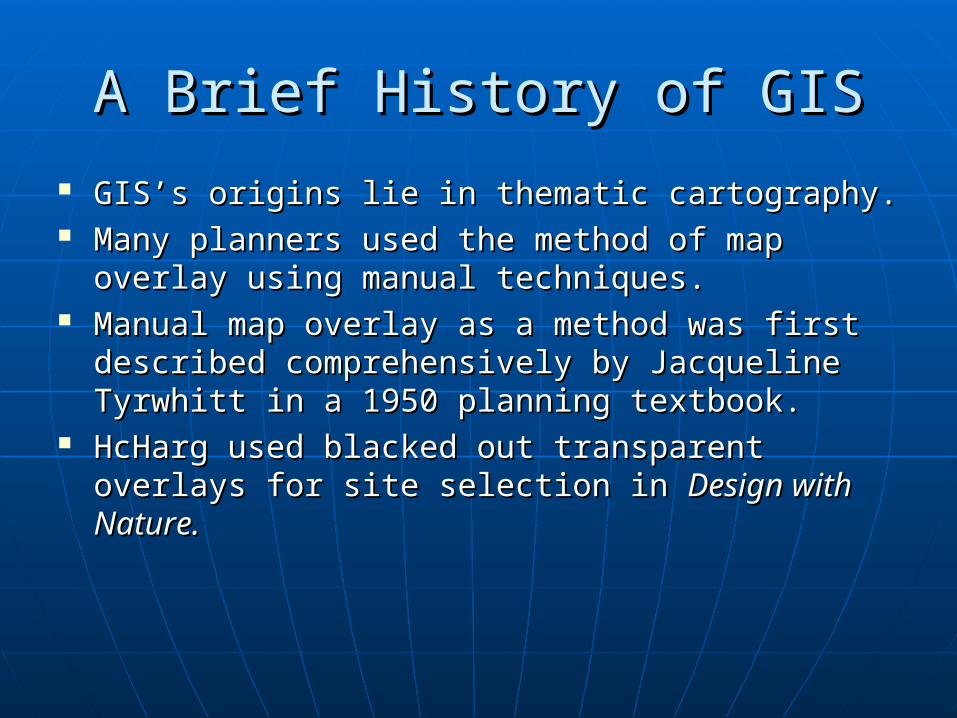
A Brief History of GISA Brief History of GIS
GIS’s origins lie in thematic cartography. GIS’s origins lie in thematic cartography. Many planners used the method of map overlay Many planners used the method of map overlay
using manual techniques. using manual techniques. Manual map overlay as a method was first Manual map overlay as a method was first
described comprehensively by Jacqueline Tyrwhitt described comprehensively by Jacqueline Tyrwhitt in a 1950 planning textbook. in a 1950 planning textbook.
HcHarg used blacked out transparent overlays for HcHarg used blacked out transparent overlays for site selection in site selection in Design with Nature.Design with Nature.

Map OverlayMap Overlay
Figure 1.3 Map overlay as presented in Design with Nature by Ian McHarg. Each transparent layer map“blacked out” areas excluded as unsuitable locations.
SOILS
PARKS
URBAN
SOLUTION MASK
FOREST
A Brief History of GIS (cont.)A Brief History of GIS (cont.)
The 1960s saw many new forms of geographic The 1960s saw many new forms of geographic data and mapping software. data and mapping software.
Computer cartography developed the first basic Computer cartography developed the first basic GIS concepts during the late 1950s and 1960s. GIS concepts during the late 1950s and 1960s.
Linked software modules, rather than stand-alone Linked software modules, rather than stand-alone programs, preceded GISs. programs, preceded GISs.
The Harvard University ODYSSEY system was The Harvard University ODYSSEY system was influential due to its topological arc-node (vector) influential due to its topological arc-node (vector) data structure. data structure.
A Brief History of GIS (cont.)A Brief History of GIS (cont.) GIS was significantly altered by (1) the PC and GIS was significantly altered by (1) the PC and
(2) the workstation. (2) the workstation. During the 1980s, new GIS software could better During the 1980s, new GIS software could better
exploit more advanced hardware. exploit more advanced hardware. User Interface developments led to GIS's vastly User Interface developments led to GIS's vastly
improved ease of use during the 1990s. improved ease of use during the 1990s. During the 1990s, new GIS software could better During the 1990s, new GIS software could better
exploit more advanced hardware.exploit more advanced hardware. So far in the 2000s:So far in the 2000s:
• Internet becomes major deliver vehicle for GISInternet becomes major deliver vehicle for GIS• More than 1 million active users of GISMore than 1 million active users of GIS• GIS is linking to other technologies (e.g. mobile phones, GIS is linking to other technologies (e.g. mobile phones,
palmtops, etc.)palmtops, etc.)

Interest in GIS is RisingInterest in GIS is Rising Applications via InternetApplications via Internet Price reductionsPrice reductions Greater awarenessGreater awareness Improved ease of useImproved ease of use Better technologyBetter technology Proliferation of dataProliferation of data Commercial software packagesCommercial software packages Real applicationsReal applications Proven cost:benefit casesProven cost:benefit cases
Business of GISBusiness of GIS
GIS industry is worth over $7 billionGIS industry is worth over $7 billion• SoftwareSoftware• DataData• ServicesServices• PublishingPublishing• EducationEducation
GISystems, GIScience and GIStudiesGISystems, GIScience and GIStudies
GISystemsGISystems• Emphasis on technology and toolsEmphasis on technology and tools
GIScienceGIScience• Fundamental issues raised by the use of GIS and Fundamental issues raised by the use of GIS and
related technologiesrelated technologies Spatial analysisSpatial analysis Map projectionsMap projections AccuracyAccuracy Scientific visualizationScientific visualization
GIStudiesGIStudies• Systematic study of the use of geographic Systematic study of the use of geographic
informationinformation
Sources of Information on GISSources of Information on GIS
The amount of information available about GIS The amount of information available about GIS can be overwhelming. can be overwhelming.
Sources of GIS information include journals and Sources of GIS information include journals and magazines, books, professional societies, the magazines, books, professional societies, the World Wide Web, and conferences. World Wide Web, and conferences.
GIS has Web Home pages, network conference GIS has Web Home pages, network conference groups, professional organizations, and user groups, professional organizations, and user groups. groups.
Most colleges and universities now offer GIS Most colleges and universities now offer GIS classes in geography departments.classes in geography departments.

GIS Resources: ConferencesGIS Resources: Conferences
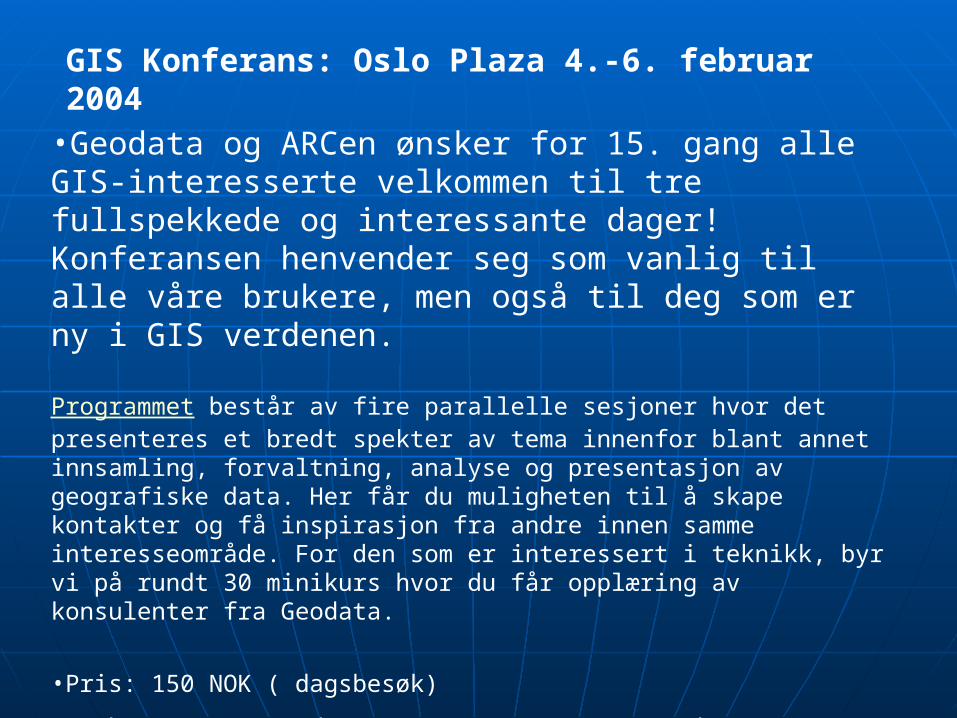
•Geodata og ARCen ønsker for 15. gang alle GIS-interesserte velkommen til tre fullspekkede og interessante dager! Konferansen henvender seg som vanlig til alle våre brukere, men også til deg som er ny i GIS verdenen.
Programmet består av fire parallelle sesjoner hvor det presenteres et bredt spekter av tema innenfor blant annet innsamling, forvaltning, analyse og presentasjon av geografiske data. Her får du muligheten til å skape kontakter og få inspirasjon fra andre innen samme interesseområde. For den som er interessert i teknikk, byr vi på rundt 30 minikurs hvor du får opplæring av konsulenter fra Geodata.
•Pris: 150 NOK ( dagsbesøk)
Se: http://www.geodata.no/custom/program2004.htm
GIS Konferans: Oslo Plaza 4.-6. februar 2004

GIS Resources: GlossiesGIS Resources: Glossies
Major GIS-Only JournalsMajor GIS-Only Journals
International Journal of Geographical International Journal of Geographical Information Systems Information Systems
Geographical SystemsGeographical Systems Transactions in GISTransactions in GIS Geo Info SystemsGeo Info Systems GIS WorldGIS World

Specialty JournalsSpecialty Journals
Business GeographicsBusiness Geographics GIS LawGIS Law GrassClippingsGrassClippings GIS Asia/PacificGIS Asia/Pacific GIS World Report/CANADAGIS World Report/CANADA GIS EuropeGIS Europe
Regular GIS PapersRegular GIS Papers
Annals of the Association of American Annals of the Association of American GeographersGeographers
CartographicaCartographica Cartography and GISCartography and GIS Computer; Computers, Environment, and Urban Computer; Computers, Environment, and Urban
SystemsSystems Computers and GeosciencesComputers and Geosciences IEEE Transactions on Computer Graphics and IEEE Transactions on Computer Graphics and
ApplicationsApplications Photogrammetric Engineering and Remote Photogrammetric Engineering and Remote
SensingSensing

Occasional GIS papersOccasional GIS papers
Cartographic PerspectivesCartographic Perspectives CartographicaCartographica Journal of CartographyJournal of Cartography Geocarto InternationalGeocarto International IEEE GeosciencesIEEE Geosciences International Journal of Remote SensingInternational Journal of Remote Sensing Landscape EcologyLandscape Ecology Remote Sensing ReviewRemote Sensing Review Mapping Science and Remote SensingMapping Science and Remote Sensing InfoworldInfoworld
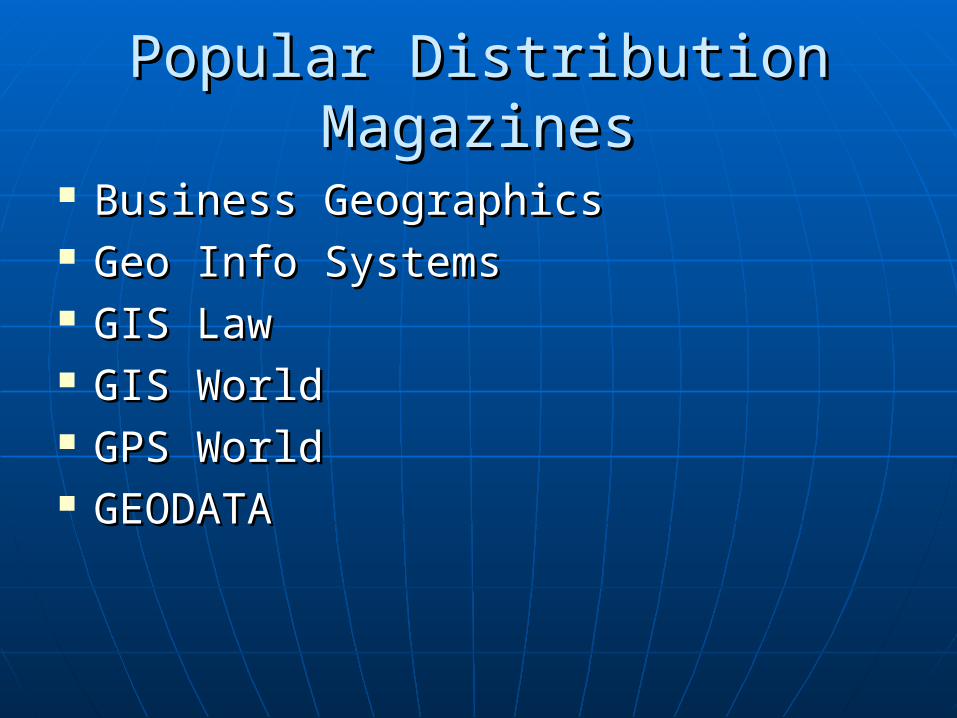
Popular Distribution MagazinesPopular Distribution Magazines
Business GeographicsBusiness Geographics Geo Info SystemsGeo Info Systems GIS LawGIS Law GIS WorldGIS World GPS WorldGPS World GEODATAGEODATA

Part II: Thinking SpatiallyPart II: Thinking Spatially
What is spatial data?What is spatial data? How can spatial data be represented How can spatial data be represented
digitally?digitally? Rasters and vector modelsRasters and vector models
Geographic problems usually involve Geographic problems usually involve locationlocation..
GIS – A special class of information GIS – A special class of information systems that keep track of events, systems that keep track of events, activities and things, but also where these activities and things, but also where these events, activities, or things happen or events, activities, or things happen or exist.exist.
The difference between GIS and basic The difference between GIS and basic mapping and spreadsheet programs lies in mapping and spreadsheet programs lies in its ability to handle spatial data.its ability to handle spatial data.

The Nature of Spatial DataThe Nature of Spatial Data
Distributed through spaceDistributed through space Can be observed or described in the Can be observed or described in the
real world and identified by real world and identified by geographical locationgeographical location
Change through space and timeChange through space and time

Spatial and non-spatial dataSpatial and non-spatial data
Crimes during 1995Date Location Type1/22 123 James St. Robbery1/24 22 Smith St. Burglary2/10 9 Elm St. #4A Assault2/13 12 Fifth Avenue Breaking
& Entering
Part No. Quant. Desc.1034161 5 Wheel spoke1051671 1 Ball bearing1047623 6 Wheel rim1021413 2 Tire1011210 3 Handlebars
Figure 1.1 Two databases. A database contains columns (attributes) and rows (records). The bicycleparts list on the left is not spatial. The parts could be located anywhere. The list of crimes on the rightis spatial because one of the at tributes, the street address, locates the crimes on a map. This list couldbe used in a GIS.

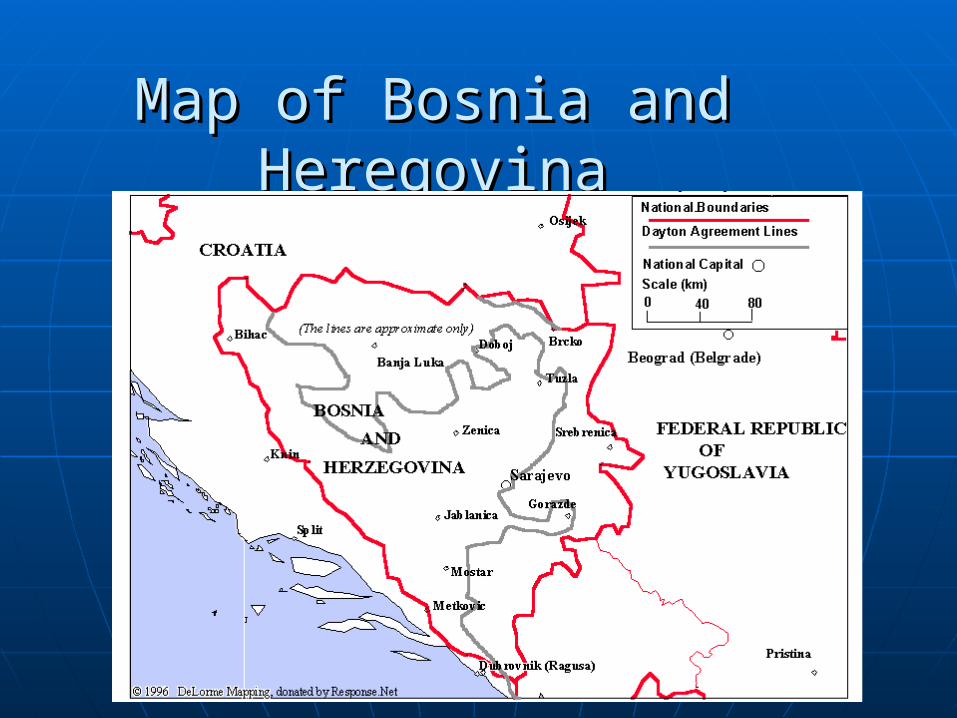
Map of Bosnia and Map of Bosnia and HeregovinaHeregovina

Spatial is SpecialSpatial is Special
Geographic – Earth’s surface and Geographic – Earth’s surface and near-surfacenear-surface
Spatial – any space (including Spatial – any space (including geographic) e.g. medical imaginggeographic) e.g. medical imaging
Geospatial – synonymous with Geospatial – synonymous with geographicgeographic
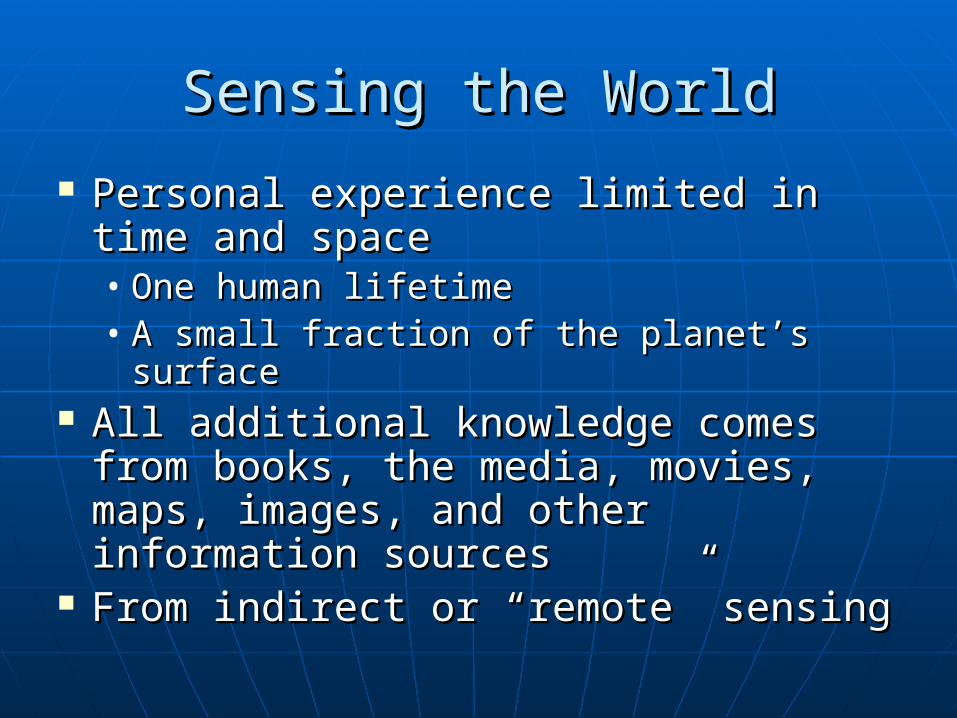
Sensing the WorldSensing the World
Personal experience limited in time Personal experience limited in time and spaceand space• One human lifetimeOne human lifetime• A small fraction of the planet’s surfaceA small fraction of the planet’s surface
All additional knowledge comes from All additional knowledge comes from books, the media, movies, maps, books, the media, movies, maps, images, and other information images, and other information sourcessources
From indirect or “remote” sensingFrom indirect or “remote” sensing
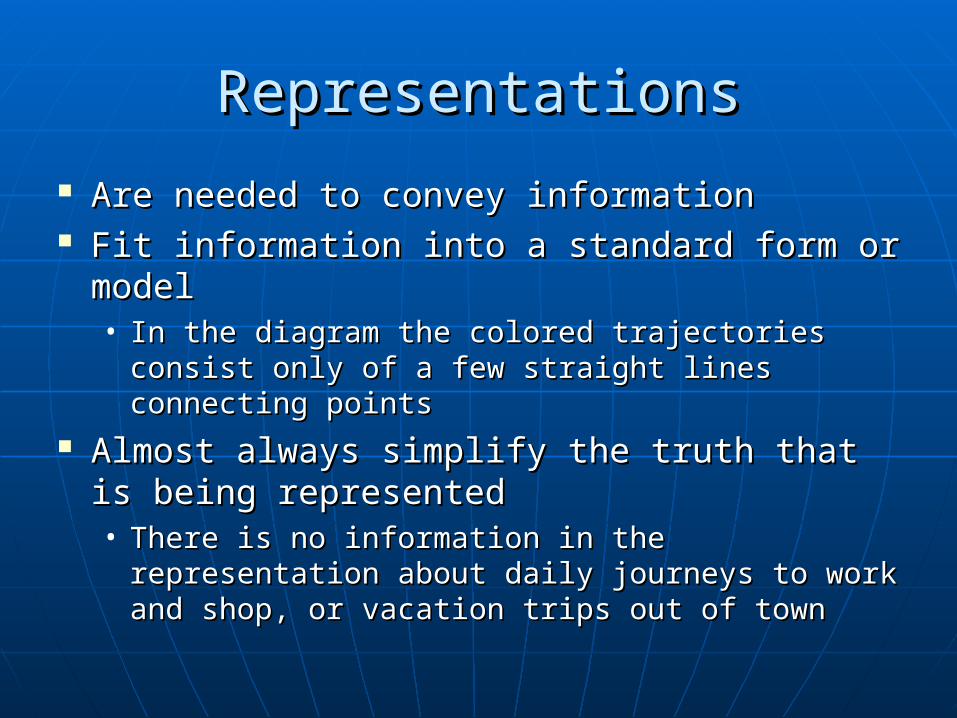
RepresentationsRepresentations
Are needed to convey informationAre needed to convey information Fit information into a standard form or Fit information into a standard form or
modelmodel• In the diagram the colored trajectories consist In the diagram the colored trajectories consist
only of a few straight lines connecting pointsonly of a few straight lines connecting points Almost always simplify the truth that is Almost always simplify the truth that is
being representedbeing represented• There is no information in the representation There is no information in the representation
about daily journeys to work and shop, or about daily journeys to work and shop, or vacation trips out of townvacation trips out of town
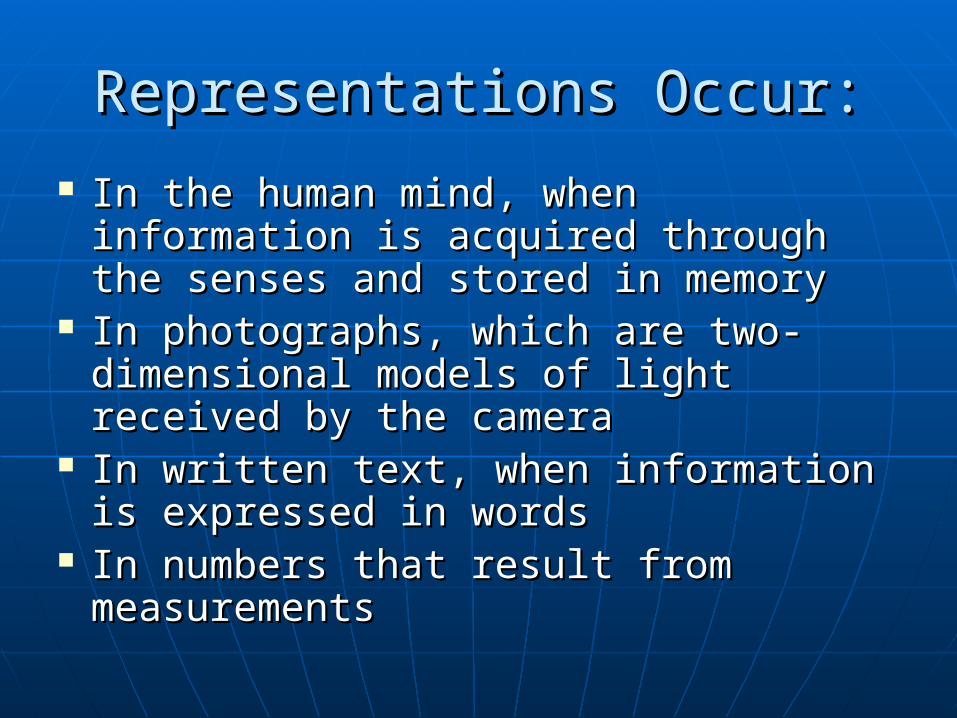
Representations Occur:Representations Occur:
In the human mind, when information In the human mind, when information is acquired through the senses and is acquired through the senses and stored in memorystored in memory
In photographs, which are two-In photographs, which are two-dimensional models of light received dimensional models of light received by the cameraby the camera
In written text, when information is In written text, when information is expressed in wordsexpressed in words
In numbers that result from In numbers that result from measurementsmeasurements
Digital RepresentationDigital Representation
Uses only two symbols, 0 and 1, to Uses only two symbols, 0 and 1, to represent information (e.g., 1111 = 15)represent information (e.g., 1111 = 15)
The basis of almost all modern human The basis of almost all modern human communicationcommunication
Many standards allow various types of Many standards allow various types of information to be expressed in digital forminformation to be expressed in digital form• MP3 for musicMP3 for music• JPEG for imagesJPEG for images• ASCII for textASCII for text• GIS relies on standards for geographic dataGIS relies on standards for geographic data
Why Digital?Why Digital?
Economies of scaleEconomies of scale• One type of information technology for One type of information technology for
all types of informationall types of information SimplicitySimplicity ReliabilityReliability
• Systems can be designed to correct Systems can be designed to correct errorserrors
Easily copied and transmittedEasily copied and transmitted• At close to the speed of lightAt close to the speed of light

Accuracy of RepresentationsAccuracy of Representations
Representations can rarely be Representations can rarely be perfectperfect• Details can be irrelevant, or too Details can be irrelevant, or too
expensive and voluminous to recordexpensive and voluminous to record It’s important to know what is It’s important to know what is
missing in a representationmissing in a representation• Representations can leave us uncertain Representations can leave us uncertain
about the real worldabout the real world
The Fundamental ProblemThe Fundamental Problem
Geographic information links a place, and Geographic information links a place, and often a time, with some property of that often a time, with some property of that place (and time)place (and time)• ““The temperature at 34 N, 120 W at noon local The temperature at 34 N, 120 W at noon local
time on 12/2/99 was 18 Celsius”time on 12/2/99 was 18 Celsius” The potential number of properties is vastThe potential number of properties is vast
• In GIS we term them In GIS we term them attributesattributes• Attributes can be physical, social, economic, Attributes can be physical, social, economic,
demographic, environmental, etc.demographic, environmental, etc.

The Fundamental Problem (cont.)The Fundamental Problem (cont.)
The number of places and times is also The number of places and times is also vastvast• Potentially infinitePotentially infinite
The more closely we look at the world, the The more closely we look at the world, the more detail it revealsmore detail it reveals• Potentially Potentially ad infinitumad infinitum• The geographic world is infinitely complexThe geographic world is infinitely complex
Humans have found ingenious ways of Humans have found ingenious ways of dealing with this problemdealing with this problem• Many methods are used in GIS to create Many methods are used in GIS to create
representations or representations or data modelsdata models

Discrete Objects and FieldsDiscrete Objects and Fields
Two ways of conceptualizing or Two ways of conceptualizing or modeling geographic variationmodeling geographic variation
The most fundamental distinction in The most fundamental distinction in geographic representationgeographic representation

Discrete ObjectsDiscrete Objects
Points, lines, and areasPoints, lines, and areas CountableCountable Persistent through time, perhaps Persistent through time, perhaps
mobilemobile Biological organismsBiological organisms
• Animals, treesAnimals, trees Human-made objectsHuman-made objects
• Vehicles, houses, fire hydrantsVehicles, houses, fire hydrants
FieldsFields
Properties that vary continuously over Properties that vary continuously over spacespace• Value is a function of locationValue is a function of location• Property can be of any attribute type, including Property can be of any attribute type, including
directiondirection Elevation as the archetypeElevation as the archetype
• A single value at every point on the Earth’s A single value at every point on the Earth’s surfacesurface
• The source of metaphor and languageThe source of metaphor and language Any field can have slope, gradient, peaks, pitsAny field can have slope, gradient, peaks, pits

Examples of FieldsExamples of Fields
Soil properties, e.g. pH, soil moistureSoil properties, e.g. pH, soil moisture Population densityPopulation density
• But at fine enough scale the concept breaks But at fine enough scale the concept breaks downdown
Identity of land ownerIdentity of land owner• A single value of a nominal property at any A single value of a nominal property at any
pointpoint Name of county or state or nationName of county or state or nation Atmospheric temperature, pressureAtmospheric temperature, pressure
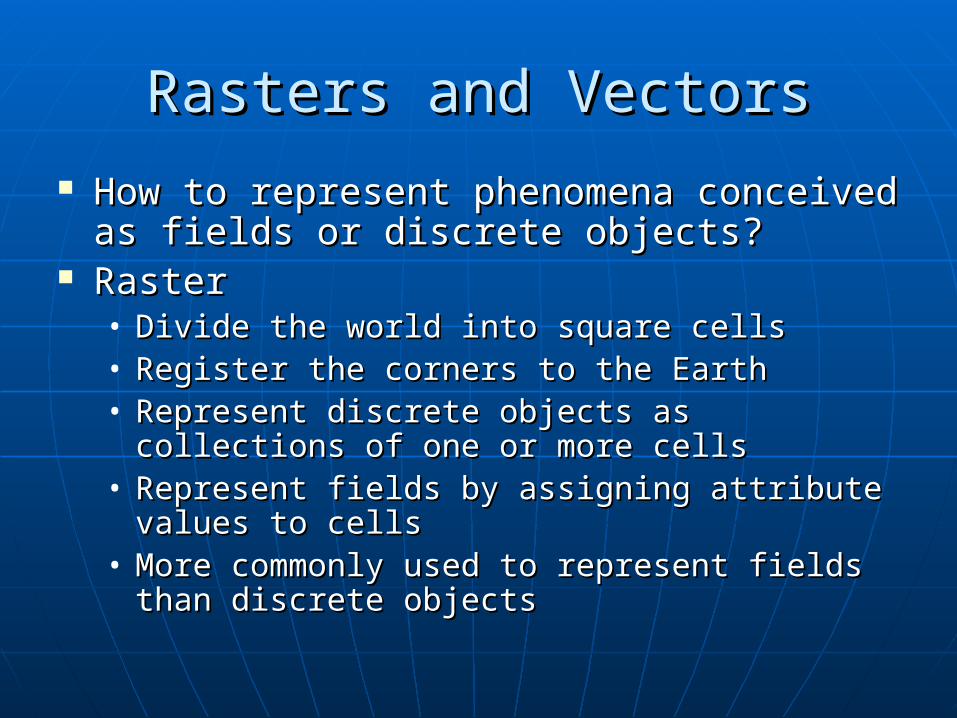
Rasters and VectorsRasters and Vectors
How to represent phenomena conceived How to represent phenomena conceived as fields or discrete objects?as fields or discrete objects?
RasterRaster• Divide the world into square cellsDivide the world into square cells• Register the corners to the EarthRegister the corners to the Earth• Represent discrete objects as collections of one Represent discrete objects as collections of one
or more cellsor more cells• Represent fields by assigning attribute values Represent fields by assigning attribute values
to cellsto cells• More commonly used to represent fields than More commonly used to represent fields than
discrete objectsdiscrete objects
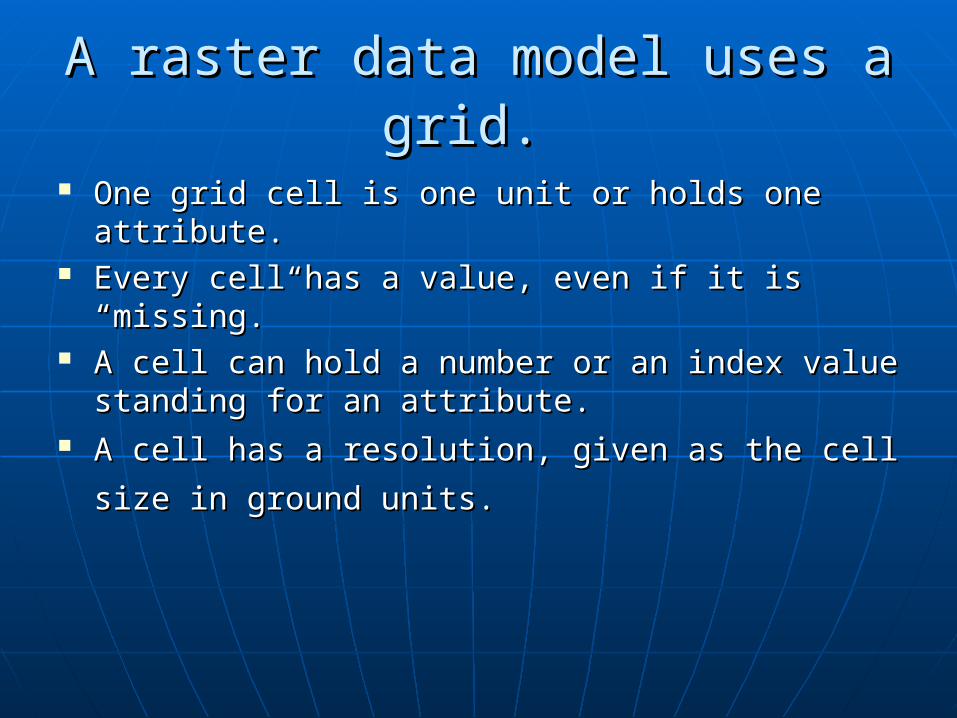
A raster data model uses a grid.A raster data model uses a grid.
One grid cell is one unit or holds one attribute. One grid cell is one unit or holds one attribute. Every cell has a value, even if it is “missing.” Every cell has a value, even if it is “missing.” A cell can hold a number or an index value A cell can hold a number or an index value
standing for an attribute.standing for an attribute. A cell has a resolution, given as the cell size in A cell has a resolution, given as the cell size in
ground units.ground units.

Generic structure for a grid Generic structure for a grid
Figure 3.1 Generic structure for a grid.
Row
s
Columns
Gridcell
Grid extent
Resolution

Legend
Mixed conifer
Douglas fir
Oak savannah
Grassland
Raster representation. Each color represents a different value of a nominal-
scale field denoting land cover class.
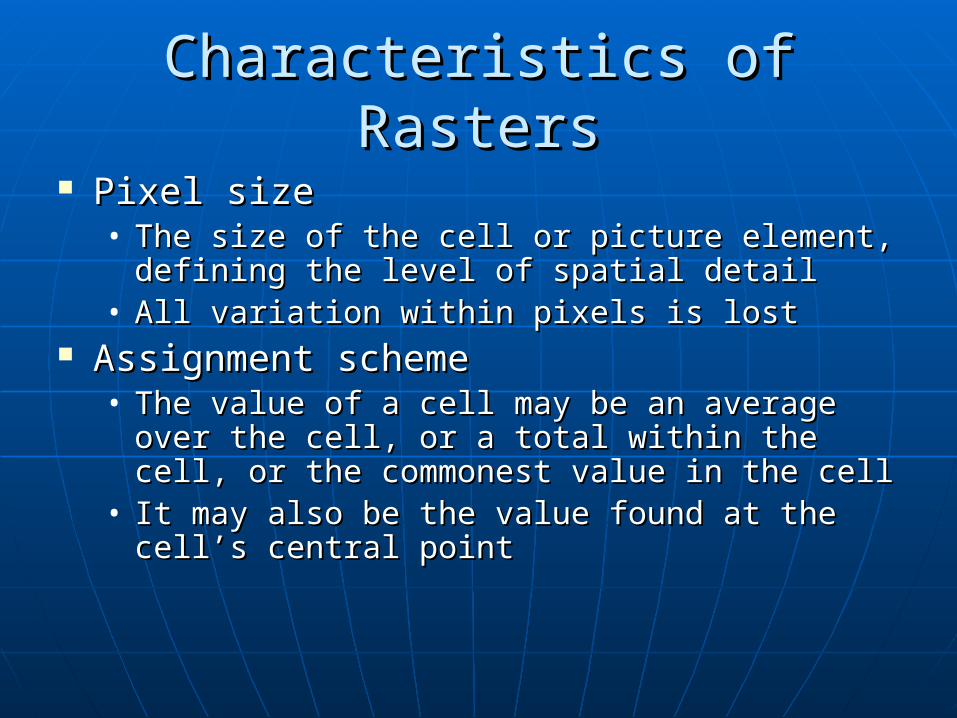
Characteristics of RastersCharacteristics of Rasters
Pixel sizePixel size• The size of the cell or picture element, defining The size of the cell or picture element, defining
the level of spatial detailthe level of spatial detail• All variation within pixels is lostAll variation within pixels is lost
Assignment schemeAssignment scheme• The value of a cell may be an average over the The value of a cell may be an average over the
cell, or a total within the cell, or the cell, or a total within the cell, or the commonest value in the cellcommonest value in the cell
• It may also be the value found at the cell’s It may also be the value found at the cell’s central pointcentral point
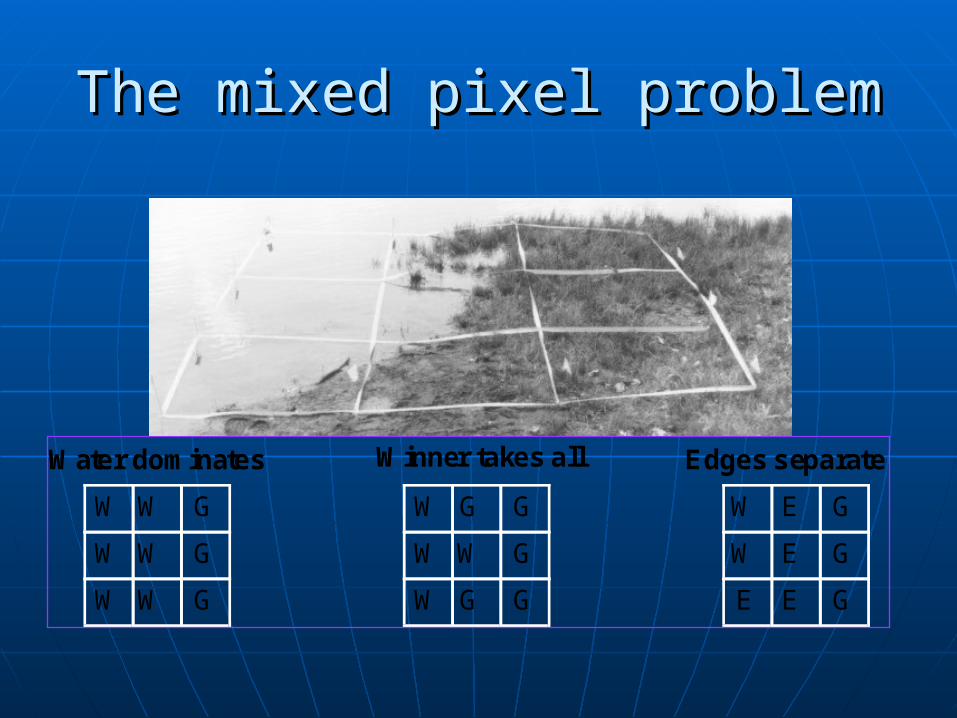
The mixed pixel problemThe mixed pixel problem
W GW
W W G
W W G
W GG
W W G
W G G
W GE
W E G
E E G
Water dominates Winner takes all Edges separate
Vector DataVector Data
Used to represent points, lines, and areasUsed to represent points, lines, and areas All are represented using coordinatesAll are represented using coordinates
• One per pointOne per point• Areas as polygonsAreas as polygons
Straight lines between points, connecting back to the Straight lines between points, connecting back to the startstart
Point locations recorded as coordinatesPoint locations recorded as coordinates
• Lines as Lines as polylinespolylines Straight lines between pointsStraight lines between points

The Vector ModelThe Vector Model
A vector data model uses points stored by their A vector data model uses points stored by their real (earth) coordinates. real (earth) coordinates.
Lines and areas are built from sequences of Lines and areas are built from sequences of points in order. points in order.
Lines have a direction to the ordering of the Lines have a direction to the ordering of the points. points.
Polygons can be built from points or lines. Polygons can be built from points or lines.
Vectors can store information about topology.Vectors can store information about topology.
Raster vs VectorRaster vs Vector
Volume of dataVolume of data• Raster becomes more voluminous as cell size Raster becomes more voluminous as cell size
decreasesdecreases Source of dataSource of data
• Remote sensing, elevation data come in raster Remote sensing, elevation data come in raster formform
• Vector favored for administrative dataVector favored for administrative data SoftwareSoftware
• Some GIS better suited to raster, some to Some GIS better suited to raster, some to vectorvector

Building complex featuresBuilding complex features
Simple geographic features can be Simple geographic features can be used to build more complex ones. used to build more complex ones.
Areas are made up of lines which are Areas are made up of lines which are made up of points represented by made up of points represented by their coordinates.their coordinates.
Areas = {Lines} = {Points}Areas = {Lines} = {Points}

Areas are lines are points are coordinatesAreas are lines are points are coordinates
Properties of FeaturesProperties of Features size size distributiondistribution patternpattern contiguitycontiguity neighborhoodneighborhood shapeshape scalescale orientation.orientation.
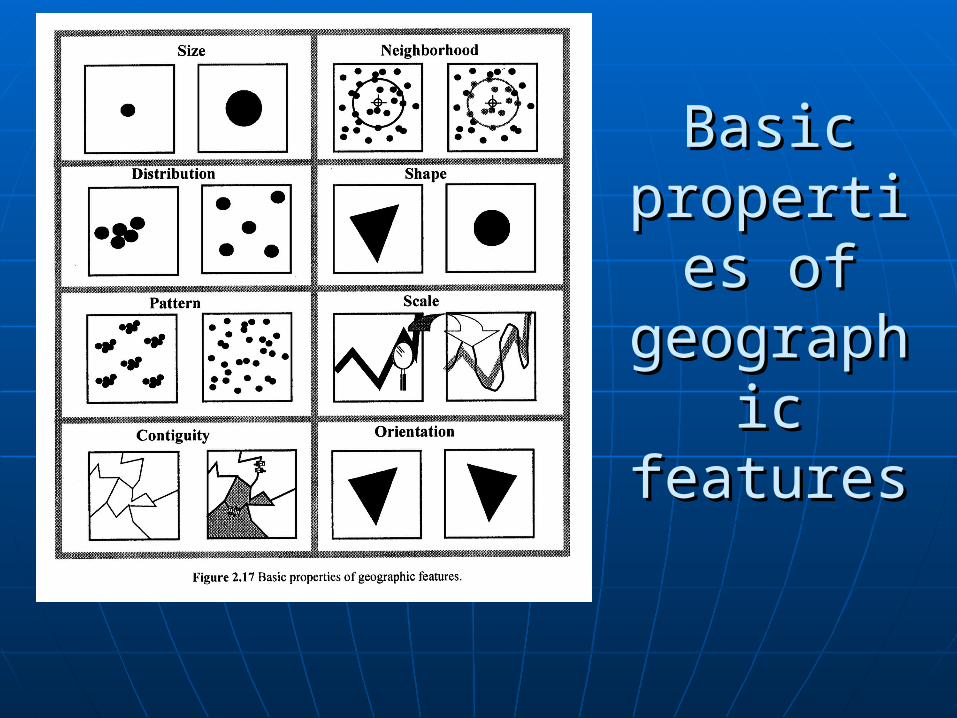
Basic Basic properties properties
of of geographic geographic
featuresfeatures