Embed Size (px)
Citation preview

Geographic Accuracy of Cell Phone RDD Sample Selected
by Area Code versus Wire Center
Xian Tao1, Benjamin Skalland
1, David Yankey
2, Jenny Jeyarajah
2,
Phil Smith2, Meena Khare
3
1NORC at the University of Chicago
2National Center for Immunization and Respiratory Diseases
3National Center for Health Statistics
Abstract1
The assignment of geographic location to cell phone numbers in RDD cell phone sample
frames is often inaccurate. This inaccuracy can potentially lead to increased cost and bias
for area-specific telephone surveys and increase variance for national telephone surveys
with area stratification (Skalland and Khare, 2013). The assignment of a cell phone
number to a geographic location in the construction of the sample frame can be based on
the area code of the phone number, location of the wire-center associated with the phone
number, or rate center associated with the phone number. In this paper, we compare state
and local-area geographic accuracy rates of cell phone numbers assigned to a geographic
location based on the area code of the phone number versus the wire center associated
with the phone number using data from the National Immunization Survey (NIS), a dual-
frame RDD survey sponsored by the Centers for Disease Control and Prevention and
fielded by NORC at the University of Chicago. Reported geography from NIS survey
respondents is compared to geographic information from the cell phone sample frame and
accuracy rates associated with geographic classification assessed. In addition, we present
differences in demographic distributions between survey respondents with accurate
geographic classification and respondents with inaccurate geographic classification for
both the area code and the wire center approaches.
Keywords: Cell phone sampling, Geographic accuracy, National Immunization Survey
1. Introduction
In recent years, cell phone use increased. By the second half of 2012, nearly two in every
five American homes (38.2%) had wireless service only (Blumberg et al. 2013). The
increased use of cell phones has required researchers to modify telephone survey
practices and methods, especially when geographic accuracy is required. Differences in
the construction of cell phone and landline sample frames have important implications for
the accuracy of geographic stratification in cell phone samples relative to landline
samples. Since landline phone numbers are usually wired to a particular fixed location,
the geographic information associated with them is relatively accurate. However, cell
phone numbers are not wired to a fixed location and may not be associated with accurate
1 The findings and conclusions in this paper are those of the authors and do not necessarily
represent the views of the National Center for Health Statistics, Centers for Disease Control and
Prevention, or NORC at the University of Chicago.
AAPOR2013
4494

geographic information. Individuals can purchase their cell phone from a different
location than where they reside and move from one geographic location to another
without changing their original cell phone number. The inaccurate geographic
information associated with cell phone numbers may lead to increased cost and bias for
area-specific telephone surveys and increased variance for national telephone surveys
with area stratification (Skalland and Khare, 2013). Improving the geographic accuracy
of cell phone samples is becoming more and more critical in terms of increasing cost-
efficiency, measuring/mitigating survey bias for area-specific surveys, and reducing
variance for national surveys with area stratification.
The assignment of a cell phone number to a particular geographic area when constructing
a cell phone sampling frame can be based on the area code of the phone number, the wire
center associated with the phone number, or the rate center2 associated with the phone
number. At the time of service initiation, each cell phone number is assigned to a
particular wire center. Wire centers contain one or more physical structures (known
interchangeably as central office, switch center, or wire center) that contain the switching
and routing hardware for the U.S. telephony network. The wire center associated with a
cell phone number is based on which wire center would have been associated if landline
telephone service had been initiated at the same location. Each cell phone number can
then be assigned to the county containing that wire center and a cell phone sampling
frame for a particular geographic area can be built in this way. The geographic location of
the area code can also link a phone number to a particular state or sub-state area, and a
cell phone sampling frame can be based on the area code of the cell phone number. These
two methods will result in different cell phone sampling frames for the same area, and
these frames can have different levels of geographic accuracy. Skalland and Khare (2013)
estimated that 11.5 percent of U.S. adults living in cell phone-only households reside in a
state that differs from their sampling state based on the area code. Christian et al. (2009)
estimated that about 10 percent of cell phone adults and 12 percent of cell phone-only
adults reside in a state that differs from the state associated with the cell phone number.
They also estimated that about 41 percent of cell phone adults and 43 percent of cell
phone-only adults reside in a county that differs from the county associated with the cell
phone number, although it is not clear what method they used to assign the cell-phone
numbers to counties.
In this paper, we compared state and local-area geographic accuracy of cell phone
numbers assigned to geographic location based on the area code versus the wire center
using data collected from Quarter 3, 2011 through Quarter 2, 2012, for the National
Immunization Survey (NIS), a dual-frame RDD survey sponsored by the Centers for
Disease Control and Prevention and fielded by NORC at the University of Chicago. In
addition, we compared estimates of demographic differences between respondents with
accurate and inaccurate geographic assignment, first with the assignment based on the
area code and then with the assignment based on the wire center.
2 “Rate Center” denotes a specific geographical area used for defining the local calling area and
for determining mileage measurements for billing purposes. Rate Centers are also known as
billing centers. Each thousand-block (NPA-NXX-Y) of cell phone numbers can be associated
with a single Rate Center.
AAPOR2013
4495

2. Methods
For a particular state3 or sub-state area, the accuracy or agreement between the area
assigned to the cell phone number at the time of sampling and the reported location of
residence of the user of that cell phone number can be measured in several ways. In this
paper, we use the term “accuracy” to refer to the correct assignment of a cell phone
number to a specific geography in the development of a cell phone sampling frame as
compared to reported geography by survey respondents. The term “inaccuracy” means
that a respondent’s self-reported geography differs from the geography of the
respondent’s sampling stratum. From a sampling perspective, “inaccuracy” is geographic
misclassification of the respondent. Positive predicted value rate (PPV rate), negative
predicted value rate (NPV rate), sensitivity rate, and specificity rate are the terms often
used in signal detection and in epidemiology for assessing the performance of a binary
classification test. These rates can also be applied to measure the accuracy of the
geographic assignment of cell phone samples. The PPV rate is defined as the proportion
that resides in the target area among all the respondents sampled from the target area’s
sampling frame based on the respondent-reported area of residence. This can be thought
of as the incidence rate for a sample selected for a particular area. The NPV rate is
defined as the proportion that reportedly resides outside of the target area among all the
respondents sampled outside of the target area’s sampling frame. The sensitivity rate is
defined as the proportion that appears on the target area’s sampling frame of all the
respondents reportedly residing in the target area. This is the proportion of residents of
the area that are covered by the area’s sampling frame. The specificity rate is defined as
the proportion that is correctly classified outside of the target area’s sampling frame
among all the respondents residing outside of the target area. Table 1 shows the
relationship among the four rates.
A sample drawn from a perfectly accurate sampling frame would have a 100% PPV rate,
a 100% NPV rate, a 100% sensitivity rate, and a 100% specificity rate. However, due to
the wireless attribution and mobility of cell phones, the geographic information
associated with the cell phone number is not as accurate as the information for landline
phones, especially when the target geography is small, such as at the county or city level.
We compared PPV, NPV, sensitivity, and specificity rates based on two methods for
constructing the cell phone sampling frame: the area code method versus the wire center
method. These comparisons were made both at the state level and at the sub-state level
targeted by the NIS.
We also compared the characteristics of respondents inaccurately classified to their state
of residence to those respondents with accurate classification to their state of residence,
based on the area code method versus the wire center method. Using a Chi-square test of
independence at the 0.05 significance level, we tested whether demographic differences
between respondents with accurate geographic classification were statistically significant
from respondents with inaccurate geographic classification. The Chi-square test was
applied independently for both the wire center and the area code methods and for both
methods we found statistically significant differences between the demographic
distributions of respondents with accurate geographic classification and those with
inaccurate geographic classification.
3 All states refer to the 50 states and the District of Columbia.
AAPOR2013
4496

The NIS offers a very robust dataset to assess the geographic accuracy of cell phone
RDD sampling by the area code and the wire center approaches since it is designed as a
representative state and local area RDD dual-frame landline and cell phone sample
covering all states in the United States. We used data from Quarter 3, 2011 through
Quarter 2, 2012 of the NIS for our analysis. The survey target population was households
with children 19-35 months. The sample was stratified at the state level and for ten sub-
state areas in New York, Pennsylvania, Illinois, and Texas. A total of 8,299 cell phone
sample household interviews were completed over this time period and used in our
analysis.
3. Results
The estimated state level PPV rates, NPV rates, sensitivity rates, and specificity rates
based on the area code method versus those based on the wire center method are
presented in Table 2 for Q3, 2011 through Q2, 2012. The same four rates for the ten sub-
state sampled areas in the NIS for the same time period are presented in Table 3.
Differences in PPV rates between the two methods varied from state to state, with
differences ranging from -3.7 percentage points to 36.2 percentage points. Construction
of the cell phone frame based on the area code produced a higher PPV rate than that
based on the wire center in 21 states and 9 sub-state local areas; in eight states, the PPV
rate was more than 5 percentage points higher based on the area code method, and in five
states it was more than 10 percentage points higher. Twenty-nine states had the same
PPV rates using the two methods. Only one state had a slightly lower PPV rate based on
the area code method than based on the wire center method. At the state level, NPV rates
were similar for the two methods, with nearly all greater than 99%. At the sub-state local
area level, NPV rates were also similar for the two methods and all were greater than
96%.
In addition to higher PPV rates, the area code method also tended to produce a higher
sensitivity rate than the wire center method both at the state and sub-state levels.
Seventeen states had higher sensitivity rates based on the area code method than based on
the wire center method; the sensitivity rate was more than 5 percentage points higher
using the area code method in eight states, and was more than 10 percentage points
higher in four states. Thirty-two states had the same sensitivity rates based on the two
methods. Only two states had lower sensitivity rates based on the area code method.
Both the area code method and the wire center method had very high specificity rates at
the state level; the average was 99.7% for both methods. Based on the area code method,
50 states had specificity rates above 99%; based on the wire center method, 49 states had
specificity rates above 99%. Thirty-nine states had the same specificity rates based on the
two methods; 10 states had higher specificity rates based on the area code method than
based on the wire center method; only 2 states had slightly lower specificity rates based
on the area code method than based on the wire center method. The two methods yielded
slightly lower specificity rates at the sub-state level than at the state level. On average
across the 10 sub-state areas, the sub-state specificity rate was 99.2% based on the area
code method and 98.7% based on the wire center method. Five areas had higher
specificity rates based on the area code than based on the wire center, one area had a very
similar specificity rate based on the two methods, and three areas had lower specificity
rates based on the area code method than based on the wire center method.
AAPOR2013
4497

The demographic differences between respondents with accurate and inaccurate
geographic classification based on the area code and based on the wire center are shown
in Table 4.The respondents with geographic misclassification were statistically4 more
likely to be non-Hispanic white-only, college graduates, older, married, high income, or
renters; and they were more likely to have moved from a different state since the child
was born and live in non-central cities of metropolitan statistical areas (MSAs). These
differences existed regardless of whether the area code method or the wire center method
was used to construct the sampling frame. Since the characteristics of respondents with
accurate and inaccurate geographic classification are not the same, inaccuracy of
geographic stratification may potentially lead to biased estimates for single-state surveys.
Note that the differences in Table 4 were based on every state in the nation and are not
necessarily the differences that exist for any particular state.
4. Discussion
Overall, based on data from the NIS collected from Quarter 3, 2011 through Quarter 2,
2012, construction of a cell phone sampling frame based on the area code was more
accurate than construction based on the wire center, both at the state level and for the ten
sub-state areas targeted by the NIS. While for most states, the accuracy was similar
between the two methods, for some states and sub-state areas the area code method was
substantially more accurate than the wire center method, with differences greater than 10
percentage points. We found that the demographic differences between cell phone
respondents with accurate and inaccurate classification of reported state of residence
were similar regardless of whether the area code method or the wire center method was
used to construct the sampling frames.
Based on our finding that the area code method was substantially more accurate than the
wire center method in many states and sub-state areas and as accurate as the wire center
method, construction of a cell frame based on the area code would be preferable over
construction based on the wire center for single state-level surveys as well as for surveys
that stratify geographically at state or local level. For the sub-state target areas
investigated here, construction using the area code method would also be preferred.
For dual frame RDD national surveys, the under-coverage resulting from
misclassification does not lead to potential bias because such surveys sample from every
state’s cell phone sampling frame and nearly every cell phone user appears on one of
these sampling frames. However, for telephone surveys that target only a particular
geography, e.g., single state surveys, geographic misclassification may lead to bias in
survey estimates due to under-coverage. The potential bias may be negligible or
mitigated if the geographic misclassification errors, e.g., either misclassified at random
within the demographic groups or not completely at random, are covered by the post
stratification or raking schemes. This issue requires individual assessment for each survey
using cell phone telephone sampling where geography is inherent in the sample design
and estimation.
Because the NIS is a national survey that samples from every state’s cell phone sampling
frame, the results pertaining to potential under-coverage bias do not apply to the NIS.. In
the NIS, geographically misclassified cases are reclassified into their true state in the
4 Chi-square test of independence with p-value<0.001
AAPOR2013
4498

survey and base-weights reflecting initial probabilities of selection are retained. In this
way, bias due to geographic misclassification as described in this paper is not an issue for
the NIS. However, because the area code method was found to be as accurate as or more
accurate than the wire center method, utilizing the area code approach for sample frame
construction in the NIS should generally result in lower sampling error in survey
outcomes as compared to the wire center approach for the same sample size, which was
the key research question posed for the conduct of this research. Based on these findings,
the NIS adopted the area code method for assignment of geographic location beginning in
Quarter 3, 2012.
5. Limitations
There are several limitations to this work. First, the results presented here are based on
the NIS, and the target population for the survey is households containing 19-35 month
old children. Therefore the conclusions we have drawn may not be applicable to the
population of households in general. Second, this analysis is based on data collected in
Quarter 3, 2011 through Quarter 2, 2012, and the results may not hold in the future.
Finally, a new method for constructing cell-phone sampling frames for geographic areas
uses the rate center associated with the phone number. We did not evaluate the accuracy
of the rate center method in this paper. The rate center method could prove more accurate
than either the area code method or the wire center method.
6. Implications
While we find the area code method to be more accurate than the wire center method for
constructing cell phone sampling frames, both methods resulted in some inaccuracy due
to geographic misclassification. This inaccuracy has consequences for cell phone
surveys, which may differ depending on whether the survey targets a single state or local
area, or whether it is a national survey with state or local stratification. Many of these
implications have been previously described (Skalland and Khare, 2013) and were
supported by our analysis. Additionally, for national surveys with state or sub-state level
stratification, the geographic inaccuracy associated with sampling from cell phone frames
means that the respondent reported state of residence is not a sampling stratum but an
estimation domain. The cell phone sample is drawn from each state’s cell phone sampling
frame, but the state of residence is not known at the time of sampling. Location of
residence is known only once the respondent completes the interview and reports the
actual residence. Therefore, when producing variances for state-level estimates, the
sampling state should be treated as the sampling stratum, and the respondent-reported
state of residence should be treated as an estimation domain. When constructing a cell
phone sample frame, survey researchers should consider the appropriateness of using the
area code method or the wire center method for surveys as well as other methods such as
rate center attributes. Different methods may be more appropriate than another to address
geographic inaccuracies for cell phone surveys at the local, single state, or national levels.
AAPOR2013
4499

References
Christian, L., Dimock, M., and Keeter, S. (2009) “Accurately Locating Where Wireless
Respondents Live Requires More Than a Phone Number.” Pew Research Center for
People and the Press. http://pewresearch.org/pubs/1278/cell phones-geographic-
sampling-problems
Blumberg, S. and Luke, J. (2013) “Wireless Substitution: Early Release of Estimates
from the National Health Interview Survey, July-December 2012.”
http://www.cdc.gov/nchs/data/nhis/earlyrelease/wireless201306.pdf
Skalland, B. and Khare, M. (2013). "Geographic Inaccuracy of Cell Phone Samples and
the Effect on Telephone Survey Bias, Variance, and Cost,” Journal of Survey Statistics
and Methodology 1(1): 45-65
AAPOR2013
4500

Table 1: Definitions of PPV Rate5, NPV Rate
6, Sensitivity Rate,
and Specificity Rate
Respondents
Reside on
Target Area
Respondents
Reside off
Target Area
Total
On Sampling Frame
of Target Area
a b N1 = a + b
Off Sampling Frame
of Target Area
c d N2 = c + d
Total M1 = a + c M2 = b + d
PPV Rate = a/N1
NPV Rate = d/N2
Sensitivity Rate = a/M1
Specificity Rate = d/M2
5 PPV Rate is positive predicted value rate.
6 NPV Rate is negative predicted value rate.
AAPOR2013
4501

Table 2: State Level Accuracy of Geographic Stratification, 2011Q3-2012Q2 National Immunization Survey
Positive Predicted Value Rate Negative Predictive Value
Rate Sensitivity Rate Specificity Rate
STATE
Area
Code
Method
Wire
Center
Method
Difference
(Area
Code -
Wire
Center)
Area
Code
Method
Wire
Center
Method
Difference
(Area
Code -
Wire
Center)
Area
Code
Method
Wire
Center
Method
Difference
(Area
Code -
Wire
Center)
Area
Code
Method
Wire
Center
Method
Difference
(Area
Code -
Wire
Center)
State
Minimum 47.6 33.2 -3.7
98.7 97.7 0.0
45.4 17.2 -2.8
98.1 96.8 -0.1
State
Maximum 94.4 94.4 36.2
100.0 100.0 1.1
97.9 97.9 34.1
99.9 99.9 1.3
State Average 88.2 85.7 2.6
99.7 99.7 0.1
86.8 83.7 3.0
99.7 99.7 0.1
AK 94.4 94.4 0.0
99.9 99.9 0.0
96.5 96.5 0.0
99.9 99.9 0.0
AL 92.9 92.9 0.0
99.9 99.9 0.0
91.5 91.5 0.0
99.9 99.9 0.0
AR 91.6 91.6 0.0
99.9 99.9 0.0
93.0 93.0 0.0
99.9 99.9 0.0
AZ 90.3 90.3 0.0
99.8 99.8 0.0
83.6 83.6 0.0
99.9 99.9 0.0
CA 91.1 91.1 0.0
99.3 99.3 0.0
60.3 60.3 0.0
99.9 99.9 0.0
CO 88.0 88.0 0.0
99.8 99.8 0.0
85.3 85.3 0.0
99.8 99.8 0.0
CT 88.5 88.5 0.0
99.8 99.8 0.0
89.8 89.8 0.0
99.8 99.8 0.0
DC 47.6 33.2 14.4
99.9 99.8 0.1
94.6 87.8 6.8
98.1 96.8 1.3
DE 84.6 63.0 21.5
100.0 99.6 0.4
97.9 74.3 23.6
99.7 99.2 0.4
FL 91.2 91.2 0.0
99.6 99.6 0.0
69.7 69.7 0.0
99.9 99.9 0.0
GA 89.6 88.7 0.9
99.6 99.6 0.0
72.3 72.3 0.0
99.9 99.9 0.0
HI 83.4 83.4 0.0
99.9 99.9 0.0
93.6 93.6 0.0
99.7 99.7 0.0
IA 86.6 85.0 1.6
99.8 99.8 0.0
88.5 86.3 2.3
99.8 99.8 0.0
ID 90.8 89.6 1.2
99.9 99.9 0.0
90.8 92.3 -1.5
99.9 99.8 0.0
IL 89.2 86.9 2.4
99.7 99.6 0.1
91.0 88.2 2.7
99.6 99.6 0.1
IN 92.9 92.6 0.4
99.9 99.8 0.1
91.5 86.8 4.7
99.9 99.9 0.0
KS 86.6 73.5 13.1
99.8 99.8 0.1
89.9 86.0 3.9
99.8 99.5 0.3
KY 93.4 91.5 2.0
99.8 99.7 0.1
87.7 82.3 5.4
99.9 99.9 0.0
LA 88.5 88.5 0.0
99.9 99.9 0.0
92.1 92.1 0.0
99.8 99.8 0.0
MA 87.2 87.2 0.0
99.5 99.5 0.0
68.3 68.3 0.0
99.9 99.9 0.0
MD 81.6 45.5 36.2
98.7 97.7 1.1
59.9 25.8 34.1
99.6 99.0 0.6
AAPOR2013
4502

Table 2: State Level Accuracy of Geographic Stratification, 2011Q3-2012Q2 National Immunization Survey
Positive Predicted Value Rate Negative Predictive Value
Rate Sensitivity Rate Specificity Rate
STATE
Area
Code
Method
Wire
Center
Method
Difference
(Area
Code -
Wire
Center)
Area
Code
Method
Wire
Center
Method
Difference
(Area
Code -
Wire
Center)
Area
Code
Method
Wire
Center
Method
Difference
(Area
Code -
Wire
Center)
Area
Code
Method
Wire
Center
Method
Difference
(Area
Code -
Wire
Center)
ME 91.9 91.9 0.0
99.9 99.9 0.0
96.5 96.5 0.0
99.9 99.9 0.0
MI 90.1 90.1 0.0
99.9 99.9 0.0
90.1 90.1 0.0
99.9 99.9 0.0
MN 89.2 92.9 -3.7
99.7 99.6 0.1
79.2 73.6 5.6
99.9 99.9 -0.1
MO 91.3 79.1 12.2
99.8 99.5 0.3
84.1 63.7 20.4
99.9 99.8 0.1
MS 94.3 94.3 0.0
99.9 99.9 0.0
93.5 93.5 0.0
99.9 99.9 0.0
MT 92.6 92.6 0.0
100.0 100.0 0.0
97.9 97.9 0.0
99.9 99.9 0.0
NC 91.2 91.2 0.0
99.6 99.6 0.0
72.2 72.2 0.0
99.9 99.9 0.0
ND 85.4 81.3 4.2
99.9 99.9 0.0
93.8 96.5 -2.8
99.7 99.6 0.1
NE 91.2 89.3 2.0
99.8 99.8 0.0
90.6 90.6 0.0
99.9 99.8 0.0
NH 80.0 80.0 0.0
99.9 99.9 0.0
91.4 91.4 0.0
99.6 99.6 0.0
NJ 92.1 92.1 0.0
99.4 99.4 0.0
62.1 62.1 0.0
99.9 99.9 0.0
NM 93.1 93.1 0.0
99.8 99.8 0.0
90.3 90.3 0.0
99.9 99.9 0.0
NV 78.8 78.8 0.0
99.8 99.8 0.0
89.8 89.8 0.0
99.6 99.6 0.0
NY 83.0 83.0 0.0
99.7 99.7 0.0
92.0 92.0 0.0
99.4 99.4 0.0
OH 93.5 87.8 5.7
99.8 99.8 0.0
87.1 87.1 0.0
99.9 99.8 0.1
OK 93.7 93.7 0.0
99.7 99.7 0.0
81.3 81.3 0.0
99.9 99.9 0.0
OR 89.1 83.1 6.1
99.9 99.9 0.0
92.7 91.1 1.6
99.8 99.7 0.1
PA 85.1 79.1 6.0
99.5 99.2 0.4
91.8 84.8 7.0
99.1 98.8 0.3
RI 80.2 80.2 0.0
100.0 100.0 0.0
97.0 97.0 0.0
99.6 99.6 0.0
SC 87.6 87.5 0.1
99.9 99.9 0.0
91.6 90.8 0.8
99.8 99.8 0.0
SD 93.9 93.1 0.8
99.9 99.9 0.0
94.6 93.8 0.8
99.9 99.9 0.0
TN 83.3 82.0 1.4
99.8 99.8 0.0
87.3 86.5 0.8
99.7 99.7 0.0
TX 92.6 92.6 0.0
99.2 99.2 0.0
94.2 94.2 0.0
99.0 99.0 0.0
UT 86.9 86.9 0.0
99.9 99.9 0.0
91.4 91.4 0.0
99.8 99.8 0.0
VA 84.0 83.3 0.7
98.8 98.2 0.6
45.4 17.2 28.2
99.8 99.9 -0.1
(Continued)
AAPOR2013
4503

Table 2: State Level Accuracy of Geographic Stratification, 2011Q3-2012Q2 National Immunization Survey
Positive Predicted Value Rate Negative Predictive Value
Rate Sensitivity Rate Specificity Rate
STATE
Area
Code
Method
Wire
Center
Method
Difference
(Area
Code -
Wire
Center)
Area
Code
Method
Wire
Center
Method
Difference
(Area
Code -
Wire
Center)
Area
Code
Method
Wire
Center
Method
Difference
(Area
Code -
Wire
Center)
Area
Code
Method
Wire
Center
Method
Difference
(Area
Code -
Wire
Center)
VT 88.5 88.5 0.0
99.9 99.9 0.0
96.5 96.5 0.0
99.8 99.8 0.0
WA 89.0 87.6 1.4
99.6 99.5 0.1
74.8 65.5 9.2
99.9 99.9 0.0
WI 94.4 94.4 0.0
99.9 99.9 0.0
93.7 93.7 0.0
99.9 99.9 0.0
WV 93.5 93.5 0.0
99.9 99.9 0.0
96.3 96.3 0.0
99.9 99.9 0.0
WY 89.7 89.7 0.0 100.0 100.0 0.0 97.9 97.9 0.0 99.8 99.8 0.0
Estimates presented as point estimate (%).
(Continued)
AAPOR2013
4504
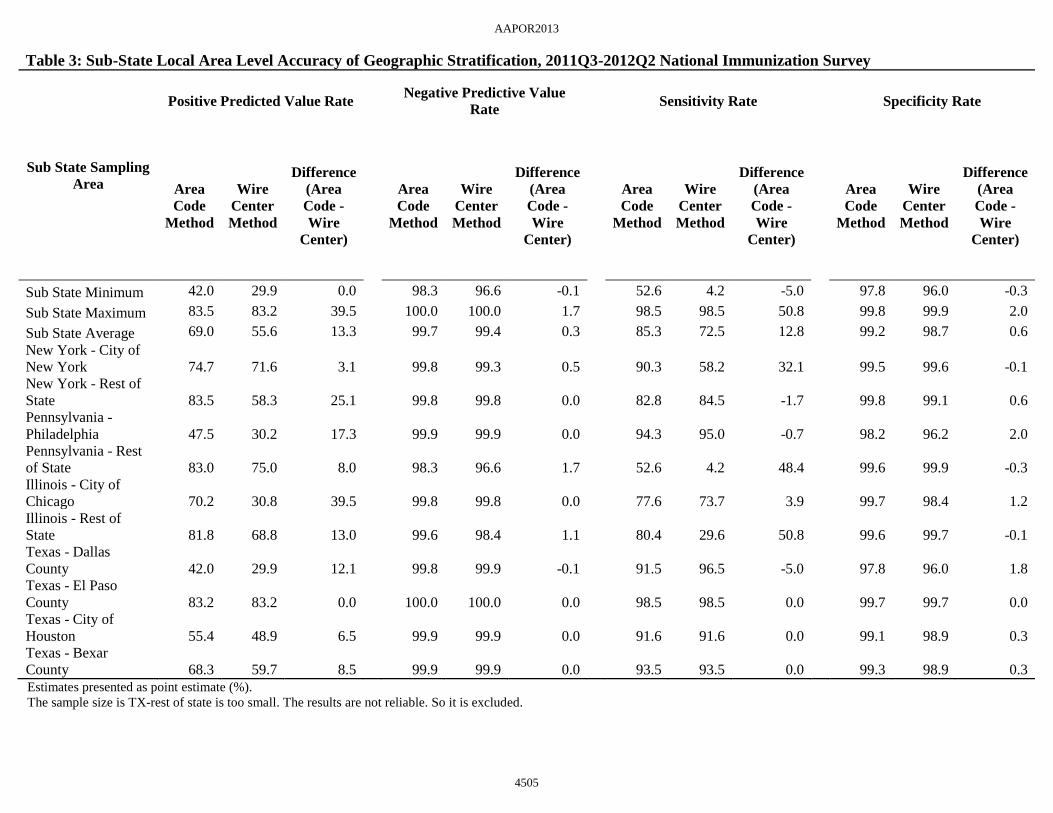
Table 3: Sub-State Local Area Level Accuracy of Geographic Stratification, 2011Q3-2012Q2 National Immunization Survey
Sub State Sampling
Area
Positive Predicted Value Rate
Negative Predictive Value
Rate Sensitivity Rate
Specificity Rate
Area
Code
Method
Wire
Center
Method
Difference
(Area
Code -
Wire
Center)
Area
Code
Method
Wire
Center
Method
Difference
(Area
Code -
Wire
Center)
Area
Code
Method
Wire
Center
Method
Difference
(Area
Code -
Wire
Center)
Area
Code
Method
Wire
Center
Method
Difference
(Area
Code -
Wire
Center)
Sub State Minimum 42.0 29.9 0.0
98.3 96.6 -0.1
52.6 4.2 -5.0
97.8 96.0 -0.3
Sub State Maximum 83.5 83.2 39.5
100.0 100.0 1.7
98.5 98.5 50.8
99.8 99.9 2.0
Sub State Average 69.0 55.6 13.3
99.7 99.4 0.3
85.3 72.5 12.8
99.2 98.7 0.6
New York - City of
New York 74.7 71.6 3.1
99.8 99.3 0.5
90.3 58.2 32.1
99.5 99.6 -0.1
New York - Rest of
State 83.5 58.3 25.1
99.8 99.8 0.0
82.8 84.5 -1.7
99.8 99.1 0.6
Pennsylvania -
Philadelphia 47.5 30.2 17.3
99.9 99.9 0.0
94.3 95.0 -0.7
98.2 96.2 2.0
Pennsylvania - Rest
of State 83.0 75.0 8.0
98.3 96.6 1.7
52.6 4.2 48.4
99.6 99.9 -0.3
Illinois - City of
Chicago 70.2 30.8 39.5
99.8 99.8 0.0
77.6 73.7 3.9
99.7 98.4 1.2
Illinois - Rest of
State 81.8 68.8 13.0
99.6 98.4 1.1
80.4 29.6 50.8
99.6 99.7 -0.1
Texas - Dallas
County 42.0 29.9 12.1
99.8 99.9 -0.1
91.5 96.5 -5.0
97.8 96.0 1.8
Texas - El Paso
County 83.2 83.2 0.0
100.0 100.0 0.0
98.5 98.5 0.0
99.7 99.7 0.0
Texas - City of
Houston 55.4 48.9 6.5
99.9 99.9 0.0
91.6 91.6 0.0
99.1 98.9 0.3
Texas - Bexar
County 68.3 59.7 8.5 99.9 99.9 0.0 93.5 93.5 0.0 99.3 98.9 0.3
Estimates presented as point estimate (%).
The sample size is TX-rest of state is too small. The results are not reliable. So it is excluded.
AAPOR2013
4505

Table 4: Estimated Difference in Distribution of Characteristics of 19-35 Month's Children (Accurate Sampling State - Inaccurate
Sampling State)
Characteristic Sampling Frame Constructed by Wire Center
Sampling Frame Constructed by Area Code
Sampling
State
Matches
True State
of Residence
Sampling
State Differs
from True
State of
Residence
Difference
Sampling
State
Matches
True State
of Residence
Sampling
State Differs
from True
State of
Residence
Difference
Race/Ethnicity
Hispanic 23.6
15.3
8.4
23.3
15.1
8.2
Non-Hispanic White Only 54.9
58.0
-3.1
54.9
59.0
-4.1
Non-Hispanic Black Only 9.8
11.4
-1.5
10.0
10.6
-0.6
Non-Hispanic Other/Multiple Race 11.6
15.4
-3.8
11.8
15.3
-3.5
Chi-Square p-value <.0001
<.0001
Mother's Education
< 12 Years 14.0
8.2
5.8
14.0
6.7
7.3
12 Years 22.7
15.8
6.9
22.8
13.2
9.5
> 12 Years, Non-College Grad 26.6
25.4
1.2
26.4
26.5
-0.1
College Grad 36.7
50.6
-13.9
36.8
53.6
-16.7
Chi-Square p-value <.0001
<.0001
Mother's Age Group
<= 19 Years 2.3
0.9
1.4
2.3
0.7
1.6
20-29 Years 44.3
42.0
2.3
44.4
40.5
3.9
>= 30 Years 53.4
57.1
-3.7
53.3
58.8
-5.5
Chi-Square p-value <.0001
<.0001
AAPOR2013
4506

Table 4: Estimated Difference in Distribution of Characteristics of 19-35 Month's Children (Accurate Sampling State - Inaccurate
Sampling State)
Characteristic Sampling Frame Constructed by Wire Center
Sampling Frame Constructed by Area Code
Sampling
State
Matches
True State
of Residence
Sampling
State Differs
from True
State of
Residence
Difference
Sampling
State
Matches
True State
of Residence
Sampling
State Differs
from True
State of
Residence
Difference
Marital Status of Mother
Widowed/Divorced/Separated/Deceased 8.3
6.2
2.2
8.4
5.3
3.1
Never Married 26.6
16.5
10.1
26.6
13.7
12.9
Married 65.1
77.3
-12.2
65.1
81.1
-16.0
Chi-Square p-value <.0001
<.0001
Income to Poverty Ratio
Less than 1.33 39.6
25.7
13.9
39.4
23.3
16.2
Greater than or Equal to 1.33, Less than 4.0 38.1
39.8
-1.7
37.9
41.2
-3.3
Greater than or Equal to 4.0 22.3
34.6
-12.2
22.7
35.6
-12.9
Chi-Square p-value <.0001
<.0001
Mobility Status
Moved from Different State since Child Birth 7.0
30.6
-23.6
7.0
37.2
-30.2
Did not move from Different State since
Child Birth 93.0
69.4
23.6
93.0
62.8
30.2
Chi-Square p-value <.0001
<.0001
(Continued)
AAPOR2013
4507

Table 4: Estimated Difference in Distribution of Characteristics of 19-35 Month's Children (Accurate Sampling State - Inaccurate
Sampling State)
Characteristic Sampling Frame Constructed by Wire Center
Sampling Frame Constructed by Area Code
Sampling
State
Matches
True State
of Residence
Sampling
State Differs
from True
State of
Residence
Difference
Sampling
State
Matches
True State
of Residence
Sampling
State Differs
from True
State of
Residence
Difference
MSA
MSA, Central City 44.5
34.6
9.8
43.4
39.3
4.1
MSA, Non-Central City 33.5
51.7
-18.1
34.6
49.2
-14.6
Non-MSA 22.0
13.7
8.3
22.0
11.5
10.5
Chi-Square p-value <.0001
<.0001
Ownership
Owned or Being Bought 56.1
50.3
5.7
56.2
48.1
8.0
Rented/Other 43.9
49.7
-5.7
43.8
51.9
-8.0
Chi-Square p-value 0.0001 <.0001
Estimates presented as point estimate (%).
The estimates are based on unweighted data.
F
(Continued)
AAPOR2013
4508