Embed Size (px)
Citation preview
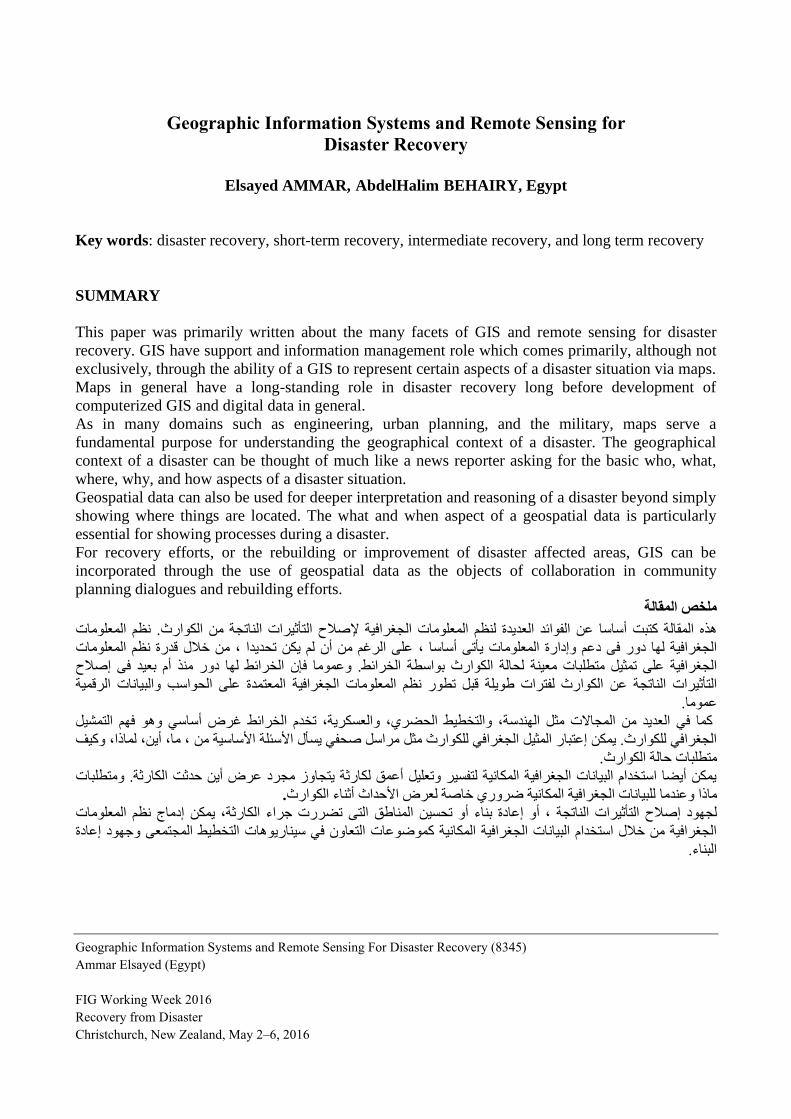
Geographic Information Systems and Remote Sensing for
Disaster Recovery
Elsayed AMMAR, AbdelHalim BEHAIRY, Egypt
Key words: disaster recovery, short-term recovery, intermediate recovery, and long term recovery
SUMMARY
This paper was primarily written about the many facets of GIS and remote sensing for disaster
recovery. GIS have support and information management role which comes primarily, although not
exclusively, through the ability of a GIS to represent certain aspects of a disaster situation via maps.
Maps in general have a long-standing role in disaster recovery long before development of
computerized GIS and digital data in general.
As in many domains such as engineering, urban planning, and the military, maps serve a
fundamental purpose for understanding the geographical context of a disaster. The geographical
context of a disaster can be thought of much like a news reporter asking for the basic who, what,
where, why, and how aspects of a disaster situation.
Geospatial data can also be used for deeper interpretation and reasoning of a disaster beyond simply
showing where things are located. The what and when aspect of a geospatial data is particularly
essential for showing processes during a disaster.
For recovery efforts, or the rebuilding or improvement of disaster affected areas, GIS can be
incorporated through the use of geospatial data as the objects of collaboration in community
planning dialogues and rebuilding efforts.
ملخص المقالة
. نظم المعلومات من الكوارث لصحا التثييرات الناججةإلت الجغرافية عن الفوائد العديدة لنظم المعلوماهذه المقالة كتبت أساسا
من خحال قدرة نظم المعلومات ، جحديداعلى الرغم من أن لم يكن ، يثجى أساسا دعم وإدارة المعلومات دور فى لهاالجغرافية
إلصحا الخرائط لها دور منذ أم بعيد فى فإن عموما ولحالة الكوارث بواسطة الخرائط. على جمثيل متطلبات معينة الجغرافية
المعتمدة على الحواسب والبيانات الرقمية الكوارث لفترات طويلة قبل جطور نظم المعلومات الجغرافية عن التثييرات الناججة
عموما.
التمشيلفهم وهو كما في العديد من المجاالت مثل الهندسة، والتخطيط الحضري، والعسكرية، جخدم الخرائط غرض أساسي
، ما، أين، لماذا، وكيف من األساسيةاألسئلة وارث مثل مراسل لصحفي يسثل الجغرافي للك المثيلالجغرافي للكوارث. يمكن إعتبار
حالة الكوارث. متطلبات
متطلبات يمكن أيضا استخدام البيانات الجغرافية المكانية لتفسير وجعليل أعمق لكارية يتجاوز مجرد عرض أين حديت الكارية. و
.أيناء الكوارث األحداثللبيانات الجغرافية المكانية ضروري خالصة لعرض ماعندوماذا
جضررت جراء الكارية، يمكن إدماج نظم المعلومات التى مناطقال، أو إعادة بناء أو جحسين إلصحا التثييرات الناججة لجهود
وجهود إعادة المجتمعى التخطيط يناريوهات سالتعاون في موضوعات الجغرافية من خحال استخدام البيانات الجغرافية المكانية ك
البناء.
Geographic Information Systems and Remote Sensing For Disaster Recovery (8345)
Ammar Elsayed (Egypt)
FIG Working Week 2016
Recovery from Disaster
Christchurch, New Zealand, May 2–6, 2016
Geographic Information Systems and Remote Sensing for
Disaster Recovery
Elsayed AMMAR, AbdelHalim BEHAIRY, Egypt
1. INTRODUCTION
Disasters occur every day on the earth, affecting millions of people each year and inflicting
terrible suffering and economic loss (Madry, 2015).
A disaster is a fundamental breakdown between humans, their environment and supporting
technologies. When a community cannot adequately respond to an incident and requires outside
assistance, then it is a disaster, and the emergency management community responds (Ibid).
Resilience defines how a community is capable to absorb these incidents without requiring
outside assistance, and mitigation defines actions and planning to reduce the impact of the next
incidents, for example by moving people out of areas that repeatedly flooded or enforcing stricter
building codes in areas subject to earthquakes (Ibid).
Disaster recovery is focused on the transition of the built environment, business, people, and
their communities back to a state of acceptable operation after an event such as an earthquake or
hurricane, which requires long-term planning and commitment to achieve recovery goals
(Tomaszewski, 2015).
It is the longer-term returning the community back to normal, as much as possible, after the
immediate response is over (Madry, 2015).
This paper deals with ideas and examples that will show capabilities of Geographic Information
Systems, GIS, and remote sensing for disaster recovery. It provides a comprehensive treatment of
GIS and remote sensing for disaster recovery. However, it cannot cover all aspects of this
fascinating, interdisciplinary area.
2. GEOGRAPHICAL ASPECTS OF DISASTER RECOVERY
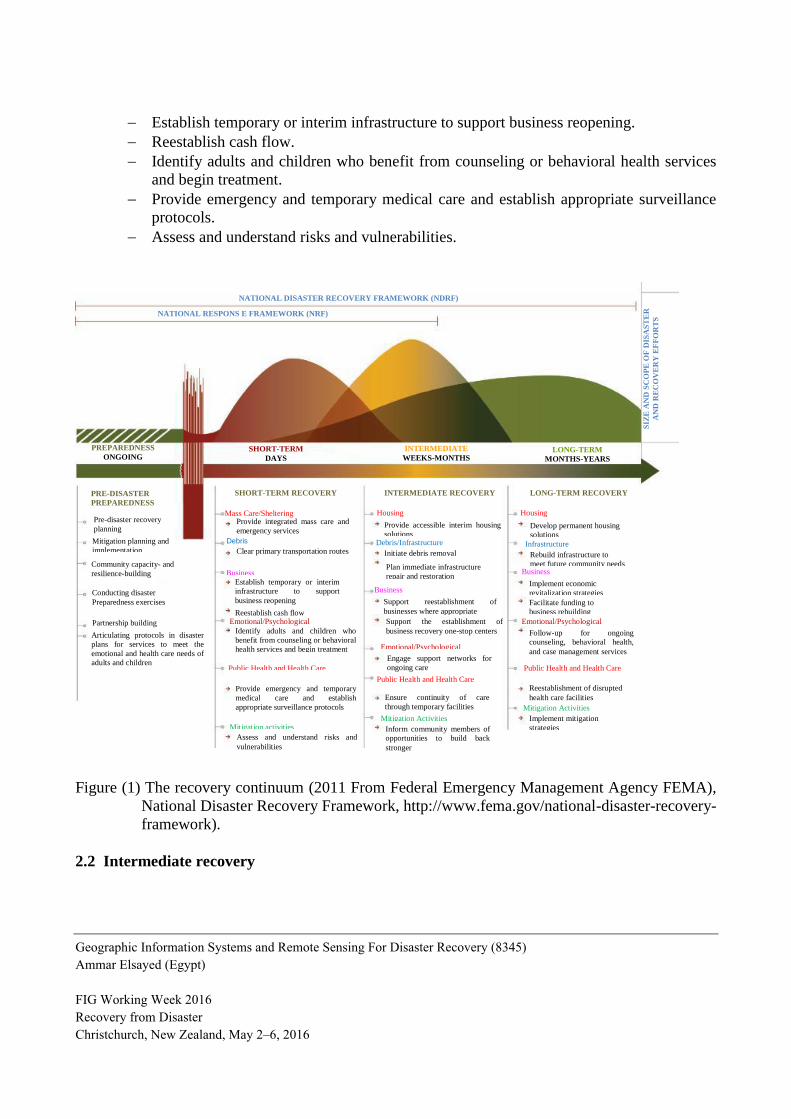
Figure 1, cited from the US Federal Emergency Management Agency (FEMA) National
Recovery Framework, is a helpful guide for outlining various geographical aspects of disaster
recovery (Tomaszewski, 2015). The specific uses of GIS as a support mechanism for many of these
geographical aspects of disaster recovery are discussed later in section 3.
Disaster recovery operates at varying space and time scales subject to the nuances of the places
undergoing the recovery, (Stevenson et al., 2010). It is classified as short-term, intermediate, and
long term recoveries. These classes are discussed in detail below:
2.1 Short-term recovery
In this class, disaster recovery is seen as a part of the disaster response phase in the case of
efforts such as returning people that have been temporarily displaced to their homes. Its activities
are carried out within days. It includes the following activities (Tomaszewski, 2015):
Provide integrated mass care and emergency services.
Clear primary transportation routes.
Geographic Information Systems and Remote Sensing For Disaster Recovery (8345)
Ammar Elsayed (Egypt)
FIG Working Week 2016
Recovery from Disaster
Christchurch, New Zealand, May 2–6, 2016
Establish temporary or interim infrastructure to support business reopening.
Reestablish cash flow.
Identify adults and children who benefit from counseling or behavioral health services
and begin treatment.
Provide emergency and temporary medical care and establish appropriate surveillance
protocols.
Assess and understand risks and vulnerabilities.
Figure (1) The recovery continuum (2011 From Federal Emergency Management Agency FEMA),
National Disaster Recovery Framework, http://www.fema.gov/national-disaster-recovery-
framework).
2.2 Intermediate recovery
PRE-DISASTER
PREPAREDNESS
Mitigation activities
NATIONAL DISASTER RECOVERY FRAMEWORK (NDRF)
NATIONAL RESPONS E FRAMEWORK (NRF)
PREPAREDNESS
ONGOING SHORT-TERM
DAYS
INTERMEDIATE
WEEKS-MONTHS LONG-TERM
MONTHS-YEARS
SHORT-TERM RECOVERY INTERMEDIATE RECOVERY LONG-TERM RECOVERY
Pre-disaster recovery
planning
Mitigation planning and
implementation
Community capacity- and
resilience-building
Conducting disaster
Preparedness exercises
Partnership building
Articulating protocols in disaster
plans for services to meet the
emotional and health care needs of
adults and children
Mass Care/Sheltering Provide integrated mass care and
emergency services
Debris
Clear primary transportation routes
Business
Establish temporary or interim
infrastructure to support
business reopening
Housing
Provide accessible interim housing
solutions Debris/Infrastructure
Initiate debris removal
Plan immediate infrastructure
repair and restoration
Support reestablishment of
businesses where appropriate
Housing
Develop permanent housing
solutions
Infrastructure
Rebuild infrastructure to
meet future community needs Business
Implement economic
revitalization strategies
Emotional/Psychological
Identify adults and children who
benefit from counseling or behavioral
health services and begin treatment
Reestablish cash flow
Public Health and Health Care
Provide emergency and temporary
medical care and establish
appropriate surveillance protocols
Assess and understand risks and
vulnerabilities
Support the establishment of
business recovery one-stop centers
Emotional/Psychological
Engage support networks for
ongoing care
Public Health and Health Care
Ensure continuity of care
through temporary facilities
Mitigation Activities
Inform community members of
opportunities to build back
stronger
Business
Facilitate funding to
business rebuilding
Emotional/Psychological
Follow-up for ongoing
counseling, behavioral health,
and case management services
Public Health and Health Care
Reestablishment of disrupted
health care facilities
Mitigation Activities
Implement mitigation
strategies
SIZ
E A
ND
SC
OP
E O
F D
ISA
ST
ER
AN
D R
EC
OV
ER
Y E
FF
OR
TS
Geographic Information Systems and Remote Sensing For Disaster Recovery (8345)
Ammar Elsayed (Egypt)
FIG Working Week 2016
Recovery from Disaster
Christchurch, New Zealand, May 2–6, 2016
Also most of the activities in this class are seen as a part of the disaster response phase. Its
activities are carried out within weeks to months. They include the following activities
(Tomaszewski, 2015):
Provide accessible interim housing solutions.
Initiate debris removal.
Plan immediate infrastructure repair and restoration.
Support reestablishment of businesses where appropriate.
Support the establishment of business recovery one-stop centers.
Engage support networks for ongoing care.
Ensure continuity of care through temporary facilities.
Inform community members of opportunities to build back stronger.
2.3 Long-term recovery
In this class, disaster recovery is viewed as a disaster planning activity in terms of developing
plans for recovery such as contracts for debris removal that are implemented once an actual disaster
occurs or making observations of disaster zones using remote sensing technologies to measure
redevelopment progress (Wagner, Myint, and Cerveny, 2012).
Furthermore, long-term disaster recovery often does not receive the media attention that other
disaster phases do, such as disaster response.
Long-term disaster recovery is the focus of this paper. It includes the following activities:
Develop permanent housing solutions.
Rebuild infrastructure to meet future community needs.
Implement economic revitalization strategies.
Facilitate funding to business rebuilding.
Follow-up for ongoing counseling, behavioral health, and case management services.
Reestablishment of disrupted health care facilities.
Implement mitigation strategies.
These activities take months to years to be executed.
In disaster recovery, GIS can be used for location-specific planning and coordination such as
identifying people in specific shelters, identifying specific locations to which they can be moved,
and monitoring the rebuilding and redevelopment of houses and neighborhoods. As also seen in Fig.
(1), debris and infrastructure activities are inherently spatial in nature and can rely on GIS for
planning and coordination. Public health and health care are also very location-specific activities
that can rely on GIS for site selection problems such as determining the best locations to place
temporary health centers. Finally, it is interesting to note in Fig. (1) that disaster mitigation
activities, such as identifying risks and vulnerabilities and communicating with community
members about opportunities for more resilient rebuilding, are also integrated into the disaster
recovery process (Tomaszewski, 2015).
Geographic Information Systems and Remote Sensing For Disaster Recovery (8345)
Ammar Elsayed (Egypt)
FIG Working Week 2016
Recovery from Disaster
Christchurch, New Zealand, May 2–6, 2016
3. USING GIS TO SUPPORT DISASTER RECOVERY TASKS
GIS, have the ability to represent certain aspects of a disaster situation via geospatial data
(digital maps). Geospatial data serve a fundamental purpose for understanding the geographical
context of a disaster. The geographical context of a disaster can tell us the basic who, what, where,
why, and how aspects of a disaster situation (Ibid).
First and foremost, geospatial data can tell us the where aspect of a disaster such as where
damaged buildings are, where roads open for evacuation are, where the areas that are most
susceptible to flooding impacts are, where supplies should be stationed for planning purposes.
However, it is important to consider that geospatial data can also be used for deeper
interpretation and reasoning of a disaster beyond simply showing where things are located. For
example, geospatial data are important for showing what is happening in a disaster and when it is
happening. The what and when aspect of a geospatial data is particularly essential for showing
processes during a disaster.
For recovery efforts, or the rebuilding or improvement of disaster affected areas, GIS can be
incorporated through the use of geospatial data as the objects of collaboration in community
planning dialogues and rebuilding efforts.
The unfortunate reality is that disasters will continue to proliferate in size, scope, and
intensity. Future disasters will affect more people in diverse geographical contexts. Given that
disasters are fundamentally spatial in nature, GIS plays a critical role in disaster recovery.
Furthermore, although the adoption of GIS into disaster recovery practice continues, there is
still much more that can be done with integrating GIS and disaster recovery. Thus, beyond the
paper’s primary audience, it has been designed to inform, enlighten, advocate for, and raise
awareness of GIS for disaster recovery.
GIS has the potential to advance interdisciplinary research and perspectives on disaster
recovery due to the spatial nature of questions that GIS addresses and problems it helps to solve.
Ultimately, this paper will help in developing better disaster recovery spatial thinking skills and
show how GIS can support spatial thinking. Specific GIS software titles will come and go, but it is
the underlying spatial thinking skills for disaster recovery that will remain and are most important.
The GIS is sufficiently flexible that any type of spatial information can be integrated into it
(Madry, 2015).
GIS are at the heart of disaster recovery data integration, analysis, and sharing. GIS is where all
the information from satellites, GPS, weather RADAR, field damage assessments, paper maps, and
other sources are integrated and displayed for analysis and action. Many international, national,
state, and local disaster organizations and others are now using GIS systems and are also routinely
distributing their data in GIS formats so that it can be directly incorporated into GIS systems (Ibid).
3.1 Geocollaboration
Geocollaboration is the idea of using maps, spatial representations, and map annotations to
facilitate processes of collaboration that they are spatial in nature (Tomaszewski, 2010). Although
relevant to all disaster management phases, the idea of geocollaboration can play a particularly
important role in disaster recovery as a means to coordinate the spatial activities of a variety of
actors involved in long-term recovery (Emrich, Cutter, and Weschler, 2011).
Geographic Information Systems and Remote Sensing For Disaster Recovery (8345)
Ammar Elsayed (Egypt)
FIG Working Week 2016
Recovery from Disaster
Christchurch, New Zealand, May 2–6, 2016
The particular role of visualization as a support mechanism in the geocollaborative process
applied to disaster recovery tasks is outlined as follows:
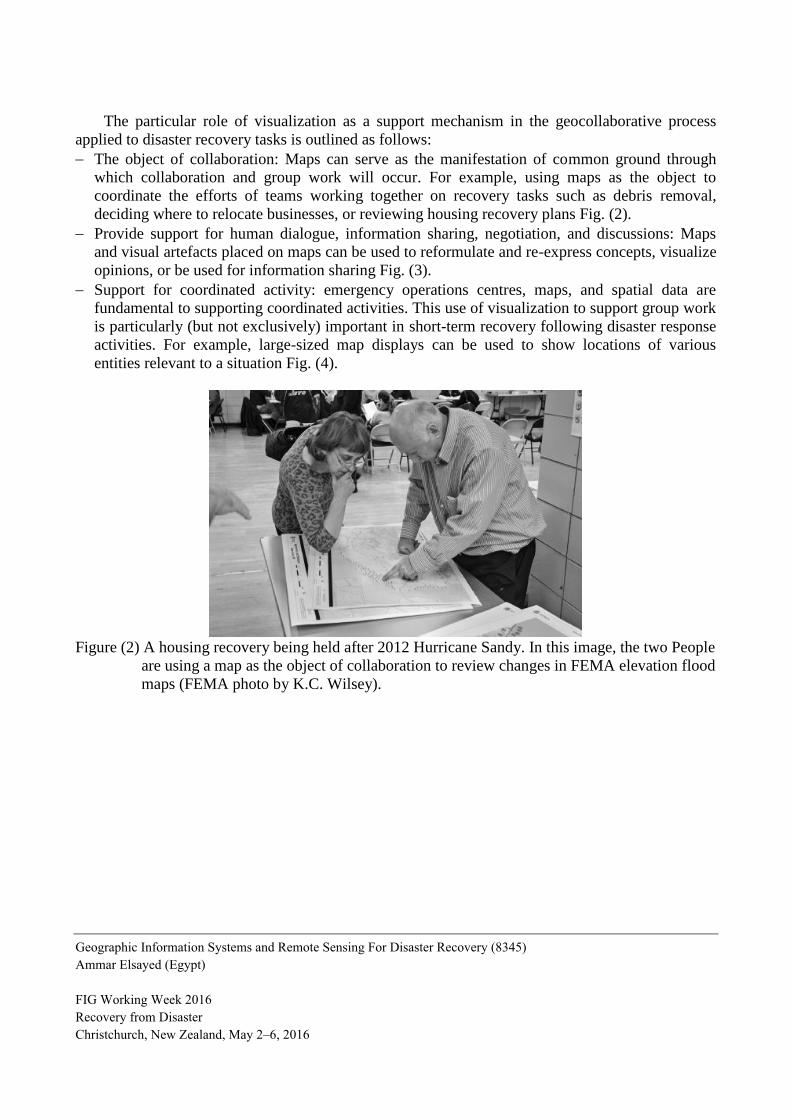
The object of collaboration: Maps can serve as the manifestation of common ground through
which collaboration and group work will occur. For example, using maps as the object to
coordinate the efforts of teams working together on recovery tasks such as debris removal,
deciding where to relocate businesses, or reviewing housing recovery plans Fig. (2).
Provide support for human dialogue, information sharing, negotiation, and discussions: Maps
and visual artefacts placed on maps can be used to reformulate and re-express concepts, visualize
opinions, or be used for information sharing Fig. (3).
Support for coordinated activity: emergency operations centres, maps, and spatial data are
fundamental to supporting coordinated activities. This use of visualization to support group work
is particularly (but not exclusively) important in short-term recovery following disaster response
activities. For example, large-sized map displays can be used to show locations of various
entities relevant to a situation Fig. (4).
Figure (2) A housing recovery being held after 2012 Hurricane Sandy. In this image, the two People
are using a map as the object of collaboration to review changes in FEMA elevation flood
maps (FEMA photo by K.C. Wilsey).
Geographic Information Systems and Remote Sensing For Disaster Recovery (8345)
Ammar Elsayed (Egypt)
FIG Working Week 2016
Recovery from Disaster
Christchurch, New Zealand, May 2–6, 2016
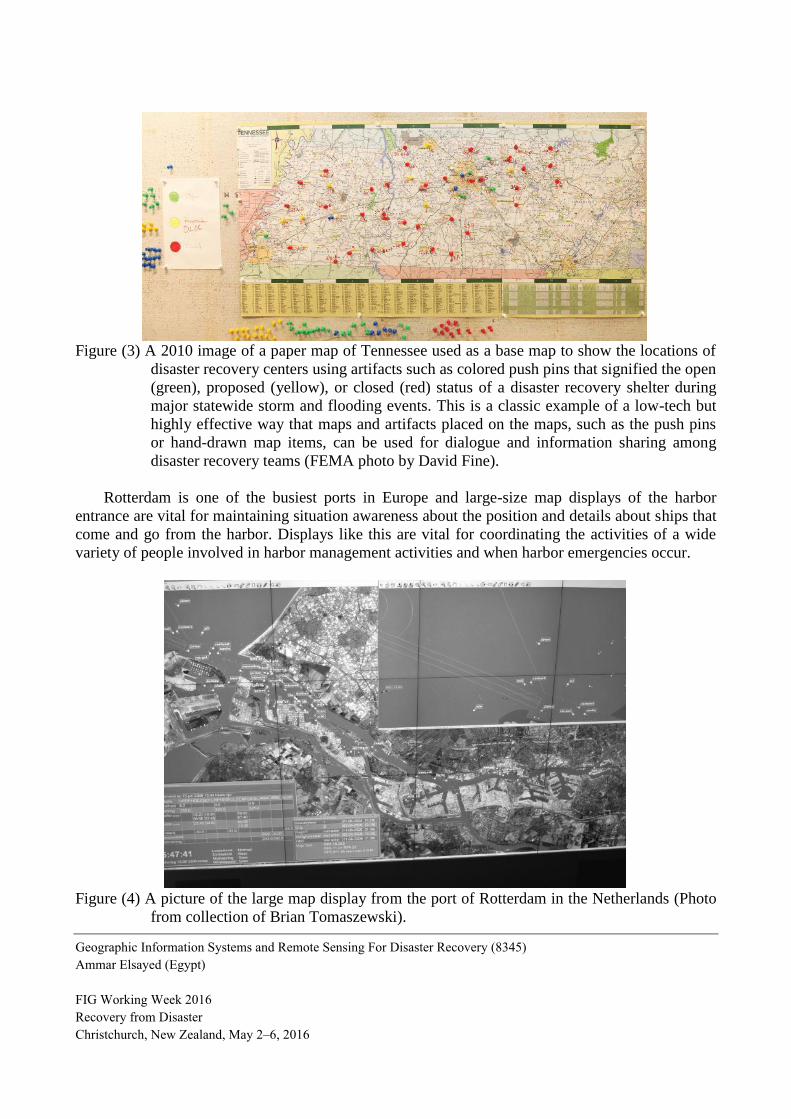
Figure (3) A 2010 image of a paper map of Tennessee used as a base map to show the locations of
disaster recovery centers using artifacts such as colored push pins that signified the open
(green), proposed (yellow), or closed (red) status of a disaster recovery shelter during
major statewide storm and flooding events. This is a classic example of a low-tech but
highly effective way that maps and artifacts placed on the maps, such as the push pins
or hand-drawn map items, can be used for dialogue and information sharing among
disaster recovery teams (FEMA photo by David Fine).
Rotterdam is one of the busiest ports in Europe and large-size map displays of the harbor
entrance are vital for maintaining situation awareness about the position and details about ships that
come and go from the harbor. Displays like this are vital for coordinating the activities of a wide
variety of people involved in harbor management activities and when harbor emergencies occur.
Figure (4) A picture of the large map display from the port of Rotterdam in the Netherlands (Photo
from collection of Brian Tomaszewski).
Geographic Information Systems and Remote Sensing For Disaster Recovery (8345)
Ammar Elsayed (Egypt)
FIG Working Week 2016
Recovery from Disaster
Christchurch, New Zealand, May 2–6, 2016
3.2 Restoring Critical Infrastructure
The restoration of critical infrastructure, such as power, water, electricity, and transportation
systems, is a critical activity for both short-term and long-term recovery efforts. GIS can play an
important role in critical infrastructure vulnerability planning and restoration activities through the
visualization of physical proximity and distribution of critical capabilities across a region. Since
infrastructural vulnerabilities are governed by virtual and physical attributes, use of GIS is
particularly important as a management tool as it is a method that can marry both sets of conditions.
The following is a specific GIS example using a road blockage Fig. (5).
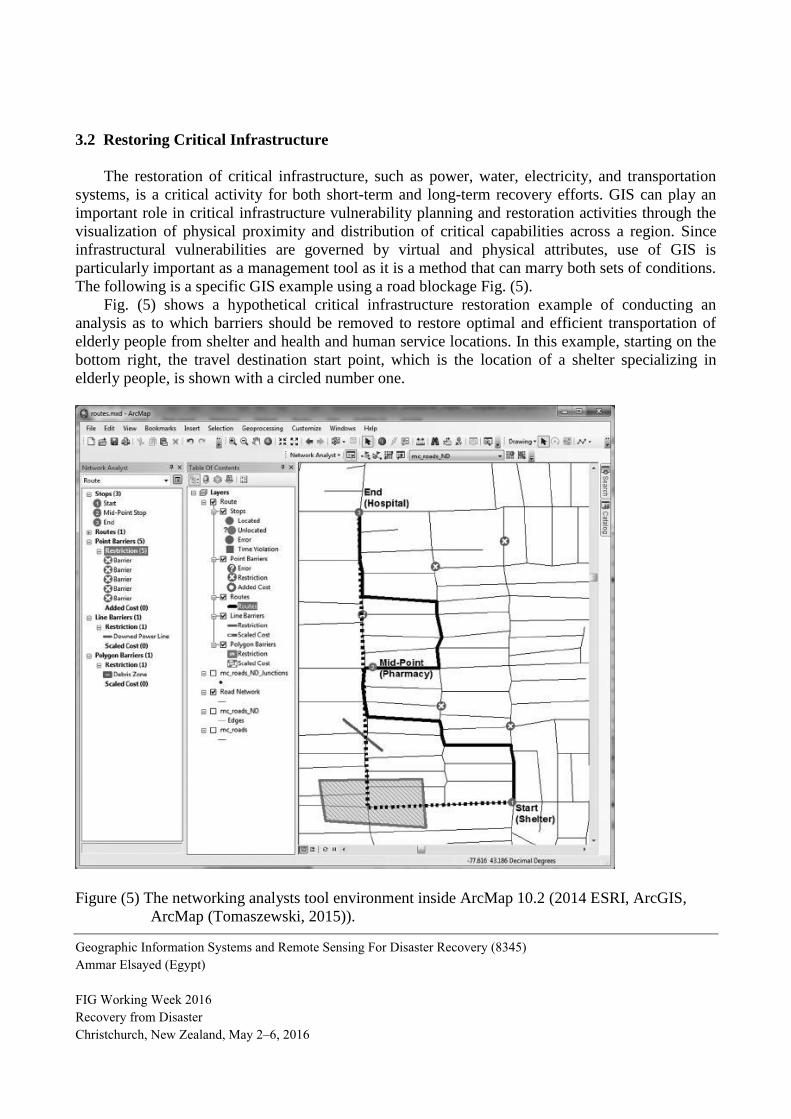
Fig. (5) shows a hypothetical critical infrastructure restoration example of conducting an
analysis as to which barriers should be removed to restore optimal and efficient transportation of
elderly people from shelter and health and human service locations. In this example, starting on the
bottom right, the travel destination start point, which is the location of a shelter specializing in
elderly people, is shown with a circled number one.
Figure (5) The networking analysts tool environment inside ArcMap 10.2 (2014 ESRI, ArcGIS,
ArcMap (Tomaszewski, 2015)).
Geographic Information Systems and Remote Sensing For Disaster Recovery (8345)
Ammar Elsayed (Egypt)
FIG Working Week 2016
Recovery from Disaster
Christchurch, New Zealand, May 2–6, 2016

A travel destination midpoint, which is the location of a pharmacy for collecting medical
supplies, is shown with a circled number 2, and the endpoint, which is where the elderly people are
being taken for doctor visits, is shown with a circled number 3. The ideal route for travel between
these three locations is shown with the black, dashed line. However, travel along this exact route is
not possible as obstacles, collected from field damage assessment teams, are blocking passage along
the route. For example, there is a large debris zone (represented by a hatched polygon symbol) as
well as smaller debris zones causing route blockages (as represented by point symbols shown with a
circled X). Both the travel route origins and destinations, in endpoints as well as point, line, and
polygon restriction representations, can all be added into GIS for planning the final route.
Furthermore, the underlying road network is a TIGER shapefile that has been processed by the
ArcGIS Network Analyst tool to allow for route calculations. Once the origins, destinations, and
endpoints have been defined, in addition to point, line, and polygon-based route restrictions, the
network analyst tool will then create a route that connects the origins and destinations while
avoiding the restricted areas.
In Fig. (5), the final route calculated is shown using a solid black line. Make note of several
things about the calculated route. First, note how the calculated route connects all three of the
destination points (the shelter, pharmacy, and hospital). Second, make note of how the final route
avoids all the defined restriction areas. The Fig. (5) example only shows the calculation of a route
that is based on distance. However, routes can also be calculated in terms of time restrictions, such
as avoiding streets with particularly high traffic volumes at certain times, such as morning or
afternoon rush hour traffic. In addition to helping to restore critical infrastructure, network analyst
approaches like the one shown in Fig. (5) have a wide variety of other uses in other disaster
management activities such as evacuation route planning.
3.3 Debris Cleanup
Another very common activity in disaster recovery on both short-term and long-term scales is
debris cleanup. Again, GIS can serve as a powerful support technology for planning, analyzing, and
modeling debris cleanup activities. For example, debris cleanup is the initial activity that signals the
shift into recovery from the response phase. It is also a resource- and capability-intensive process.
The right tools and equipment must be available to the individuals assigned to complete the large-
scale effort. Careful planning is essential for efficient and effective debris cleanup such as (1)
understanding the volume and type of debris to be removed, (2) where specific debris can be moved
(for example, a general landfill versus a specialized waste facility location that specializes in
hazardous materials), and how much time debris removal will take with the resources that are
available (Dymon and Winter, 2012).
In addition to basic spatial understanding of where debris has accumulated based on damage
assessment maps and where debris cleanup crews are located, the analytical capabilities of GIS can
also be used for planning debris cleanup activities using networking algorithms similar to those
shown in the previous examples of restoring critical infrastructure.
Fig. (6) is one example of the use of GIS as an analytic support device for debris cleanup
activities using service area networking algorithms. Fig. (6) shows a hypothetical degree cleanup
scenario that was created using the Network Analyst tools of ArcMap and was also used to create
Geographic Information Systems and Remote Sensing For Disaster Recovery (8345)
Ammar Elsayed (Egypt)
FIG Working Week 2016
Recovery from Disaster
Christchurch, New Zealand, May 2–6, 2016
the routes shown in Figure (5). In Fig. (6), the black dots on the map represent debris collection
facility points, or areas where citizens have been instructed to bring debris created during a flooding
episode or perhaps where local recovery volunteers have been instructed to pile debris for later
collection by a large-volume debris collection truck. The dark grey polygons around each debris
collection facility point represent the service area of the debris collection point. A service area, in
the context of Fig. (6), represents a set distance, represented as a polygon, from the debris collection
facility point that can be traveled on the underlying transportation network. In Fig. (6), this set
distance is 1000 meters. This distance, of course, can be changed to whatever distance is required.
The service area can also be defined from the facility point based on a time value opposed to a
distance value. Time might be used in the case of service areas that are time dependent such as, for
example, the speed at which vital medical supplies can be delivered from a hospital or temporary
medical facility.
In addition to the service area polygons that represent a 1000-meter distance that can be
traveled on the underlying road network from the facility points, make note of several other items in
Fig. (6). First, make note of the two service areas that overlap (bottom left of the map) and the light
gray line that goes through the two service areas. This gray line represents the exact boundary
where the two service areas overlap. An important characteristic of the service area–generation
algorithm, showing service area overlaps can be very useful for identifying inefficiencies in service
areas such as the overlapping, redundant service areas like those shown on the bottom left of the
map in Fig. (6). Additionally, the service area–generation algorithm can help to visually identify
service area gaps. For example, the service area shown on the bottom right of the map Fig. (6) has a
somewhat large, open gap between the two service areas that are above and slightly to the right of
the service area on the bottom right. Thus, this analysis could be used to inform decisions about
where to place a new debris collection area that would also be accessible within 1000 meters but do
not overlap with existing services. Also, make note of the service area located in the middle of the
map in Fig. (6). In particular, note how there is a black line running from the bottom left to the
upper right of the right side of this service area. The black line represents a restriction or barrier,
similar to the idea of barriers and restrictions one learned about in the restoring critical
infrastructure section in this chapter and shown in Fig. (6). Much like barriers that can restrict
where routes can go, barriers can also serve to restrict or confine the definition of service areas.
This can serve as a very useful feature, especially in the case of disaster recovery, for ensuring that
relevant situational factors are accounted for when defining service areas. For example, the line
could represent a construction zone, downed power line, or any other type of feature that citizens or
volunteers helping with disaster recovery activities should avoid. Finally, like the routing algorithm
discussed previously, the service area definitions can easily be modified such as moving facility
locations, modifying service boundary destinations, or adding point, line, or polygon restrictions.
Geographic Information Systems and Remote Sensing For Disaster Recovery (8345)
Ammar Elsayed (Egypt)
FIG Working Week 2016
Recovery from Disaster
Christchurch, New Zealand, May 2–6, 2016
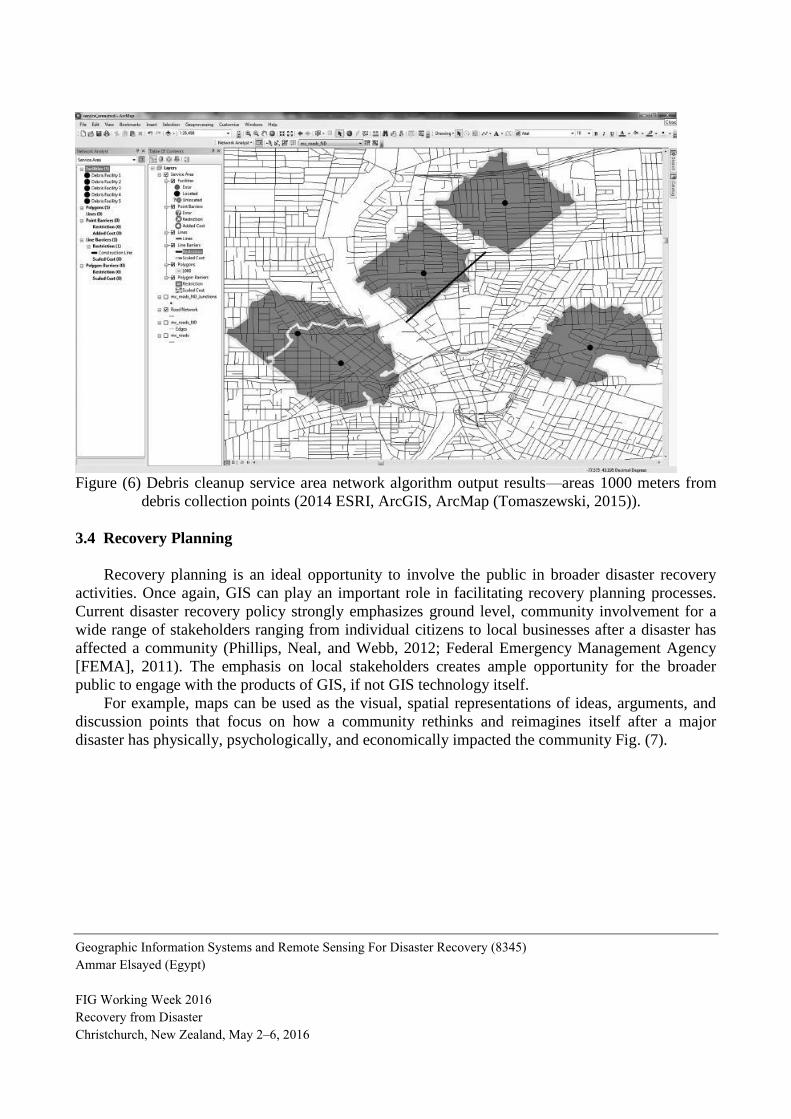
Figure (6) Debris cleanup service area network algorithm output results—areas 1000 meters from
debris collection points (2014 ESRI, ArcGIS, ArcMap (Tomaszewski, 2015)).
3.4 Recovery Planning
Recovery planning is an ideal opportunity to involve the public in broader disaster recovery
activities. Once again, GIS can play an important role in facilitating recovery planning processes.
Current disaster recovery policy strongly emphasizes ground level, community involvement for a
wide range of stakeholders ranging from individual citizens to local businesses after a disaster has
affected a community (Phillips, Neal, and Webb, 2012; Federal Emergency Management Agency
[FEMA], 2011). The emphasis on local stakeholders creates ample opportunity for the broader
public to engage with the products of GIS, if not GIS technology itself.
For example, maps can be used as the visual, spatial representations of ideas, arguments, and
discussion points that focus on how a community rethinks and reimagines itself after a major
disaster has physically, psychologically, and economically impacted the community Fig. (7).
Geographic Information Systems and Remote Sensing For Disaster Recovery (8345)
Ammar Elsayed (Egypt)
FIG Working Week 2016
Recovery from Disaster
Christchurch, New Zealand, May 2–6, 2016
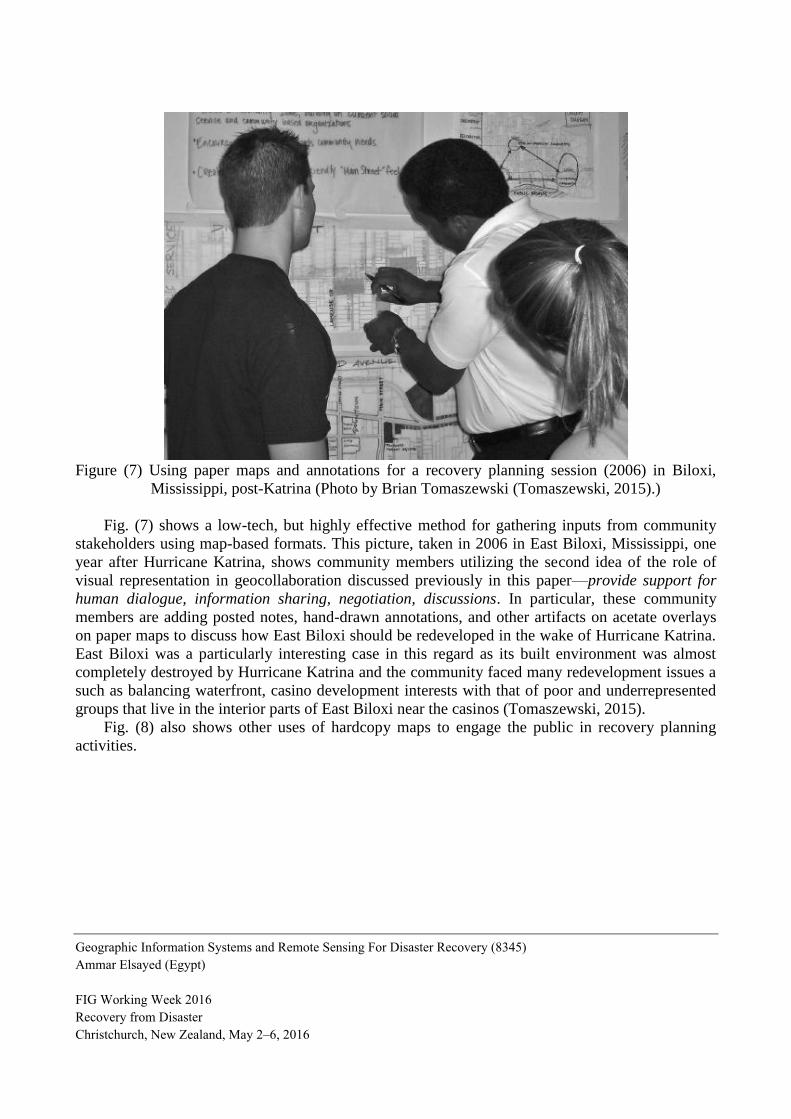
Figure (7) Using paper maps and annotations for a recovery planning session (2006) in Biloxi,
Mississippi, post-Katrina (Photo by Brian Tomaszewski (Tomaszewski, 2015).)
Fig. (7) shows a low-tech, but highly effective method for gathering inputs from community
stakeholders using map-based formats. This picture, taken in 2006 in East Biloxi, Mississippi, one
year after Hurricane Katrina, shows community members utilizing the second idea of the role of
visual representation in geocollaboration discussed previously in this paper—provide support for
human dialogue, information sharing, negotiation, discussions. In particular, these community
members are adding posted notes, hand-drawn annotations, and other artifacts on acetate overlays
on paper maps to discuss how East Biloxi should be redeveloped in the wake of Hurricane Katrina.
East Biloxi was a particularly interesting case in this regard as its built environment was almost
completely destroyed by Hurricane Katrina and the community faced many redevelopment issues a
such as balancing waterfront, casino development interests with that of poor and underrepresented
groups that live in the interior parts of East Biloxi near the casinos (Tomaszewski, 2015).
Fig. (8) also shows other uses of hardcopy maps to engage the public in recovery planning
activities.
Geographic Information Systems and Remote Sensing For Disaster Recovery (8345)
Ammar Elsayed (Egypt)
FIG Working Week 2016
Recovery from Disaster
Christchurch, New Zealand, May 2–6, 2016
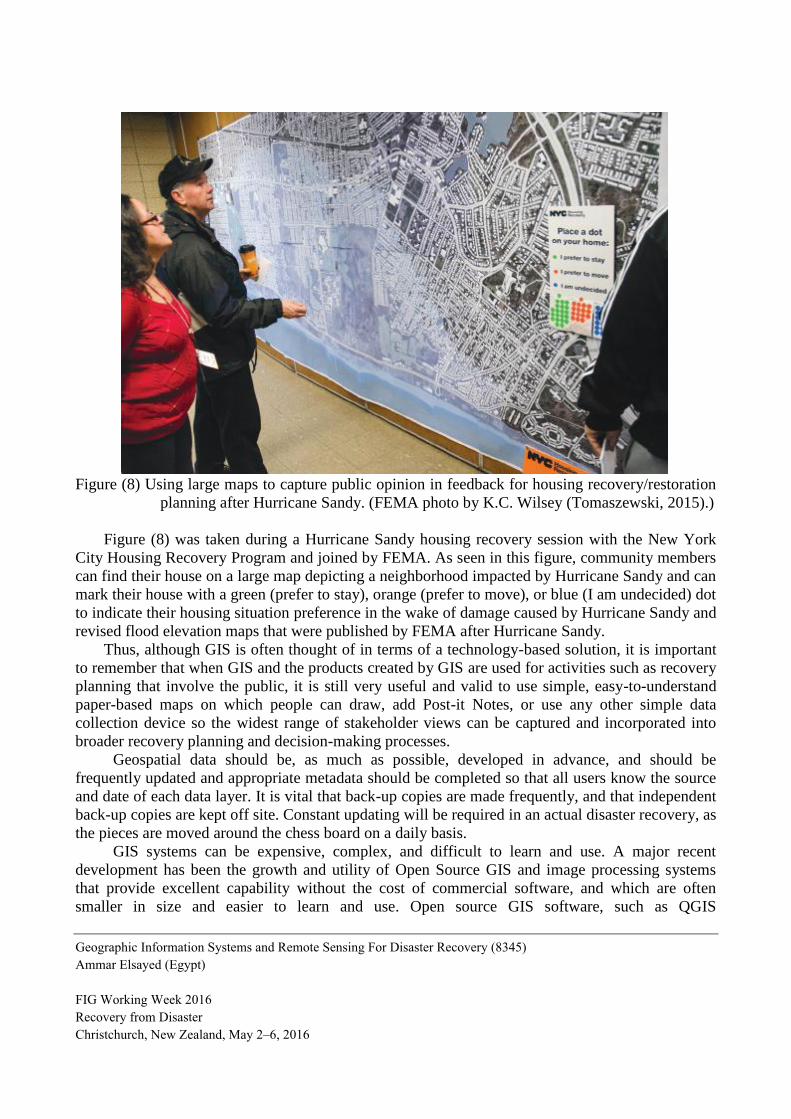
Figure (8) Using large maps to capture public opinion in feedback for housing recovery/restoration
planning after Hurricane Sandy. (FEMA photo by K.C. Wilsey (Tomaszewski, 2015).)
Figure (8) was taken during a Hurricane Sandy housing recovery session with the New York
City Housing Recovery Program and joined by FEMA. As seen in this figure, community members
can find their house on a large map depicting a neighborhood impacted by Hurricane Sandy and can
mark their house with a green (prefer to stay), orange (prefer to move), or blue (I am undecided) dot
to indicate their housing situation preference in the wake of damage caused by Hurricane Sandy and
revised flood elevation maps that were published by FEMA after Hurricane Sandy.
Thus, although GIS is often thought of in terms of a technology-based solution, it is important
to remember that when GIS and the products created by GIS are used for activities such as recovery
planning that involve the public, it is still very useful and valid to use simple, easy-to-understand
paper-based maps on which people can draw, add Post-it Notes, or use any other simple data
collection device so the widest range of stakeholder views can be captured and incorporated into
broader recovery planning and decision-making processes.
Geospatial data should be, as much as possible, developed in advance, and should be
frequently updated and appropriate metadata should be completed so that all users know the source
and date of each data layer. It is vital that back-up copies are made frequently, and that independent
back-up copies are kept off site. Constant updating will be required in an actual disaster recovery, as
the pieces are moved around the chess board on a daily basis.
GIS systems can be expensive, complex, and difficult to learn and use. A major recent
development has been the growth and utility of Open Source GIS and image processing systems
that provide excellent capability without the cost of commercial software, and which are often
smaller in size and easier to learn and use. Open source GIS software, such as QGIS
Geographic Information Systems and Remote Sensing For Disaster Recovery (8345)
Ammar Elsayed (Egypt)
FIG Working Week 2016
Recovery from Disaster
Christchurch, New Zealand, May 2–6, 2016
(http://qgis.org), provide complete GIS, GPS, and remote sensing capabilities in several languages
that run on Windows, Mac, Linux, and even Android tablets (Madry, 2015).
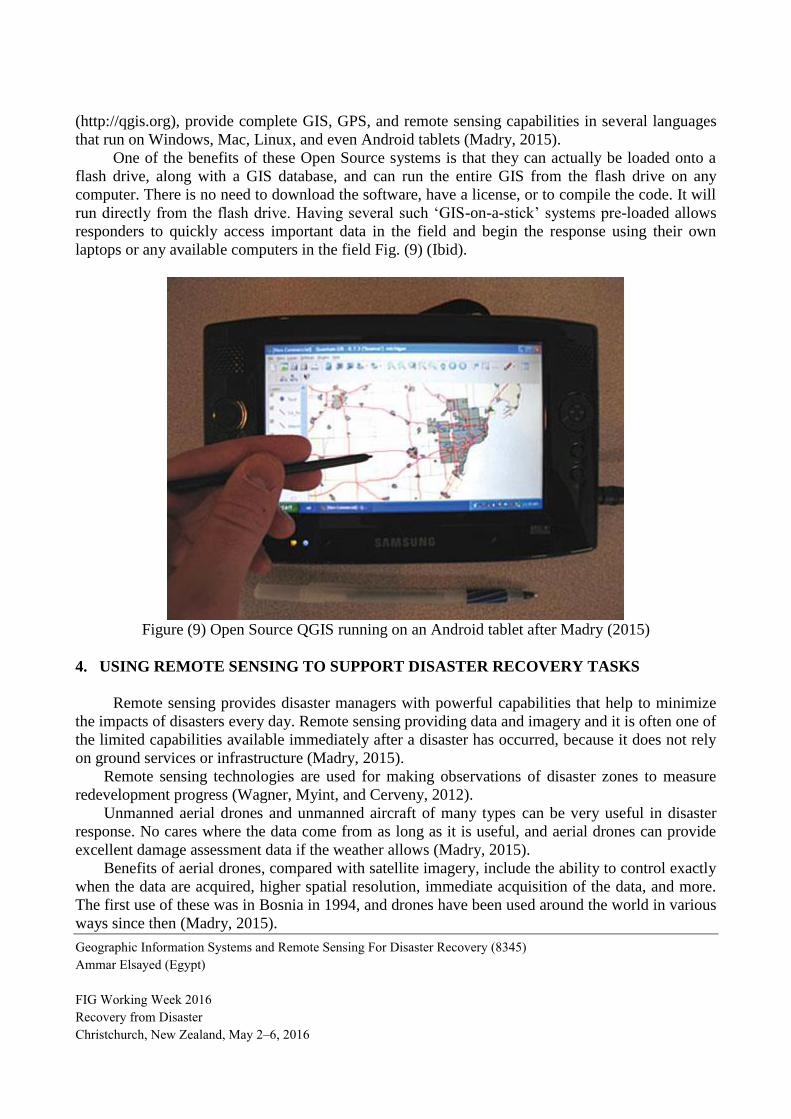
One of the benefits of these Open Source systems is that they can actually be loaded onto a
flash drive, along with a GIS database, and can run the entire GIS from the flash drive on any
computer. There is no need to download the software, have a license, or to compile the code. It will
run directly from the flash drive. Having several such ‘GIS-on-a-stick’ systems pre-loaded allows
responders to quickly access important data in the field and begin the response using their own
laptops or any available computers in the field Fig. (9) (Ibid).
Figure (9) Open Source QGIS running on an Android tablet after Madry (2015)
4. USING REMOTE SENSING TO SUPPORT DISASTER RECOVERY TASKS
Remote sensing provides disaster managers with powerful capabilities that help to minimize
the impacts of disasters every day. Remote sensing providing data and imagery and it is often one of
the limited capabilities available immediately after a disaster has occurred, because it does not rely
on ground services or infrastructure (Madry, 2015).
Remote sensing technologies are used for making observations of disaster zones to measure
redevelopment progress (Wagner, Myint, and Cerveny, 2012).
Unmanned aerial drones and unmanned aircraft of many types can be very useful in disaster
response. No cares where the data come from as long as it is useful, and aerial drones can provide
excellent damage assessment data if the weather allows (Madry, 2015).
Benefits of aerial drones, compared with satellite imagery, include the ability to control exactly
when the data are acquired, higher spatial resolution, immediate acquisition of the data, and more.
The first use of these was in Bosnia in 1994, and drones have been used around the world in various
ways since then (Madry, 2015).
Geographic Information Systems and Remote Sensing For Disaster Recovery (8345)
Ammar Elsayed (Egypt)
FIG Working Week 2016
Recovery from Disaster
Christchurch, New Zealand, May 2–6, 2016
At the very smallest size, micro unmanned aerial vehicles (or MUAVs) have been proposed as
an excellent way to acquire contamination information in disasters involving chemical, biological,
or nuclear materials dispersed into the atmosphere. The rapidly evolving technologies of micro-
aerial vehicles, micro-sensors and related systems are at the extreme low end of the disaster remote
sensing response, but these will continue to be developed. It is likely that new uses will evolve
(Ibid).
One application might be to enter dangerous structures for search and rescue or monitoring
dangerous situations such as nuclear discharges without directly endangering responders. Papers
have been presented that have proposed the use of micro drones to deliver medical supplies or food
in disaster areas and the technologies to do this will continue to develop (Ibid).
REFERENCES
1. Dymon, U. J., and Winter, N. L. (2012) Supporting Emergency Recovery Operations
(Debris Management) Using GIS, Federal Emergency Management Agency (FEMA),
http://training.fema.gov/EMIWeb/edu/docs/hrm/Session%2012%20%20Supporting%20Eme
rgency%20Recovery%20Operations.ppt (accessed March 16, 2014).
2. Emrich, C. T., Cutter, S. L. and Weschler, P. J. (2011) GIS and emergency management, In
The SAGE Handbook of GIS and Society, London: Sage, 321–343.
3. Environmental Systems Research Institute, (2007) GIS for Disaster Recovery, ESRI,
http://www.esri.com/library/brochures/pdfs/gis-for-disasterrecovery.pdf.
4. Federal Emergency Management Agency (FEMA). 2011. National Disaster Recovery
Framework, http://www.fema.gov/national-disaster-recovery-framework.
5. Madry, S. (2015) Space Systems for Disaster Warning, Response, and Recovery,
SpringerBriefs in Space Development, DOI 10.1007/978-1-4939-1513-2. Springer New
York Heidelberg Dordrecht London.
6. Phillips, B. D., Neal, D. M. and Webb. G. R. (2012), Introduction to Emergency
Management, Boca Raton, FL: CRC Press.
7. Stevenson, J. R. , Emrich , C. T., Mitchell, J. T. & Cutter, S. L. (2010) Using Building
Permits to Monitor Disaster Recovery: A Spatio-Temporal Case Study of Coastal
Mississippi Following Hurricane Katrina, Cartography and Geographic Information
Science, 37:1, 57-68, DOI: 10.1559/152304010790588052.
8. Tomaszewski, Brian. 2010. Gecollcollaboration, Encyclopedia of Geography,
http://www.sage-ereference.com/geography/Article_n472.html.
9. Tomaszewski, B. (2015) Geographic Information Systems (GIS) for Disaster Management,
CRC Press, Taylor & Francis Group, 6000 Broken Sound Parkway, NW, Suite 300, Boca
Raton, FL 33487-2742.
10. Wagner, M. A., Myint, S. W. and Cerveny, R. S. (2012) Geospatial assessment of recovery
rates following a tornado disaster, IEEE Transactions on Geoscience and Remote Sensing
50 (11):4313–4322.
Geographic Information Systems and Remote Sensing For Disaster Recovery (8345)
Ammar Elsayed (Egypt)
FIG Working Week 2016
Recovery from Disaster
Christchurch, New Zealand, May 2–6, 2016

BIOGRAPHICAL NOTES
Dr. Elsayed Ammar, acquired his PhD in Surveying engineering (Surveying and
Photogrammetry), from Benha University, Egypt in 2010. He was working in the Egyptian Military
surveying Department in the period from 1987 to 2009 in the mapping group and GIS centre. His
published research on GPR remote sensing has appeared in top scientific conferences such as the
Regional conference on Surveying and Development, and the 14th
International Conference on Civil
Engineering and Geotechnical. Dr. Ammar is currently a lecturer of surveying subjects in the
Department of Civil Engineering at Thebes Higher Institute for Engineering, Thebes Academy. Dr.
Elsayed Ammar research interests in the domains of geomatics sciences and technologies; remote
sensing, photogrammetry, geographic visualization, spatial thinking, and disaster recovery.
Prof. AbdelHalim Mohamed Behairy, acquired his PhD in civil engineering from the City
University, London UK in 1986. Since then he joined the Surveying Engineering Dept. as a lecturer
then assistant professor and then professor in 1999. He was on a leave teaching in the Civil
Engineering Dept., ElMargeb University, Libya from 2007 till 2010. Co-supervised many MSc. and
Ph.D students in both Cairo University and Benha / Zagazig Universities in the areas of analytical
and digital photogrammetry and remote sensing. He has been on a sabbatical leave in the second
half of 2015 to both Carleton and Ottawa Universities, Ottawa, Canada. Prof. Behairy's research
interest lies in digital close range photogrammetry, GPR and remote sensing applications.
CONTACTS
Dr. Elsayed Ammar
Thebes Higher Institute for Engineering, Thebes Academy
Elmaadi, Awel Korneish ElNeil
Cairo
EGYPT
Tel. +201202450030
Fax +
Email: [email protected], eammar59@ gmail.com
Web site:
Prof. AbdelHalim Mohamed Behairy
Shoubra Faculty of Engineering Benha University
Shoubra
Cairo
EGYPT
Tel. +201005630061
Email: [email protected]
Geographic Information Systems and Remote Sensing For Disaster Recovery (8345)
Ammar Elsayed (Egypt)
FIG Working Week 2016
Recovery from Disaster
Christchurch, New Zealand, May 2–6, 2016