Embed Size (px)
Citation preview
J.M. Mironga: GIS and RS in management of shallow tropical lakes- 83 -
APPLIED ECOLOGY AND ENVIRONMENTAL RESEARCH 2(1): 83–103.http://www.ecology.kee.hu • ISSN 1589 1623
© 2004, Penkala Bt., Budapest, Hungary
GEOGRAPHIC INFORMATION SYSTEMS (GIS) AND REMOTE SENSING IN THE MANAGEMENT
OF SHALLOW TROPICAL LAKES
J.M. MIRONGA
e-mail: [email protected]
Deparment of GeographyEgerton University
PO BOX 536, Njoro, Kenya
(Received 11th March 2004; accepted 14th June 2004)
AAbbssttrraacctt.. This paper reviews applications of remote sensing and geographic information systems (GIS)techniques to the assessment of tropical waters. These applications are discussed in the context of specif-ic management objectives and sensors used. The need to monitor the spreading patterns of weeds in thetropical waters, land-use changes in the areas surrounding them, change detection, disappearance of wet-lands, productivity and nutrient status, in order to establish trends and subsequently develop predictivemodels to facilitate effective management, is highlighted. GIS capability can be used to link ecologicalinformation with the management decisions of these waters. Remote sensing provides useful informationin the form of satellite images and aerial photographs that can be integrated and analyzed in a GIS to pro-vide useful spatial information and temporal changes over large geographic areas affecting the structureand function of tropical waters. KKeeyywwoorrddss:: GIS, remote sensing, sustainable management
IInnttrroodduuccttiioonn
Shallow tropical waters play a vital role in many people’s lives and contain remark-able communities of plants and animals. Shallow tropical waters are profoundly affect-ed by their locality and by changes taking place on land, even at great distances fromthem. They are often faced with a number of threats as a result of socio-economic activ-ities, taking place within them and their catchments. Rapid population growth in catch-ment zones has resulted in intensive use of land for farming, deforestation and growth ofurban centers. Consequently, there is accelerated runoff leading to increased silt andnutrients discharge into the shallow tropical waters.
Currently most tropical lakes are being choked by water hyacinth (Eichhornia cras-sipes), which continues to cause severe hardship and immense economic difficulties tomost countries. The pressure on tropical waters from the weed requires intensiveresearch in order to come up with useful suggestions towards their management. It is atthis level that availability of automated, real time data becomes imperative. Remotesensing has developed rapidly to address these needs. The advantage of remote sensingas documented by Richards [64] and Sabins [69] is its ability to capture and record landdetails instantaneously. Its spatial resolution and aerial coverage provide the researcherwith a synoptic view of a land surface. Such data derived from remotely sensed imagesmay be stored efficiently and analysed effectively in a GIS (Risser and Treworgy, [67]).
J.M. Mironga: GIS and RS in management of shallow tropical lakes- 84 -
APPLIED ECOLOGY AND ENVIRONMENTAL RESEARCH 2(1): 83–103.http://www.ecology.kee.hu • ISSN 1589 1623
© 2004, Penkala Bt., Budapest, Hungary
This facilitates analysis of local, regional and inter-regional patterns. Because of its nature, pro-cessing of remote sensing data can also be part of the interpretation process [35, 64, 69, 80].
Before the launch of satellites, remote-sensing activities mainly revolved around theuse of aerial photography. The introduction of digital satellite technology in the1970s hassince stimulated a lot of application researches for the simple reason that digital data arecollected uniformly in time and space, and over large areas. Twenty-seven years havegone since the establishment of this. The principal aim of this paper is to discuss theapplications and, to some extent, limitations of remote sensing and GIS technologies inthe overall monitoring and management of tropical waters. The paper starts with a briefdiscussion of what is meant by remote sensing, and GIS. Fundamental facts about thesetechnologies are discussed. Regular management applications of these techniques arealso highlighted. The degree, to which the problem of invasion of tropical waters byweeds such as the water hyacinth could be investigated using remote sensing and GIScapability, is also examined.
DDeeffiinniittiioonnss aanndd ffuunnddaammeennttaall ffaaccttss
Remote sensing is the acquisition of information about an object, area or event, on thebasis of measurements taken at some distance from it. For the purpose of this discussion,the term is taken to describe the collection and analysis of data made by instruments car-ried in or above the earth’s atmosphere. Such data are obtained as a result of interactionsof electromagnetic radiation with the earth’s surface, measured by airborne or space-borne sensors. The term sensor here refers to a device that detects and measures a radi-ation as a physical parameter and converts it into a form that can be stored or transmit-ted to a receiving system. When electromagnetic radiation falls upon a surface some ofthe energy is absorbed. Some is transmitted through the surface, and some is reflected.Surfaces also naturally emit radiation, mostly in the form of heat (infrared radiation). Itis reflected and emitted radiation that is recorded on either photographic film or a digi-tal sensor. Since the intensity and wavelengths or this radiation are a function of the sur-face in question, each surface is described as possessing a characteristic “spectral signa-ture”. If an instrument can identify and distinguish different spectral signatures, it is pos-sible to map the extent of such surfaces using remote sensing.
The sensors commonly used in tropical areas include passive sensors that collect elec-tromagnetic radiation (visible 0.38-0.75 µm) and infrared (0.76-1,000 µm) which isreflected and emitted from the earth. Since the sun is the source for such radiation datacollection is restricted to daylight hours with clear skies. In contrast active sensors gen-erate their own radiation (e.g. from radar and laser) and measure that which is reflectedback to the sensor. Radar radiation (0.1-10cm) will penetrate cloud cover and is unaf-fected by nightfall. Most satellite are sun-synchronous which means that for any givenpoint on the earth the satellite will pass overhead at the same time of day.
Satellite data can be obtained from international distributors such as the NationalRemote Sensing Centre (NRSC) in the United Kingdom or SPOT IMAGE in France.The potential buyer of remotely sensed data simply has to supply the relevant coordi-nates of an area of interest and request that the image catalog be searched. Airborneremote sensing is far more flexible. Given sufficiently good weather, the user can spec-ify precisely when and where data are to be collected.
J.M. Mironga: GIS and RS in management of shallow tropical lakes- 85 -
APPLIED ECOLOGY AND ENVIRONMENTAL RESEARCH 2(1): 83–103.http://www.ecology.kee.hu • ISSN 1589 1623
© 2004, Penkala Bt., Budapest, Hungary
The following are terms commonly used in remote sensing:1. Spatial resolution is a measure of the area on the ground covered by each sampling
unit (pixel) and is dependent on altitude and sensor design. A whole image may be madeup of millions of pixels, which partly accounts for the large data volume often encoun-tered in remote sensing.
2. Swath width is the total width of the area on the earth’s surface covered by the scan-ner. Together, spatial resolution and swath width determine the degree of detail that isrevealed by the sensor and how large an area is covered.
3. Temporal resolution is the time interval between consecutive overpasses of a fixedpoint by a satellite. Generally, it is the maximum frequency at which imagery of any areacovered by the satellite’s orbit can be obtained.
4. Spectral resolution many sensors collect electromagnetic radiation in several dis-tinct bands and are thus call “multispectral”. Spectral resolution refers to the number andwidth of bands. For example, Landsat Thematic Mapper has seven bands, one of which(band1) records energy between 0.45 and 0.52um (blue light). A sensor with high spec-tral resolution has numerous bands of narrow range.
5. Radiometric resolution refers to the number of digital levels used to express thedata collected by the sensor. The radiometric resolution of Landsat TM is such that thelevel of light intensity recorded for each pixel in each wave band can have a valuebetween 0 (no reflectance) and 255 (100% reflectance), each value being referred to asa digital number (DN).
TThhee UUssee ooff DDiiffffeerreenntt SSeennssoorrssBefore the individual management applications of remote sensing are discussed in
further detail, it is useful to make some general comparisons between each of the sen-sors.
Landsat Multispectral Scanner. The most widely used sensor employed for coastalapplications is Landsat Multispectral Scanner (MSS). This does not necessarily suggest,however, that MSS has been found to be the most desirable sensor. Landsat MSS hasbeen available since 1972 and has supported much fundamental remote sensing work.Although the specifications of Landsat TM and SPOT sensors are superior to that ofMSS for most applications, MSS retains the advantages of offering a long time series anddata that are considerably less expensive than those from either Landsat TM or SPOT.
Landsat Thematic Mapper and SPOT XS. Both Landsat TM and SPOT XS offer goodspatial and spectral resolution and have been applied to a wide variety of objectives.
SPOT Panchromatic and Airborne Multispectral Scanner. Surprisingly the digital sen-sors with the highest spatial resolution, SPOT Panchromatic (SPOT Pan) and AirborneMSS, have not been adopted widely for tropical area applications. To help explain thisapparent anomaly, the problems of inadequate spectral resolution and the high cost ofairborne data will be addressed briefly, although a full discussion of the major con-straints to remote sensing appears at the end of this paper. SPOT Pan Data is limited toa single monochrome band spanning 0.55-0.75 µm. High spatial resolution (10 m) doesnot enable different habitats to be distinguished if their spectral signatures overlap in asingle broad band and are therefore effectively inseparable.
MODIS, one of the most advanced remote sensing instruments built to date, is a mod-erate resolution multispectral imager designed to measure biological and physical
J.M. Mironga: GIS and RS in management of shallow tropical lakes- 86 -
APPLIED ECOLOGY AND ENVIRONMENTAL RESEARCH 2(1): 83–103.http://www.ecology.kee.hu • ISSN 1589 1623
© 2004, Penkala Bt., Budapest, Hungary
processes globally. The ground swath and resolution provide images of every point onearth in a 48 hour cycle. MODIS collects information on surface temperature, concen-tration of chlorophyll, vegetative conditions – including leaf area index, cloud cover andcloud properties, and fire occurrence, size, and temperature. MODIS gathers data fre-quently, measures radiation in 36 spectral bands – the largest range ever, be “on’’ all thetime, and have long-term calibration stability. In contrast to MODIS both Landsat 7 andASTER are high resolution multi-spectral imagers. Data from these instruments gener-ally resembles the high resolution data available from Landsats 4 and 5 France’s SPOT,and India’s IRS-1 satellite.
The sea-viewing Wide Field – of-view Sensor (Sea WiFS) instrument launched inAugust 1997 on the OrbView-2 platform is providing fast, repeated global coverage ofmarine phytoplankton, ocean surface currents, and global climate change, its primaryapplication is commercial and sports fishing, fisheries management, and coastal zonemanagement by state, county and regional planners and managers.
Tropical Rainfall Measuring (TRMM), launched in November 1997, obtains dailyglobal estimates of tropical and subtropical rainfall. TRMM includes the first rain radarin the ESE constellation satellites. TRMM gathers data from the tropics and subtropics(33 degrees north latitude to 35 degrees south latitude).
Aerial photography. It seems that among the available remote sensing technologiesproducing high spatial resolution data, aerial photography has been superior to space-borne data, despite the higher spectral resolution of the latter. However, digital air-bornemultispectral imagery such as the compact air-borne spectrographic imager (CASI) is atleast as accurate as aerial photography for the same purpose and it is less expensive toacquire and therefore more cost-effective [57]. It is also important to proceed in the eval-uation of new scientific applications of more common imaging techniques such as videoand photography from low-flying aircrafts [27, 36].
In space-borne remote sensing, the IKONOS satellite, launched in September 1999,was the first one to challenge the very high spatial resolution data obtained from air-borne remote sensing technology. Compared to aerial photography, which may have aspatial resolution as low as 20 cm, and CASI (resolution: 1 m), IKONOS has a spatialresolution of 1 m for panchromatic imagery and 4 m for multi-spectral imagery, and itsfuture successors are reported to generate images with a spatial resolution of approxi-mately 50 cm [65]. The EROS satellite, launched in December 2000, has a spatial reso-lution of 1.8 m but no multi-spectral capability. However, its future successors arereported to generate multi-spectral imagery combined with a spatial resolution of 0.82 m[25]. In the mean time, the QUICKBIRD satellite, launched in October 2001, leads thequality list of optical remote sensing with panchromatic imagery of 70 cm spatial reso-lution, and multi-spectral imagery of 3 m spatial resolution. Yet, it is not unthinkable thattoo much spatial detail (particularly if combined with a high spectral resolution) mayobscure image analysis, as single image objects such as tree crowns will be character-ized by a large array of pixels featuring internal variation, for instance crown side(sun/shade), leaf age (fresh/senescent), water content, etc. Therefore, it is as important toexplore the construction of both manual identification keys and programmed identifica-tion algorithms that integrate spectral data (cf. ‘tonality’ above), ‘texture’ and ‘structure’analysis. With respect to the spectral resolution, future research should continue to assessthe applications of remote sensing sensors. On one hand, this should be done specifical-
J.M. Mironga: GIS and RS in management of shallow tropical lakes- 87 -
APPLIED ECOLOGY AND ENVIRONMENTAL RESEARCH 2(1): 83–103.http://www.ecology.kee.hu • ISSN 1589 1623
© 2004, Penkala Bt., Budapest, Hungary
ly for the identification of a larger range of organisms; on the other hand, it should con-centrate on a larger range of wavelengths. Vegetation is easier to study because of itsimmobility, and, specifically in remote sensing, because of its characteristic reflectancein the infrared wavelengths due to its photosynthetic pigments.
GGeeooggrraapphhiicc IInnffoorrmmaattiioonn SSyysstteemm ((GGIISS))Geographic Information System (GIS) refers to a system used for storing, manipulat-
ing, and retrieving spatially referenced data. This definition also includes systemsdesigned to capture spatial information and to process it. Data in a GIS are its database,usually composed of data planes derived from different data sources. The combinationof data sets allows data interpretation [95]. A data plane is composed of one data type,for example, digitised elevation data. Digital data may either be in form of written text,maps, tables or photographs.
In order to manage tropical waters effectively it is inevitable that a large amount ofdata is handled. Those involved in the general management of these resources requirerapid access to statistical data and thematic maps. Manual interpretation only allowsintegrating of relatively small amounts of field data, maps and aerial imagery. A GISbrings together spatially referenced statistics and remotely sensed imagery into one inte-grated system. GIS can also be useful in improving information extraction capabilitiesfrom remotely sensed data as outlined by Strahler [86]. The integration of remote-sens-ing into GIS has provided environmental studies with a genuine investigation power[68]. Nevertheless, it is only a potential source of data among others whose use finds itsjustification in the aim to be reached. At the spatial scales at which satellites observe theEarth, one cannot seriously envision to use satellite imagery to monitor the dynamics ofsmall environments on short time-scale, e.g. every 5 years. To detect space changes inthese areas, data-acquisition and-analysis scales must be greater than 1:5 000, with ameasurement precision of 1 meter. Today, numerical orthophotographies or aerialremote-sensing (CASI) can punctually overcome the too low resolution of satellite sen-sors; so, one can use them to monitor tropical shallow lakes.
A GIS must be able to present information to users in a language and format that isnot only accurate, but also graphic and comprehensible to all users. To facilitate urgentresponse from decision-makers in matters related to tropical water management, it isprudent to have a high ratio of maps and diagrams in written text. Such documents con-stitute a visual help essential for field staff, an aid for drawing up inventory as well as amean of information and communication. In a short access time GIS allows one to storedata from various origins, facilitates the design of maps meeting specific needs, e.g.scale, typology, and enables one to spare time in the production information through apossible automation of design. All these characteristics not only increase map produc-tion, but also improve their quality by a better adequacy with the objectives to bereached.
To secure such information, there are six prerequisite stages in a GIS to be followedas detailed by Tomlinson et al., [81] and Jackson [37]: Data acquisition, input and stor-age, processing, output and use.
J.M. Mironga: GIS and RS in management of shallow tropical lakes- 88 -
APPLIED ECOLOGY AND ENVIRONMENTAL RESEARCH 2(1): 83–103.http://www.ecology.kee.hu • ISSN 1589 1623
© 2004, Penkala Bt., Budapest, Hungary
MMaannaaggeemmeenntt aapppplliiccaattiioonnss
The work of Graetz et al., [33] illustrates the existence of two-way flow of informa-tion between remote sensing and GIS, meaning that both can be used in monitoringphysical and chemical variables important in the sustainable management of tropicalwaters. Given the extent of current threats facing tropical waters such as pollution, land-use changes in the areas surrounding them and the disappearance of wetlands, GIS is anessential tool for the process of assessing and monitoring the impact, as well as formanipulating and displaying information essential for their management. In most cases,much of the required data can be made available by remote sensing. Of particular impor-tance is access to remotely sensed images in digital form, which can allow rapid inte-gration of the results of remote sensing analysis into a GIS. The same technologies canalso be used to study productivity and nutrient status of tropical waters in order to devel-op predictive models to facilitate effective management.
The following is a discussion on the main management applications of the said tech-nologies.
EEccoollooggiiccaall iinnffoorrmmaattiioonnRemote sensing can be used to transit the gap between pure science and sustainable
planning and management of any natural ecosystem [42]. GIS capability is used to linksuch ecological information with the management decisions for ecosystems. Remotesensing can provide useful information in the form of satellite images [40] and aerialphotographs [59, 94] that can be integrated and analysed in a GIS environment. Pereiraand Itami [60] have indicated that remote sensing data provide useful spatial informationand temporal changes over large geographic areas. For instance, remote sensing and GIShave emerged to be important tools in the management and inventory of aquatic macro-phyte distributions [1, 11, 13, 16, 17, 29, 38, 91, 92]. These technologies provideresource managers with an efficient method for monitoring plant distributions over largegeographic areas. GIS analysis procedures permit managers to determine changes inmacrophyte distributions over time and to identify critical environmental parametersinfluencing their growth. Models can be created that describe existing relationshipsamong landscape components, predict future plant distributions and assist in makingecologically sound management decisions. Ecological models are generally defined asrepresentations or abstractions of reality. They are used to represent interactions amongecosystem components in order to describe and ultimately understand systems as awhole. Such models can enhance the management of aquatic environments, because sys-tem behaviour can be quantified, analyzed and predicted [78, 84, 58]. An understandingof changes occurring over space as well as time is necessary for models to be useful formanagement purposes [67]. Such models can provide managers with information onboth spatial and temporal responses of systems to proposed management scenarios [20,74].
GIS can assist in modelling procedures by storing and organizing geocoded data atthe landscape level [8]. They can also be utilized to create a specific type of spatialmodel known as a cartographic model [82]. Cartographic models are defined as the log-ical sequencing of map processes, conceptualized as an algebraic solution of equationswhich variables are replaced by data layers and fundamental operations can be combined
J.M. Mironga: GIS and RS in management of shallow tropical lakes- 89 -
APPLIED ECOLOGY AND ENVIRONMENTAL RESEARCH 2(1): 83–103.http://www.ecology.kee.hu • ISSN 1589 1623
© 2004, Penkala Bt., Budapest, Hungary
to perform complex analyses [9, 10, 14, 83]. For example, a cartographic model mightbe created to determine sub-emergent and emergent macrophyte changes between twodifferent dates in any given tropical shallow lake.
Therefore, the use of GIS and remote sensing techniques in the management of trop-ical waters facilitates the linking of ecological information with decision making in aquick and efficient manner. Since environmental degradation is an issue of concern tomany governmental authorities, research institutes, commercial and private enterprises;objective, reliable and comparable information about the status of the environment isinvaluable. Use of GIS and remote sensing technologies will facilitate information flowand thus, help to foster sustainable management of tropical waters without compromis-ing the needs of future generations. Other authors [19, 39, 48, 51] have explained elo-quently how remote sensing can be used as a tool for natural resource management.
WWaatteerr ppllaannttssThere is increased recognition of GIS capability in integrating remote sensing data
and database development to monitor natural resources. This is illustrated by an excel-lent example of a database constructed from aerial photographs, maps, and statisticalinformation, and subsequent development of a lake management information system(LMIS) for monitoring aquatic macrophytes and water quality in the large inland reser-voirs of South Carolina [91]. The construction of this database was aimed at under-standing whether changes in water quality will cause an increase in an already extensiveaquatic plant population of Upper Lake Marion, and promote the spread of undesirablemacrophytes to other parts of the system. The database was used to determine changesover time and relate these to water quality, bathymetry and sedimentation.
Using this same approach, it is possible, for instance, to create an integrated databaseto address the issue of rapid spread of water hyacinth in Lake Victoria, Kenya. Toachieve this, it is imperative that various data sets are structured. These should includeinformation on bathymetry of the lakes, data on water quality, depth, aspect, suspendedsediments, water temperature, wave action and a base map. Maps of vegetation repre-senting changes over years, derived from aerial photographs or satellite imagery, are alsopart of this database. Jensen et al. [38] in most of their work have used Landsat ThematicMapper to map aquatic vegetation.
Once these data sets are ready, the next step is to construct a database in order toanswer the question of ecological relationships between water hyacinth, water qualityand other environmental factors. The data sets should be compatible with each other foreasy correlation, and this can be achieved through the use of software PMAP, availablefrom spatial information systems. At this level, using GIS’s analytical capability, it ispossible to measure the actual aerial coverage of water hyacinth over a tropical watersurface, and identify growth and spreading patterns by performing change detectionanalysis [91] using multi-date imagery. Such information is invaluable in assessing thesuccess of control methods or in establishing environmental impacts of the weed. Thisability to make change studies can be used as long as the ecology of the target species isknown, and is understood to predict the future distribution of such weeds in invadedtropical waters. Several researchers [11, 13, 29, 38, 91] have documented the theorybehind the use of these techniques for monitoring aquatic weeds.
J.M. Mironga: GIS and RS in management of shallow tropical lakes- 90 -
APPLIED ECOLOGY AND ENVIRONMENTAL RESEARCH 2(1): 83–103.http://www.ecology.kee.hu • ISSN 1589 1623
© 2004, Penkala Bt., Budapest, Hungary
This process is, however, likely to face the problem of obtaining cloud-free imagecoverage in all seasons. High spectral resolution airborne multi-spectral scanner data arean option, notwithstanding their acute geometric distortions.
The following is a discussion of a case study by Welch and Remillard [90], demon-strating where remote sensing and GIS technologies have been used to good effect inguiding management of aquatic systems.
GGIISS tteecchhnnoollooggiieess ffoorr aaqquuaattiicc mmaaccrroopphhyyttee ssttuuddiieess
DDaattaabbaassee ddeevveellooppmmeenntt aanndd cchhaannggeess iinn tthhee aaqquuaattiicc eennvviirroonnmmeennttA case in point is the management of Lake Marion, South Carolina. The Lake experi-
ences excessive growth of exotic aquatic macrophytes such as hydrilla (Hydrilla verticil-lata), native species such as Brazillian egeria (Egeria densa) and Water primose (Uduigiauruguagensis). These plants often cover extensive shallow water areas of the lake, blockthe passage of boats, and prohibit swimming and dock access along shorelines.
In order to control these weeds, the South Carolina Water Resources Commission(WRC) in conjunction with South Carolina Aquatic Plant Management Council and theSouth Carolina Department of Health and Environmental Control (DHEC), have appliedherbicides to problem areas of the Lake. However, this effort has proved to be laborintensive and expensive. More cost-effective approaches such as the release of steriletriploid grass carp have been put in place.
It is important that ecological impacts of these practices are monitored, and the man-agement potential of herbicides and grass carp on aquatic macrophytes be evaluated. Itis against such a background that Lake Marion Project was formed with an aim of devel-oping a database and GIS analyses approach to determine spatial and temporal changesin aquatic plant distributions related to herbicide applications. The GIS database forLake Marion included macrophyte distributions for 1972-88, bathymetry, sedimentationand water chemistry. The aim of the database and GIS analyses was to assess changes inthis ecosystem related to the management practices.
MMeetthhooddssTo facilitate GIS analysis of the relatively large study area, Lake Marion was divided
into 2- by 2.5-km map segments, tied to the Universal Transverse Mercator (UTM)Coordinate system. Color infra-red aerial photographs in film transparency format wereinterpreted under magnification with Bausch and Lamb Zoom 70 and SIS 95 instru-ments. Polygons representing the different types of aquatic vegetation were delineatedon clear polyester overlays registered to the photographs. Based on the interpreted aeri-al photos, aquatic macrophyte distribution maps of Lake Marion were produced as1:10,000 and 1:24,000 scale for 72 and 76. These analog maps (72-85) were convertedto digital data compatible with ARC/INFO using the software package, CAPTURE.
The digitized areas were edited and topology developed to create ARC/INFO datalayers. Attribute information for plant species and structural type (emergent and sub-mergent) was input to the relational database, INFO. Herbicide application maps for 83,84 and 85 were also digitized, converted to ARC/INFO format and entered into the LakeMarion database. The herbicide data layers permitted comparisons with vegetationchange over time, for evaluation of herbicide effectiveness in aquatic plant management.
J.M. Mironga: GIS and RS in management of shallow tropical lakes- 91 -
APPLIED ECOLOGY AND ENVIRONMENTAL RESEARCH 2(1): 83–103.http://www.ecology.kee.hu • ISSN 1589 1623
© 2004, Penkala Bt., Budapest, Hungary
Another important component of L. Marion GIS’s database was water quality.Information of levels of nitrogen, phosphorus and dissolved oxygen, sampled at the topand bottom of the water column, and of absolute light and percentage light at I meterdepth, were included in the database because of their potential influence on aquatic plantgrowth. The ARC/INFO Triangulated Irregular Network (TIN) software was used to spa-tially interpolate water quality values by sampling stations. Information on environmen-tal factors potentially influencing the growth of aquatic vegetation included water depthand sedimentation. Water depths at 1.2 m intervals were digitized and entered into thedatabase.
AAnnaallyyssiissData sets for macrophyte distributions (72, 76, 83, 84, 85, 88) and herbicide applica-
tions (83, 84 and 85) within the Lake were analysed using PC ARC/INFO overlay pro-cedures. To determine trends in aquatic plant growth, the vegetation coverages of differ-ent dates were coregistered and the ARC/INFO overlay command UNION used to pro-duce maps depicting changes.
RReessuullttssIn this study, observation of changes indicated that herbicides act as a disturbance to
normal wetland succession. In the absence of herbicide spraying, the normal sequence ofaquatic plant succession was evident (i.e. open water areas being invaded by submer-gents which in turn succeeded to emergent dominance). These ecological finding wasvery useful to the managers of Lake Marion in the evaluation of herbicide for aquaticplant control. The study also demonstrated the effectiveness of herbicides in controllingnuisance macrophyte growth. However, it was found out that the spraying must berepeated annually to maintain clear open water areas in the reservoir. In the absence ofherbicide applications in a single season, the study demonstrated that aquatic plantsquickly reinvaded and proceeded in normal patterns of wetland succession.
SSiiggnniiffiiccaanncceeThis way remote sensing and GIS database technologies have greatly assisted the
managers and ecologists in Lake Marion in assessing ecological impacts of aquatic plantgrowth control on the lake. Further analyses include modeling macrophyte distributionsto predict future plant growth and projecting vegetative responses to proposed manage-ment practices. The GIS procedures have assisted in constructing management plans thatbalance multipurpose uses of the reservoir with ecological stability of the aquatic envi-ronment.
CCoosstt eeffffeeccttiivveenneessssThis procedure was conducted on a suitably equipped IBM PC/AT and inexpensive
GIS software designed to work with databases in raster format. It is an alternative to thecostly minicomputer based GIS systems for inventorying tasks (Table 1, 2).
J.M. Mironga: GIS and RS in management of shallow tropical lakes- 92 -
APPLIED ECOLOGY AND ENVIRONMENTAL RESEARCH 2(1): 83–103.http://www.ecology.kee.hu • ISSN 1589 1623
© 2004, Penkala Bt., Budapest, Hungary
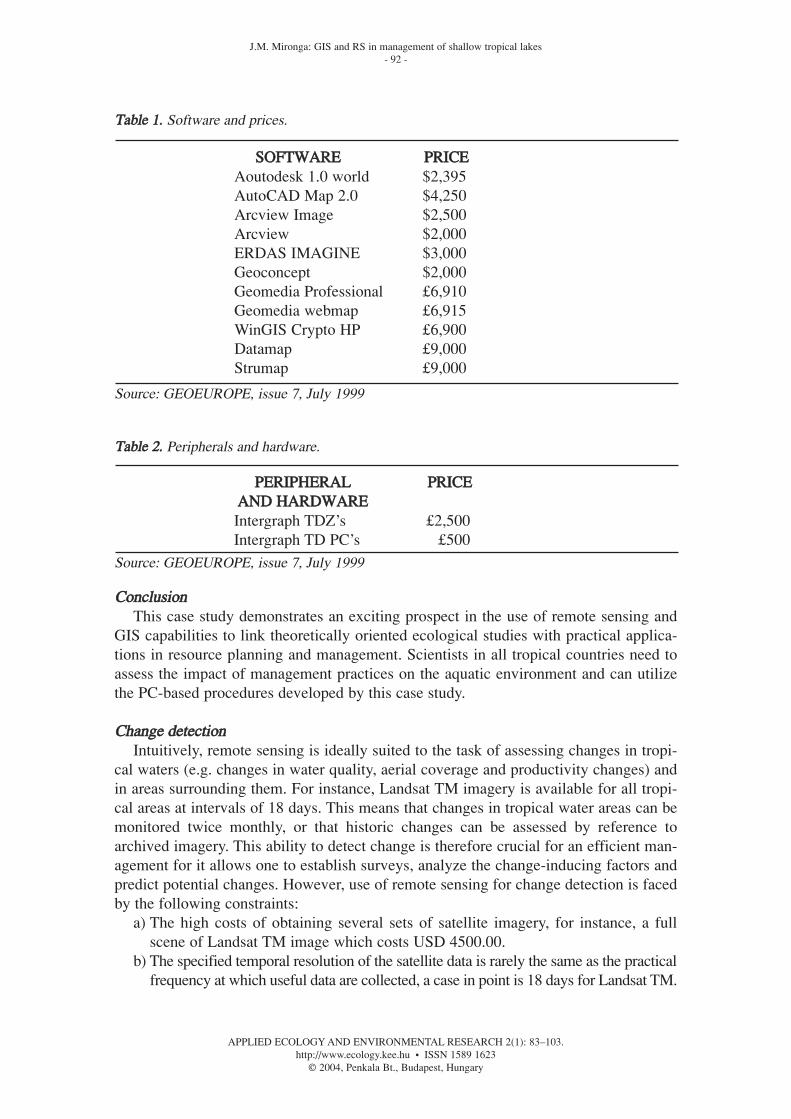
TTaabbllee 11.. Software and prices.
SSOOFFTTWWAARREE PPRRIICCEEAoutodesk 1.0 world $2,395AutoCAD Map 2.0 $4,250Arcview Image $2,500Arcview $2,000ERDAS IMAGINE $3,000Geoconcept $2,000Geomedia Professional £6,910Geomedia webmap £6,915WinGIS Crypto HP £6,900Datamap £9,000Strumap £9,000
Source: GEOEUROPE, issue 7, July 1999
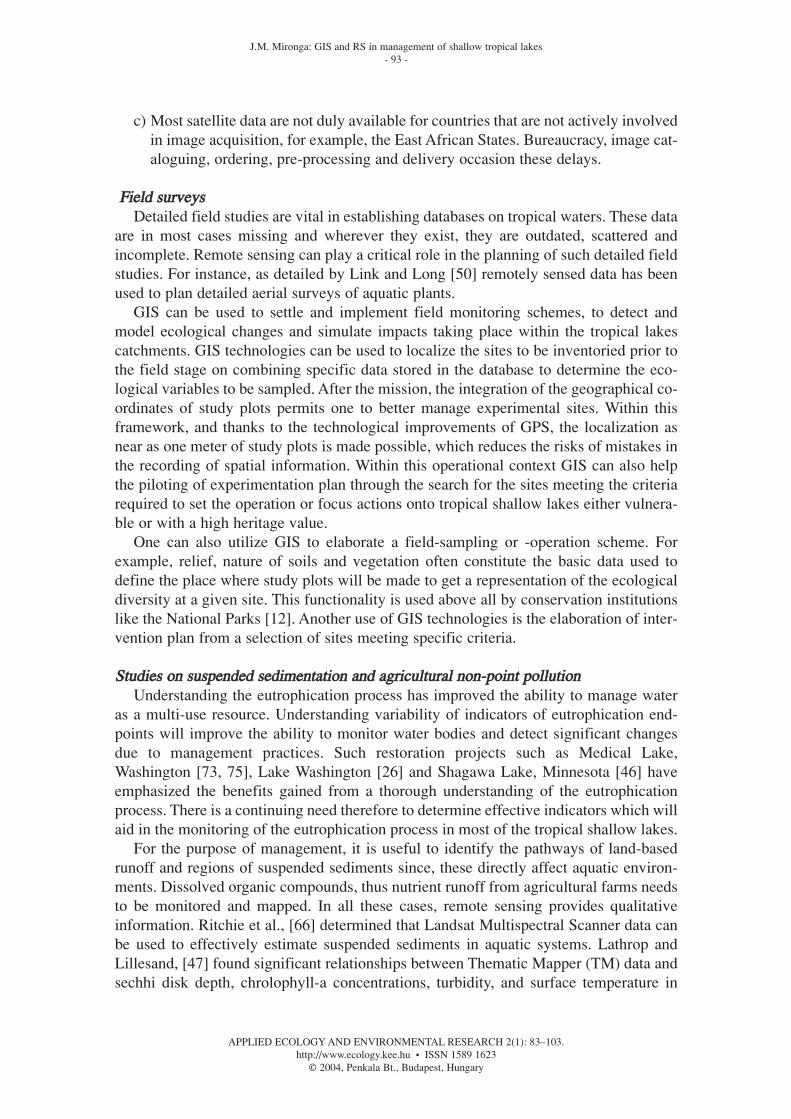
TTaabbllee 22.. Peripherals and hardware.
PPEERRIIPPHHEERRAALL PPRRIICCEEAANNDD HHAARRDDWWAARREEIntergraph TDZ’s £2,500Intergraph TD PC’s £500
Source: GEOEUROPE, issue 7, July 1999
CCoonncclluussiioonnThis case study demonstrates an exciting prospect in the use of remote sensing and
GIS capabilities to link theoretically oriented ecological studies with practical applica-tions in resource planning and management. Scientists in all tropical countries need toassess the impact of management practices on the aquatic environment and can utilizethe PC-based procedures developed by this case study.
CChhaannggee ddeetteeccttiioonnIntuitively, remote sensing is ideally suited to the task of assessing changes in tropi-
cal waters (e.g. changes in water quality, aerial coverage and productivity changes) andin areas surrounding them. For instance, Landsat TM imagery is available for all tropi-cal areas at intervals of 18 days. This means that changes in tropical water areas can bemonitored twice monthly, or that historic changes can be assessed by reference toarchived imagery. This ability to detect change is therefore crucial for an efficient man-agement for it allows one to establish surveys, analyze the change-inducing factors andpredict potential changes. However, use of remote sensing for change detection is facedby the following constraints:
a) The high costs of obtaining several sets of satellite imagery, for instance, a fullscene of Landsat TM image which costs USD 4500.00.
b) The specified temporal resolution of the satellite data is rarely the same as the practicalfrequency at which useful data are collected, a case in point is 18 days for Landsat TM.
J.M. Mironga: GIS and RS in management of shallow tropical lakes- 93 -
APPLIED ECOLOGY AND ENVIRONMENTAL RESEARCH 2(1): 83–103.http://www.ecology.kee.hu • ISSN 1589 1623
© 2004, Penkala Bt., Budapest, Hungary
c) Most satellite data are not duly available for countries that are not actively involvedin image acquisition, for example, the East African States. Bureaucracy, image cat-aloguing, ordering, pre-processing and delivery occasion these delays.
FFiieelldd ssuurrvveeyyssDetailed field studies are vital in establishing databases on tropical waters. These data
are in most cases missing and wherever they exist, they are outdated, scattered andincomplete. Remote sensing can play a critical role in the planning of such detailed fieldstudies. For instance, as detailed by Link and Long [50] remotely sensed data has beenused to plan detailed aerial surveys of aquatic plants.
GIS can be used to settle and implement field monitoring schemes, to detect andmodel ecological changes and simulate impacts taking place within the tropical lakescatchments. GIS technologies can be used to localize the sites to be inventoried prior tothe field stage on combining specific data stored in the database to determine the eco-logical variables to be sampled. After the mission, the integration of the geographical co-ordinates of study plots permits one to better manage experimental sites. Within thisframework, and thanks to the technological improvements of GPS, the localization asnear as one meter of study plots is made possible, which reduces the risks of mistakes inthe recording of spatial information. Within this operational context GIS can also helpthe piloting of experimentation plan through the search for the sites meeting the criteriarequired to set the operation or focus actions onto tropical shallow lakes either vulnera-ble or with a high heritage value.
One can also utilize GIS to elaborate a field-sampling or -operation scheme. Forexample, relief, nature of soils and vegetation often constitute the basic data used todefine the place where study plots will be made to get a representation of the ecologicaldiversity at a given site. This functionality is used above all by conservation institutionslike the National Parks [12]. Another use of GIS technologies is the elaboration of inter-vention plan from a selection of sites meeting specific criteria.
SSttuuddiieess oonn ssuussppeennddeedd sseeddiimmeennttaattiioonn aanndd aaggrriiccuullttuurraall nnoonn--ppooiinntt ppoolllluuttiioonnUnderstanding the eutrophication process has improved the ability to manage water
as a multi-use resource. Understanding variability of indicators of eutrophication end-points will improve the ability to monitor water bodies and detect significant changesdue to management practices. Such restoration projects such as Medical Lake,Washington [73, 75], Lake Washington [26] and Shagawa Lake, Minnesota [46] haveemphasized the benefits gained from a thorough understanding of the eutrophicationprocess. There is a continuing need therefore to determine effective indicators which willaid in the monitoring of the eutrophication process in most of the tropical shallow lakes.
For the purpose of management, it is useful to identify the pathways of land-basedrunoff and regions of suspended sediments since, these directly affect aquatic environ-ments. Dissolved organic compounds, thus nutrient runoff from agricultural farms needsto be monitored and mapped. In all these cases, remote sensing provides qualitativeinformation. Ritchie et al., [66] determined that Landsat Multispectral Scanner data canbe used to effectively estimate suspended sediments in aquatic systems. Lathrop andLillesand, [47] found significant relationships between Thematic Mapper (TM) data andsechhi disk depth, chrolophyll-a concentrations, turbidity, and surface temperature in
J.M. Mironga: GIS and RS in management of shallow tropical lakes- 94 -
APPLIED ECOLOGY AND ENVIRONMENTAL RESEARCH 2(1): 83–103.http://www.ecology.kee.hu • ISSN 1589 1623
© 2004, Penkala Bt., Budapest, Hungary
Green Bay and Central Michigan. Lathrop and Lillesand, [47] also found significant cor-relations of SPOT-1 Multispectral data with the same water quality parameters, with theexception of temperature, not measured by the SPOT-1 system. Both Lillesand et al.[49], using Landsat Multispectral Scanner data, and Wezernak et al., [93], using low alti-tude mulispectral scanner data, determined that remotely sensed data could be used toeffectively predict the trophic status of inland water bodies.
Agricultural non-point source pollution is currently one of the primary concerns intropical water quality. Pollutants generated from agricultural activities are diffuse, sto-chastic and dynamic in nature [5]. In order to protect tropical waters from such pollution,there is need to:
i) Identify the critical areas generating this kind of pollution.ii) Monitor spread patterns, determine the physical and chemical characteristics
facilitating spread.iii) Determine the best management practices, and iv) Construct a comprehensive pollution control plan.This will definitely require a lot of information, which in the long run will pose data
quantity problems. However, studies by Vieux et al., [89] illustrate how different spatialdata sets are combined with such hydrological non-point pollution source data to reducetime and effort required for data input and manipulation. Arnold et al., [3], Srinivassanand Engel ]71] and Mohite et al., [55], give an in-depth description of this approach.Review of this literature reveals that through the integration of simulation models andGIS databases, we should be able to use our tropical waters more efficiently and effec-tively for informed decision making.
PPrroodduuccttiivviittyy mmeeaassuurreemmeennttIn studies of this type, remote sensing can only be used to map the extent of the habi-
tat. In turn this can be related to other aspects like biomass or population size.
LLiimmiittaattiioonnss ooff rreemmoottee sseennssiinngg The use of remote sensing technology in the monitoring and management of tropical
waters is likely to face some limitations as outlined below: • Practical limitations, which are usually inherent in the technology itself, for instance,
the limited ability of light to penetrate in water and atmospheric attenuation.• User limitations referring to difficulties of assessing suitability of certain sensors.
For example, remote sensing tends to provide geomorphological rather than ecolog-ical information on reef structure. This is due to limited spectral and spatial resolu-tion of the sensors, and factors that confound image interpretation such as turbidityand variation in water depth. A more pronounced limitation in the tropics is cloudcover which significantly reduces the number of suitable images [7] to be availableat all seasons. This situation has serious implications on change detection studiesand efforts to relate field data to images.
RReeccoommmmeennddaattiioonnssTropical countries should be encouraged to establish computerized databases to
address the need to integrate data of numerous and complex forms essential for bettermanagement of shallow tropical waters. There is need to carry out tropical water man-
J.M. Mironga: GIS and RS in management of shallow tropical lakes- 95 -
APPLIED ECOLOGY AND ENVIRONMENTAL RESEARCH 2(1): 83–103.http://www.ecology.kee.hu • ISSN 1589 1623
© 2004, Penkala Bt., Budapest, Hungary
agement oriented research using remote sensing and GIS technologies for informeddecision making.
Currently, most researchers that intend to use satellite remote sensing technique intheir works will find it unappealing because it does not provide enough information at afine scale, for example, data on a single tree species in the catchment area (see the casestudy below). There is need to address this through further research in order to under-stand the correlation between image data and ecological systems. Once this is achieved,researchers will be able to make meaningful interpretations of remotely sensed data assoon as they are available.
On the other hand the use of GIS technology in ecological studies is a recent phe-nomenon, and therefore, lacks enough literature [21]. More studies at the ecosystemlevel should be carried out in an attempt to understand the complex interrelationshipsoccurring over large geographic areas. This can be done through use of GIS to aid man-agement decisions.
The following is a case study by Lo and Lee [52], to demonstrate where remote sens-ing and GIS technologies fail to capture the fine details ecologists are interested in.
OOKKeeffeennookkeeee sswwaammpp vveeggeettaattiioonn mmaappppiinngg wwiitthh llaannddssaatt tthheemmaattiicc mmaappppeerr ddaattaa
OKefenokee swamp covers about 167,00 ha in Ware, Charlton, and Clinch counties;Georgia and Baker County. Its climate is humid sub-tropical. The OKefenokee is a freshwater swamp.
In 1980, McCaffrey and Hamiltom mapped the vegetation communities in this freshwater swamp at a scale of 1:63,360 based on an interpretation of 1:30,000 scale colorinfra-red aerial photographs obtained in 1977, as well as field observations. McCaffreyand Hamilton developed a wetland vegetation classification scheme for the Okefenokeeswamp based on a hierarchy of classes, sub-classes and dominance types. The mappingunits defined from aerial photos closely correspond for classes, sub-classes or dominanttypes in this classification system.
In 1994, another research was done to produce a wetland vegetation map covering anarea within the Okefenokee Swamp, using Landsat TM data and a digital approach, at alevel of detail comparable to that of the map produced by McCaffrey and Hamilton fromaerial photography and field observations. To equitably assess the ability of Landsat TMdata and digital image processing to map the vegetation communities within the swamp,two small study areas were carefully selected to represent the full diversity and spatialcomplexity of the vegetation as a whole. An extensive survey of vegetation communitiesfound in these study areas was done.
MMeetthhooddColor infrared aerial photos were interpreted and fieldwork done to produce a vege-
tation map of the area. This formed the basis on which the computer-assisted wetlandvegetation mapping capability of TM data was evaluated using different samplingschemes and a GIS approach.
J.M. Mironga: GIS and RS in management of shallow tropical lakes- 96 -
APPLIED ECOLOGY AND ENVIRONMENTAL RESEARCH 2(1): 83–103.http://www.ecology.kee.hu • ISSN 1589 1623
© 2004, Penkala Bt., Budapest, Hungary
FFiinnddiinnggssThis research revealed that despite the high spatial resolution of the Landsat TM data,
an accurate 21-class vegetation map of Okefenokee swamp could not be produced fromcomputer-assisted digital image classification. The primary reason was the large number ofvegetation classes, which tended to overlap in spectral signatures. This was particularlysevere among heterogeneous classes, which exhibited very similar spectral response pat-terns. It should be noted that the accuracy of such vegetation map could be improved onlyby aggregating the original categories of the vegetation map into few, closely-related veg-etation classes, however, with a considerable loss of detail on the ecological characteristicsof the vegetation communities. Therefore, digital remote sensing data can only be fruitful-ly employed to produce generalized vegetation map of a diverse wetland environment.
IInntteeggrraattiioonn ooff ppaasstt,, pprreesseenntt aanndd ffuuttuurree rreemmoottee sseennssiinngg ssttuuddiieessThe current challenge to remote sensing and GIS-based research on tropical shallow
lakes is to combine data from the past and present in order to predict the future. On onehand, data from the past that were never ground-truthed require a calibration to currentdata, preferably (but not always possible), within the same remote sensing technology[23]. On the other hand it is likely that a long-term or integrative study will combine datafrom different sources. This requires a calibration between technology sensing tech-nologies Discrepancies in post-launch calibrations of certain remote sensing devicesmay cause artefacts such as surface area change [30], and so may the shift from remotesensing one source to another [61, 62]. However, it is possible to integrate cartographicand multi-source remote sensing data into a homogeneous time series.
An important challenge to the sustainable management of ecosystems, whether or nottropical, is the use of GIS in the integration of data originating from ecology, geography,sociology, and other disciplines. For instance, biocomplexity, ethnobiology, demogra-phy, sociology and economics, research fields that are not directly associated with theuse of remote sensing and GIS, can nonetheless often be integrated into such a spatialdatabase [41]. A GIS-based combination of such fields to understand the biocomplexityof certain systems is not common. However, more applied possibilities such as GIS-based (disaster) management now becomes more and more widespread [2, 31, 70, 86].At the level of organising new satellites for improved remote sensing, an emphasisshould be put on international collaboration in order to reduce the cost of the space-bornemissions [5].
CCoonncclluussiioonn It is apparent that there is considerable progress in the use of remote sensing and GIS in
studies related to shallow waters in general. Because of its multi-spectral capabilities,remote sensing seems to be the only method available in presenting a unique perspective forobservation and measurement of bio-physical characteristics of large tropical areas, uni-formly in space and time, and repeatedly. However, there is a need for more comprehensiveapproaches that deal with new remote sensing technologies and analysis in a GIS-environ-ment, and that integrate findings collected over longer periods with the aim of prediction. Itis also imperative to collect and integrate data from different disciplines. These are essentialin the spirit of sustainable development and management, particularly in developing coun-tries. Not only do these countries hold a large part of the world’s biodiversity (particularly
J.M. Mironga: GIS and RS in management of shallow tropical lakes- 97 -
APPLIED ECOLOGY AND ENVIRONMENTAL RESEARCH 2(1): 83–103.http://www.ecology.kee.hu • ISSN 1589 1623
© 2004, Penkala Bt., Budapest, Hungary
from tropical aquatic ecosystems), but also they are the most vulnerable to environmentaldegradation. Several authors [18, 22, 23, 24, 45, 79, 88] provided remote sensing studies rel-evant to the field of sustainable development in tropical developing countries. It should beemphasized that next to technological innovation and multidisciplinary integration there isalso a need for fundamental understanding of the biocomplexity (including human factors)of tropical shallow lakes.
In spite of the advantages of remote sensing and GIS technologies in the managementof tropical waters, there are several limitations that have to be overcome by most coun-tries in order to realize maximum use of these technologies. For instance, many coun-tries have no adequate materials, analytical equipment, computers (software and hard-ware) and imagery. The high cost of materials associated with these technologies isanother problem (Table 1 and 2).
On the other hand, lack of suitably trained staff continues to be one of the most impor-tant factors hampering the development of remote sensing and GIS technologies in trop-ical countries. The situation is aggravated by many countries in the affected regions giv-ing priority to other activities other than these technologies. Thus, a direct effect of con-flicting priorities continues and will in future divert attention from these technologies.
In the long run, these technologies hold the key to the solution of many problems fac-ing tropical waters, and are likely to become the accepted methods in the future. Theyare mainly limited today because of their high operating costs.
AAcckknnoowwlleeddggeemmeennttss.. I wish to thank Dr. Simon Onywere for his invaluable comments on the manuscriptand Sarah Nyatichi Momanyi for her recognition and support.
RREEFFEERREENNCCEESS
[1] Ader, R.R. and J.B Johnston (1982): Analysis of wetland changes on an activeDelta with a geographic information system. – Technical papers of 1982 ASP-ACSM Fall Convention, September 19-23, Hollywood, Florida: 16-27.
[2] Altan, O., Toz, G., Kulur, S., Seker, D., Volz, S., Fritsch, D. and Sester, M. (2001):Photogrammetry and geographic information systems for quick assessment, docu-mentation and analysis of earthquakes – ISPRS Journal of Photogrammetry andRemote sensing 55(5–6), 359–372.
[3] Arnold, J.G., X. Zhuang, B. A. Engel, R. Srinivason, R. Mittiah, and C. Rewertz(1990): Intelligent GIS for natural resource modeling and site selection –Proceedings on remote sensing and GIS applications to non-point source planning,U.S. EPA and Northeastern Illinois Planning Commission, Chicago, Illinois, pp.45-54.
[4] Aspinall, R.J. (1995): GIS: their use for environmental management and natureconservation. Parks 5(1), 20-31.
[5] Bailey, G.W. and R. I.R. Swank (1983): Modeling agricultural non-point sourcepollution: agricultural management and water quality, The Iowa State UniversityPress, Ames, Iowa, pp. 27-47.
[6] Bailey, G.B., Lauer, D.T. and Carneggie, D.M. (2001): International collaboration:the cornerstone of satellite land remote sensing in the 21st century – Space Policy17(3), 161–169.
J.M. Mironga: GIS and RS in management of shallow tropical lakes- 98 -
APPLIED ECOLOGY AND ENVIRONMENTAL RESEARCH 2(1): 83–103.http://www.ecology.kee.hu • ISSN 1589 1623
© 2004, Penkala Bt., Budapest, Hungary
[7] Bainbridge, S.J. (1988): Remote sensing in the ASEAN region: An Australian per-spective. – Proceedings of the symposium on remote sensing of the Coastal Zone.Gold Coast. Queensland, Australia.
[8] Baker, W.L. (1989): A review of models of landscape change – LandscapeEcology, 2(2):111-133.
[9] Berry, J.K. (1982): Cartographic modeling: Procedures for extending the utility ofremotely sensed data. – Proceedings, Pecora VII symposium of Remote Sensing:An Input to Geographic Information systems in the 1980’s October 18-21, SiouxFalls, South Dakota 414-424.
[10] Berry, J.K. (1986): GIS, learning computer-assisted map analysis. – Journal ofForestry, 84(10): 39-43.
[11] Bogucki, D.J., G.K. Gruendling and M. Madden (1980): Remote sensing to mon-itor water chestnut growth in Lake Champlain. Journal of Soil and WaterConservation, 35: 79-81.
[12] Briggs, D.J. and Tantram D.A.S. 1997. Using GIS for countryside management:the experience of the National Parks. Report of Nene Centre for Research(Northampton). Brown, W.W., 1978. Wetland mapping in New Jersey and NewYork. Photogrammetric Eng. and Remote sensing, 44: 303-314.
[13] Brown, W.W. (1978): Wetland mapping in New Jersey and New York. –Photogrammatric Engineering and Remote Sensing, 44(3):303-314.
[14] Burrough, P.A. (1986): Principles of Geographic Information Systems for LandResources Assessment. – Clarendon Press, Oxford 194p.
[15] Bushing, W.W. (1997): GIS-based Gap Analysis of an existing marine reserve net-work around Santa Catalina Island. – Marine Geodesy, 20: 205-234.
[16] Busson, D.E. S.A. Samson and D.C. Rundquist, (1982): The wetlands inventory ofthe Northern Great Plains: An example of operational remote sensing and datamanagement. – Proceedings, Pecora VII Symposium on Remote Sensing: AnInput to Geographic Information Systems in the 1980’s October 18-21, 1981,Sioux Falls, South Dakota: 373-383.
[17] Carter, V., (1982): Applications of remote sensing to wetlands, In: Johannsen, C.J.and J.L. Sanders (Eds), Remote Sensing for Resources Management, SoilConservation Society of America, Ankeny, Iowa: 284-300.
[18] Calzadilla P´erez, A., Damen, M.C.J., Geneletti, D. and Hobma, T.W. (2002):Monitoring a recent delta formation in a tropical coastal wetland using remotesensing and GIS. Case study: Guapo River delta.
[19] Campell, J.B., (1987): Introduction to remote sensing. – Guilford Press, New York.[20] Costanza, R. F.H. Sklar and J.W. Day Jr., (1986): Modeling spatial and temporal suc-
cession in the Athchafalaya/Terrebonne marsh/estuarine complex in South Louisiana.In: D.A. Wolfe (Ed) Estuarine Variability – Academic Press, Inc. New York. 387-404.
[21] Davis, F. W. and J. Dozier, (1988): Information analysis of a spatial database for eco-logical land classification. – Photogrammetric Eng. and Remote Sensing, 56: 605-613.
[22] Dahdouh-Guebas, F. (2002): Remote sensing and GIS in the SustainableManagement of Tropical Coastal Ecosystems. – Environment, Development andSustainability, Special Issue, Kluwer Academic Publishers, Dordrecht, TheNetherlands, Vol. 4(2): 93–112 pp.
J.M. Mironga: GIS and RS in management of shallow tropical lakes- 99 -
APPLIED ECOLOGY AND ENVIRONMENTAL RESEARCH 2(1): 83–103.http://www.ecology.kee.hu • ISSN 1589 1623
© 2004, Penkala Bt., Budapest, Hungary
[23] Dahdouh-Guebas, F. and Koedam, N. (2001): Mangroven, wandelende dijken, –Eos 18(2), 74–80.
[24] De La Ville, N., Chumaceiro Diaz, A. and Ramirez, D. (2002): Remote sensing andGIS technologies as tools to support sustainable management of areas devastatedby landslides, in F. Dahdouh-Guebas (ed.), Remote sensing and GIS. In: theSustainable Management of Tropical Coastal Ecosystems, Environment,Development and Sustainability 4(2), 93–112.
[25] Donnio, J.P., Serra, J.J. and Krebs, G. (2001): The Satellite Encyclopaedia,V0.54.001 – 34th ed, Tag’s Broad-casting Services, Caen, France.
[26] Edmondson, W.T. (1991): The Use of Ecology. – Lake Washington and Beyond,University of Washington Press, Seattle, Washington, 312p.
[27] Eleveld, M.A., Blok, S.T. and Bakx, J.P.G. (2000): Deriving relief of a coastal land-scape with aerial video data. – International Journal of Remote Sensing 21(1), 189-195.
[28] Foster, D.R. (1992): Land-use history (1730-1990) and vegetation dynamics incentral New England, USA. – Journal of Ecology, 80: 753-772
[29] Gilmer, D.S., E.A. Work, Jr. J.E. Colwell, and D.L. Rebel (1980): Enumeration ofPrairie wetlands with Landsat and aircraft data. – Photogrammetric Engineeringand Remote Sensing, 46: 631-634.
[30] Gutman, G.G. (1999): On the use of long-term global data of land reflectances andvegetation indices derived from the advanced very high resolution radiometer. –Journal of Geographical Research 104(6), 6241-6256
[31] Guptill, S.C. (2001): Disease aftershocks – The health effects of natural disasters’,– International GeologyReview 43(5), 419–423.
[32] Goossens, R., Ongena T., d’Haluin E. and Larnoe G. (1993): The use of remotesensing (SPOT) for the survey of ecological patterns, applied to two differentecosystems in Belgium and Zaire. – Landscape Ecology and GIS. Ed. Haines-Young et al., Taylor & Francis: 147-159
[33] Graetz, R.D., R.P. Pech, M. R. Gentle, & J.F O’Callaghan (1986): The applicationof Landsat image data to rangeland assessment and monitoring the developmentand demonstration of a land image-based resource information system (LIBRIS).– Journal of Arid Environments, 10, 53-80.
[34] Hansen, M. (1996): Classification trees: an alternative to traditional land coverclassifiers. – International Journal of Remote Sensing, 17(5): 1075-1081
[35] Harris, R. (1987): Satellite Remote Sensing, an introduction. – Routledge andKegan Paul, London.
[36] Herwitz, S.R. Slye R.E. and Turton, S.M. (1998): Co-registered aerial stereo pairsfrom low-flying aircraft for the analysis of long-term tropical rainforest canopydynamics. – Photogrammetric Engineering and Remote Sensing 20(13), 397-2563.
[37] Jackson, M.J. (1985): Workshop notes for RSS-CERMA workshop on geographicinformation systems: international conference on advanced technology for moni-toring and processing global environmental data. – School of Oriental and AfricanStudies, London.
[38] Jensen, R.J, S. Narumalani, O. Weatherbee, Jr.K.S. Morris, & Jr., H.E., Mackey(1992): Predictive modeling of cattail and waterlily distribution in a South Carolinareservoir using GIS. – Photogrammetric Eng. Remote Sensing, 58: 1561-1568.
J.M. Mironga: GIS and RS in management of shallow tropical lakes- 100 -
APPLIED ECOLOGY AND ENVIRONMENTAL RESEARCH 2(1): 83–103.http://www.ecology.kee.hu • ISSN 1589 1623
© 2004, Penkala Bt., Budapest, Hungary
[39] Jensen, J.R. (1989): Remote Sensing. In: Geography in America, Eds. G.L. Gaileand C.L. Willmott, Columbus, Ohio: Merrill Publishing.
[40] Jensen, J.R., H.E. Mackey, Jr., E.J. Christensen, & R.R. Sharitz (1987): Inland wet-land change detection using aircraft MSS data. – Photogrammetric Eng. andRemote Sensing, 53: 521-529.
[41] Jensen, J.R. and Cowen, D.C. (1999): Remote sensing of urban suburban infra-structure and socio-economic attributes. – Photogrammetric Engineering andRemote sensing 65(5), 611-622.
[42] Johnson, P.L., (1969): Remote sensing in ecology. – University of Georgia Press.[43] Johnston, C.A., Pastor P. and Naiman R.J. (1993): Effects of beaver and moose on
boreal forest landscapes. – Landscape Ecology and GIS. Ed. Haines-Young et al.,Taylor & Francis: 237-254
[44] Kairo, J.G. (2001): Ecology and Restoration of Mangrove systems in Kenya. –PhD dissertation, Vrije Universiteit Brussel, Belgium, 110pp.
[45] Kairo, J.G. Kivyatu, B. and Koedam, N. (2002): Application of remote sensing andGIS in the management of mangrove forests within and adjacent to Kiunga MarineProtected Area, Lamu Kenya. In: F. Dahdouh-Guebas (ed) Remote sensing andGIS in the sustainable management of Tropical Coastal Ecosystems. Environment,Development and Sustainability 4 (2), 93-112.
[46] Larsen, D.P. D.W. Schults, and K.W. Malueg, (1981): Summer internal phospho-rus supplies in Shagawa lake Minnesota. – Limnol. Oceangr, 26: 740-753.
[47] Lathrop R.G. jr. and T.M. Lillesand (1986): Utility of Thematic Mapper data toassess water quality in southern Green Bay and West-central Lake Michigan, –Photogrammetric Engineering & Remote Sensing 52:671-680.
[48] Lillesand, T.M. and R.W. Kieffer (1987): Remote sensing and image interpretation.– 2nd Ed. New York, John Wiley and Sons.
[49] Lillesand, T.M., W.L. Johnson, R.L. Deuell, O.M. Lindestorm and D.E. Meisner(1983): Use of Landsat data to predict the trophic status of Minnessota lakes. –Phogrammetric Engineering and Remote Sensing, 49:219-229.
[50] Link, L.E. and K.S. Long, (1978): Large scale demonstration of aquatic plant map-ping by remote sensing. – Proceedings, twelfth international symposium on remotesensing of environment, Vol. II, Ann Arbor, Michigan, pp 907-915.
[51] Lo, C.P. (1990): Applied remote sensing. – Longman Scientific and Technical,New York, 393 pp.
[52] Lo, C.P. & W.J. Lee (1994): Okefenokee swamp vegetation mapping with LandsatTM data: an evaluation. ASPRS/ACSM.
[53] Maguire, D.J. (1991): An overview and definition of GIS. – Geographical InformationSystem: principles and applications. Ed. Maguire et al., Scientific and Technical: 9-20.
[54] McCaffrey, C.A. and D.B. Hamilton (1980): Okefenokee swamp vegetation map,Scale: 1:84,500. – Institute of ecology, University of Georgia, Athens, Georgia.
[55] Mohite, M.A., D. Whittaker & R. Srinivasan (1993): Knowledge–based systemlinked to AGNPS/GRASS Interface. – ASAE Paper 93-3041, American Society ofAgricultural Engineers, St. Joseph, Michigan.
[56] Moses, E. and Finn J.T. (1997). Using Geographic Information systems to predictNorth Atlantic Right Whale (Eubalanea glacialis) habitat. – Journal of Northw. Atl.Fish. Sci. 22: 37-46
J.M. Mironga: GIS and RS in management of shallow tropical lakes- 101 -
APPLIED ECOLOGY AND ENVIRONMENTAL RESEARCH 2(1): 83–103.http://www.ecology.kee.hu • ISSN 1589 1623
© 2004, Penkala Bt., Budapest, Hungary
[57] Mumby, P.J. Green, E.P. Edwards, A.J. and Clark, C.D (1997): Coral reef habitatmapping how much detail can remote sensing provide? – Marine Biology 130, 193-202.
[58] Mumby, P.J. Green, E.P. Edwards A.J. and Clark, C.D (1999): The cost-effective-ness of remote sensing for tropical coastal resources assessment and management,– Journal of Environmental Management 55(3) 157-166.
[59] Patterson, G.G., & B.A. Davis (1991): Distribution of aquatic water hyacinth in 15Lakes and Streams in South Carolina. – U.S. Geological survey publication #89-4132, Washington, DC.
[60] Pereira, J.M.C. and R. M., Itami (1991): GIS based habitat modeling using logis-tic multiple regression: a study of the Mt. Graham red squirrel. – PhotogrammetricEng. and Remote Sensing, 1475-1486.
[61] Petit, C. and Lambin, E.F. (2001): Integration of multi-source remote sensing datafor land cover change detection. – International Journal of GeographicalInformation Science 15(8), 785-803.
[62] Petit, C. and Lambin, E.F. (2002): Impact of data integration technique on histori-cal land use/land-cover change; comparing historical maps with remote sensingdata in the Belgian Ardennes. – Landscape Ecology, 17(2), 117-132.
[63] Raynal, L., Dumolard P., D’Aubigny G., Weber C., Rigaux P., Scholl M. etLarcena D. (1996): Gérer et générer des données spatiales hiérarchisées. – RevueInternationale de Géomatique, 6(4): 365-382
[64] Richards, J.A. (1986): Remote sensing digital image analysis, – Springer-Verlag,New York, p.281.
[65] Richard, J.A. and Jia, X. (1999): Remote sensing Digital Image Analysis: AnIntroduction, – Springer-Verlag, Berlin, Germany.
[66] Ritchie, J.C. C.M. Cooper and J. Yongqing (1987): Using Landsat multispectralscanner data to estimate suspended sediments in Moon Lake, Mississippi. –Remote Sensing of Environment, 23:65-81.
[67] Risser, P. G. and C.G.Treworgy (1985): Overview of ecological research dataManagement. – Research data management in the ecological sciences, Columbia,University of South Carolina Press.
[68] Robin, M. (1995): La télédétection: des satellites aux SIG. –Nathan Université[69] Sabins, F.F. Jr. (1986): Remote sensing, principles and interpretations. – Second
Edition W.H. Freeman and Company, New York.[70] Salvi, S. Quattrocchi, F. Brunori, C.A. Doumaz, F. Angelone, M, Billi,
A. Boungiorno, F. Funiciello, R. Guerra, M. Mele, G. Pizzino, L and Salvini F. (1999): A multidisciplinary approach to earthquake research: implementation of a geochemical Geographic Information System for the Gargano site, SouthernItaly. – Natural Hazards 20(2-3) 255-278.
[71] Srinivassan, R. and B.A. Engel (1991): Knowledge based approach to extract inputdata from GIS. – ASAE Paper 91-7045, American Society of AgriculturalEngineers, St. Joseph, Michigan.
[72] Steyaert, L.T. and Goodchild M.F. (1994): Integrating geographic information sys-tems and environmental simulation models: a status review. – Environmentalinformation management and analysis: ecosystem to global scales, Ed. Micheneret al., Taylor & Francis: 333-355
J.M. Mironga: GIS and RS in management of shallow tropical lakes- 102 -
APPLIED ECOLOGY AND ENVIRONMENTAL RESEARCH 2(1): 83–103.http://www.ecology.kee.hu • ISSN 1589 1623
© 2004, Penkala Bt., Budapest, Hungary
[73] Scholz, A.T. R.A. Soltero, K.O. Mckee, E. Anderson and K. Vehara (1985):Biomanipulation of a trout fishery and its effect on zooplankton composition, phy-toplankton biovolume, and water quality of medical lake, Spokane country,Washington following restoration by treatment with alum. – Lake ReservoirManage, 1:48-56.
[74] Sklar, F.H. R. Costanza and J.W. Day Jr (1985): Dynamic spatial simulation andmodeling, 29:261-281.
[75] Soltero, R.A., D.G. Nicholas, A.F. Gasperino and M.A. Beckwith (1981): Lakerestoration: medical Lake, Washington. J. Freshwater Ecol., 2:155-165.
[76] Strahler, A.H. (1980) The use of prior probabilities in maximum likelihood classi-fication of remotely sensed data. – Remote Sensing of Environment 10, 135-163.
[77] Soltero, R.A. D.G. Nichols, A.F. Gasperino, and M.A. Beckwith (1981): Lakerestoration Medical Lake Washington. – J. Freshwater Ecol. 2:155-165.
[78] Straskraba, M.W.J. Mitsch and S.E. Jorgensen (1988): Wetland modeling: Anintroduction and overview. In: W.J. Mitsch, M. Straskraba and S.E. Jorgensen(Eds), Wetland modeling, Elsevier publishing Co., Amsterdam: 1-8.
[79] Sulong, I Mohd-Lokman, H. Tarmizi, K. and Ismail A. (2002): Mangrove mappingusing Landsat imagery and aerial photographs: Kemaman District, Terengganu,Malaysia In: F. Dahdouh-Guebas (ed), Remote sensing and GIS in the sustainablemanagement of tropical Coastal Ecosystem Environment, Development andSustainability 4(2), 93-112.
[80] Thomas, I.L., V.M.Benning, & N.P. Ching (1987): Classification of remotelysensed images, Adam Hilger, Ristol.
[81] Tomlison, R.F., H.W. Calkins, & D.E.F. Marble (1976): Computer handling of geo-graphical data: an examination of selected geographical information systems, –UNESCO, Paris.
[82] Tomlin, C.D. (1983): D. Digital Cartographic modeling Techniques inEnvironmental Planning. –PhD Dissertation, Yale University, New Haven,Connecticut: 290p.
[83] Tomlin, C.D. (1990): Geographic Information Systems and CartographicModeling. – Prentice-Hall Company.
[84] Turner, M. and R. Gardner (Eds) (1991): Quantitative Methods in LandscapeEcology, Springer-Verlag, New York: 536p
[85] Ulanowicz, R.E. (1988): On the importance of higher-level models in ecology. –Ecological Modeling, 43(1):45-56.
[86] Venkatachary, K.V. Bandyodhyay, K. Bhanumurthy, V. Rao, G.S. Sudhakar, S. PalD.K. Das, R.K. Sarma U. Maikiam B., Rani, H.C.M. and Srivastava, S.K. (2001):Defining a space-based disaster management system for floods: a case study fordamage assessment due to 1998 Brahmaputra floods. – Current Science 80(3),369-377.
[87] Verheyden, A. (1997): Ruimtelijke analyse van flora and fauna in mangrovege-bieden van SriLanka Luchfotointerpretatie en GIS toepassing in het onderzoeknaar mangrovedynamiek. – M.Sc thesis Biology, Vrije Universiteit Brussel,Brussels, Belgium.
[88] Verheyden, A. Dahdouh-Guebas, F. Thomas, K. De Genst, W. Hettiarachchi, S. andKoedam, N. (2002): High resolution vegetation data for mangrove research as
J.M. Mironga: GIS and RS in management of shallow tropical lakes- 103 -
APPLIED ECOLOGY AND ENVIRONMENTAL RESEARCH 2(1): 83–103.http://www.ecology.kee.hu • ISSN 1589 1623
© 2004, Penkala Bt., Budapest, Hungary
obtained from aerial photography. In: F. Dahdouh-Guebas (Ed), Remote Sensingand GIS in the Sustainable Management of Tropical Costal Ecosystems,Environment, Development and Sustainability 4 (2) 113-133.
[89] Vieux, B.E., L.P. Herndon, & R.L.Liston (1990): GIS and water quality modelingfor agricultural resource management systems. – ASAE Paper 89-2184, AmericanSociety of Agricultural Engineers, St. Joseph, Michigan.
[90] Welch, R. & M.M Remillard, (1992): Integration of GPS, remote sensing and GIStechniques for coastal resource management. – Photogrammetric Eng. and RemoteSensing, 58: 1571-1578.
[91] Welch, R., M.M.Remillard and R.B. Slack (1988): Remote sensing and geographicinformation system techniques for aquatic resource evaluation. – PhotogrammetricEng. and Remote Sensing, 54: 177-185.
[92] Welch, R., M.M.Remillard and J. Alberts (1991): Integrated resource databases forcoastal management. – GIS World, 4(3): 86-89.
[93] Wezernak, C.T., F.J. Tanis and C.A. Bajza (1976): Trophic state analysis of inlandlakes. – Remote Sensing of Environment, 5(3): 147-165.
[94] Wilen, B.O. (1990): U.S. fish and wildlife service's national wetlands inventory, –Federal Coastal Wetland Mapping Programs, U.S. Fish & Wildlife, Biology Report#90, Washington, D.C., 127P.
[95] Young, J.A.T. (1986): A UK geographic information system for environmentalMonitoring: resource planning using remotely sensed data. – Remote SensingSociety Monograph No. 1, Department of Geography, Nottingham University.