Embed Size (px)
Citation preview

Geographic Variation in Health Care and
the Problem of MeasuringRacial Disparities
S42
ABSTRACT In its study of racial and ethnic disparities in health care, the Instituteof Medicine (IOM) concluded that there were large and significant disparities in thequality and quantity of health care received by minority groups in the United States.This article shows that where a patient lives can itself have a large impact on the leveland quality of health care the patient receives. Since black or Hispanic populations tendto live in different areas from non-Hispanic white populations, location matters in themeasurement and interpretation of health (and health care) disparities. There is widevariation in racial disparities across geographic lines: some areas have substantial dispar-ities, while others have equal treatment. Furthermore, there is no consistent pattern ofdisparities: some areas may have a wide disparity in one treatment but no disparity inanother. The problem of differences in quality of care across regions, as opposed toracial disparities in care, should remain the target of policy makers, as reducing qualitydisparities would play a major role in improving the health care received by all Amer-icans and by minority Americans in particular.
*Department of Economics, Dartmouth College, Hanover, NH.†National Bureau of Economic Research, Cambridge, MA.‡Center for the Evaluative Clinical Sciences, Dartmouth Medical School, Hanover, NH.Correspondence:Amitabh Chandra, Department of Economics, 6106 Rockefeller Hall, Dartmouth
College, Hanover, NH 03755.E-mail:[email protected].
This research was funded by NIA grant P01 AG19783-02.The authors are grateful to Douglas Stai-ger and Jack Wennberg for helpful comments.
Perspectives in Biology and Medicine, volume 48, number 1 supplement (winter 2005):S42–S53© 2005 by The Johns Hopkins University Press
Katherine Baicker,*† Amitabh Chandra,*
and Jonathan S. Skinner*‡
06/Baicker/Final/S42–53 12/14/04 6:22 AM Page S42

IN ITS COMPREHENSIVE STUDY OF racial and ethnic disparities in healthcare, theU.S. Institute of Medicine (IOM) concluded that there were large and signif-
icant disparities in the quality and quantity of health care received by minoritygroups in the United States. Explicit in that review is the finding that “manysources—including health systems, healthcare providers, patients, and utilizationmanagers—may contribute to racial and ethnic disparities in healthcare” (Smed-ley, Stith, and Nelson 2003, 10). In this paper, we argue that another key factormust be included in that list: geography.We show that where a patient lives canitself have a large impact on the level and quality of health care the patientreceives. This matters in the measurement and interpretation of health (andhealth care) disparities, since black or Hispanic populations tend to live in dif-ferent areas from non-Hispanic white populations.
Although an earlier study suggested that geography might work in favor oflow income and African American populations because of their closer proxim-ity to inner-city academic medical centers (Kahn et al. 1994), we find a gener-ally different result: that blacks tend to live in parts of the country that have adisproportionate share of low-quality providers. Within those hospitals, bothwhites and blacks tend to receive low-quality care, but since blacks are over-rep-resented in such areas, the quality of the hospital will cause an overstatement ofthe role that race plays in disparities at the level of the health care provider.
A second lesson from our analysis is that racial disparities in health care are alocal phenomenon. Hospitals and regions of the country vary enormously in theextent to which such health care disparities are present; there are health caremarkets that serve large numbers of minorities that do not have disparities, al-though a plurality do.This finding limits the extent to which anecdotal evidenceor even detailed quantitative studies from a given hospital, city, or state may beused to shed light on the larger problem of racial disparities at the national level.Nor is it entirely clear to what extent some regions are systematically worse, orsystematically better, at eliminating health care disparities. In related work, wehave found some regions have small (or no) disparities for one procedure, buthigh disparities for another (Baicker et al. 2003).The weak systematic correla-tion in racial disparities across myriad different procedures undermines the casefor explanations that rely on a “legacy of segregated and inferior healthcare forAfrican Americans” (Smedley, Stith, and Nelson 2003, 103).Alternatively, a morepowerful explanation may lie in the presence of “surgical signatures” in differentareas (Roos and Roos 1981;Wennberg 1990;Wennberg, McPherson, and Caper1984). Surgical signatures refer to the persistent and dramatic differences in therates at which certain surgical procedures are performed in adjacent regions withvery similar patient populations.They are the consequence of the practice pat-terns of individual physicians and the local medical culture regarding a particu-lar treatment. They have not been found to be correlated with patient charac-teristics or differences in physician supply. The idiosyncratic variation in thelocation and size of disparities suggests that future inquiries should investigate
Geographic Variation in Health Care and Racial Disparities
winter 2005 • volume 48, number 1 supplement S43
06/Baicker/Final/S42–53 12/14/04 6:22 AM Page S43

the potential role of a few individual providers, who account for a large propor-tion of the caseload, in generating disparities.
A focus on the geography of heath care will also suggest a different perspec-tive than the conventional wisdom on the role of public policy in mitigating thedeleterious effects of the under-use of health care in some minority populations.Often, interventions are designed to ensure the treatment a patient receives in agiven hospital or by a given provider is independent of the patient’s race. In con-trast, we argue that, in the presence of geographic disparities in health care, poli-cies designed to equalize patients’ treatment within hospitals will not erase dis-parities at the national level, as differences in where minority groups live wouldstill result in large disparities in care.What is necessary to erase health care dis-parities is to implement national policies designed to improve the overall qual-ity of treatment or health of all patients, which in turn will have a dispropor-tionate effect on reducing racial, ethnic, and geographic disparities in health careand health outcomes. Interventions focused on the overall quality of hospitals ina few regions of the country (where a disproportionate share of minorities com-munities are located) could dramatically reduce racial disparities in care.
We certainly do not argue that geographic variations in health care explainthe full amount of the measured racial disparity in care. Indeed, in some casesgeographic variations in health care may even mask existing disparities at thelocal level. Instead, our view is that overall health and health care disparitiesshould be considered to be the sum of two components: (1) unequal treatmentwithin a hospital or by a given provider, and (2) unequal treatment because ofwhere people live. The reason that this distinction is important is because thesources of inequity are quite different: in the first case it is either at the level ofthe health care interaction (whether because of bias by the provider or poor in-formation or preferences of the patient), while in the second case it is related todifferences in where people live, which is dependent on factors such as wage andincome, as well as barriers to housing that are less likely to be associated with thehealth care system per se.
Our analysis proceeds in four sections. First, we establish that the best unit ofanalysis for geographic variations in health care is the geographic area that isserved by a major tertiary care hospital.We formalize this notion by introducingthe concept of a “hospital referral region” (HRR) from the Dartmouth Atlas ofHealth Care (Wennberg and Cooper 1999). Second, we use these HRRs to illus-trate the enormous variation in the quality of care that patients, independent ofrace, receive in different regions of the United States.Third, we show that thereis significant residential clustering by race among these regions, with blacks dis-proportionately represented in the Southeast. Fourth, we use these results toquantify the relationship between geographic variation in health care and themeasurement of racial disparities in care, using as an example eye examinationsfor diabetics in the Medicare population.We conclude with a discussion of thepolicy implications of our research. The degree to which racial disparities are
S44
K. Baicker, A. Chandra, and J. S. Skinner
Perspectives in Biology and Medicine
06/Baicker/Final/S42–53 12/14/04 6:22 AM Page S44
driven by differences in care within regions, as opposed to between regions, hasprofound implications for designing health care policy.
Measuring Geographic Variation in Health Care
Understanding the role that geographic variation plays in driving racial dispari-ties in health care requires a careful delineation of different health care serviceregions. The Dartmouth Atlas of Health Care divides the United States into 306“hospital referral regions” (HRRs). These regions, some of which cross stateborders, are constructed using a complex algorithm of commuting patterns ofpatients to major referral hospitals, and correspond to the level at which care isactually given. More simply, one may think of HRRs as representing local mar-kets for health care, or the geographic level at which “back end” services such ascardiac surgery and end-of-life care are received.The regions are derived fromdata on Medicare beneficiaries, and thus capture the geographic pattern ofwhere beneficiaries go for care.
We use data on residential clustering and the delivery of health care treat-ments by HRR from the Dartmouth Atlas, which is based on Medicare claimsdata. Treatment rates are determined by where the patient lived rather thanwhere he or she received services.Thus if a Medicare enrollee living in Hartford,Connecticut, were admitted to a hospital in Boston, the utilization would beattributed to Hartford, and not to Boston. This means that the variations ob-served at the HRR level are blurred somewhat—since the practice patterns ofBoston hospitals are assigned back to the Hartford HRR—but it avoids thepotentially more serious shortcoming of unusually high utilization rates in largereferral centers such as Boston or Rochester, Minnesota. Analysis at the HRRlevel is preferable to analysis at the city or state level, since it uses the empiricalpattern of patient commuting to determine the geographic boundaries of eachreferral region, rather than assuming that the arbitrary political boundaries ofstates and cities also define the level at which the health care is delivered.
Throughout this paper we rely on data from the Medicare program.There areseveral advantages to using this data. First, the Medicare program is a substantialcomponent of the U.S. health care system that comprises almost 20% of allhealth care expenditures and is regulated by policies designed to influence thedelivery of care. Second, analysis of the Medicare population can dramaticallymitigate the extent to which differences in health insurance contaminate esti-mates of racial disparities in health care.Third, we have a rich data set to drawon, based on tens of millions of patient visits per year.These sample sizes are nec-essary for a comprehensive investigation of race disparities in health care, in orderthat small sample sizes do not affect the quality of the inferences being made.
Geographic Variation in Health Care and Racial Disparities
winter 2005 • volume 48, number 1 supplement S45
06/Baicker/Final/S42–53 12/14/04 6:22 AM Page S45

Geographic Variation in Health Care
We now examine the extent to which geographic disparities affect health careacross hospital referral regions, including the quality of care provided to patientsin different HRRs. The data we use are obtained from the Dartmouth Atlas ofHealth Care and are based on Medicare claims data for 1995–1996 (Wennbergand Cooper 1998).
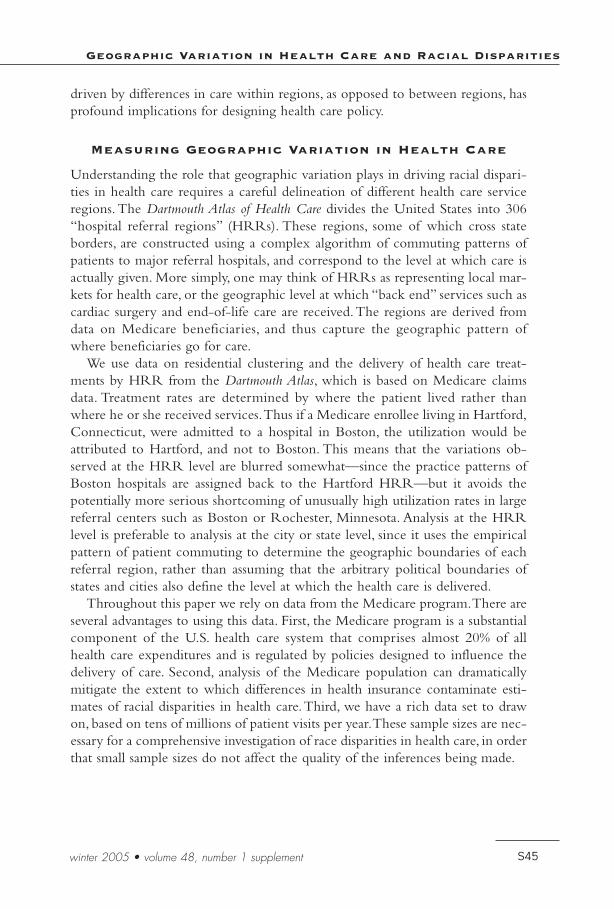
One way to measure the quality of health care provided in a region is the useof low-cost, highly effective procedures that have known medical benefits andare rarely contraindicated. This methodology was pioneered by the MedicareQuality Improvement Organization and is designed to capture interventions andevaluations “for which there is strong scientific evidence and professional con-sensus that the process of care either directly improves outcomes or is a neces-sary step in a chain of care that does so” (Jencks et al. 2000, 1670).As such, detail-ed risk adjustment is less critical, as few patients are contraindicated for theseprocedures (such as the prescription of warfarin for atrial fibrillation or biennialeye examination for diabetics). Following Wennberg, Fisher, and Skinner (2002),we use an “effective care” index of 11 such measures, including the administra-tion of angiotensin-converting enzyme inhibitors, aspirin, and beta-blockersafter heart attacks; mammograms for older women; influenza and flu vaccines;and eye exams and the evaluation of lipid profiles and HbA1c for diabetics.Theuse of these procedures should be relatively insensitive to the preferences andcharacteristics of the population and relatively uniform across areas—most ben-eficiaries should be receiving this care across the country. Nevertheless, we alsoadjust the use of the measures for the age, sex, race, and underlying illness of thepopulation (as reflected by discharges for a number of conditions such as heartattacks, gastrointestinal bleeding, hip fracture, and the like).These adjustments donot affect the results of the analysis.
Figure 1 shows the distribution of the use of effective care across HRRs.Some HRRs use effective care at a much higher rate than others, with the meanuse varying from a low of 30% to a high of almost 60%. Residents in the North-east, for example, are much more likely to get effective care than those in theSouthwest.
What causes this wide geographic variation in the use of cheap and effectivecare that we would argue should be universal? A substantial literature stemmingin large part from the Dartmouth Atlas documents and explores the causes of thisgeographic variation—seen not just in effective care, but in rates of many differ-ent surgical procedures and intensity of treatment (Baicker and Chandra 2003;Baicker et al. 2003; Chandra and Skinner 2004; Fisher et al. 2003a, 2003b;Wenn-berg and Cooper 1999;Wennberg, Fisher, and Skinner 2002). Differences couldstem from historical practice patterns, the slow diffusion of technology, differen-tial supply of specialists and hospital capacity, differences in patient characteris-tics and preferences, or any of a number of other factors. Our analysis does notattempt to discern the root causes of geographic disparities, but rather seeks to
S46
K. Baicker, A. Chandra, and J. S. Skinner
Perspectives in Biology and Medicine
06/Baicker/Final/S42–53 12/14/04 6:22 AM Page S46
establish the importance of these disparities in widespread racial differences inthe quality of care received.
Geographic Clustering by Race
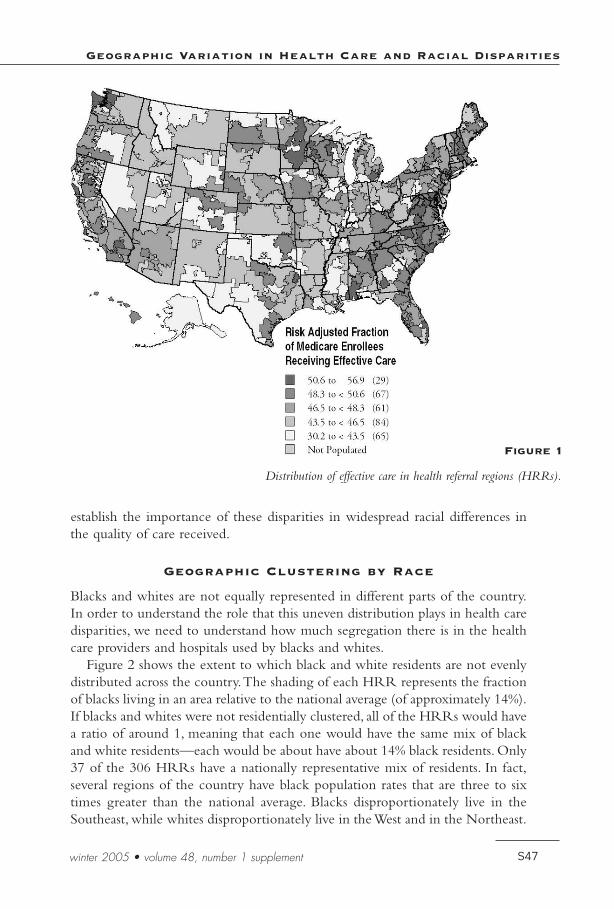
Blacks and whites are not equally represented in different parts of the country.In order to understand the role that this uneven distribution plays in health caredisparities, we need to understand how much segregation there is in the healthcare providers and hospitals used by blacks and whites.
Figure 2 shows the extent to which black and white residents are not evenlydistributed across the country.The shading of each HRR represents the fractionof blacks living in an area relative to the national average (of approximately 14%).If blacks and whites were not residentially clustered, all of the HRRs would havea ratio of around 1, meaning that each one would have the same mix of blackand white residents—each would be about have about 14% black residents. Only37 of the 306 HRRs have a nationally representative mix of residents. In fact,several regions of the country have black population rates that are three to sixtimes greater than the national average. Blacks disproportionately live in theSoutheast, while whites disproportionately live in the West and in the Northeast.
Geographic Variation in Health Care and Racial Disparities
winter 2005 • volume 48, number 1 supplement S47
Distribution of effective care in health referral regions (HRRs).
Figure 1
06/Baicker/Final/S42–53 12/14/04 6:22 AM Page S47

Disentangling Within-Area and Between-AreaRacial Differences in Care
There is a substantial literature documenting racial disparities in health care. Innearly every study,African American or Hispanic patients experience lower lev-els of health care even when high-quality controls for patient risk adjustment areincluded in the analysis (Smedley, Stith, and Nelson 2003). Most previous stud-ies have used national samples, and thus their results represent an average acrossthe many regions in the United States (although some focus on a single area).Having established above both that there is substantial variation in care betweendifferent hospital areas and that there is substantial residential clustering by race,we turn to the role that residential segregation plays in driving observed racialdisparities in health care.
To understand the role of residential segregation in racial disparities, we firstestablish that there are different patterns of care in areas with different racial com-positions. We focus on one particular component of effective care—annual eyeexams for diabetics—as an example.We divide the 306 HRRs into quintiles basedon the fraction of their population that is black, and then examine the fraction of
S48
K. Baicker, A. Chandra, and J. S. Skinner
Perspectives in Biology and Medicine
Relative distribution of blacks in HRRs.
Figure 2
06/Baicker/Final/S42–53 12/14/04 6:22 AM Page S48

patients in these quintiles receiving effective care and other surgical procedures.The 61 HRRs with the highest proportion of black residents are, on average, 22%black, while the 61 with the lowest proportion are less than 1% black.The twohorizontal lines on the graph in Figure 3 report the use of annual eye exams fordiabetics for the average white and average black beneficiary across all quintiles.As Figure 3 shows, a significantly lower fraction of blacks living in the fifth ofHRRs with the most blacks (that is, those areas that are on average 22% black)receive annual eye exams, relative to those living in the fifth of HRRs with thefewest blacks. In other words, the quality of care received by African Americansdeteriorates as the black population in an area increases.The same pattern holdstrue for whites: the rate at which white diabetics receive an annual eye exam fallsas the percentage of blacks in an area increases. In the quintile with the fewestproportion of blacks (areas that are 0.6% black on average), black diabetic patientsreceive eye exams at a slightly higher rate than the average white beneficiary.
This graph highlights the fact that there are disparities in care within HRRs,but that residential segregation increases racial differences.To explore this pointfurther, we examined racial disparities within specific HRRs. Figure 4 showsdata for the 25 HRRs with the greatest number of black residents. More than45% of blacks live in these 25 HRRs. In the Bronx, black diabetics receive eyeexams at a higher rate than do whites. Similarly, there are several HRRs whereracial disparities are small to negligible—for example, in Birmingham,Alabama,Raleigh, North Carolina, and Washington, D.C. On the other hand, HRRs like
Geographic Variation in Health Care and Racial Disparities
winter 2005 • volume 48, number 1 supplement S49
Black-white differences in eye exams for diabetes in HRRs with different percentages of black patients.Notes: Each quintile contains an equal proportion of beneficiaries. Numbers below quintile bars report
the average percent of blacks in the HRRs that comprise the quintile. Horizontal lines report the U.S.rate for white (light line) and black (dark line) beneficiaries.The analysis adjusts for age and sex.
Figure 3
06/Baicker/Final/S42–53 12/14/04 6:22 AM Page S49

St. Louis, Atlanta, and Jackson, Mississippi, have disparities that exceed the aver-age national disparity.Thus, even within cities with a sizeable black community,there are large differences in the degree of disparity between white and blacktreatment: Birmingham and Jackson have large African American populationsand share a history of institutionalized segregation, yet the two areas have re-markable different levels of disparities for the procedure that we have studied.
What is it about some cities that causes them to provide high-quality care toAfrican Americans? Standard explanations that rely on a legacy of discriminationare not borne out by the data, since places such as Raleigh and Birminghamshow almost no racial disparities. For some surgical treatments, the differencesmay arise from one or two surgeons accounting for the majority of proceduresin their region. In other cases, the differences in racial disparities may arise fromspatial “mismatches” of patients and physicians, for example, because of segrega-tion in residential areas, the location of hospital services, or the efficiency of thepublic transportation system. Skinner and colleagues (2003) found that Detroithad one of the largest disparities in knee replacement surgery for both men andwomen, which contrasts with its more positive ranking for eye examinations.
What fraction of the overall difference in the health care that blacks andwhites receive can be attributed to different care within a region, and what frac-tion is attributable to the fact that blacks and whites often live in differentregions? We can decompose the disparities into a within-area component and
S50
K. Baicker, A. Chandra, and J. S. Skinner
Perspectives in Biology and Medicine
Black-white differences in eye exams for diabetes in cities with the largest black populations.Notes:Vertical line indicates the disparity for the typical black beneficiary in the United States.Cities are ranked by the magnitude of racial disparity.The analysis adjusts for age and sex.
Figure 4
06/Baicker/Final/S42–53 12/14/04 6:22 AM Page S50

between-area component graphically, by plotting the white rate along one axisand the black rate along another, as in Figure 5. Each point represents the oneof the 80 largest HRRs in terms of African American population. These 80HRRs account for over 80% of the African American population; the HRRs inthe Figure 5 include those in Figure 4 and additional ones.The five HRRs withthe largest African American populations are Chicago, Detroit, Memphis, NewYork, and Washington, D.C. In HRRs close to the 45-degree line, such as De-troit or Washington, D.C., black diabetics receive annual eye exams at rates equalto whites. In HRRs below the line, such as Chicago, black diabetics receive an-nual eye exams at a lower rate than whites.
The fact that most of the points are below the line shows that, on average,blacks receive eye exams at a lower rate within a local region. If all of the dif-ference in the treatment that blacks and whites receive is driven by different res-idential patterns, and none by differential treatment within a hospital referralregion, then each HRR would be located along the 45-degree line shown onthe graph.We can decompose the national difference in the rate at which blackand white diabetics receive eye exams into the portion attributable to differenceswithin regions and the portion attributable to different residential patterns. Forthis procedure, more than 56% of the racial disparity is attributable to blacks and
Geographic Variation in Health Care and Racial Disparities
winter 2005 • volume 48, number 1 supplement S51
Black-white differences in eye exams for diabetes in cities with the largest black populations.Data from Figure 4 is incorporated.
Figure 5
06/Baicker/Final/S42–53 12/14/04 6:22 AM Page S51
whites living in different hospital markets. Conversely, 44% of the observed dis-parity in eye exams for diabetics is the consequence of blacks and whites beingtreated differently within hospital referral regions. Figure 5 also illustrates aninteresting point regarding the preoccupation with studying disparities as op-posed to noting differences in the levels of care received by race: in HRRs suchas Chicago and Memphis, the white rate is substantially below the black rate inHRRs such as New York.Therefore, whites in Chicago and Memphis would alsobenefit from quality improvements that raise the level of care for all diabetics inthese HRRs.
As long as African Americans continue to live in regions with disproportion-ately low rates of treatment, policies that simply aim to equalize rates within hos-pitals will still result in national disparities in care. Furthermore, such policies donothing to improve the quality of care received by non-black Medicare benefi-ciaries who also reside in areas with low rates of effective care. While it is notour view that the welfare of these (non-black) individuals exceeds that of blackbeneficiaries, it is a mathematical fact that there are more non-black beneficiar-ies than black beneficiaries.As such, policies that target the geographic schism inhealth care, as opposed to a narrow focus on racial disparities, will positively af-fect a greater number of Americans.
Policy Implications
This analysis highlights two important points with significant implications forhealth policy. First, geographic variations in health care are responsible for a sub-stantial component of the observed racial disparity in care, since blacks live dis-proportionately in parts of the country that have low-quality hospitals and pro-viders. Second, there is wide variation in racial disparities: some areas havesubstantial disparities, while others have equal treatment. Furthermore, there isno consistent pattern of disparities—some areas may have a wide disparity in onetreatment but no disparity in another.These facts mean that studies of individ-ual conditions or areas are at best uninformative and at worst misleading fornational policy makers.
There are many barriers to providing high-quality health care to minoritypopulations, particularly in the presence of distrust and poor information sur-rounding health care procedures (Ibrahim et al. 2002). In this paper, we haveargued that even aggressive behavior on the part of regional health providers toimprove the quality of information and access to care at the local level cannoteliminate entirely overall racial or ethnic disparities.The problem of differencesin quality of care across regions should still remain a target of policy makers, asreducing such disparities would play a major role in improving the health carereceived by all Americans in general and by minority Americans in particular.
S52
K. Baicker, A. Chandra, and J. S. Skinner
Perspectives in Biology and Medicine
06/Baicker/Final/S42–53 12/14/04 6:22 AM Page S52

References
Baicker, K., and A. Chandra. 2003. Medicare spending, the physician workforce, and thequality of health care received by Medicare beneficiaries. Manuscript, DartmouthCollege.
Baicker, K., et al. 2003. Racial, ethnic, and geographic disparities in the Medicare popu-lation. Manuscript, Dartmouth College.
Chandra, A., and Skinner, J.S.. 2004. Geography and racial health disparities. NationalBureau of Economic Research.Working Paper 9513. Cambridge, MA.
Fisher, E. S., et al. 2003a.The implications of regional variations in Medicare spending.Part 1: The content, quality, and accessibility of care. Ann Int Med 138(4):273–87.
Fisher, E. S., et al. 2003b.The implications of regional variations in Medicare spending.Part 2: Health outcomes and satisfaction with care. Ann Int Med 138(4):288–98.
Ibrahim, S.A., et al. 2002. Understanding ethnic differences in the utilization of joint re-placement for osteoarthritis. Med Care 40:I44–I51.
Jencks, S. F., et al. 2000. Quality of medical care delivered to Medicare beneficiaries.JAMA 284(13):1670–76.
Kahn, K. L., et al. 1994. Health care for black and poor hospitalized Medicare patients.JAMA 271(15):1169–74.
Roos, N. P., and L. L. Roos. 1981. High and low surgical rates: Risk factors for area res-idents. Am J Publ Health 71:591–600.
Smedley, B. D.,A.Y. Stith, and A. R. Nelson. 2003. Unequal treatment: Confronting racial andethnic disparities in health care.Washington, D.C.: National Academies Press.
Skinner, J., et al. 2003. Racial, ethnic, and geographic disparities in rates of knee arthro-plasty among Medicare patients. N Engl J Med 349(14):1350–59.
Wennberg, J. E. 1990. Small area analysis and the medical care outcome problem. In Re-search methodology: Strengthening causal interpretations of nonexperimental data, 17–206.#PB90-101387. Rockville, MD:Agency for Health Care Policy and Research.
Wennberg, J. E., and M. M. Cooper, eds. 1998. The Dartmouth atlas of health care 1996.Chicago:American Health Association.
Wennberg, J. E., and M. M. Cooper, eds. 1999.The quality of medical care in the UnitedStates: A report on the Medicare program. In The Dartmouth atlas of health care 1999.Chicago:American Health Association.
Wennberg, J. E., E. S. Fisher, and J. S. Skinner. 2002.Geography and the debate overMedicare reform. Health Aff. web exclusive: 96–114.
Wennberg, J. E., K. McPherson, and P. Caper. 1984.Will payment based upon diagnosis-related groups control hospital costs? N Engl J Med 311:295–300.
Geographic Variation in Health Care and Racial Disparities
winter 2005 • volume 48, number 1 supplement S53
06/Baicker/Final/S42–53 12/14/04 6:22 AM Page S53