Embed Size (px)
Citation preview

Geographical factors underlying change in national identity within the
UK
David Owen,Institute for Employment Research,
University of Warwick,Coventry, CV4 7AL, UK.

Structure
• The question of ethnic diversity and identity• Aims of paper• Trends in ethnic composition and national
identity in the UK• Factors underlying national identification• National identity from the 2011 Census• Geographical patterns of identity and the role of
ethnicity• Conclusions
Background – ethnic diversity and identity
• In recent decades, the ethnic composition of the UK has changed rapidly, largely as a result of high international net in-migration.
• Over the same period, surveys have shown that the attachment of people to a British identity has declined.
• Commentators such as David Goodhart have argued that much of the organisation of British society and economy (e.g. the welfare state) is predicated on the idea that the population of the country represents a community with interests in common and that recent population trends had undermined this. He argued that a conflict is developing between diversity and shared values and solidarity.
• The role of the UK state has been challenged by both membership of the European Union and devolution of political power to nations within the UK.
• Within these trends, the growing ethnic diversity of the population can influence national identity through two mechanisms:
– by changing the way in which people from majority ethnic groups perceive the nation and identify with it, and;
– through differences in the perception of the nation and identification with it by migrants and people from minority ethnic groups.
Aims of the paper
• To discuss whether there is a decline in attachment to British identity
• To examine the role of increased ethnic diversity• To explore geographical variations in the expression of
British and other national identities within England and Wales, using the 2011 Census of Population.

Migration and change in the ethnic composition of the UK population, 1991-2010
• Over the period from 1991, net international migration to the UK increased steadily.
• This period has seen migration from all areas of the world increase.
• The minority ethnic group population of the UK increased at an increasing rate over the period 1994-2010, with the most rapid increase in n “Other” ethnic groups.
• The rate of growth of ethic groups with origins in the New Commonwealth has been slower.
• The diversity of the population has also increased, as measured by the country of origin of the population.
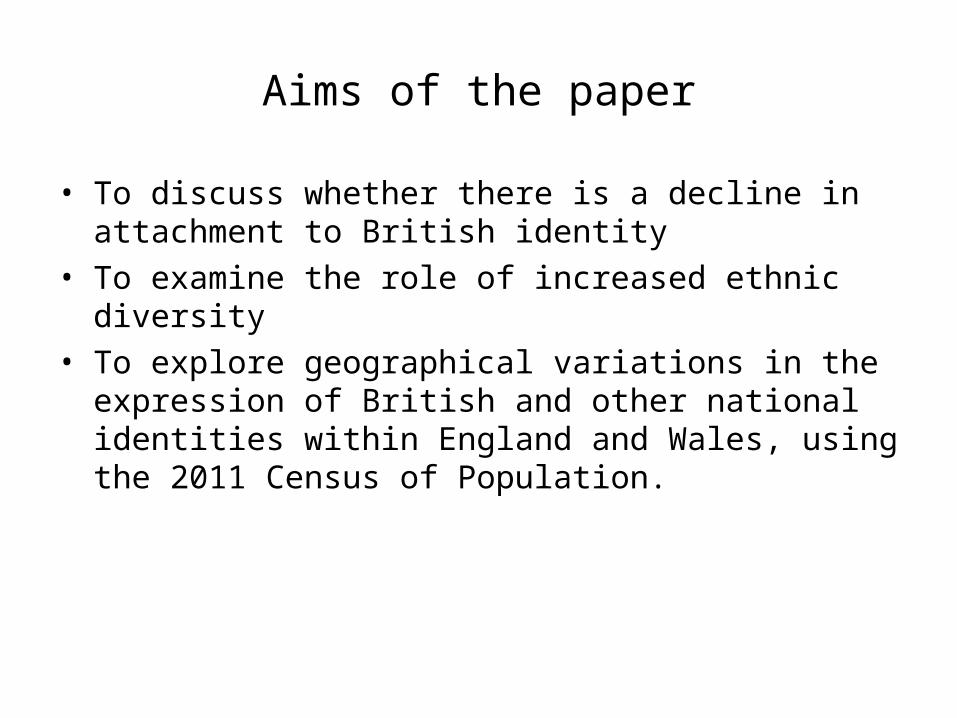
Trends in attachment to Britain or England
• The British Social Attitudes Survey reveals that about two-thirds of people say they “feel British”, and this has changed little since the mid-1990s.
• Since the 1970s, the percentage of people who describe themselves as British in preference to other forms of national identification has declined, while the percentage who describe their identity as being ‘English’, ‘Scottish’ or ‘Welsh’ has increased.
• The British Social Attitudes Survey shows that the percentage of people in England who describe themselves as British but not English or more British than English declined between 1997 and 2012.
• The percentage of people attached to an English identity grew much more strongly over this period.
0
10
20
30
40
50
60
70
80
90
100
1997
1999
2000
2001
2003
2007
2008
2009
2011
2012
British not English
More British than English
Equally English and British
More English than British
English not British
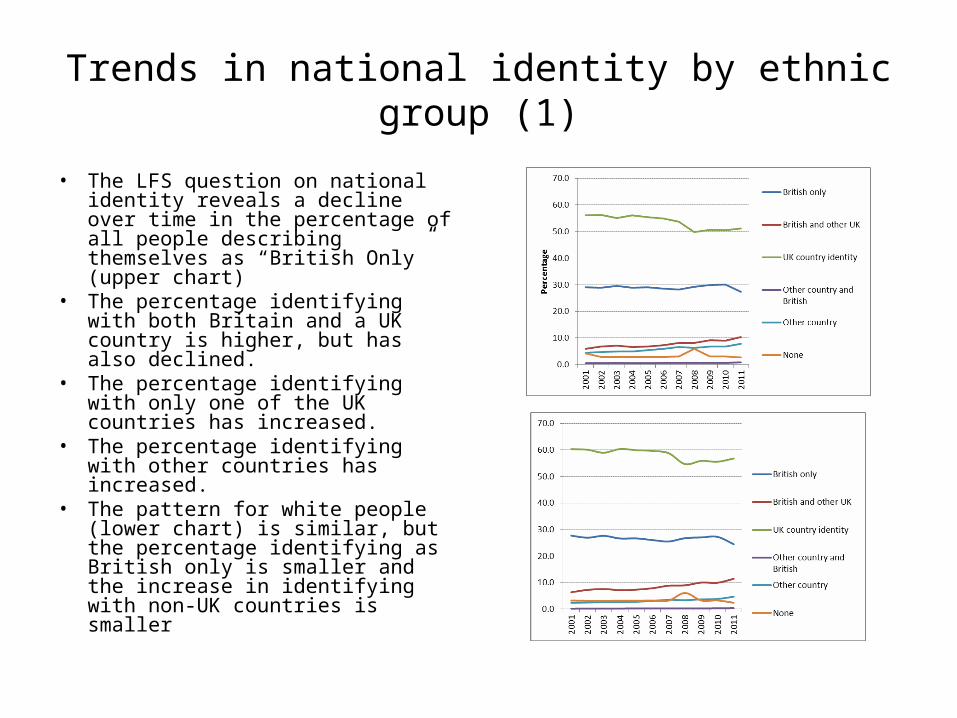
Trends in national identity by ethnic group (1)
• The LFS question on national identity reveals a decline over time in the percentage of all people describing themselves as “British Only” (upper chart)
• The percentage identifying with both Britain and a UK country is higher, but has also declined.
• The percentage identifying with only one of the UK countries has increased.
• The percentage identifying with other countries has increased.
• The pattern for white people (lower chart) is similar, but the percentage identifying as British only is smaller and the increase in identifying with non-UK countries is smaller

Trends in national identity by ethnic group (2)
• However, the percentage of people from minority ethnic groups identifying as British is much higher than for white people.
• Even so, there is a small decline over time.
• The percentage identifying with a country within the UK is declining
• The percentage identifying with a non-UK country is increasing.
• These trends are more pronounced for the South Asian population.
• Bangladeshi and Pakistani people are more likely to identify with Britain than Indian people.
• Black people are slightly less likely to identify with Britain.

Belonging to Britain
• The Citizenship Survey asked a number of questions about national identity and community cohesion.
• The upper chart reveals that there is little difference between ethnic groups in the degree of their attachment to Britain (the Other ethnic groups display the lowest percentages).
• However, the lower chart shows that for many minority ethnic groups, this does not equate to accepting British lifestyles.
• A relatively high percentage feel it is possible to belong fully to Britain while maintaining a separate cultural or religious identity.
• This seems to give support to Goodhart’s concern that ethnic diversification may weaken the acceptance of common values.

Identifying factors underlying national identity• A mutinomial logistic regression
model was estimated for people identifying as British, with one of the UK countries, with both, with a non-UK country and both with Britain and a non-UK country over the period 2001-2011.
• Data source was the LFS and all odds ratios are statistically significant at the 5% level.
• Independent variables were a time-trend, gender, age, social class, ethnic group and migrant origin.
• The model accounted for around a third of the variation in the data.
Independent Variable Dependent variable (Base category= no national identity).
British only British and other UK country
UK country only
British and other
country
Other country
Time trend 0.998 1.048 0.989 1.022 1.002
Gender (base-female)
Male 0.915 0.927 1.013 0.841 0.932
NS-SEC (base=unemployed or never worked)
Higher managerial and professional 3.049 2.633 1.906 3.927 2.858
Lower managerial and professional 2.166 1.895 1.639 2.582 1.803
Intermediate occupations 1.950 1.791 1.717 1.952 1.554
Small employers and own account workers 1.295 1.219 1.242 1.425 1.306
Lower supervisory and technical 1.595 1.593 1.758 1.480 1.411
Semi-routine occupations 1.394 1.447 1.531 1.205 1.257
Routine occupations 1.199 1.313 1.447 1.029 1.298
Age group (base=aged 85 or more)
Aged under 20 0.591 0.462 0.461 0.908 1.312
Aged 20-29 0.451 0.415 0.356 0.640 1.568
Aged 30-39 0.489 0.435 0.354 0.590 1.270
Aged 40-49 0.537 0.443 0.388 0.529 0.960
Aged 50-59 0.600 0.502 0.459 0.561 0.802
Aged 60-69 0.631 0.593 0.584 0.552 0.656
Aged 70-84 0.819 0.855 0.833 0.662 0.774
Ethnic group (base=Other ethnic group)
White 0.217 1.875 1.467 0.060 0.081
White and Black Caribbean 3.090 11.561 9.442 2.388 2.060
White and Black African 1.318 5.455 3.031 0.956 1.103
White and Asian 1.245 2.843 3.110 1.061 0.893
White and other 1.344 4.312 2.841 1.327 0.994
Indian 2.072 1.538 1.178 1.945 1.079
Pakistani 3.559 2.833 1.951 3.830 1.238
Bangladeshi 4.333 1.349 1.476 3.882 1.286
Other Asian 0.910 0.882 0.695 0.649 0.474
Black-Caribbean 4.186 5.496 4.232 4.655 2.052
Black-African 1.665 1.097 1.136 1.609 0.789
Black-Other 4.122 16.550 4.268 1.955 1.756
Chinese 0.497 0.714 0.528 0.373 0.333
UK-born 3.157 9.068 2.878 0.145 0.011
Migrant with UK nationality 10.120 7.534 2.229 2.700 0.239
Dummy variables
2001 or 2008 0.944 0.924 0.916 0.820 0.877
Living in Scotland 12.119 20.009 29.561 12.764 14.217
Source: Labour Force Survey.

Summary of findings from regression model
• Identification with Britain declined over the period.• Men had weaker identification with Britain than women.• All forms of national identification were stronger in Scotland.• Young adults were least likely to identify as British, while older
people were more likely to do so.• People from higher status occupational groups were more likely to
identify with Britain, while people in lower status occupations were least likely to identify with Britain.
• People from minority ethnic groups, particularly Bangladeshi and Pakistani people, were most likely to identify with Britain.
• Migrants with British nationality were relatively more likely to identify with Britain.

National identity and ethnic group in England, 2011 Census
• In England, the percentage of white people who identify with Britain rather than England is well below the average. Two-thirds identify themselves as being “English only”.
• In contrast, nearly half of people from minority ethnic groups identified themselves as being “British only”, but less than a fifth “English only”, and only an eighth had a primary identity outside the UK.
• Bangladeshi and Pakistani people are most likely to identify themselves as being “British only”.
• A relatively high percentage of people from Other White, Chinese, Other, Arab and Black-African people identify with a non-UK country.
• People of mixed parentage are more likely to identify with Britain than white people, but less likely to do so than people from the other ethnic group in their origin.
Ethnic Group
All categories: National identity % share
% british only
% english only
% other uk identity
% non UK only
All categories: Ethnic group 53,012,456 100.0 19.2 60.4 2.2 8.2White 45,281,142 85.4 14.1 67.6 2.5 5.2White: UK 42,279,236 79.8 14.3 71.8 2.6 0.3White: Irish 517,001 1.0 17.0 12.6 4.4 61.1White: Gypsy or Irish Traveller 54,895 0.1 9.1 68.0 3.0 13.7White: Other White 2,430,010 4.6 10.5 5.6 0.2 77.5Minority ethnic groups 7,731,314 14.6 48.9 18.4 0.3 26.2Mixed 1,192,879 2.3 30.9 46.5 0.8 12.4White and Black Caribbean 415,616 0.8 24.7 63.0 0.6 3.3White and Black African 161,550 0.3 30.4 37.6 0.7 22.6White and Asian 332,708 0.6 36.3 41.0 0.9 11.4Other Mixed 283,005 0.5 34.0 33.8 0.8 21.1Asian or Asian British 4,143,403 7.8 55.7 11.4 0.2 27.3Indian 1,395,702 2.6 58.1 12.1 0.2 24.4Pakistani 1,112,282 2.1 62.8 15.3 0.2 15.6Bangladeshi 436,514 0.8 71.6 8.0 0.2 15.6Chinese 379,503 0.7 38.2 8.7 0.4 47.9Other Asian 819,402 1.5 41.6 8.0 0.2 44.8Black ort Black British 1,846,614 3.5 47.7 17.9 0.2 28.4Black African 977,741 1.8 43.4 10.2 0.2 41.2Black Caribbean 591,016 1.1 54.9 26.4 0.2 12.1Other Black 277,857 0.5 47.6 26.6 0.3 18.2Other 548,418 1.0 40.9 11.5 0.3 40.7Arab 220,985 0.4 39.8 10.7 0.3 43.1Any other ethnic group 327,433 0.6 41.6 12.1 0.3 39.0

People describing themselves as British-OnlyThe percentage of people describing their national identity as British Only is presented.
Key features:
•The highest percentage of people who describe themselves as British Only is highest in London and neighbouring districts to the north and west, in the east Lancashire/West Yorkshire areas, in the West Midlands, the cities of the East Midlands in England.
•This percentage is also high in eastern Wales and the urbanised area of south-east Wales.
•This percentage is very low in much of rural England, notably on the eastern half of England.
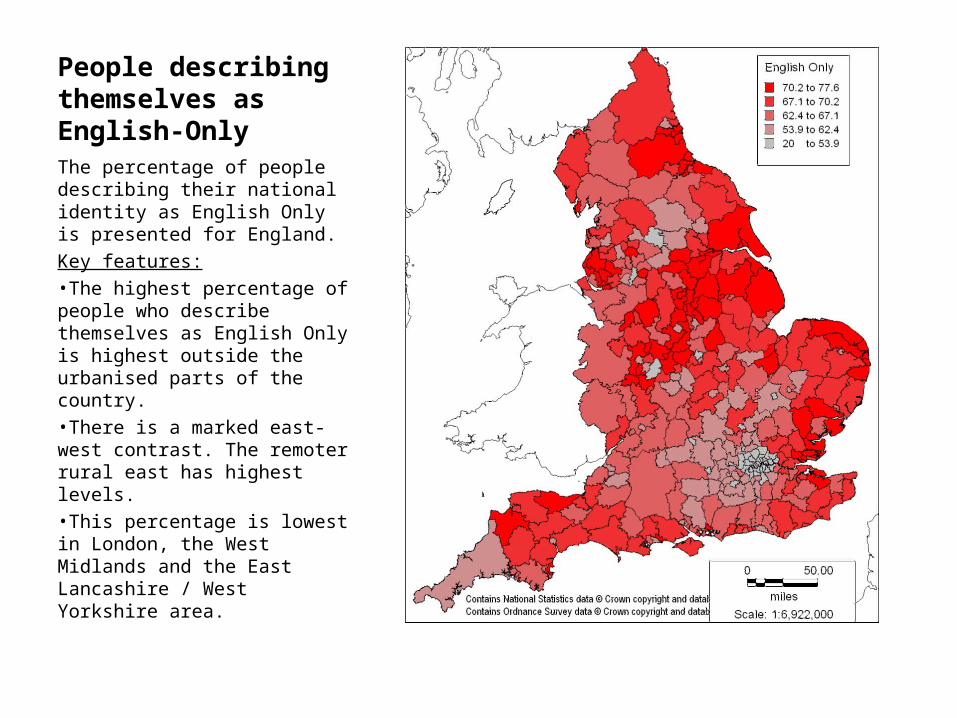
People describing themselves as English-OnlyThe percentage of people describing their national identity as English Only is presented for England.
Key features:
•The highest percentage of people who describe themselves as English Only is highest outside the urbanised parts of the country.
•There is a marked east-west contrast. The remoter rural east has highest levels.
•This percentage is lowest in London, the West Midlands and the East Lancashire / West Yorkshire area.
The geographical expression of national identity
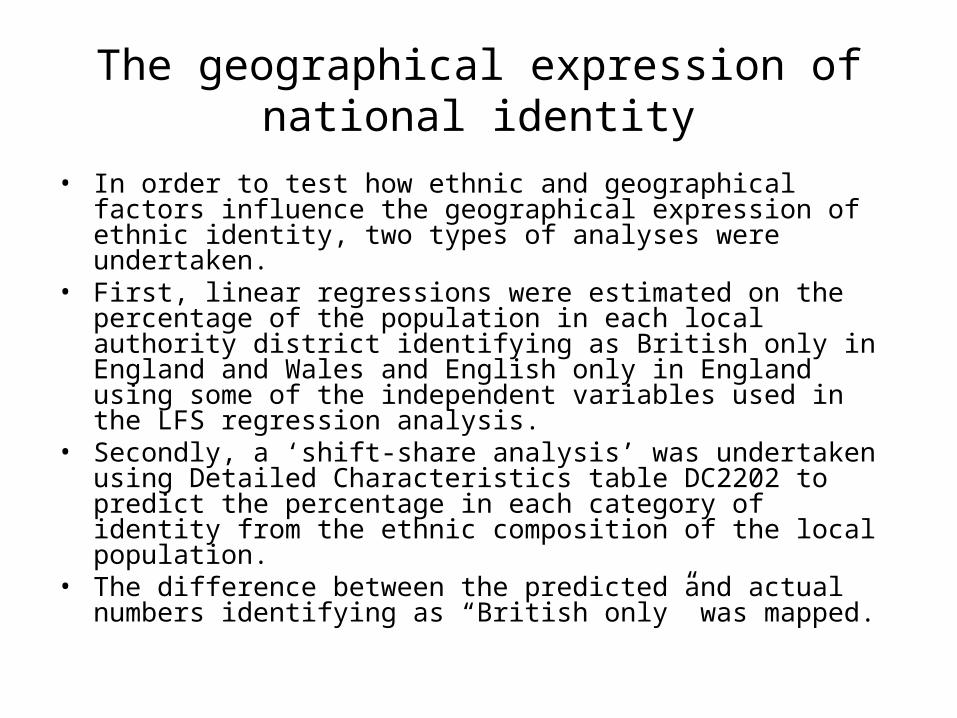
• In order to test how ethnic and geographical factors influence the geographical expression of ethnic identity, two types of analyses were undertaken.
• First, linear regressions were estimated on the percentage of the population in each local authority district identifying as British only in England and Wales and English only in England using some of the independent variables used in the LFS regression analysis.
• Secondly, a ‘shift-share analysis’ was undertaken using Detailed Characteristics table DC2202 to predict the percentage in each category of identity from the ethnic composition of the local population.
• The difference between the predicted and actual numbers identifying as “British only” was mapped.

Regression on % British OnlyCoefficients from a linear regression model with the percentage of people who describe their identity as British only against a set of independent variables for local authority districts in England and Wales. The adjusted R squared is 0.907.
•The most important positive influences are the percentage of people from minority ethnic groups, and the percentage of people with a non-UK first language.
•The strongest negative influences are the percentage born overseas and the percentage in lower status occupations.
•Higher status occupations, the unemployment rate and the economic inactivity rate were not statistically significant.
B Std. Error Beta t Sig.
(Constant) -11.178 14.593 -0.766 0.444
% from minority ethnic groups 0.435 0.027 0.972 16.269 0.000
% born overseas -0.249 0.057 -0.454 -4.399 0.000
% with first language non-UK 0.372 0.09 0.449 4.123 0.000
% with no passport 0.165 0.049 0.164 3.36 0.001
% higher status occupations -0.042 0.124 -0.052 -0.338 0.736
% intermediate occupations -0.191 0.121 -0.123 -1.576 0.116
% lower status occupations -0.397 0.11 -0.423 -3.621 0.000
Unemployment rate 0.068 0.146 0.023 0.464 0.643
Employment rate 0.366 0.227 0.305 1.613 0.108
Economic inactivity rate 0.28 0.197 0.18 1.417 0.157
Median age (years) 0.182 0.087 0.14 2.096 0.037

Regression on % English Only
Coefficients from a linear regression model with the percentage of people who describe their identity as English only against a set of independent variables for local authority districts in England. The adjusted R squared is 0.966.
•The strongest positive influences are the percentage of people from intermediate and lower status occupations and the unemployment rate. There is a weak positive relationship with median age.
•The strongest negative influences are the percentage born overseas and the percentage from minority ethnic groups.
•The unemployment rate and the economic inactivity rate were not statistically significant
B Std. Error Beta t Sig.
(Constant) 57.253 17.726 3.230 0.001
% from minority ethnic groups -0.169 0.032 -0.196 -5.308 0.000
% born overseas -0.588 0.068 -0.555 -8.707 0.000
% with first language non-UK -0.337 0.108 -0.211 -3.135 0.002
% with no passport -0.236 0.067 -0.116 -3.539 0.000
% higher status occupations 0.297 0.151 0.189 1.971 0.050
% intermediate occupations 0.630 0.147 0.209 4.276 0.000
% lower status occupations 0.604 0.137 0.325 4.397 0.000
Unemployment rate 0.429 0.178 0.075 2.404 0.017
Employment rate -0.251 0.272 -0.104 -0.920 0.358
Economic inactivity rate 0.116 0.240 0.036 0.485 0.628
Median age (years) -0.331 0.109 -0.132 -3.041 0.003

Regression on % differenced from predicted British Only B
Std. Error Beta t Sig.
(Constant) -192.065 90.614 -2.120 0.035
% from minority ethnic groups 2.263 0.166 0.964 13.623 0.000
% born overseas -1.336 0.351 -0.465 -3.801 0.000
% with first language non-UK 2.014 0.560 0.464 3.597 0.000
% with no passport 1.245 0.304 0.236 4.088 0.000
% higher status occupations 0.214 0.768 0.051 0.279 0.780
% intermediate occupations -0.500 0.752 -0.061 -0.664 0.507
% lower status occupations -2.014 0.681 -0.409 -2.959 0.003
Unemployment rate 0.355 0.909 0.023 0.390 0.696
Employment rate 1.956 1.410 0.311 1.387 0.166
Economic inactivity rate 2.058 1.226 0.252 1.678 0.094
Median age (years) 0.377 0.538 0.056 0.702 0.483
Coefficients from a linear regression model with the percentage difference between the actual and predicted number of of people who describe their identity as British only against a set of independent variables for local authority districts in England. The adjusted R squared is 0.87.
•Most important positive :% of people from minority ethnic groups, and % percentage of people with a non-UK first language.
•The strongest negative influences are the percentage born overseas and the percentage in lower status occupations.
•Higher and intermediate status occupations, age, the unemployment rate, employment rate and the economic inactivity rate were not statistically significant

British-Only: % difference from predictionThe measure presented is the difference between the predicted number of people with British only identity and the actual number, as a percentage of the actual number
Key features :
•People living in eastern and south-west England are much more likely than ethnic composition predicts to describe themselves only as English.
•People in the London area and other areas of large ethnic minority concentrations in the midlands and northern England are more likely to describe themselves as British.
•People in Wales are more likely than predicted to describe themselves as British-only

Conclusions
• This analysis has shown that the percentage of people who describe themselves as British only has fallen over time.
• The percentage in the Census is much smaller than in the LFS.• The Census reveals a much greater propensity for people in England to identify as
English only.• There is a very strong geographical patterns, with people in eastern England most
likely to describe themselves as English.• People from minority ethnic groups are more likely than white people to describe
themselves as British only.• People in Wales, London and other areas with large minority ethnic group populations
are more likely to describe themselves as British than their ethnic composition would imply.
• Survey data suggests that the meaning of being British is different for white people and people from minority ethnic groups.
• The latter have a more ‘legalistic’ attachment and describing themselves as British does not mean that they abandon their own cultural traditions.
• While “British” is therefore accepted as an inclusive identity by parts of the minority ethnic group population, it seems that there is a retreat towards an “English” identity for part of the white population living in less ethnically diverse areas of England.