Embed Size (px)
Citation preview

Geographical Investigation
Friday 27th April 2012Deadline
Fill in the appropriate Topic on Page 1 of your investigation reportFor example:
Topic 1
Title:A Study of one landform evident on the Irish landscape formed by Geomorphic Processes
Landform: Sand SpitGeomorphic Processes: Coastal Deposition due to Longshore Drift being interrupted.
Stages of Investigation
- The Introduction is where you pose the problems and come up with the strategy that you intend to undertake in your investigation.- You clearly select your topic for investigation for 2012.-You need to state clearly your investigation’s aims/hypotheses.- You need to outline your aims/ objectives -ie What we will do-Identify the types of information your investigation requires.- The investigation booklet asks you to include your aims/hypotheses here.
REMEMBER: SRP= Significant relevant point (of information)Coherence = Flow/cohesion/logical arguments and information
What Aims/Hypotheses do you Have?
• Longshore Drift is a key process in this investigation Zone
and interruption of Longshore Drift has created this Depositional landform
• Waves of Construction are active here• Human Interference has had negative impacts on the Landform• Human Interference has had positive impacts on the Landform• The Spit on Raven point has created the foundation for other
landforms such as Sand Dunes• Materials found on the investigation zone are what one would
expect to find in an area created by constructive waves• The beach attached to the Spit displays the distinctive zones as
found on a beach
What aims did you come up with?
Group 1: Are the waves here Constructive or Destructive
Group 2: How have humans impacted on the landform?
Group 3:Investigate the effects of longshore drift on the landform
Group 4: Investigate the connection between the formation of other depositional landforms and materials found on the Spit
Group 5: Investigate the connection between longshore drift and the profile of the sand spit

How will you Gather the Info?
2 Methods – 4 Ways1. Observation 2. Identification
3. Recording4. Measuring
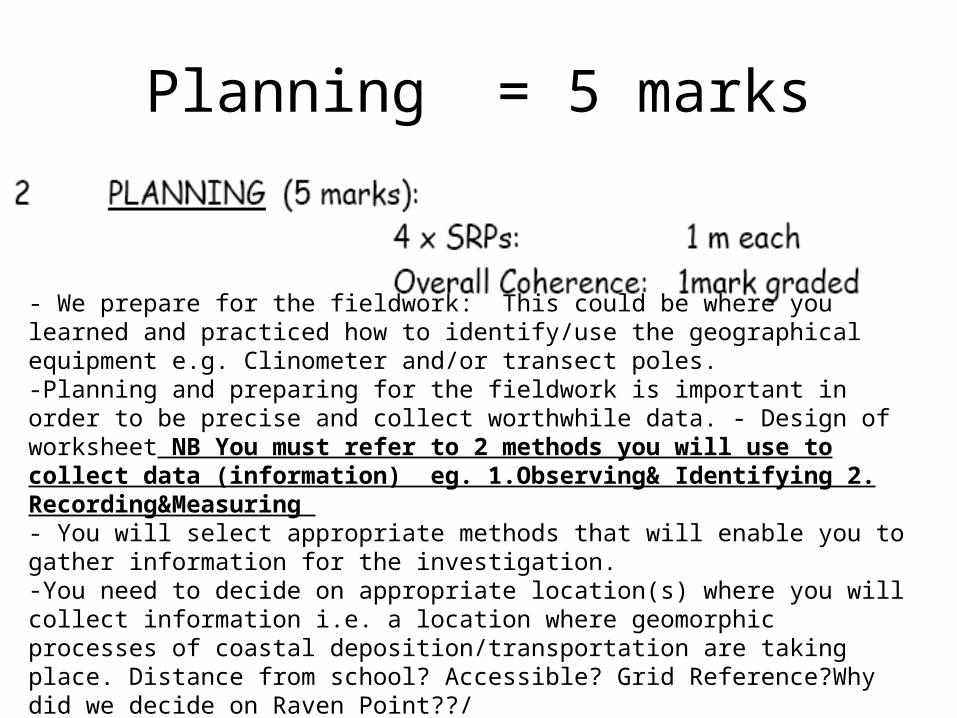
Planning = 5 marks
- We prepare for the fieldwork: This could be where you learned and practiced how to identify/use the geographical equipment e.g. Clinometer and/or transect poles. -Planning and preparing for the fieldwork is important in order to be precise and collect worthwhile data. - Design of worksheet NB You must refer to 2 methods you will use to collect data (information) eg. 1.Observing& Identifying 2. Recording&Measuring - You will select appropriate methods that will enable you to gather information for the investigation.-You need to decide on appropriate location(s) where you will collect information i.e. a location where geomorphic processes of coastal deposition/transportation are taking place. Distance from school? Accessible? Grid Reference?Why did we decide on Raven Point??/- The student needs to decide what will they observe? Measure? Record? -A need to revise coasts? How? -Equipment?
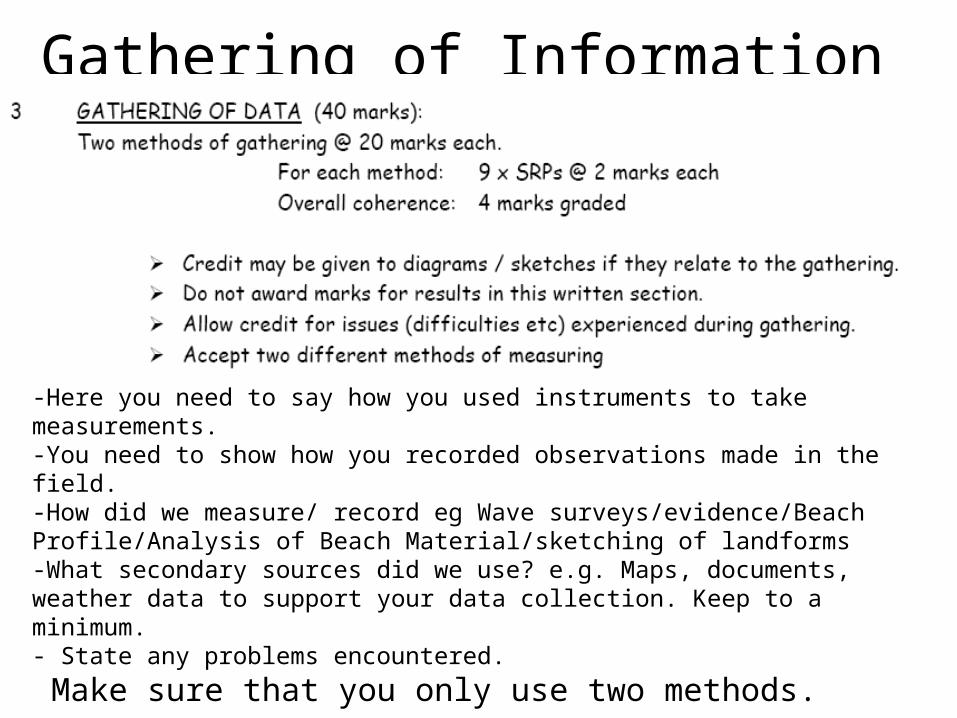
Gathering of Information = 40 marks
-Here you need to say how you used instruments to take measurements.-You need to show how you recorded observations made in the field.-How did we measure/ record eg Wave surveys/evidence/Beach Profile/Analysis of Beach Material/sketching of landforms -What secondary sources did we use? e.g. Maps, documents, weather data to support your data collection. Keep to a minimum.- State any problems encountered.
Make sure that you only use two methods. 1.Observing& Identifying 2. Recording&Measuring -In this section you are describing how you collected your information in the field.
State 2 Methods
Method 1. - Identification and Observation?Method 2. - Recording and Measuring?
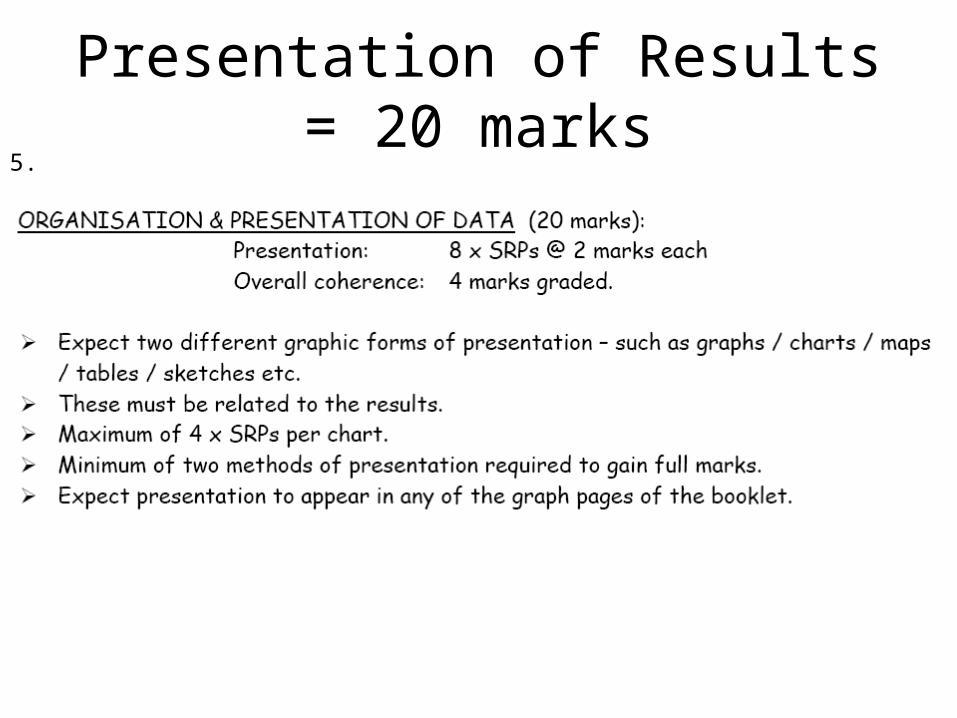
Presentation of Results = 20 marks5.
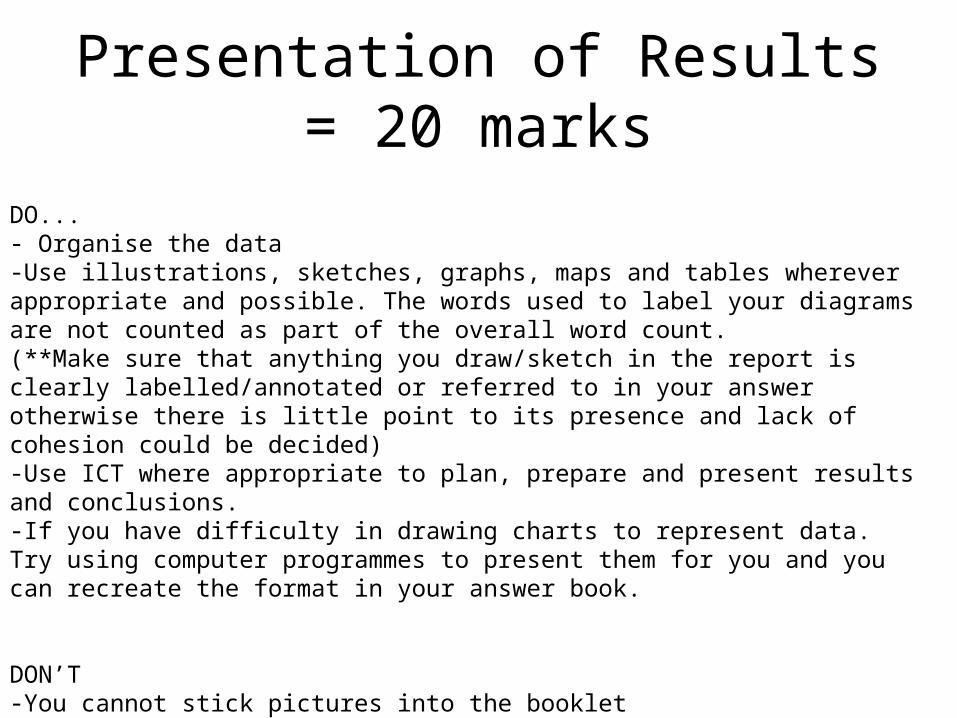
Presentation of Results = 20 marks
DO...- Organise the data-Use illustrations, sketches, graphs, maps and tables wherever appropriate and possible. The words used to label your diagrams are not counted as part of the overall word count.(**Make sure that anything you draw/sketch in the report is clearly labelled/annotated or referred to in your answer otherwise there is little point to its presence and lack of cohesion could be decided)-Use ICT where appropriate to plan, prepare and present results and conclusions. -If you have difficulty in drawing charts to represent data. Try using computer programmes to present them for you and you can recreate the format in your answer book.
DON’T-You cannot stick pictures into the booklet-Do not add printed material into your answer booklet.
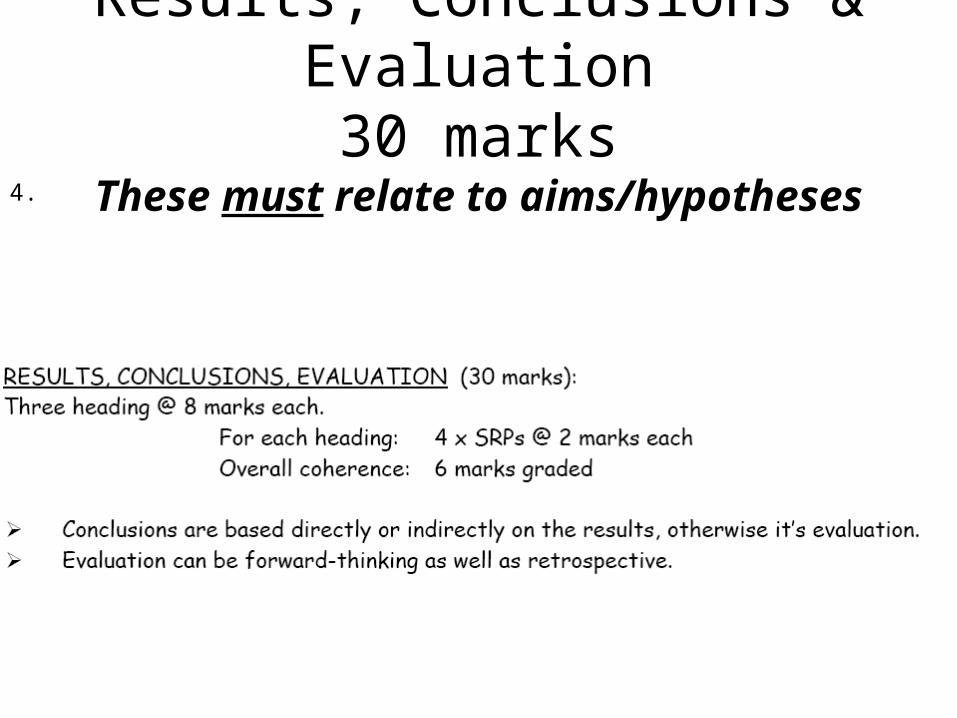
Results, Conclusions & Evaluation30 marks
These must relate to aims/hypotheses4.
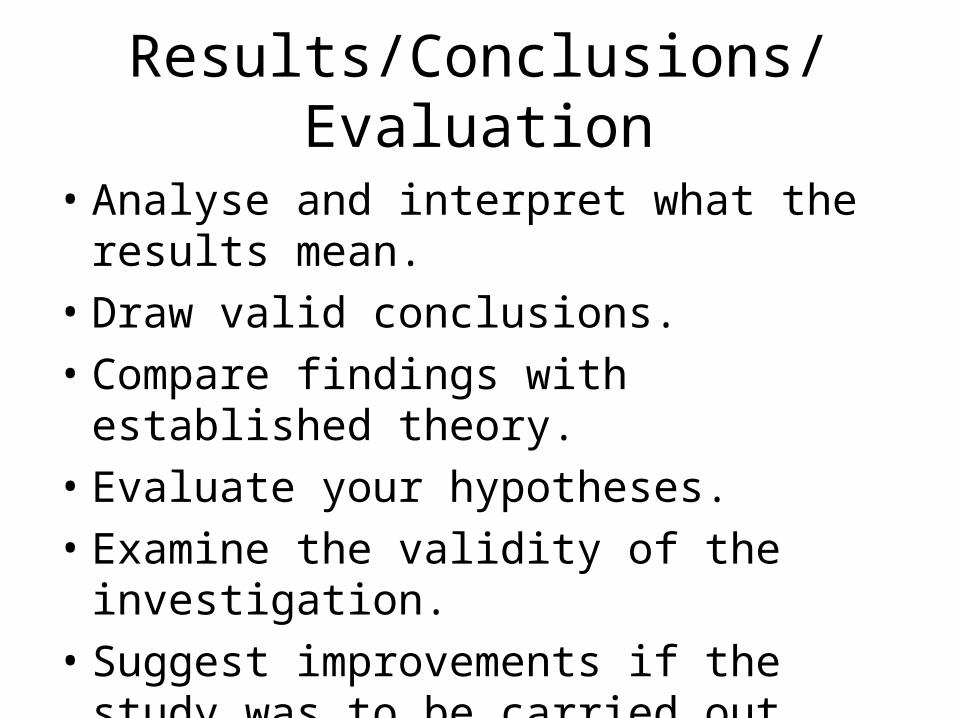
Results/Conclusions/Evaluation
• Analyse and interpret what the results mean.• Draw valid conclusions.• Compare findings with established theory.• Evaluate your hypotheses.• Examine the validity of the investigation.• Suggest improvements if the study was to be
carried out again by you.
Evaluations – What are they?
• Evaluations are assessments or judgement of the methods and the equipment you used during the Geographical Investigation.
• It can also focus on the accuracy of your results
Evaluations -You need 4
• Did you achieve your aims?• Did you show your hypotheses to be true?• Was your equipment suitable? If not – How could you
modify for future investigations?• Were your results accurate? Why?/Why not?• Was the sample size large enough?• Should it have been longitudinal?• What suggestions do you have to improve future
Geographical Investigations?
Possible Results/Conclusions
Should include brief explanation of how coastal processes operate in support of your
conclusions
Rate of Longshore Drift• Result: The rate of Longshore Drift is x
metres/mins in y direction• Conclusion: Sediment transfer by longshore
drift is occurring/not occurring. The factors that could influence these should also be explained:
• Shape of coastline• Wind Direction• Type of waves• The Tide• Man-made structures
Wave Frequency
• Result: The wave frequency is over 10 per minute/under 10 per minute
• Conclusion: The waves are destructive/Constructive. Mention the factors affecting the occurrence of Destructive/Constructive waves eg:
• Wind Speed• Wind Direction• Tide/Fetch• Slope of Beach
Beach Slope Angle• Result: The angle of the beach slope shows/does not
show a large increase from foreshore to backshore• Conclusion: The beach was formed in summer by
constructive wave action/ The beach was formed in winter by destructive wave action
• Beach profiles change seasonally due to change in wave energy in summer and winter
• Summer beach profile is formed by constructive waves – swash greater than backwash
• Winter beach profile due to increased wave energy associated with storms and erodes and removes sediment from beach
Beach Fabric
• Result: Beach fabric increases in size from foreshore to backshore
• Conclusion: Wave action has sorted the beach fabric
• This is common in many beaches.It is due to the gradual sorting of material by the action of constructive and destructive waves over millions of tidal cycles
• Constructive waves carry larger stones up the shore in their swash. Water seeps into sand and backwash no longer strong enough to bring them back out
Beach Fabric
• Only smaller sand and pebbles are carried back• Storms and tidal surges will aslo carry larger material
onto backshore forming a storm beach• Finer sand and pebbles remain on foreshore
Tips
• Make sure that you do not repeat information.
• Use all available space.• Make sure all your diagrams/sketches/data is
well labelled, given adequate titles and are annotated appropriately or referred to in your main sections.