Embed Size (px)
Citation preview
GEOGRAPHICAL VARIATION OF PERSISTENT ORGANIC POLLUTANTS IN EGGS OFTHREATENED LOGGERHEAD SEA TURTLES (CARETTA CARETTA)
FROM SOUTHEASTERN UNITED STATES
JUAN JOSE ALAVA,y JENNIFER M. KELLER,*z JEANETTE WYNEKEN,§ LARRY CROWDER,k GEOFFREY SCOTT,yand JOHN R. KUCKLICKz
yNational Oceanic and Atmospheric Administration, Charleston, South Carolina, USA
zNational Institute of Standards and Technology, Hollings Marine Laboratory, Charleston, South Carolina, USA
§Florida Atlantic University, Boca Raton, Florida, USA
kDuke University Marine Laboratory, Beaufort, North Carolina, USA
(Submitted 24 January 2011; Returned for Revision 11 March 2011; Accepted 4 April 2011)
Abstract—Persistent organic pollutants (POPs) are recognized manmade threats to sea turtle populations, but substantial uncertaintyexists surrounding their exposure to contaminants and their sensitivity to toxic effects. This uncertainty creates difficulty forconservation managers to make informed decisions for the recovery of these threatened species. To provide baseline concentrationsand spatial comparisons, wemeasured a large suite of POPs in loggerhead sea turtle (Caretta caretta) egg yolk samples collected from 44nests in three distinct U.S. locations: North Carolina (NC), eastern Florida (E FL), and western Florida (W FL). The POPs includedpolychlorinated biphenyls (PCBs), organochlorine pesticides such as dichlorodiphenyltrichloroethanes (DDTs), chlordanes, mirex,dieldin, hexachlorocyclohexanes (HCHs), hexachlorobenzene, and toxaphene congeners, as well as polybrominated diphenyl ethercongeners (PBDEs). Persistent organic pollutant concentrations were lowest in W FL, intermediate in E FL, and highest in NC eggsamples, with several statistically significant spatial differences. This increasing gradient along the southeast coast around the Floridapeninsula to North Carolina was explained partly by the foraging site selection of the nesting females. Data from previous trackingstudies show that NC nesting females feed primarily along the U.S. eastern coast, whereas W FL nesting females forage in the Gulf ofMexico and Caribbean Sea. The E FL nesting females forage in areas that overlap these two. The foraging site selection also results inexposure to different patterns of POPs. An unusual PBDE pattern was seen in the NC samples, with nearly equal contributions of PBDEcongeners 47, 100, and 154. These findings are important to managers assessing threats among different stocks or subpopulations of thisthreatened species. Environ. Toxicol. Chem. 2011;30:1677–1688. # 2011 SETAC
Keywords—Reptile Egg Lipid Contaminant Organohalogen
INTRODUCTION
Environmental contaminants are a recognized threat to manyspecies, yet the uncertainty of the risk they pose to sea turtles isgreat, and our understanding is limited by few data [1]. Here wefocus on contaminants in loggerhead sea turtle (Caretta caretta)eggs. Loggerhead sea turtles are currently listed as threatenedon the U.S. Endangered Species List. However, the NorthwestAtlantic subpopulation has been experiencing a long-termdeclining trend in nesting, which has heightened concern forthe species and compelled National Marine Fisheries Service toconsider this subpopulation for the more imperiled status ofendangered ([2]; http://www.nmfs. noaa.gov/pr/pdfs/statusre-views/loggerheadturtle2009.pdf). Four recovery units (aggre-gations of loggerhead sea turtles, essential to the recovery of thespecies and delineated based partly on geographical isolation)have been identified for rookeries for the Northwest Atlanticloggerhead in the United States: the Northern nesting subpo-pulation (ranging from Virginia to northern Florida), the Pen-insular Florida subpopulation, the Northern Gulf of Mexicosubpopulation, and the Dry Tortugas subpopulation [1]. Thefirst two subpopulations were sampled in the present study. TheNorthern subpopulation has been declining by �1.6% per year
since the 1980 s [1]; the Peninsular Florida subpopulation hasexperienced a cumulative decline of 28 to 31% between 1989 to2006 [3]. The list of threats that this species faces is long,including nesting beach habitat destruction, fisheries by-catch,vessel strikes, poaching, diseases, predation, marine debris, andchemical pollutants.
Baseline exposure data do not exist for contaminant con-centrations in certain sea turtle subpopulations. For example,the eastern coast of Florida hosts possibly the largest rookery ofloggerheads in the world, rivaled only by Masirah in Oman [1],but only three loggerhead nests from this location have beenanalyzed recently for persistent organic pollutants (POPs), suchas polychlorinated biphenyls (PCBs) and organochlorine pes-ticides [4]. Before that study, loggerhead eggs from this regionhad not been collected for POP measurements since the 1970 s[5], and the analytical methods used three decades ago are nowconsidered obsolete. Since the 1990 s, loggerhead eggs from theUnited States have been analyzed for POPs from only SouthCarolina [6], the Florida panhandle [7], and eastern Florida [4].These three studies are similar in that they used nonlethalsampling of unhatched eggs collected after live hatchlingsemerged from the nest. Despite this similarity, the data cannotbe combined for a robust spatial comparison of POP exposureamong the genetically distinct subpopulations or regionsbecause of temporal differences in sampling (1970 s to2002), differences in the suite of compounds measured, andmethodological differences (e.g., Alam and Brim [7] reportedon dry mass, whereas all other studies used wet mass).
Environmental Toxicology and Chemistry, Vol. 30, No. 7, pp. 1677–1688, 2011# 2011 SETAC
Printed in the USADOI: 10.1002/etc.553
* To whom correspondence may be addressed([email protected]).
Published online 20 April 2011 in Wiley Online Library(wileyonlinelibrary.com).
1677
During a spring–summer nesting season, loggerhead turtleslay three to six clutches 14 d apart of 100þ eggs each on nestingbeaches [8,9]. Every two to three years, females migrate to thenesting beaches hundreds of kilometers from foraging grounds,and often they choose the same foraging ground betweennesting seasons [8]. During this foraging time, the nutritionalresources of the local environment are deposited into follicles(which become the yolk of the egg) for the next nesting season[9]. There, adult females accumulate POPs from their prey, aswell as from incidentally ingested sediments, that then aredeposited, along with lipids, into follicles. Indeed, maternaltransfer of POPs into eggs has been documented in many turtlespecies, including sea turtles [10–13]. Thus, the POP concen-trations in eggs represent contamination received on foraginggrounds of the adult female. Females nesting on the same beachbut foraging in different locations would likely produce eggscontaining different POP concentrations. Alternatively, iffemales from one nesting beach forage in similar locations,then their egg POP concentrations would be similar and indi-cative of their foraging region. Therefore, knowing the exposurelevel of a species to these compounds as well as the spatialstructure at the subpopulation or regional level is important tomake informed management decisions for their populationrecovery.
Several studies have indicated that the presence of POPs ineggs represents a risk to the developing embryo. In green seaturtles (Chelonia mydas), van de Merwe et al. [12] showed thatPOPs transfer from eggs into embryos and that higher egg POPconcentrations correlated with a lower mass: length ratio of thehatchlings. Although more studies are needed to prove thatPOPs are indeed the cause of this observation, turtles with alower body condition index may not be as fit to survive earlymigrations and avoid predators. Additionally, toxic effects ofPOPs on the very sensitive early life stages have been shown ina number of other reptile species (e.g., [14–20]).
Objectives of the present study were to provide baselineconcentrations of a large suite of POPs, including PCBs,dichlorodiphenyltrichloroethane (DDT)-related compounds,chlordanes, toxaphenes, mirex, dieldrin, hexachlorocyclohex-anes (HCHs), and hexachlorobenzene, as well as brominatedflame retardants, the polybrominated diphenyl ethers (PBDEs)in loggerhead eggs collected in distinct nesting regions alongthe U.S. southeast coast: western Florida (W FL), easternFlorida (E FL), and North Carolina (NC). Spatial differencesin POP concentrations and patterns were interpreted based onpreviously published reports of nesting female migrations fromnesting locations similar to their preferred foraging grounds.
MATERIALS AND METHODS
Egg collection and selection
Egg sampling was conducted in collaboration with a large-scale project to evaluate sex ratios on nesting beaches in thesoutheastern United States in 2002 [21]. Individual nests werelocated most often the morning after laying without encounter-ing the female. Nests were marked with signs or predator-exclusion cages and observed over the incubation period. Thesemethods ensure that multiple nests do not mix, but they do notrule out the chance, however small, that successive clutchesfrom one female may have been sampled. Eggs that failed tohatch were collected into plastic bags during nest inventories.Although the decision to use unhatched eggs may introducesome variability because of different stages of embryonicdevelopment and different degrees of degradation, this choice
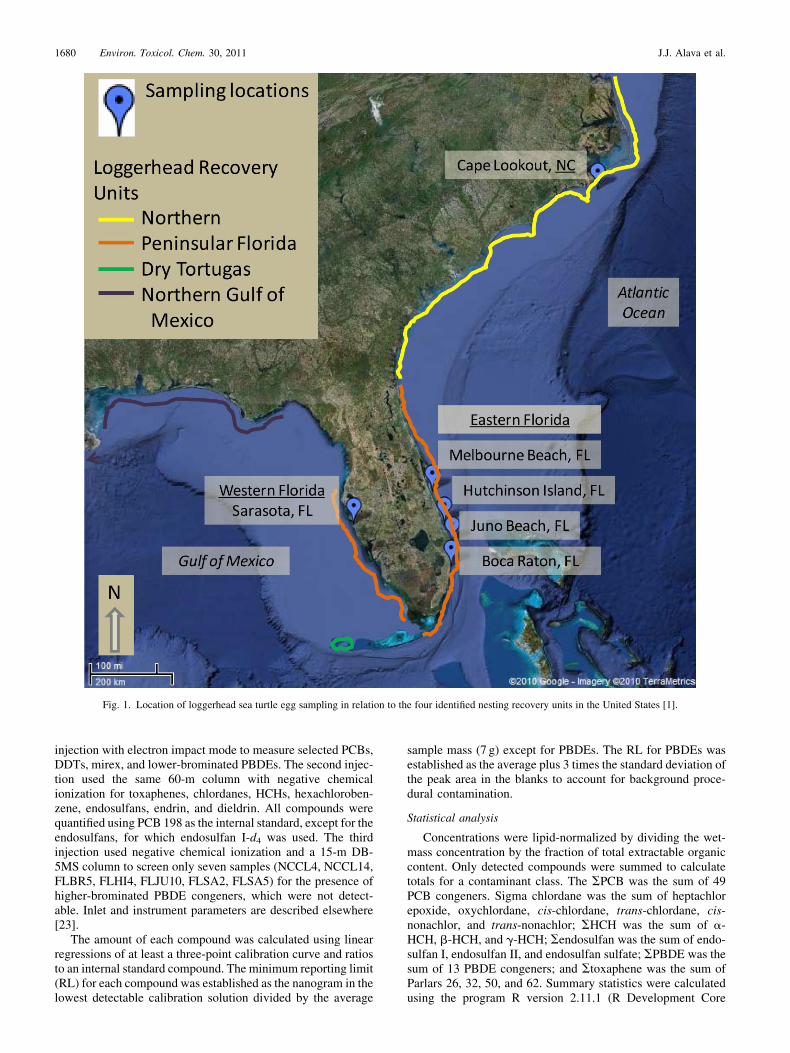
provides a nonlethal sampling method and has proved useful inmany other sea turtle studies (see especially Stewart et al. [13]).Eggs were collected from a total of 44 nests at three regionallocations (Table 1; Fig. 1), making this study the second largestsample size of sea turtle nests analyzed for POPs, second toGuirlet et al. [10]. Nests from Sarasota County, FL (FLSA;n¼ 11) were considered from W FL. Nests from Boca Raton(FLBR; n¼ 11), Juno Beach (FLJU; n¼ 4), Hutchinson Island(FLHI; n¼ 5), and Melbourne Beach (FLME; n¼ 4) weregrouped as from E FL. Nests from Cape Lookout, NC (NCCL;n¼ 9) were considered from NC. Eggs were rinsed inside afume hood with deionized water to remove sand, opened, andstaged to determine the extent of embryonic development.Because egg contents were split for sex determination andcontaminant measurements, we decided to store and analyzeonly yolk for contaminants. Yolk was separated from thealbumen as much as possible and stored frozen in hexane-rinsedaluminum foil. One to ten yolk samples from eggs with nodevelopment or early to middle developmental stages werepooled per nest (50% or less of eggs from single nests werefrom middle stage; Table 1). Samples from late-stage develop-ment embryos were excluded to minimize confounding factors,because POP concentrations are known to become more con-centrated in loggerhead yolk samples with embryonic develop-ment, especially by the late stage [4]. Two nests with only oneegg each were included, because good agreement in POPconcentrations has been shown among loggerhead egg yolksamples from a single nest (at least among eggs with no, early,or middle stage development, where average relative standarddeviation for total POPs was 14% [4]). This low variabilitywithin a nest has been shown in eggs from other sea turtlespecies [12]. Three nests, included in the 44 nests mentioned,were previously analyzed as individual yolk samples rather thanpooled ([4]; see Table 1), and the average POP concentrations ofthose no, early, and mid-developmental stages were included inthe present study.
Calibration solutions and quality control
Calibration solutions were prepared gravimetrically in iso-octane by combining National Institute of Standards and Tech-nology Standard Reference Materials (SRMs): 2261 ChlorinatedPesticides in Hexane, 2262 Chlorinated Biphenyl Congeners in2,2,4-Trimethylpentane, 2274 PCB Congeners Solution II inIsooctane, 2275 Chlorinated Pesticides Solution II in Isooctane,as well as solutions containing 46 additional PCB congeners and14 PBDE congeners (PBDE solution from Cambridge IsotopeLaboratories). A six-point calibration curve, ranging from0.35 ng to 370 ng of each compound contained in the previouslymentioned solutions, was extracted and processed alongside thesamples. A three-point calibration curve consisting of fourtoxaphene compounds (0.03–0.5 ng) was also prepared gravi-metrically but not extracted alongside samples, to semiquanti-tatively determine concentrations of the following: 2-endo, 3-exo, 5-endo, 6-exo, 8, 8, 10, 10-octachlorobornane (Parlar 26),2-endo, 3-exo, 5-endo, 6-exo, 8, 8, 9, 10, 10-nonachlorobornane(Parlar 50), 2, 2, 5, 5, 8, 9, 9, 10, 10-nonachlorobornane (Parlar60), and 2-endo, 3-exo, 6-exo, 8, 9, 10, 10-heptachlorobornane(Parlar 32). An internal standard solution in iso-octane wasadded (�40 ng of each compound) gravimetrically to samplesand the calibration standards before extraction and contained4,40-DDT-d8, 4,40-dichlorodiphenyldichloroethylene-d8 (4,40-DDE-d8), 4,4
0-dichlorodiphenyldichloroethane-d8 (4,40-DDD-d8), endosulfan I-d4, PCB 103, and PCB 198. National Instituteof Standards and Technology SRM 1946 Lake Superior Fish
1678 Environ. Toxicol. Chem. 30, 2011 J.J. Alava et al.
Tissue (hereafter SRM 1946) and a cryohomogenized compo-site of loggerhead sea turtle egg yolks from nest FLBR13 wereanalyzed as control materials. Three procedural blanks werealso processed with the set of samples.
Extraction and cleanup of yolk samples
Pooled, spatula-homogenized yolk samples (7.0 g) weremixed with sodium sulfate and extracted with dichloromethaneusing pressurized fluid extraction as described previously [4].Water was removed from extracts with sodium sulfate, and theywere reduced to 10ml in volume by evaporation using purifiednitrogen. Lipid content was determined gravimetrically from a10% subsample of the extract that was allowed to dry in a taredaluminum pan, but because this common method of determin-ing lipids likely co-extracts other molecules such as someproteins, it is hereafter called total extractable organic content.The dry total extractable organic residue was weighed to thenearest 0.00001 g. Extracts were cleaned up with size exclusionchromatography as described in Kucklick et al. [22] followed by
solid-phase extraction with alumina columns and fractionationwith silica columns as described in Alava et al. [4].
Determination of POP concentrations
Both fractions (F1 and F2) from the silica column wereanalyzed on a gas chromatograph with dual micro-electroncapture detectors (Hewlett Packard) for PCBs and certainorganochlorine pesticides. Compounds were separated (2-mlinjection) using two different 60-m columns (DB-5 and DB-XLB; J&W Scientific). Inlet, gas chromatograph oven, andelectron capture detector parameter choices were similar tothose of Kucklick et al. [22].
Both fractions of each sample were recombined (during thisstep we lost samples FLHI11 and FLME14), and 20ml of eachextract were injected three times onto a gas chromatographequipped with a mass spectrometer (Agilent 6890N/5973 inert),using a programmable temperature vaporization inlet andselected ion monitoring to confirm concentrations of certainPCBs and organochlorine pesticides and to quantify the PBDEs.A 60-mDB-5MS column (J&WScientific) was used for the first
Table 1. Loggerhead sea turtle nest locations (all in USA) and sample size information
Nest Island/Beach Region Recovery Unit Date CollectedNumber ofyolks pooled
% frommid-development
FLSA02 Sarasota area WFL Peninsular FL July 26, 2002 4 0FLSA04 Sarasota area WFL Peninsular FL July 26, 2002 8 0FLSA05 Sarasota area WFL Peninsular FL July 30, 2002 2 0FLSA06 Sarasota area WFL Peninsular FL August 14, 2002 3 0FLSA08 Sarasota area WFL Peninsular FL August 23, 2002 4 0FLSA09 Sarasota area WFL Peninsular FL August 13, 2002 5 0FLSA10 Sarasota area WFL Peninsular FL August 14, 2002 3 0FLSA11 Sarasota area WFL Peninsular FL September 4, 2002 3 0FLSA12 Sarasota area WFL Peninsular FL Sept. 12 & 16, 2002 4� 25FLSA14 Sarasota area WFL Peninsular FL Sept. 12 & 16, 2002 2 0FLSA15 Sarasota area WFL Peninsular FL Sept. 12 & 24, 2002 3 0FLBR02 Boca Raton EFL Peninsular FL July 19, 2002 6� 50FLBR05 Boca Raton EFL Peninsular FL July 19, 2002 6 0FLBR07 Boca Raton EFL Peninsular FL August 9, 2002 4 0FLBR08 Boca Raton EFL Peninsular FL August 8, 2002 3 0FLBR09 Boca Raton EFL Peninsular FL August 8, 2002 1 0FLBR10 Boca Raton EFL Peninsular FL August 11, 2002 5 0FLBR11 Boca Raton EFL Peninsular FL September 7, 2002 3 0FLBR12 Boca Raton EFL Peninsular FL September 7, 2002 2 0FLBR13 Boca Raton EFL Peninsular FL September 12, 2002 10 0FLBR14a Boca Raton EFL Peninsular FL September 21, 2002 4� 50FLBR15 Boca Raton EFL Peninsular FL September 17, 2002 2 0FLHI04 Hutchinson Island EFL Peninsular FL July 26, 2002 3 0FLHI09 Hutchinson Island EFL Peninsular FL August 13, 2002 3 0FLHI10 Hutchinson Island EFL Peninsular FL August 27, 2002 5 20FLHI11 Hutchinson Island EFL Peninsular FL September 17, 2002 3 0FLHI14 Hutchinson Island EFL Peninsular FL September 23, 2002 3 0FLJU06 Juno Beach EFL Peninsular FL August 12, 2002 6 0FLJU10 Juno Beach EFL Peninsular FL August 12, 2002 4 0FLJU12 Juno Beach EFL Peninsular FL September 22, 2002 1 0FLJU13 Juno Beach EFL Peninsular FL September 22, 2002 3 0FLME07 Melbourne Beach EFL Peninsular FL August 14, 2002 4 0FLME09 Melbourne Beach EFL Peninsular FL August 14, 2002 6 33FLME10 Melbourne Beach EFL Peninsular FL August 12, 2002 6 40FLME14 Melbourne Beach EFL Peninsular FL September 19, 2002 3 0NCCL01 Cape Lookout NC Northern August 16, 2002 6 17NCCL04 Cape Lookout NC Northern August 16, 2002 2 0NCCL05 Cape Lookout NC Northern August 19, 2002 3 0NCCL11 Cape Lookout NC Northern August 19, 2002 3 0NCCL12 Cape Lookout NC Northern August 23, 2002 2 0NCCL13 Cape Lookout NC Northern August 23, 2002 7 0NCCL14 Cape Lookout NC Northern August 30, 2002 4 0NCCL15 Cape Lookout NC Northern August 30, 2002 6 33NCCL21 Cape Lookout NC Northern October 4, 2002 3 0
�Number of individual yolk samples averaged from Alava et al. [4].W FL¼western Florida, USA; E FL¼ eastern FL, USA; NC¼North Carolina, USA.
Spatial differences in loggerhead egg POPs along southeast US Environ. Toxicol. Chem. 30, 2011 1679
injection with electron impact mode to measure selected PCBs,DDTs, mirex, and lower-brominated PBDEs. The second injec-tion used the same 60-m column with negative chemicalionization for toxaphenes, chlordanes, HCHs, hexachloroben-zene, endosulfans, endrin, and dieldrin. All compounds werequantified using PCB 198 as the internal standard, except for theendosulfans, for which endosulfan I-d4 was used. The thirdinjection used negative chemical ionization and a 15-m DB-5MS column to screen only seven samples (NCCL4, NCCL14,FLBR5, FLHI4, FLJU10, FLSA2, FLSA5) for the presence ofhigher-brominated PBDE congeners, which were not detect-able. Inlet and instrument parameters are described elsewhere[23].
The amount of each compound was calculated using linearregressions of at least a three-point calibration curve and ratiosto an internal standard compound. The minimum reporting limit(RL) for each compound was established as the nanogram in thelowest detectable calibration solution divided by the average
sample mass (7 g) except for PBDEs. The RL for PBDEs wasestablished as the average plus 3 times the standard deviation ofthe peak area in the blanks to account for background proce-dural contamination.
Statistical analysis
Concentrations were lipid-normalized by dividing the wet-mass concentration by the fraction of total extractable organiccontent. Only detected compounds were summed to calculatetotals for a contaminant class. The SPCB was the sum of 49PCB congeners. Sigma chlordane was the sum of heptachlorepoxide, oxychlordane, cis-chlordane, trans-chlordane, cis-nonachlor, and trans-nonachlor; SHCH was the sum of a-HCH, b-HCH, and g-HCH; Sendosulfan was the sum of endo-sulfan I, endosulfan II, and endosulfan sulfate; SPBDE was thesum of 13 PBDE congeners; and Stoxaphene was the sum ofParlars 26, 32, 50, and 62. Summary statistics were calculatedusing the program R version 2.11.1 (R Development Core
Fig. 1. Location of loggerhead sea turtle egg sampling in relation to the four identified nesting recovery units in the United States [1].
1680 Environ. Toxicol. Chem. 30, 2011 J.J. Alava et al.
Team), using the NADA package, which can handle left-censored datasets or those with values less than RL as recom-mended by Helsel [24]. Mean, standard deviation, and medianwere estimated with Kaplan-Meier or regression on ordermodels. Model choice was based on sample size and detectionfrequency as recommended in Helsel [24]. Regional differencesin POP concentrations were determined in the following man-ner. Normality and homoskedasticity of raw and log-trans-formed data were tested using Shapiro-Wilk and Bartletttests, respectively. For compounds that had 100% detectionfrequency (PCB 153, SPCB, 4,40-DDE, SDDTs, SPOPs, andtotal extractable organic content), JMP 5.1 (SAS Institute)software was used to perform analyses of variance or Welchanalyses of variance followed by Tukey-Kramer HSD multiplecomparison tests (a¼ 0.05). For compounds with less than100% detection frequency, R’s NADA package was used toperform either a parametric (regression by maximum likelihoodestimation for left-censored data using the function cenmle) ornonparametric (test censored empirical cumulative distributionfunction differences for left-censored data using the functioncendiff) three-group comparisons. When this test showed asignificant difference among regions (p< 0.05) for a particularcompound, then pairwise comparisons were used with theNADA functions along with a Bonferroni correction(a¼ 0.0167) to determine which regions were different fromeach other. A principal component analysis was conducted tovisualize differences among regions in the pattern of POPs. Thepercentage of SPOPs for each of the following classes wereused in the principal component analysis: SPCB, SDDTs,Schlordanes, mirex, dieldrin, SPBDEs, and Stoxaphenes. Halfthe RL was substituted for values less than RL only for theprincipal component analysis, and the percentages were scaledand centered. Site differences in POP patterns were determinedusing analysis of variance or Wilcoxon tests followed by Tukeymultiple comparison tests.
RESULTS AND DISCUSSION
Quality control
The POP concentrations measured in SRM 1946 and theloggerhead egg control material were on average 6% lower thancertified or reference values in SRM 1946 and 21% differentfrom the mean values of loggerhead egg control materialdetermined previously [4]. These differences met our criteriafor data quality.
Site differences in POP concentrations
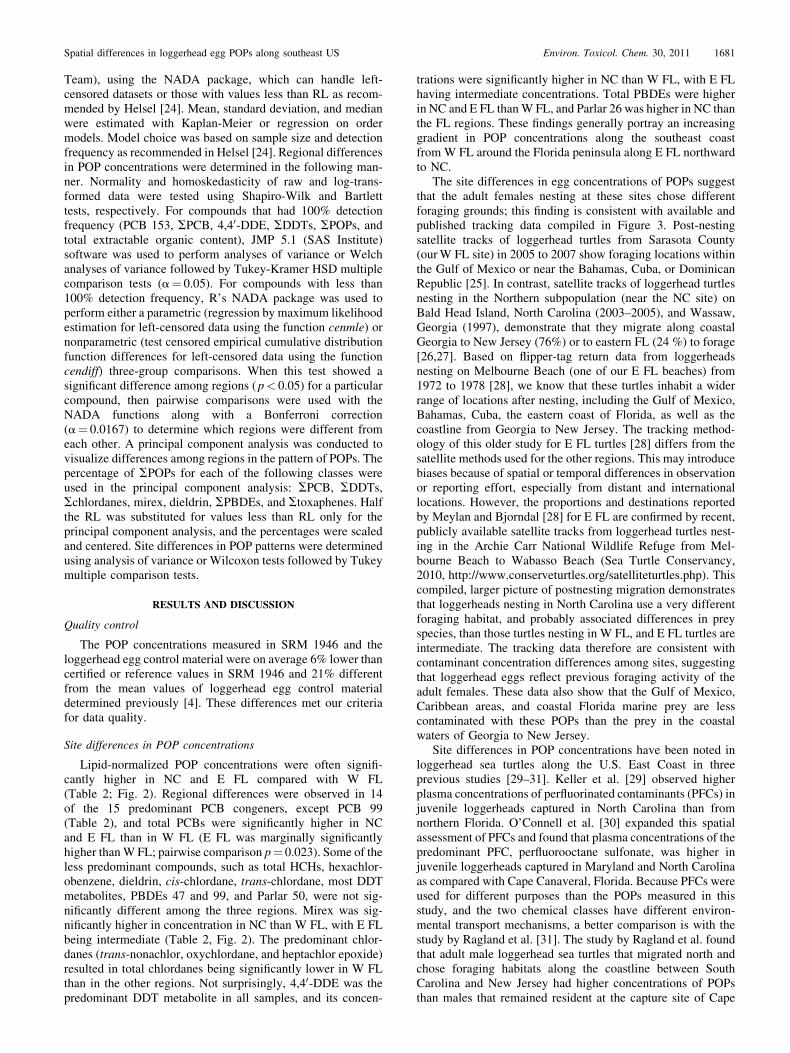
Lipid-normalized POP concentrations were often signifi-cantly higher in NC and E FL compared with W FL(Table 2; Fig. 2). Regional differences were observed in 14of the 15 predominant PCB congeners, except PCB 99(Table 2), and total PCBs were significantly higher in NCand E FL than in W FL (E FL was marginally significantlyhigher thanW FL; pairwise comparison p¼ 0.023). Some of theless predominant compounds, such as total HCHs, hexachlor-obenzene, dieldrin, cis-chlordane, trans-chlordane, most DDTmetabolites, PBDEs 47 and 99, and Parlar 50, were not sig-nificantly different among the three regions. Mirex was sig-nificantly higher in concentration in NC than W FL, with E FLbeing intermediate (Table 2, Fig. 2). The predominant chlor-danes (trans-nonachlor, oxychlordane, and heptachlor epoxide)resulted in total chlordanes being significantly lower in W FLthan in the other regions. Not surprisingly, 4,40-DDE was thepredominant DDT metabolite in all samples, and its concen-
trations were significantly higher in NC than W FL, with E FLhaving intermediate concentrations. Total PBDEs were higherin NC and E FL thanW FL, and Parlar 26 was higher in NC thanthe FL regions. These findings generally portray an increasinggradient in POP concentrations along the southeast coastfrom W FL around the Florida peninsula along E FL northwardto NC.
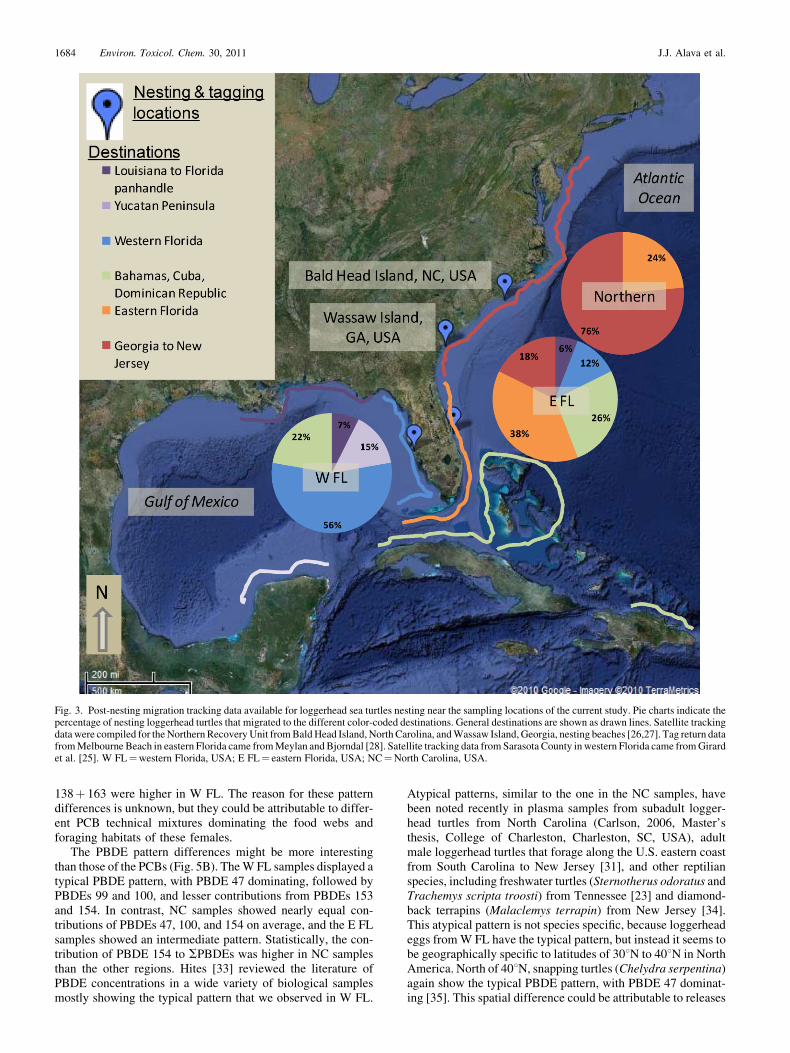
The site differences in egg concentrations of POPs suggestthat the adult females nesting at these sites chose differentforaging grounds; this finding is consistent with available andpublished tracking data compiled in Figure 3. Post-nestingsatellite tracks of loggerhead turtles from Sarasota County(ourW FL site) in 2005 to 2007 show foraging locations withinthe Gulf of Mexico or near the Bahamas, Cuba, or DominicanRepublic [25]. In contrast, satellite tracks of loggerhead turtlesnesting in the Northern subpopulation (near the NC site) onBald Head Island, North Carolina (2003–2005), and Wassaw,Georgia (1997), demonstrate that they migrate along coastalGeorgia to New Jersey (76%) or to eastern FL (24 %) to forage[26,27]. Based on flipper-tag return data from loggerheadsnesting on Melbourne Beach (one of our E FL beaches) from1972 to 1978 [28], we know that these turtles inhabit a widerrange of locations after nesting, including the Gulf of Mexico,Bahamas, Cuba, the eastern coast of Florida, as well as thecoastline from Georgia to New Jersey. The tracking method-ology of this older study for E FL turtles [28] differs from thesatellite methods used for the other regions. This may introducebiases because of spatial or temporal differences in observationor reporting effort, especially from distant and internationallocations. However, the proportions and destinations reportedby Meylan and Bjorndal [28] for E FL are confirmed by recent,publicly available satellite tracks from loggerhead turtles nest-ing in the Archie Carr National Wildlife Refuge from Mel-bourne Beach to Wabasso Beach (Sea Turtle Conservancy,2010, http://www.conserveturtles.org/satelliteturtles.php). Thiscompiled, larger picture of postnesting migration demonstratesthat loggerheads nesting in North Carolina use a very differentforaging habitat, and probably associated differences in preyspecies, than those turtles nesting in W FL, and E FL turtles areintermediate. The tracking data therefore are consistent withcontaminant concentration differences among sites, suggestingthat loggerhead eggs reflect previous foraging activity of theadult females. These data also show that the Gulf of Mexico,Caribbean areas, and coastal Florida marine prey are lesscontaminated with these POPs than the prey in the coastalwaters of Georgia to New Jersey.
Site differences in POP concentrations have been noted inloggerhead sea turtles along the U.S. East Coast in threeprevious studies [29–31]. Keller et al. [29] observed higherplasma concentrations of perfluorinated contaminants (PFCs) injuvenile loggerheads captured in North Carolina than fromnorthern Florida. O’Connell et al. [30] expanded this spatialassessment of PFCs and found that plasma concentrations of thepredominant PFC, perfluorooctane sulfonate, was higher injuvenile loggerheads captured in Maryland and North Carolinaas compared with Cape Canaveral, Florida. Because PFCs wereused for different purposes than the POPs measured in thisstudy, and the two chemical classes have different environ-mental transport mechanisms, a better comparison is with thestudy by Ragland et al. [31]. The study by Ragland et al. foundthat adult male loggerhead sea turtles that migrated north andchose foraging habitats along the coastline between SouthCarolina and New Jersey had higher concentrations of POPsthan males that remained resident at the capture site of Cape
Spatial differences in loggerhead egg POPs along southeast US Environ. Toxicol. Chem. 30, 2011 1681
Table
2.Persistentorganic
pollutantconcentrations(ng/g
lipid)andtotalextractable
organic
content(percentlipid)in
loggerheadseaturtle
pooledeggyolk
samplesfrom
nestslaid
inthreeregions.a
Compound
Western
Florida,
USA
Eastern
Florida,
USA
NorthCarolina,
USA
%>RL
nMedian
Mean
SE
Range
%>RL
nMedian
Mean
SE
Range
%>RL
nMedian
Mean
SE
Range
PCB
66
911
1.09A
1.09
NA
<0.398–5.33
46
24
0.445AB
2.53
1.15
<0.455–23.4
89
929.0
B19.5
6.2
<0.228–39.9
PCB
99
73
11
0.888
1.81
0.68
<0.472–8.08
83
24
4.58
21.6
10.5
<0.545–243
67
978.2
76.8
28.3
<0.653–208
PCB
105
64
11
0.528A
1.19
0.43
<0.318–4.45
88
24
3.21B
20.3
10.0
<0.398–188
100
943.2
B62.9
24.0
1.09–183
PCB
118
100
11
1.59A
3.45
1.32
0.624–15.3
100
24
10.7
B41.2
20.6
1.05–462
78
9200AB
165
56
<0.658–423
PCB
128
36
11
0.432A
0.918
0.292
<0.471–3.39
88
24
2.89B
10.2
4.5
<0.338–97.1
100
940.9
B46.7
15.9
1.06–118
PCB
138þ163
45
11
0.445A
3.33
1.61
<0.987–16.3
88
24
12.0
B57.8
26.9
<1.01–567
100
9165B
268
97
4.8–696
PCB
146
27
11
0.0583A
0.325
0.189
<0.052–2.01
54
24
0.781A
6.15
3.10
<0.310–70.1
89
927.9
B41.7
15.2
<0.721–112
PCB
153
100
11
5.26A
13.9
5.8
0.913–62.4
100
24
49.0
B121
43
2.79–761
100
9233C
371
125
15.6–898
PCB
170
73
11
0.343A
0.972
0.315
<0.291–2.91
100
24
3.79B
7.07
2.61
0.313–56
100
912.2
C25.2
8.2
0.894–64.1
PCB
180
64
11
0.823A
2.73
1.09
<0.474–9.68
96
24
7.78B
25.7
10.3
<0.773–205
100
935.4
B68.0
21.2
1.99–170
PCB
183
36
11
0.253A
0.987
0.373
<0.463–9.29
88
24
3.46B
8.19
3.08
<0.532–64.3
89
913.2
C29.6
9.8
<0.642–69.8
PCB
187
55
11
0.600A
1.23
0.45
<0.200–5.2
83
24
3.6
B14.7
6.8
<0.500–155
100
953.5
B87.1
30.9
0.8–219
PCB
193
911
<1.44A
<1.49
NA
<0.304–2.73
42
24
0.789AB
2.06
0.56
<0.279–10.7
67
91.40B
3.78
1.13
<0.868–8.37
PCB
194
45
11
0.560A
0.653
0.185
<0.239–1.66
67
24
1.41A
2.71
0.85
<0.256–16.1
89
93.53B
7.73
2.13
<0.714–18
PCB
199
40
10
0.470A
0.720
0.165
<0.527–1.93
55
22
1.52AB
4.31
1.32
<0.541–25.9
100
97.10B
14.0
4.7
0.454–31
TotalPCBs
100
11
11.4A
32.4
14.1
1.54–151
100
24
130B
372
148
7.13–3010
100
91030B
1460
493
32.9–3500
TotalHCHs
27
11
0.445
0.449
0.017
<0.406–1.09
38
24
0.283
1.21
0.49
<0.426–10.4
56
90.956
3.15
1.39
<0.543–13.1
HCB
20
10
0.182
0.423
0.172
<0.394–1.86
16
19
0.185
0.405
0.133
<0.385–2.42
33
90.0409
0.678
0.450
<0.504–4.14
Mirex
45
11
0.174A
1.04
0.53
<0.099–5.61
83
24
1.84AB
6.78
3.78
<0.092–90.2
100
99.56B
10.3
3.0
0.451–29.7
Dieldrin
100
11
3.95
5.06
1.09
1.79–14.7
88
24
6.71
10.0
1.9
<1.14–32
56
98.41
29.9
11.0
<1.98–76.1
cis-Chlordane
911
1.09
1.09
NA
<0.395–1.09
17
24
0.444
0.468
0.019
<0.86–1.85
09
<0.648
<0.635
NA
<0.505–<0.739
trans-Chlordane
10
10
<0.591
<0.663
NA
<0.438–1.09
14
22
0.183
0.321
0.094
<0.398–2.04
09
<0.669
<0.655
NA
<0.521–<0.762
cis-Nonachlor
18
11
0.126A
0.243
0.117
<0.126–1.41
50
24
0.559AB
1.34
0.30
<0.433–5.46
56
94.16B
7.26
1.61
<0.541–16.9
trans-Nonachlor
82
11
1.88A
5.92
2.68
<0.472–30.2
96
24
15.7
B42.8
15.1
<0.545–304
89
9145AB
176
68
<0.653–532
Oxychlordane
64
11
2.67A
10.5
5.5
<0.468–57.3
92
24
19.9
B47.8
13.0
<0.622–240
100
9105B
137
57
1.46–532
Heptachlorepoxide
82
11
3.05A
4.95
1.54
<0.470–16.9
96
24
11.0
B20.7
5.6
<0.709–115
89
937.3
AB
57.4
23.7
<0.651–214
Totalchlordanes
91
11
5.91A
20.8
9.6
<0.473–106
100
24
67.1
B113
31
0.731–558
100
9361B
375
146
3.85–1280
2,4
0 -DDD
010
<0.573
<0.640
NA
<0.395–<1.06
019
<0.624
<0.747
NA
<0.386–<1.85
09
<0.649
<0.635
NA
<0.505–0.739
2,4
0 -DDE
911
0.562
0.562
NA
<0.396–1.06
923
0.00128
0.451
0.405
<0.387–9.3
09
<0.650
<0.636
NA
<0.506–<0.740
4,4
0 -DDE
100
11
12.4
A22.7
7.0
0.811–74
100
24
55.0
AB
135
56
0.784–1030
100
9824B
690
250
1.89–2170
2,4
0 -DDTþ4,4
0 -DDD
45
11
0.519AB
1.23
0.45
<0.232–4.58
19
21
0.438A
0.709
0.253
<0.253–5.7
67
93.02B
3.15
0.20
<1.06–4.3
4,4
0 -DDT
011
<0.574
<2.03
NA
<0.394–<16.0
521
0.597
0.597
NA
<0.385–18.4
33
90.138
1.83
1.10
<0.504–8.4
TotalDDTs
100
11
13.9
A23.8
7.1
2.36–74
100
24
55.0
AB
136
56
0.784–1030
100
9829B
694
251
4.97–2170
PBDE47
60
10
0.664
0.766
0.077
<0.286–1.33
63
19
0.908
1.25
0.27
<0.343–4.41
89
91.46
2.61
0.96
<0.430–7.74
PBDE99
40
10
0.209
0.345
0.063
<0.136–0.474
32
19
0.155
0.348
0.078
<0.142–2.28
44
91.38
1.66
0.13
<0.180–13.9
PBDE100
20
10
0.243A
0.283
0.027
<0.114–0.758
32
19
0.261A
0.614
0.143
<0.137–1.25
67
92.73B
5.23
1.61
<0.151–2.17
PBDE153
010
<0.156A
<0.177
NA
<0.035–<0.098
32
19
0.111AB
0.335
0.094
<0.037–2.99
56
90.685B
1.02
0.15
<0.046–12
PBDE154
010
<0.0504A
<0.0570
NA
<0.108–<0.304
26
19
0.031A
0.304
0.160
<0.130–1.58
67
93.09B
5.68
1.34
<0.144–1.67
TotalPBDEs
60
10
0.664A
1.08
0.20
<0.136–2.56
68
19
1.44A
2.43
0.55
<0.163–7.82
100
97.80B
13.5
4.8
0.43–37
Parlar26
90
10
0.130A
0.206
0.048
<0.055–0.487
95
19
0.602B
1.06
0.29
<0.053–4.43
100
91.26B
2.32
0.84
0.145–7.04
Parlar50
80
10
0.131
0.182
0.048
<0.047–0.471
100
19
0.574
0.906
0.241
0.062–4.02
100
90.449
0.892
0.278
0.094–2.16
Totaltoxaphenes
90
10
0.270A
0.378
0.088
<0.055–0.813
100
19
0.921B
1.99
0.53
0.062–8.63
100
91.71AB
3.22
1.11
0.238–8.95
Totalextractable
organics(%
)100
11
8.42
8.65
0.82
2.6–12.7
100
24
7.40
7.68
0.54
4.53–13.1
100
97.41
7.68
0.33
6.51–9.51
%>RL¼percentageofnests
withconcentrationsabovethereportinglimit;n¼number
ofnests
analyzedindividually;SE¼standarderror;NA¼notavailable;PCB¼polychlorinated
biphenyl;HCHs¼hexachlor-
hexachlorocyclohexanes;HCB¼hexachlorobenzene;
DDD¼dichlorodiphenyldichloroethane;
DDE¼
dichlorodiphenyldichloroethylene;
DDT¼dichlorodiphenyltrichloroethane;
PBDEs¼polybrominated
diphenyl
ethers.
aDifferentlettersaftermedianvalues
indicateastatisticallysignificantdifference
amongregions.
1682 Environ. Toxicol. Chem. 30, 2011 J.J. Alava et al.
Canaveral, Florida. These three studies support the conclusionof the present study that sea turtles foraging farther north alongthe U.S. eastern seaboard have higher concentrations of POPs.
The reasons for this north–south concentration gradientlikely include a combination of many factors. O’Connellet al. [30] showed that PFC concentrations in loggerhead turtlescorrelated with human population within the turtle capturelocation watershed. Thus, simply the number of people residingand using chemicals within a watershed appears to influencewhat is available for sea turtles and their prey to accumulate, butthis logic cannot clearly explain why the W FL turtles, foragingmainly in the Gulf of Mexico, have lower contaminant con-centrations, because the Mississippi River watershed drains anextremely large area with a large human population. Thus, otherfactors must be involved, including, but not limited to, varyingtypes of land use in each watershed (agricultural, residential, vsindustrial), atmospheric transport of POPs away from warmersouthern waters toward the north, differences in sedimentationrate burying POPs as they enter the coastal regions, oceancurrents transporting POPs to or from localized habitats, gra-dients in primary productivity, or unknown biological differ-ences, such as different prey choices by turtles in differentforaging locations.
Based on the tracking information, one might predict that thevariability in contaminant concentrations would be greater inthe E FL samples, because those females forage in a widergeographical range than turtles nesting in the other two regions.This hypothesis was supported for SPCBs and 4,40-DDE, wherethe coefficients of variation were highest in the E FL samples(194 and 202%, respectively) than the other regions (101–144%). However, the highest coefficients of variation wereseen in W FL for Schlordanes and in NC for SPBDEs. Overall,these coefficients of variation demonstrate that POP concen-trations in loggerhead samples are quite variable. This largevariability is not surprising given the very large range used forforaging by each subpopulation as well as their omnivorousdiet. As a species, loggerhead turtles are considered generalists,but individuals are known to specialize in a small number ofprey items [32], which can contribute to large variability in POPconcentrations within any group of turtles.
Site differences in POP patterns
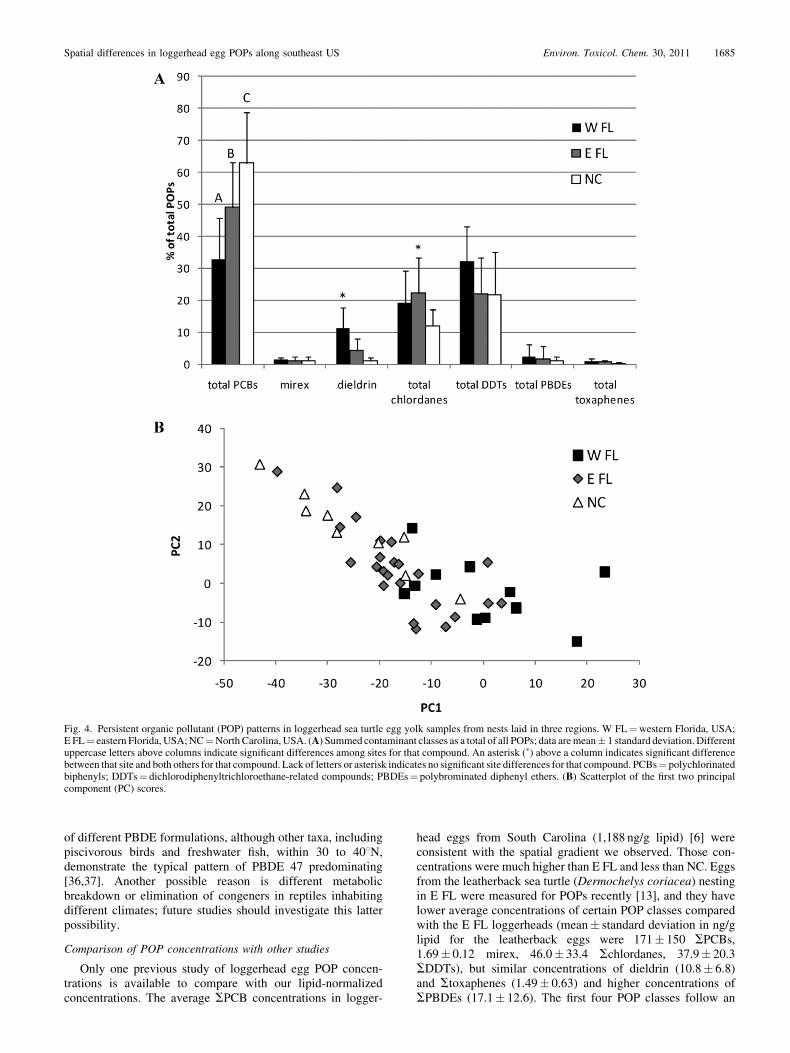
The SPCBs were the dominant group of compounds in allnests, and their contribution to SPOPs differed significantlyamong regions (Fig. 4A). The SPCBs represented 33% onaverage of SPOPs in W FL, 49% in E FL, and 63% in NC.The SDDTs and Schlordanes were the next highest class ofcontaminant measured in all three regions, followed by dieldrin.Mirex, SPBDEs, and Stoxaphenes made up minor contribu-tions (1.2%, 1.6%, 0.6%, respectively) of SPOPs. In addition toSPCBs, significant regional differences were observed in theproportion of SPOPs represented by dieldrin (higher in W FL)and Schlordanes (higher in E FL).
The principal component analysis resulted in the first twoprincipal components (PCs) accounting for 57% (35% for PC1and 22% for PC2) of the variation in POP patterns and largeoverlap among the regions on the PC score scatterplot (Fig. 4B).North Carolina and E FL overlap completely on this score plot,as does E FL with W FL, but NC and W FL separate somewhatalong both PC1 and PC2, revealing that the two most distantlocations differ the most in POP patterns. High loadings for PC1came from SPCBs and dieldrin, which is not surprising becausedieldrin made up a large percentage of the difference in SPOPcontributions seen between NC and W FL. In fact, W FL hadhigher average contributions of most pesticides (mirex, dieldrin,SDDTs, and Stoxaphenes) than E FL and NC, suggesting that,relative to PCBs, the Gulf of Mexico is more contaminated withpesticides than the western Atlantic Ocean. This finding is notsurprising when one considers the large agricultural watersheds(e.g., the Mississippi River) draining into the Gulf of Mexico,resulting in a higher proportion of legacy pesticide inputsrelative to more industrial PCB compounds.
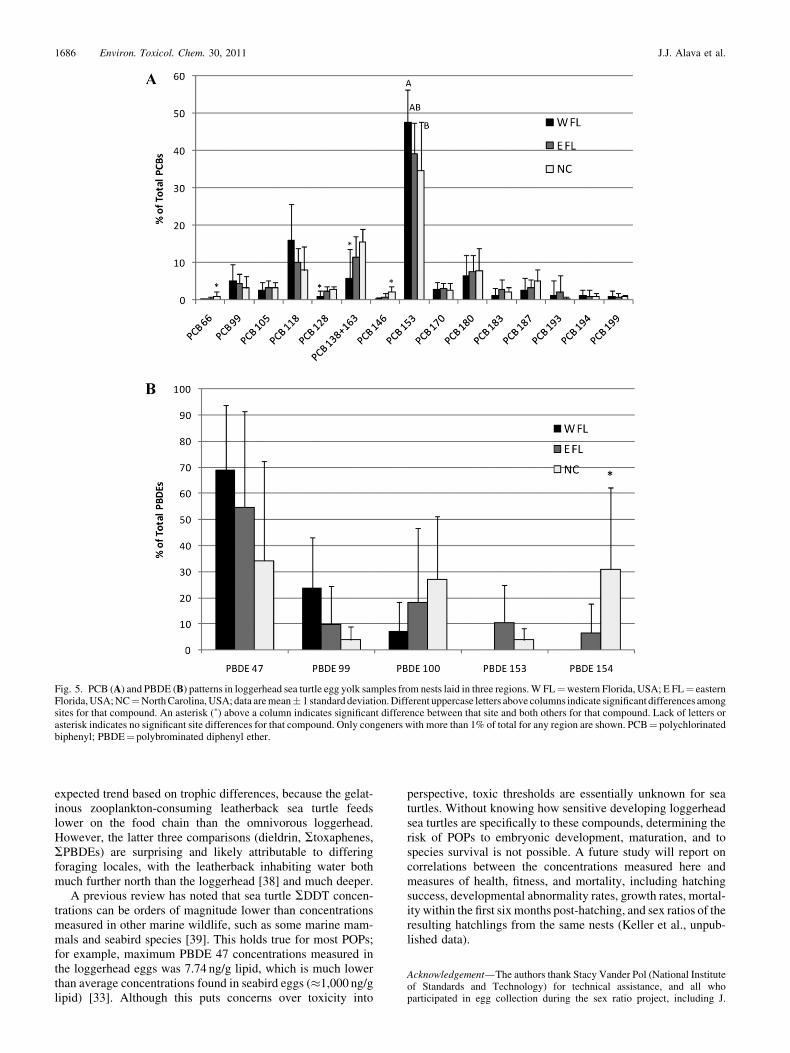
A more detailed look at the PCB congener patterns revealedsome regional differences (Fig. 5A). The overall PCB patternobserved is typical for biological samples, with congeners 99,105, 118, 138þ 163, 153, 170, 180, and 187 dominating.Interestingly, the contribution of PCB 153 was significantlyhigher in W FL than NC, with E FL being intermediate. Thecontributions of PCBs 66 and 146 to SPCBs were higher in NCthan the other regions, and contributions of PCBs 128 and
Fig. 2. Regional differences in persistent organic pollutant concentrations (ng/g lipid) in loggerhead sea turtle egg yolk samples from nests laid in three regions.Means and standard errors are shown. Different uppercase letters indicate significant differences among regions. W FL¼western Florida, USA; E FL¼ easternFlorida, USA; NC¼North Carolina, USA; PBDEs¼ polybrominated diphenyl ethers; 4,40-DDE¼ 4,40-dichlorodiphenyldichloroethylene; PCBs¼polychlorinated biphenyls.
Spatial differences in loggerhead egg POPs along southeast US Environ. Toxicol. Chem. 30, 2011 1683
138þ 163 were higher in W FL. The reason for these patterndifferences is unknown, but they could be attributable to differ-ent PCB technical mixtures dominating the food webs andforaging habitats of these females.
The PBDE pattern differences might be more interestingthan those of the PCBs (Fig. 5B). TheW FL samples displayed atypical PBDE pattern, with PBDE 47 dominating, followed byPBDEs 99 and 100, and lesser contributions from PBDEs 153and 154. In contrast, NC samples showed nearly equal con-tributions of PBDEs 47, 100, and 154 on average, and the E FLsamples showed an intermediate pattern. Statistically, the con-tribution of PBDE 154 to SPBDEs was higher in NC samplesthan the other regions. Hites [33] reviewed the literature ofPBDE concentrations in a wide variety of biological samplesmostly showing the typical pattern that we observed in W FL.
Atypical patterns, similar to the one in the NC samples, havebeen noted recently in plasma samples from subadult logger-head turtles from North Carolina (Carlson, 2006, Master’sthesis, College of Charleston, Charleston, SC, USA), adultmale loggerhead turtles that forage along the U.S. eastern coastfrom South Carolina to New Jersey [31], and other reptilianspecies, including freshwater turtles (Sternotherus odoratus andTrachemys scripta troosti) from Tennessee [23] and diamond-back terrapins (Malaclemys terrapin) from New Jersey [34].This atypical pattern is not species specific, because loggerheadeggs fromW FL have the typical pattern, but instead it seems tobe geographically specific to latitudes of 308N to 408N in NorthAmerica. North of 408N, snapping turtles (Chelydra serpentina)again show the typical PBDE pattern, with PBDE 47 dominat-ing [35]. This spatial difference could be attributable to releases
Fig. 3. Post-nesting migration tracking data available for loggerhead sea turtles nesting near the sampling locations of the current study. Pie charts indicate thepercentage of nesting loggerhead turtles that migrated to the different color-coded destinations. General destinations are shown as drawn lines. Satellite trackingdatawere compiled for the NorthernRecovery Unit fromBaldHead Island, North Carolina, andWassaw Island, Georgia, nesting beaches [26,27]. Tag return datafromMelbourne Beach in eastern Florida came fromMeylan and Bjorndal [28]. Satellite tracking data fromSarasota County inwestern Florida came fromGirardet al. [25]. W FL¼western Florida, USA; E FL¼ eastern Florida, USA; NC¼North Carolina, USA.
1684 Environ. Toxicol. Chem. 30, 2011 J.J. Alava et al.
of different PBDE formulations, although other taxa, includingpiscivorous birds and freshwater fish, within 30 to 408N,demonstrate the typical pattern of PBDE 47 predominating[36,37]. Another possible reason is different metabolicbreakdown or elimination of congeners in reptiles inhabitingdifferent climates; future studies should investigate this latterpossibility.
Comparison of POP concentrations with other studies
Only one previous study of loggerhead egg POP concen-trations is available to compare with our lipid-normalizedconcentrations. The average SPCB concentrations in logger-
head eggs from South Carolina (1,188 ng/g lipid) [6] wereconsistent with the spatial gradient we observed. Those con-centrations were much higher than E FL and less than NC. Eggsfrom the leatherback sea turtle (Dermochelys coriacea) nestingin E FL were measured for POPs recently [13], and they havelower average concentrations of certain POP classes comparedwith the E FL loggerheads (mean� standard deviation in ng/glipid for the leatherback eggs were 171� 150 SPCBs,1.69� 0.12 mirex, 46.0� 33.4 Schlordanes, 37.9� 20.3SDDTs), but similar concentrations of dieldrin (10.8� 6.8)and Stoxaphenes (1.49� 0.63) and higher concentrations ofSPBDEs (17.1� 12.6). The first four POP classes follow an
Fig. 4. Persistent organic pollutant (POP) patterns in loggerhead sea turtle egg yolk samples from nests laid in three regions. W FL¼western Florida, USA;E FL¼ eastern Florida, USA;NC¼NorthCarolina, USA. (A) Summed contaminant classes as a total of all POPs; data aremean� 1 standard deviation.Differentuppercase letters above columns indicate significant differences among sites for that compound. An asterisk (�) above a column indicates significant differencebetween that site and both others for that compound. Lack of letters or asterisk indicates no significant site differences for that compound. PCBs¼ polychlorinatedbiphenyls; DDTs¼ dichlorodiphenyltrichloroethane-related compounds; PBDEs¼ polybrominated diphenyl ethers. (B) Scatterplot of the first two principalcomponent (PC) scores.
Spatial differences in loggerhead egg POPs along southeast US Environ. Toxicol. Chem. 30, 2011 1685
expected trend based on trophic differences, because the gelat-inous zooplankton-consuming leatherback sea turtle feedslower on the food chain than the omnivorous loggerhead.However, the latter three comparisons (dieldrin, Stoxaphenes,SPBDEs) are surprising and likely attributable to differingforaging locales, with the leatherback inhabiting water bothmuch further north than the loggerhead [38] and much deeper.
A previous review has noted that sea turtle SDDT concen-trations can be orders of magnitude lower than concentrationsmeasured in other marine wildlife, such as some marine mam-mals and seabird species [39]. This holds true for most POPs;for example, maximum PBDE 47 concentrations measured inthe loggerhead eggs was 7.74 ng/g lipid, which is much lowerthan average concentrations found in seabird eggs (�1,000 ng/glipid) [33]. Although this puts concerns over toxicity into
perspective, toxic thresholds are essentially unknown for seaturtles. Without knowing how sensitive developing loggerheadsea turtles are specifically to these compounds, determining therisk of POPs to embryonic development, maturation, and tospecies survival is not possible. A future study will report oncorrelations between the concentrations measured here andmeasures of health, fitness, and mortality, including hatchingsuccess, developmental abnormality rates, growth rates, mortal-ity within the first six months post-hatching, and sex ratios of theresulting hatchlings from the same nests (Keller et al., unpub-lished data).
Acknowledgement—The authors thank Stacy Vander Pol (National Instituteof Standards and Technology) for technical assistance, and all whoparticipated in egg collection during the sex ratio project, including J.
Fig. 5. PCB (A) and PBDE (B) patterns in loggerhead sea turtle egg yolk samples from nests laid in three regions.W FL¼western Florida, USA; E FL¼ easternFlorida,USA;NC¼NorthCarolina,USA;data aremean� 1 standarddeviation.Different uppercase letters above columns indicate significant differences amongsites for that compound. An asterisk (�) above a column indicates significant difference between that site and both others for that compound. Lack of letters orasterisk indicates no significant site differences for that compound. Only congeners with more than 1% of total for any region are shown. PCB¼ polychlorinatedbiphenyl; PBDE¼ polybrominated diphenyl ether.
1686 Environ. Toxicol. Chem. 30, 2011 J.J. Alava et al.
Marsh,C.McClellan,M.Rush,K.Blair, L. Stokes,K.Stewart,M.Godfrey, J.Cordes, J. Foote, K. Rusenko, C. Johnson, M. Bresette, R. Herren, S. KubisHargrove, K. Roberts, and D. Bagley. This study would not have beenpossible without the efforts of many volunteers and staff from DukeUniversity, Florida Atlantic University, North Carolina Wildlife ResourcesCommission, Cape Lookout National Seashore, Mote Marine Laboratory,Gumbo Limbo Nature Center, Marinelife Center of Juno Beach, QuantumResources at theSt.LuciePowerPlant, andUniversity ofCentralFlorida.Thesex ratio project was funded by the U.S. Environmental Protection AgencySTAR grant R82-9094 (to J. Wyneken and L. Crowder). Academic supportand funding for J.J. Alava was provided by the Center for CoastalEnvironmentalHealth andBiomolecularResearch, theNationalOceanic andAtmospheric Administration, and the National Ocean Service. Certaincommercial equipment or instruments are identified in the paper to specifyadequately the experimental procedures. Such identification does notimply recommendations or endorsement by the National Institute ofStandards and Technology, nor does it imply that the equipment orinstruments are the best available for the purpose. This publication does notconstitute an endorsement of any commercial product or intend to be anopinion beyond scientific or other results obtained by the National Oceanicand Atmospheric Administration (NOAA). No reference shall be made toNOAA, or this publication furnished by NOAA, to any advertising or salespromotion which would indicate or imply that NOAA recommends orendorses any proprietary product mentioned herein, or which has as itspurpose an interest to cause the advertised product to be used or purchasedbecause of this publication.
REFERENCES
1. National Marine Fisheries Service and U.S. Fish and Wildlife Service.2008. Recovery Plan for the Northwest Atlantic Population ofLoggerheadTurtle (Caretta caretta), 2nd rev.NationalMarine FisheriesService, Silver Spring, MD.
2. Conant TA, Dutton PH, Eguchi T, Epperly SP, Fahy CC, Godfrey MH,MacPherson SL, Possardt EE, Schroeder BA, Seminoff JA, SnoverML,Upite CM, Witherington BE. 2009. Loggerhead sea turtle (Carettacaretta) 2009 status review under the U.S. Endangered Species Act.National Marine Fisheries Service, Silver Spring, MD, USA.
3. WitheringtonB, Kubilis P, Brost B,MeylanA. 2009. Decreasing annualnest counts in a globally important loggerhead sea turtle population.EcolAppl 19:30–54.
4. Alava JJ, Keller JM, Kucklick JR, Wyneken J, Crowder L, Scott GI.2006. Loggerhead sea turtle (Caretta caretta) egg yolk concentrations ofpersistent organic pollutants and lipid increase during the last stage ofembryonic development. Sci Total Environ 367:170–181.
5. Clark DR Jr, Krynitsky AJ. 1985. DDE residues and artificial incubationof loggerhead sea turtle eggs. Bull Environ Contam Toxicol 34:121–125.
6. Cobb GP, Wood PD. 1997. PCB concentrations in eggs andchorioallantoic membranes of loggerhead sea turtles (Caretta caretta)from theCapeRomainNationalWildlifeRefuge.Chemosphere34:539–549.
7. Alam SK, Brim MS. 2000. Organochlorine, PCB, PAH, and metalconcentrations in eggs of loggerhead sea turtles (Caretta caretta) fromNorthwest Florida, USA. J Environ Sci Health B 35:705–724.
8. Schroeder BA, Foley AM, Bagley DA. 2003. Nesting patterns,reproductive migrations, and adult foraging areas of loggerhead turtles.In Bolten AB, Witherington BE, eds, Loggerhead Sea Turtles.Smithsonian Books, Washington, DC, USA, pp 114–124.
9. Miller JD, Limpus CJ, Godfrey MH. 2003. Nest site selection,oviposition, eggs, development, hatching, and emergence of loggerheadturtles. In Bolten AB, Witherington BE, eds, Loggerhead Sea Turtles.Smithsonian Books, Washington, DC, USA, pp 125–143.
10. Guirlet E, Das K, Thome J-P, Girondot M. 2010. Maternal transfer ofchlorinated contaminants in the leatherback turtles, Dermochelyscoriacea, nesting in French Guiana. Chemosphere 79:720–726.
11. Kelly SM,EisenreichKM,Baker JE,RoweCL. 2008.Accumulation andmaternal transfer of polychlorinated biphenyls in snapping turtles of theUpper HudsonRiver, NewYork,USA.Environ Toxicol Chem 27:2565–2574.
12. van de Merwe JP, Hodge M, Whittier JM, Ibrahim K, Lee SY. 2010.Persistent organic pollutants in the green sea turtle Chelonia mydas:Nesting population variation, maternal transfer, and effects ondevelopment. Mar Ecol Prog Ser 403:269–278.
13. Stewart KS, Keller JM, Templeton R, Kucklick JR, Johnson C. 2011.Monitoring persistent organic pollutants in leatherback turtles
(Dermochelys coriacea) confirms maternal transfer. Mar Pollut Bull(in press).
14. Bergeron JM, Crews D, McLachlan JA. 1994. PCBs as environmentalestrogens: Turtle sex determination as a biomarker of environmentalcontamination. Environ Health Perspect 102:780–781.
15. Bishop CA, Ng P, Pettit KE, Kennedy SW, Stegeman JJ, Nostrom RJ,Brooks RJ. 1998. Environmental contamination and developmentalabnormalities in eggs and hatchlings of the common snapping turtle(Chelydra serpentina serpentina) from the Great Lakes-St. LawrenceRiver basin (1989–91). Environ Pollut 101:143–156.
16. Eisenreich KM, Kelly SM, Rowe CL. 2009. Latent mortality of juvenilesnapping turtles from the Upper Hudson River, New York, exposedmaternally andvia thediet to polychlorinatedbiphenyls (PCBs).EnvironSci Technol 43:6052–6057.
17. Guillette LJ Jr, Brock JW, Rooney AA, Woodward AR. 1999.Serum concentrations of various environmental contaminants andtheir relationship to sex steroid concentrations and phallus size injuvenile American alligators. Arch Environ Contam Toxicol 36:447–455.
18. Holliday DK, Elskus AA, Roosenburg WM. 2009. Impacts of multiplestressors on growth and metabolic rate of Malaclemys terrapin. EnvironToxicol Chem 28:338–345.
19. Willingham E. 2001. Embryonic exposure to low-dose pesticides:Effects on growth rate in the hatchling red-eared slider turtle. J ToxicolEnviron Health Part A 64:257–272.
20. Rauschenberger RH, Wiebe JJ, Sepulveda MS, Scarborough JE, GrossTS. 2007. Parental exposure to pesticides and poor clutch viability inAmerican alligators. Environ Sci Technol 41:5559–5563.
21. Wyneken J, Epperly SP, Crowder LB, Vaughan J, Esper KB. 2007.Determining sex in posthatchling loggerhead sea turtles usingmultiple gonadal and accessory duct characteristics. Herpetologica63:19–30.
22. Kucklick JR, Struntz WDJ, Becker PR, York GW, O’Hara TM,Bohonowych JE. 2002. Persistent organochlorine pollutants in ringedseals and polar bears collected from northern Alaska. Sci Total Environ287:45–59.
23. Moss S, Keller JM, Richards S, Wilson TP. 2009. Concentrations ofpersistentorganicpollutants inplasmafromtwospeciesof turtle fromtheTennessee River Gorge. Chemosphere 76:194–204.
24. Helsel DR. 2005.Nondetects andData Analysis: Statistics for CensoredEnvironmental Data. John Wiley & Sons, Hoboken, NJ, USA.
25. Girard C, Tucker AD, Calmettes B. 2009. Post-nesting migrations ofloggerhead sea turtles in theGulf ofMexico:Dispersal in highlydynamicconditions. Mar Biol 156:1827–1839.
26. Hawkes LA, Broderick AC, CoyneMS, GodfreyMH, Godley BJ. 2007.Only some like it hot: Quantifying the environmental niche of theloggerhead sea turtle. Divers Distrib 13:447–457.
27. Plotkin PT, Spotila JR. 2002. Post-nesting migrations of loggerheadturtles Caretta caretta from Georgia, USA: Conservation implicationsfor a genetically distinct subpopulation. Oryx 36:396–399.
28. MeylanAB,BjorndalKA. 1983. Sea turtles nesting atMelbourneBeach,Florida, II. Post-nesting movements of Caretta caretta. Biol Conserv26:79–90.
29. Keller JM, Alava JJ, Aleksa K, Young B, Kucklick JR. 2005.Spatial trends of polybrominated diphenyl ethers (PBDEs) inloggerhead sea turtle eggs and plasma. Organohalogen Compounds67:610–611.
30. O’Connell SG,ArendtM, SegarsA,KimmelT, Braun-McNeill J, AvensL, Schroeder B, Ngai L, Kucklick JR, Keller JM. 2010. Temporal andspatial trends of perfluorinated compounds in juvenile loggerhead seaturtles (Caretta caretta) along the east coast of theUnitedStates.EnvironSci Technol 44:5202–5209.
31. Ragland JM, Arendt MD, Kucklick JR, Keller JM. 2011. Persistentorganic pollutants in blood plasma of satellite-tracked adult maleloggerhead sea turtles (Caretta caretta). Environ Toxicol Chem (thisissue).
32. Vander Zanden HB, Bjorndal KA, Reich KJ, Bolten AB. 2010.Individual specialists in a generalist population: Results from a long-term stable isotope series. Biol Lett 6:711–714.
33. Hites RA. 2004. Polybrominated diphenyl ethers in the environment andin people: A meta-analysis of concentrations. Environ Sci Technol 38:945–956.
34. Basile ER, Avery HW, Keller JM, Bien WF, Spotila JR. 2011.Diamondback terrapins as indicator species of persistent organicpollutants: Using Barnegat Bay, New Jersey as a case study. Chemo-sphere 82:137–144.
Spatial differences in loggerhead egg POPs along southeast US Environ. Toxicol. Chem. 30, 2011 1687

35. de Solla SR, Fernie KJ, Letcher RJ, Chu SG,DrouillardKG, Shahmiri S.2007. Snapping turtles (Chelydra serpentina) as bioindicators inCanadian areas of concern in the Great Lakes Basin. 1. Polybrominateddiphenyl ethers, polychlorinated biphenyls, and organochlorine pesti-cides in eggs. Environ Sci Technol 41:7252–7259.
36. Chen D, Hale RC, Watts BD, La Guardia MJ, Harvey E, Mojica EK.2010. Species-specific accumulation of polybrominated diphenyl etherflame retardants in birds of prey from the Chesapeake Bay region, USA.Environ Pollut 158:1883–1889.
37. HaleRC,LaGuardiaMJ,HarveyEP,MainorTM,DuffWH,GaylorMO.2001. Polybrominated diphenyl ether flame retardants in Virginiafreshwater fishes (USA). Environ Sci Technol 35:4585–4591.
38. PlotkinP.2003.Adultmigrationsandhabitat use. InLutzPL,Musick JA,Wyneken J, eds, The Biology of Sea Turtles, Vol II. CRC, Boca Raton,FL, USA, pp 225–241.
39. Pugh RS, Becker PR. 2001. Sea turtle contaminants: A review withannotated bibliography. NISTIR 6700. Report. National Institute ofStandards and Technology, Charleston, SC, USA.
1688 Environ. Toxicol. Chem. 30, 2011 J.J. Alava et al.


![Loggerhead Sea Turtle Final[1]](https://img.pdfslide.net/doc/110x75/616b5b2ba9eefc2a5f618e00/loggerhead-sea-turtle-final1.jpg)