Embed Size (px)
Citation preview
Geographies of transition and the separation oflower and higher attaining pupils in the movefrom primary to secondary school in London
Richard Harris
Critics of education reforms in England argue they are socially and academically divisive because some groupsof pupils are more able to exercise choice than others. This paper looks at the transitions made by pupils fromstate-funded primary to secondary schools in London in 2008. It examines the flows from the one to the other,determining which secondary schools recruit from the same feeder primary schools and which may be said tobe competing. Using a measure of ‘best in class’, evidence is found of higher and lower attaining pupils separat-ing from each other with the former more likely to be enrolled in selective schools (unsurprisingly given theyset entrance examinations) and also some types of faith school (which do not). The separations are evidentbetween locally competing schools but with no evidence they are worsening over the period 2003 to 2008. Thisapparent inertia suggests the paradox of promoting school choice within a system that imposes geographicalconstraints upon that choice and may, as a result, simply reinforce existing social divisions.
Key words primary school; secondary school; transition; London; competition; segregation
School of Geographical Sciences, University of Bristol, Bristol BS8 1SSEmail: [email protected]
Revised manuscript received 1 February 2012
Introduction
Educational reforms in England over the last two-and-half decades have moved away from a com-prehensive system where most pupils attend a localstate-funded school to one where parental choice ispromoted, diversity is encouraged and schools aregiven more autonomy to compete in a quasi-marketfor pupils and funding (Benn 2011). The motivationfor these changes is market economics: the belief thatcompetition drives-up standards, encourages innova-tion and makes the institutions more accountable tothe parents and pupils they serve. Parents and theirchildren are not, however, consumers free to chooseany school of their liking. School places are limited,especially at the most popular schools. Consequently,there is no guarantee of being admitted to a preferredschool. To some,
‘choice’ has little to do with driving up quality but is moreabout managing supply and demand and demonising anincreasing number of so-called ‘failing’ schools in relativelydeprived catchment areas which do not deserve the label.(Butler and Hamnett 2010, 2449)
That view is contentious. To advocates, choice withinthe education system is a way to end ‘selection bymortgage’, where those in relatively deprived areashave no option but to attend their local school,regardless of its quality. Nevertheless, the view doesconvey a concern that the ability to exercise choice is
allied to economic privilege and not equally distrib-uted amongst population groups (Weekes-Bernard2007).
Based on the examination attainment of pupils andsupplemented by school inspectorate reports, metricsof school quality are of particular concern. These arewidely published in so-called ‘league tables’ ofschools, their results then capitalised in the increasedcost of housing around well-regarded schools (Jones2009). The concern is that unequal financial andsocial resources lead to unequal opportunity to attendthe highest performing schools, creating polarisedschool intakes, inequalities of opportunity and thereproduction of social divisions. It is not at all clearthat school choice policies have increased social seg-regation in this way, however (for an extensive reviewsee Harris 2011b).
During the late 1960s and throughout the 1970s,the grammar school system that had taught the(seemingly) most academically able pupils in differentschools from others had been replaced by a compre-hensive system in most (but not all) local authorities.To Galindo-Rueda and Vignoles (2005), more recenteducational policies are an attempt to reintroduce orincrease selective admissions. Similarly Benn writes,
every piece of legislation over the past twenty-five yearshas resulted in more, rather than less, selection, covert orovert [ . . . ] compounded by social selection and, increas-ingly, selection on grounds of faith. (2011, 88)
Citation: 2012 doi: 10.1111/j.1475-5661.2012.519.xISSN 0020-2754 � 2012 The Author.
Transactions of the Institute of British Geographers � 2012 Royal Geographical Society (with the Institute of British Geographers)
If that is so, then we should expect to see increasedsorting of higher and lower attaining pupils into dif-ferent schools, adding weight to the argument thatmarket-based changes to the educational system aredivisive.
To that end, this paper uses methods of statisticaland spatial analysis to look at the patterns of transi-tion made by pupils from primary to secondaryschools in London. Local patterns of competition aredefined between secondary schools and used to deter-mine whether some schools recruit more of the pupilswho did better in standardised tests taken prior toleaving primary school. Evidence is found that higherand lower attaining pupils separate from each otheras they make the transition into secondary schools,with the ‘best in class’ pupils more likely to be foundin selective schools (that set entrance exams), andalso in those faith schools that have greatest controlover their admissions policies. However, the degree ofseparation remains broadly constant over the period2003 to 2008, with no evidence that it is either wors-ening or improving. This finding concurs with otherstudies finding little evidence that social, ethnic oracademic segregation have increased under a choicesystem. The paper concludes by discussing the impli-cations of this stability.
Segregation, separation and the localmarkets for schools
Whereas issues of social and ethic segregation havebeen well studied in relation to the English educationreforms (see, inter alia, Brimicombe 2007; Burgesset al. 2005; Goldstein and Noden 2003; Gorard et al.2003; Johnston et al. 2006 2007), less attention hasbeen given to whether pupils of different measuredability go on to attend different schools from eachother. An exception is the study by Gibbons and Tel-haj (2007) that found, for London as well as for therest of England, that almost nothing changed duringthe period from 1996 to 2002 in terms of the waypupils of differing age-11 ability are sorted into differ-ent secondary schools. They reached this conclusionby using Pupil Level Annual School Census (PLASC) ⁄National Pupil Database (NPD) data providing infor-mation on individual pupils within state schools inEngland, including their attainment level in the com-pulsory tests taken aged 11 in the final year of primaryschooling. Since the data show which primary schoolthe pupil has attended and also which secondaryschool they now do attend, it is possible to look atwhether each secondary is recruiting higher or lowerattaining pupils. Gibbons and Telhaj do this by graph-ing the cumulative distribution of pupil ability acrossschool intakes and by decomposing the pupil varianceof ability to between and within schools.
Burgess et al. (2008) also use PLASC ⁄NPD data,in their case to show that in 2004 and in England,high ability pupils are more likely to go to the modalsecondary school for their primary school cohort ifthat secondary school is better than average in termsof its pupils’ attainment, with the reverse being truefor lower ability pupils. They also show that ‘poorpupils’, as defined by free school meal (FSM) eligibil-ity, are less likely to go to the modal secondary schoolwhen it is better than average but more likely to gowhen it is worse. In other words, they find a bifurca-tion of higher and lower attaining pupils and, notuncorrelated, of richer and poorer ones in the transitionfrom primary to secondary school.
The current paper differs from these previous stud-ies by giving more specific focus to the patterns oftransition made by pupils from primary to secondaryschool in London. That information is used to formunderstandings of which schools are competing witheach other comparing school intakes using a localindex of difference.
The importance of linking measures of separation,or of segregation, to the local markets within whichschools operate is stressed by Harris and Johnston(2008) and Harris (2011a), after Gibson and Asthana(2000), the last of these authors noting:
in trying to establish whether or not the marketization ofeducation has had a polarizing effect, the unit of analysismust [ . . . ] be the local market within which schools (andparents faced with placement decisions) actually operate.(2000, 139)
Expressed another way, consideration must be givento the spatial properties of markets, choice and ofcompetition when measuring whether facets of theeducation system cause some groups of pupils to befound in some schools but not in others. To assume,tacitly or otherwise, that schools are competing witheach other within a local education authority is notsufficient. Though there has been much discussion onthe virtues or otherwise of various indices of separation ⁄segregation ⁄ polarisation (see, among others, Allenand Vignoles 2007; Gibson and Asthana 2003; Gold-stein and Noden 2003 2004; Gorard 2000 2004 2007;Johnston and Jones 2010; Peach 2009; Poulsen et al.2001), less attention has been paid to the areal unitsof analysis (but see Harris and Johnston 2003; Lloyd2012; Reardon and O’Sullivan 2004; Shuttleworthet al. 2011).
Throughout the paper, separation is preferred overanother commonly used word, segregation. Thoughthe two can be synonyms, the latter often acquires apejorative interpretation when it is taken to implythat two or more groups of people are actively avoid-ing each other and ⁄ or are being kept apart due tosome underlying structural properties of, in this case,
2 Richard Harris
Citation: 2012 doi: 10.1111/j.1475-5661.2012.519.xISSN 0020-2754 � 2012 The Author.Transactions of the Institute of British Geographers � 2012 Royal Geographical Society (with the Institute of British Geographers)
the education system. In addition, the language ofsegregation tends to presume that separations – byrace, by wealth, by attainment – are necessarily unde-sirable even though cogent arguments are sometimesmade to the contrary (Merry 2011). From a liber-tarian and, arguably, a social justice point of view(Brighouse 2002), the key issue is whether the separa-tions are voluntary or not. Though no definitiveanswer is possible from this type of study, the evidentstability in the degree of separation of higher andlower attaining pupils in London over the period from2003 to 2008 (and 1996 to 2002 in Gibbons and Tel-haj’s study) will suggest there are strong social andgeographical constraints impacting upon schoolchoices that enforce and reinforce the geographies oftransition, and that recent educational reforms havedone little to change.
Geographies of transition in London
The PLASC ⁄NPD dataset used for this study is com-prised of 376 577 records of pupils who made the tran-sition from a primary to a secondary school in Londonduring any of the years from 2003 to 2008. After somecleaning of the data, primarily to omit missing recordsbut also pupils with exceptionally low attainmentscores (in the lowest 0.5%, that might otherwise skewthe analysis), 365 917 records remain (97%). Thenumber of pupils and of schools per year is recordedin Table I, together with information about the typesof school. Also included is the mean attainment andstandard deviation achieved by the pupils in the stan-dardised test that each takes during their final year ofprimary schooling (Key Stage 2). Of the school typesappearing in the table, voluntary-aided (VA) and otherfaith schools have greater latitude to set their ownadmissions criteria than voluntary-controlled (VC)faith schools, and these criteria may include demon-strated commitment to the faith group. Selectiveschools are those that set an entrance examination.
The geographies of transition in London are com-plex. Burgess et al. (2008) find that there is an aver-
age of 37 feeder primary schools per secondaryschool in London. A near identical value is foundhere for the year 2008, if all the pupils into every sec-ondary school are considered. However, that is toinclude what might be regarded as exceptional cases,exaggerating the complexity of the system. If, instead,each secondary school is considered in turn, rankingeach of its feeder primary schools in order of the pro-portion of the secondary school’s intake they sendthat year, finally retaining only those primaries thattogether (and in rank order) form the first 80 percent of the intake into the secondary, then cases ofprimary schools sending few pupils to a secondary willbe discarded.
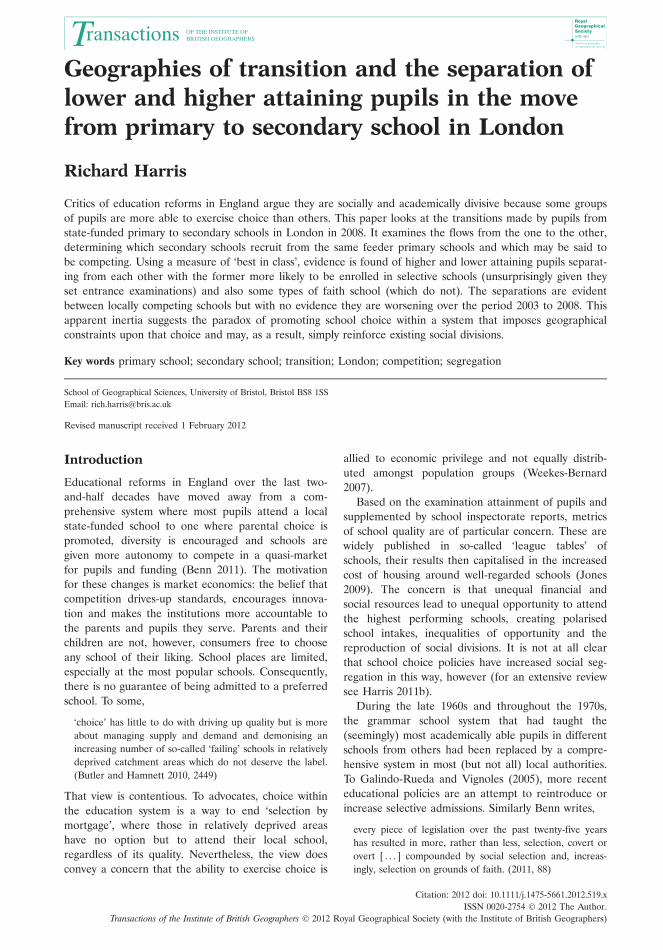
At this 80 per cent threshold, and across the wholeof Greater London, the average number of feeder pri-mary schools per secondary is less than half its previ-ous value: the mean and median numbers are 16 and15, respectively, with an interquartile range from 9 to23 (but an entire range from 3 to 61 schools). Distinctgeographical patterns (clusters of schools) emergewhen the focus is narrowed further and only the firsthalf of the intake into each secondary school is con-sidered. These transitions are mapped for a part ofLondon in Figure 1. Following Burgess et al. (2008),the map is topological. The connections between thesecondary and feeder primary schools are correct, butthe geographical locations are not. This helps pre-serve the anonymity of individual schools.
It has been reported that only one quarter ofpupils in London go to their nearest secondaryschool. However, they need not be travelling far. Onaverage, a secondary school in London has 17 otherswithin a 10-minute drive from it (Burgess et al. 2006).Pragmatic reasons such as ease of travel or being withfriends and peers can lead someone to prefer a closeschool. Moreover, because places at the most popularschools need to be rationed when demand exceedssupply, and because the criteria for a place regularlyinclude proximity to the school, as Hamnett and But-ler observe for their study of East London, ‘the mostimportant single influence in all boroughs, irrespective
Table I Numbers of pupils and schools in the data set for each of the years from 2003 to 2008, and the meanattainment and standard deviation of the pupils’ standardised test scores
Final yearof primaryschool
Number ofpupils
Number ofschools
Number ofacademicallyselectiveschools
Number ofvoluntary-aidedfaith schools
Number ofvoluntary-controlledfaith schools
Number ofother faithschools
Meanattainmentscore
Standarddeviation
2003 59 922 383 19 89 4 7 27.4 4.282004 60 861 381 19 88 4 7 27.4 4.342005 61 816 381 19 88 4 7 27.5 4.302006 62 325 382 19 88 4 7 27.6 4.392007 59 758 373 19 88 5 7 27.8 4.292008 61 235 367 19 88 5 7 27.8 4.05
Geographies of transition 3
Citation: 2012 doi: 10.1111/j.1475-5661.2012.519.xISSN 0020-2754 � 2012 The Author.
Transactions of the Institute of British Geographers � 2012 Royal Geographical Society (with the Institute of British Geographers)
of their other differences (social, ethnic or educa-tional), on who gets places in high-demand schools isplace of residence’ (2011, 493).
Recognising the community role of schools, a gen-eral preference for ease of access and local schooling,and noting the constraints of geographically basedadmissions criteria, it is not surprising if many pupilsattend a relatively local school (Harris 2011b).
Such constraints need not be undesirable. Suther-land et al. (2010) identify the uneasy tension betweenthe promotion of school choice (where it creates tran-sitions over greater distances) and the priority givento locally based partnership working between schoolsand other children’s services in the delivery ofextended services (for example, after-school clubs),especially where that geographically focused workingis instrumental in aiding the ease of transition fromprimary to secondary school for more vulnerable andless confident pupils (cf. DCSF 2008 2009). Neverthe-less, the imposition of admissions criteria can anddoes conflict with the notion of choice.
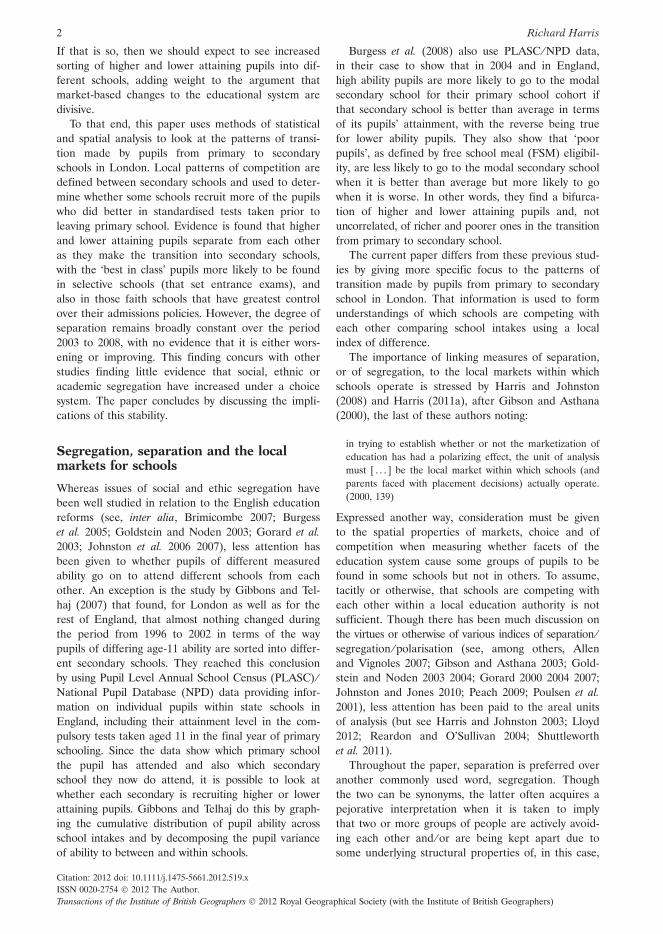
Figure 2 shows that a typical secondary school (inLondon) recruits the majority of its pupils from a rel-atively smaller number of primary schools (average,six) but that number rises exponentially as an increas-ingly greater proportion of the pupils is considered.Not surprisingly, the average transition distance risestoo. For 50 per cent of the intake, the mediandistance between a secondary school and its feederprimary schools is 1.4 km, for 80 per cent it is 2.0 km,and for the complete intake it is 3.1 km. The data are
for 2008, but the same trends are observed for otheryears in the data.
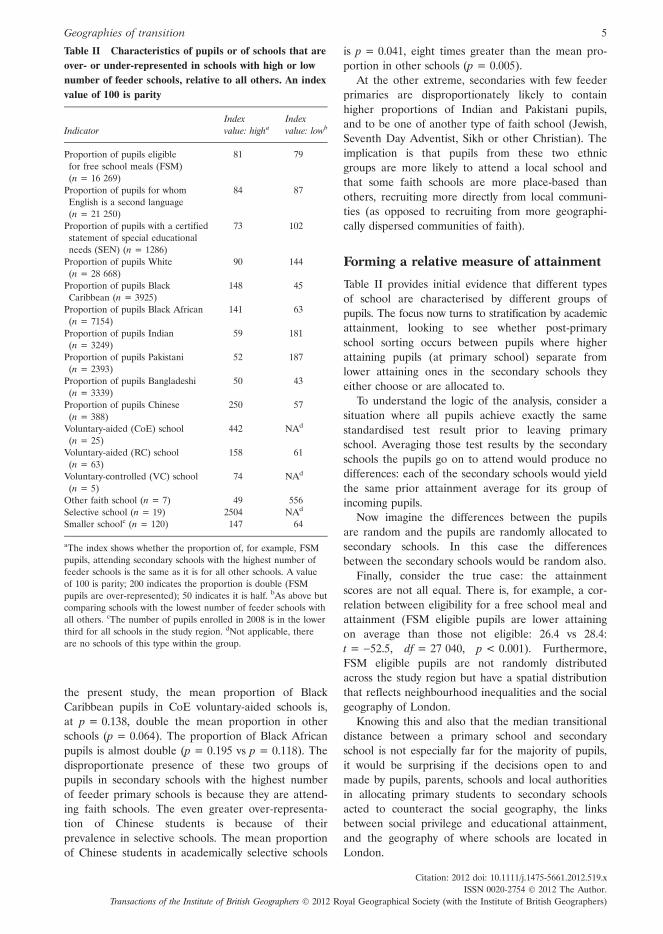
Looking at the composition of secondary schoolsthat have the most and least numbers of feeder pri-mary schools is instructive; most and least defined,respectively, by secondary schools in the upper orlower quartile of the numbers at the 80 per centthreshold of Figure 2. Table II gives indices revealingcharacteristics of pupils making the transition fromprimary to secondary school in London in 2008 thatdisproportionally are found in the schools with mostor least feeder schools, relative to all others. An indexvalue of 100 indicates parity.
Schools selecting by academic attainment are dis-proportionately over-represented by a factor of 25amongst schools with the highest number of feederprimary schools. Voluntary-aided Church of England(CoE) and Roman Catholic (RC) schools also areover-represented. Each of these school types employsselection criteria; by entrance examination for theschools selecting by academic attainment and byincluding commitment either to the faith group or tothe school’s ethos amongst the admissions criteria forthe faith schools. Admissions to these schools are lessdetermined by geographical criteria than for otherschools. Consequently, they can recruit from a greaternumber of primaries.
Butler and Hamnett (2010) identify how black par-ents favour faith schools as a ‘circuit of schooling’ fortheir children in East London, a choice that oftenrequires travel between the London boroughs. For
Figure 2 Typical number of feeder primary schools asecondary school in London has for a certain percentage
of its intake in 2008Note: For example, the median average for the entireintake is 38 but can be greater than 60 or less than 22
for some schools
Figure 1 Links between primary and secondary schoolsfor the first 50% of the intake into each secondary school
in 2008Note: For London as a whole the average secondary
school receives half of its intake from six feeder primaryschools
4 Richard Harris
Citation: 2012 doi: 10.1111/j.1475-5661.2012.519.xISSN 0020-2754 � 2012 The Author.Transactions of the Institute of British Geographers � 2012 Royal Geographical Society (with the Institute of British Geographers)
the present study, the mean proportion of BlackCaribbean pupils in CoE voluntary-aided schools is,at p = 0.138, double the mean proportion in otherschools (p = 0.064). The proportion of Black Africanpupils is almost double (p = 0.195 vs p = 0.118). Thedisproportionate presence of these two groups ofpupils in secondary schools with the highest numberof feeder primary schools is because they are attend-ing faith schools. The even greater over-representa-tion of Chinese students is because of theirprevalence in selective schools. The mean proportionof Chinese students in academically selective schools
is p = 0.041, eight times greater than the mean pro-portion in other schools (p = 0.005).
At the other extreme, secondaries with few feederprimaries are disproportionately likely to containhigher proportions of Indian and Pakistani pupils,and to be one of another type of faith school (Jewish,Seventh Day Adventist, Sikh or other Christian). Theimplication is that pupils from these two ethnicgroups are more likely to attend a local school andthat some faith schools are more place-based thanothers, recruiting more directly from local communi-ties (as opposed to recruiting from more geographi-cally dispersed communities of faith).
Forming a relative measure of attainment
Table II provides initial evidence that different typesof school are characterised by different groups ofpupils. The focus now turns to stratification by academicattainment, looking to see whether post-primaryschool sorting occurs between pupils where higherattaining pupils (at primary school) separate fromlower attaining ones in the secondary schools theyeither choose or are allocated to.
To understand the logic of the analysis, consider asituation where all pupils achieve exactly the samestandardised test result prior to leaving primaryschool. Averaging those test results by the secondaryschools the pupils go on to attend would produce nodifferences: each of the secondary schools would yieldthe same prior attainment average for its group ofincoming pupils.
Now imagine the differences between the pupilsare random and the pupils are randomly allocated tosecondary schools. In this case the differencesbetween the secondary schools would be random also.
Finally, consider the true case: the attainmentscores are not all equal. There is, for example, a cor-relation between eligibility for a free school meal andattainment (FSM eligible pupils are lower attainingon average than those not eligible: 26.4 vs 28.4:t = )52.5, df = 27 040, p < 0.001). Furthermore,FSM eligible pupils are not randomly distributedacross the study region but have a spatial distributionthat reflects neighbourhood inequalities and the socialgeography of London.
Knowing this and also that the median transitionaldistance between a primary school and secondaryschool is not especially far for the majority of pupils,it would be surprising if the decisions open to andmade by pupils, parents, schools and local authoritiesin allocating primary students to secondary schoolsacted to counteract the social geography, the linksbetween social privilege and educational attainment,and the geography of where schools are located inLondon.
Table II Characteristics of pupils or of schools that areover- or under-represented in schools with high or lownumber of feeder schools, relative to all others. An indexvalue of 100 is parity
IndicatorIndexvalue: higha
Indexvalue: lowb
Proportion of pupils eligiblefor free school meals (FSM)(n = 16 269)
81 79
Proportion of pupils for whomEnglish is a second language(n = 21 250)
84 87
Proportion of pupils with a certifiedstatement of special educationalneeds (SEN) (n = 1286)
73 102
Proportion of pupils White(n = 28 668)
90 144
Proportion of pupils BlackCaribbean (n = 3925)
148 45
Proportion of pupils Black African(n = 7154)
141 63
Proportion of pupils Indian(n = 3249)
59 181
Proportion of pupils Pakistani(n = 2393)
52 187
Proportion of pupils Bangladeshi(n = 3339)
50 43
Proportion of pupils Chinese(n = 388)
250 57
Voluntary-aided (CoE) school(n = 25)
442 NAd
Voluntary-aided (RC) school(n = 63)
158 61
Voluntary-controlled (VC) school(n = 5)
74 NAd
Other faith school (n = 7) 49 556Selective school (n = 19) 2504 NAd
Smaller schoolc (n = 120) 147 64
aThe index shows whether the proportion of, for example, FSMpupils, attending secondary schools with the highest number offeeder schools is the same as it is for all other schools. A valueof 100 is parity; 200 indicates the proportion is double (FSMpupils are over-represented); 50 indicates it is half. bAs above butcomparing schools with the lowest number of feeder schools withall others. cThe number of pupils enrolled in 2008 is in the lowerthird for all schools in the study region. dNot applicable, thereare no schools of this type within the group.
Geographies of transition 5
Citation: 2012 doi: 10.1111/j.1475-5661.2012.519.xISSN 0020-2754 � 2012 The Author.
Transactions of the Institute of British Geographers � 2012 Royal Geographical Society (with the Institute of British Geographers)
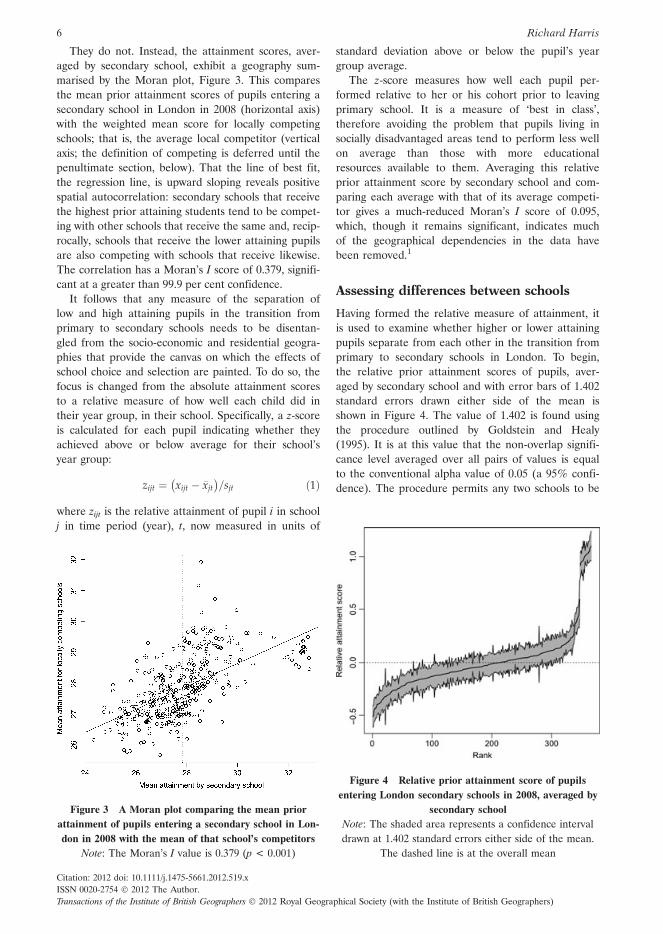
They do not. Instead, the attainment scores, aver-aged by secondary school, exhibit a geography sum-marised by the Moran plot, Figure 3. This comparesthe mean prior attainment scores of pupils entering asecondary school in London in 2008 (horizontal axis)with the weighted mean score for locally competingschools; that is, the average local competitor (verticalaxis; the definition of competing is deferred until thepenultimate section, below). That the line of best fit,the regression line, is upward sloping reveals positivespatial autocorrelation: secondary schools that receivethe highest prior attaining students tend to be compet-ing with other schools that receive the same and, recip-rocally, schools that receive the lower attaining pupilsare also competing with schools that receive likewise.The correlation has a Moran’s I score of 0.379, signifi-cant at a greater than 99.9 per cent confidence.
It follows that any measure of the separation oflow and high attaining pupils in the transition fromprimary to secondary schools needs to be disentan-gled from the socio-economic and residential geogra-phies that provide the canvas on which the effects ofschool choice and selection are painted. To do so, thefocus is changed from the absolute attainment scoresto a relative measure of how well each child did intheir year group, in their school. Specifically, a z-scoreis calculated for each pupil indicating whether theyachieved above or below average for their school’syear group:
zijt ¼ xijt � �xjt
� �=sjt ð1Þ
where zijt is the relative attainment of pupil i in schoolj in time period (year), t, now measured in units of
standard deviation above or below the pupil’s yeargroup average.
The z-score measures how well each pupil per-formed relative to her or his cohort prior to leavingprimary school. It is a measure of ‘best in class’,therefore avoiding the problem that pupils living insocially disadvantaged areas tend to perform less wellon average than those with more educationalresources available to them. Averaging this relativeprior attainment score by secondary school and com-paring each average with that of its average competi-tor gives a much-reduced Moran’s I score of 0.095,which, though it remains significant, indicates muchof the geographical dependencies in the data havebeen removed.1
Assessing differences between schools
Having formed the relative measure of attainment, itis used to examine whether higher or lower attainingpupils separate from each other in the transition fromprimary to secondary schools in London. To begin,the relative prior attainment scores of pupils, aver-aged by secondary school and with error bars of 1.402standard errors drawn either side of the mean isshown in Figure 4. The value of 1.402 is found usingthe procedure outlined by Goldstein and Healy(1995). It is at this value that the non-overlap signifi-cance level averaged over all pairs of values is equalto the conventional alpha value of 0.05 (a 95% confi-dence). The procedure permits any two schools to be
Figure 3 A Moran plot comparing the mean priorattainment of pupils entering a secondary school in Lon-don in 2008 with the mean of that school’s competitors
Note: The Moran’s I value is 0.379 (p < 0.001)
Figure 4 Relative prior attainment score of pupilsentering London secondary schools in 2008, averaged by
secondary schoolNote: The shaded area represents a confidence intervaldrawn at 1.402 standard errors either side of the mean.
The dashed line is at the overall mean
6 Richard Harris
Citation: 2012 doi: 10.1111/j.1475-5661.2012.519.xISSN 0020-2754 � 2012 The Author.Transactions of the Institute of British Geographers � 2012 Royal Geographical Society (with the Institute of British Geographers)
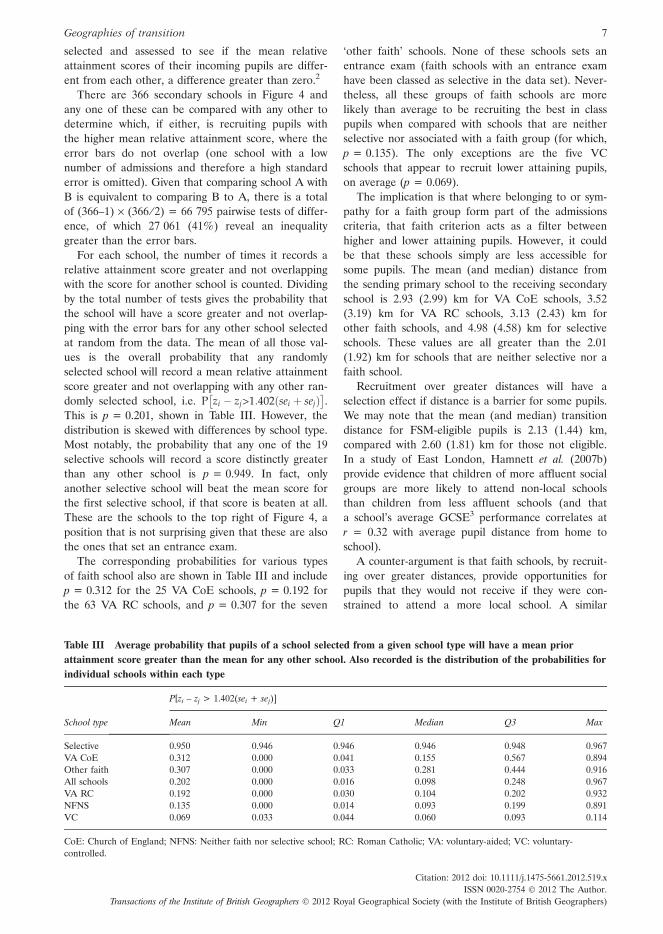
selected and assessed to see if the mean relativeattainment scores of their incoming pupils are differ-ent from each other, a difference greater than zero.2
There are 366 secondary schools in Figure 4 andany one of these can be compared with any other todetermine which, if either, is recruiting pupils withthe higher mean relative attainment score, where theerror bars do not overlap (one school with a lownumber of admissions and therefore a high standarderror is omitted). Given that comparing school A withB is equivalent to comparing B to A, there is a totalof (366–1) · (366 ⁄ 2) = 66 795 pairwise tests of differ-ence, of which 27 061 (41%) reveal an inequalitygreater than the error bars.
For each school, the number of times it records arelative attainment score greater and not overlappingwith the score for another school is counted. Dividingby the total number of tests gives the probability thatthe school will have a score greater and not overlap-ping with the error bars for any other school selectedat random from the data. The mean of all those val-ues is the overall probability that any randomlyselected school will record a mean relative attainmentscore greater and not overlapping with any other ran-domly selected school, i.e. P
�zi � zj>1:402ðsei þ sejÞ
�.
This is p = 0.201, shown in Table III. However, thedistribution is skewed with differences by school type.Most notably, the probability that any one of the 19selective schools will record a score distinctly greaterthan any other school is p = 0.949. In fact, onlyanother selective school will beat the mean score forthe first selective school, if that score is beaten at all.These are the schools to the top right of Figure 4, aposition that is not surprising given that these are alsothe ones that set an entrance exam.
The corresponding probabilities for various typesof faith school also are shown in Table III and includep = 0.312 for the 25 VA CoE schools, p = 0.192 forthe 63 VA RC schools, and p = 0.307 for the seven
‘other faith’ schools. None of these schools sets anentrance exam (faith schools with an entrance examhave been classed as selective in the data set). Never-theless, all these groups of faith schools are morelikely than average to be recruiting the best in classpupils when compared with schools that are neitherselective nor associated with a faith group (for which,p = 0.135). The only exceptions are the five VCschools that appear to recruit lower attaining pupils,on average (p = 0.069).
The implication is that where belonging to or sym-pathy for a faith group form part of the admissionscriteria, that faith criterion acts as a filter betweenhigher and lower attaining pupils. However, it couldbe that these schools simply are less accessible forsome pupils. The mean (and median) distance fromthe sending primary school to the receiving secondaryschool is 2.93 (2.99) km for VA CoE schools, 3.52(3.19) km for VA RC schools, 3.13 (2.43) km forother faith schools, and 4.98 (4.58) km for selectiveschools. These values are all greater than the 2.01(1.92) km for schools that are neither selective nor afaith school.
Recruitment over greater distances will have aselection effect if distance is a barrier for some pupils.We may note that the mean (and median) transitiondistance for FSM-eligible pupils is 2.13 (1.44) km,compared with 2.60 (1.81) km for those not eligible.In a study of East London, Hamnett et al. (2007b)provide evidence that children of more affluent socialgroups are more likely to attend non-local schoolsthan children from less affluent schools (and thata school’s average GCSE3 performance correlates atr = 0.32 with average pupil distance from home toschool).
A counter-argument is that faith schools, by recruit-ing over greater distances, provide opportunities forpupils that they would not receive if they were con-strained to attend a more local school. A similar
Table III Average probability that pupils of a school selected from a given school type will have a mean priorattainment score greater than the mean for any other school. Also recorded is the distribution of the probabilities forindividual schools within each type
School type
P[zi – zj > 1.402(sei + sej)]
Mean Min Q1 Median Q3 Max
Selective 0.950 0.946 0.946 0.946 0.948 0.967VA CoE 0.312 0.000 0.041 0.155 0.567 0.894Other faith 0.307 0.000 0.033 0.281 0.444 0.916All schools 0.202 0.000 0.016 0.098 0.248 0.967VA RC 0.192 0.000 0.030 0.104 0.202 0.932NFNS 0.135 0.000 0.014 0.093 0.199 0.891VC 0.069 0.033 0.044 0.060 0.093 0.114
CoE: Church of England; NFNS: Neither faith nor selective school; RC: Roman Catholic; VA: voluntary-aided; VC: voluntary-controlled.
Geographies of transition 7
Citation: 2012 doi: 10.1111/j.1475-5661.2012.519.xISSN 0020-2754 � 2012 The Author.
Transactions of the Institute of British Geographers � 2012 Royal Geographical Society (with the Institute of British Geographers)
argument is sometimes heard in defence of selectivegrammar schools, with the claim that they permit themost able pupils from the more deprived backgroundsto benefit educationally in a way they might not if theywere required to attend a more mixed ability, localcomprehensive school (Hastings 2009; Randall 2009).
Whatever the validity of such an argument, in prac-tice it appears not to be realised. The proportion ofpupils in the London data who were eligible for FSMin 2008 was 0.266. The mean (and median) propor-tion in selective schools was a mere 0.029 (0.026). InVA CoE schools the proportion was 0.242 (0.181), inVA RC schools, 0.201 (0.174), and in schools of theother faith group, 0.138 (0.128). Each of these schooltypes is, on average, recruiting disproportionately fewFSM-eligible pupils, with the proportion for VA CoEschools closest to the expected value. Insofar as FSMeligibility is a marker of economic disadvantage, it ishard to avoid the conclusion that selective schoolsespecially but also faith schools, on average, aresocially selective.
Of course, it might be observed that FSM pupilstend to be lower attaining at primary school andtherefore less likely to pass an entrance examinationgaining entry into a selective school. This is true butalso a poor defence of selection if the social disadvan-tages those pupils face in their learning at primaryschool are then compounded by a decreased prospectof entering a selective school. In regard to faithschools, the apparent social selection is not, as Allenand West (2011) show, because the faiths themselvesare attractive to more affluent parents but because‘children from higher income religious families aremore likely to attend faith schools than children frompoorer religious families’ (2011, 707–8). Nevertheless,it should be recognised that these are only averages.Looking again at Table III, it is important to acknowl-edge there are faith schools of all types recruitinglower attaining pupils, as there are non-selectiveschools recruiting higher attaining pupils.
Assessing differences between locallycompeting schools
It has been shown that some secondary schools inLondon admitted pupils of higher academic attain-ment, on average and relative to other pupils in theirprimary school cohort, with selective schools espe-cially but also faith schools tending to recruit thosehigher performing pupils. Attention now turns towhether separation of lower and higher attainingpupils occurs locally, between what may be regardedas locally competing schools.
Here the definition of locally competing secondaryschools follows Harris (2011a): those recruiting pupilsfrom one or more of the same primary schools. This
is a somewhat loose definition of competition basedon what is observed in any one year, the final alloca-tions of pupils to secondary schools. It is not neces-sarily a matter of choice. Introduced in 2006 forintakes into London’s secondary schools, the Pan-London coordinated admissions system permits up tosix schools to be ranked by preference but withoutany guarantee of success. In the event that demandexceeds supply at any school, admissions criteria willbe employed, usually including proximity to theschool in addition to any other selection criteria. Anaverage of 36.2 per cent of pupils per London LocalAuthority were not offered a place at their first pref-erence school in 2008.
More specifically, the level of ‘competition’between schools is quantified in the form of a weightsmatrix where the weight between any two competingschools (i and j) is a function of the proportion ofsecondary school i’s intake that is drawn from the pri-mary schools shared with school j, multiplied by theproportion of secondary school j’s intake that isdrawn from the same. In other words, the more theirintakes are concentrated on the same primary schools,the greater they are said to be competing.
Having defined the weights matrix, it is straightfor-ward to construct a local index of difference (LID)that considers whether the mean relative prior attain-ment score for any one secondary school is greater orless than for its average competitor:
LIDi ¼ zi �Xn¼1
j¼1wijzj j 6¼ i; 0 � wij � 1;
Xwij ¼ 1
ð2Þ
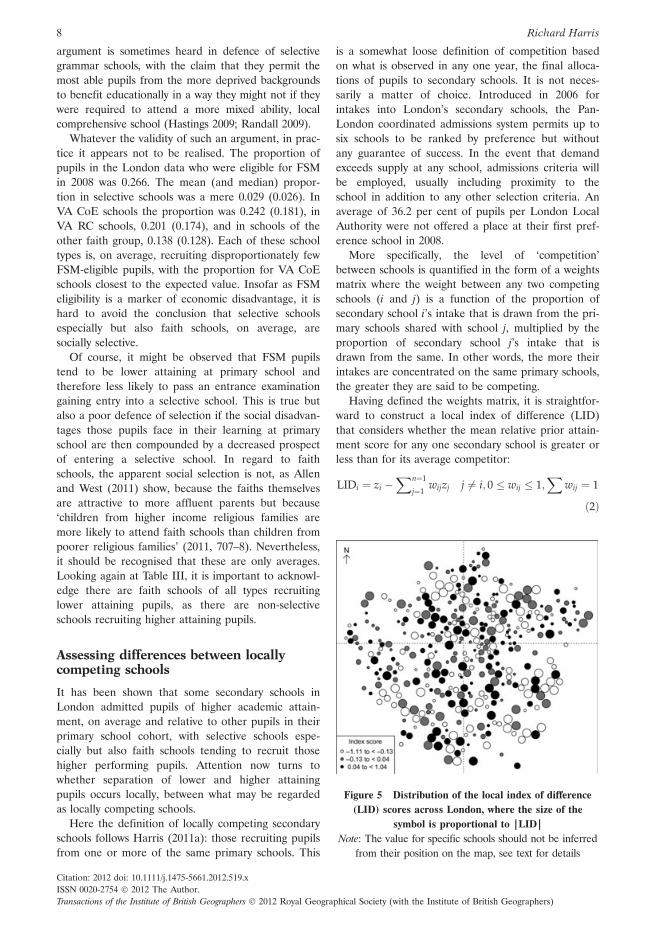
Figure 5 Distribution of the local index of difference(LID) scores across London, where the size of the
symbol is proportional to |LID|Note: The value for specific schools should not be inferred
from their position on the map, see text for details
8 Richard Harris
Citation: 2012 doi: 10.1111/j.1475-5661.2012.519.xISSN 0020-2754 � 2012 The Author.Transactions of the Institute of British Geographers � 2012 Royal Geographical Society (with the Institute of British Geographers)
A positive LID value indicates that the school isrecruiting pupils of higher average relative attainmentthan surrounding schools, whereas a negative valueindicates that the school is recruiting pupils of loweraverage attainment.
Figure 5 maps the LID scores using a cartogramthat includes some random data swapping betweenproximate schools to preserve the overall pattern ofscores but also to prevent the value for specificschools to be deduced from their position on themap. Of note are the incidences of a checkerboardeffect, where one school locally is recruiting pupils ofan above average relative attainment and another isrecruiting pupils of below average attainment.
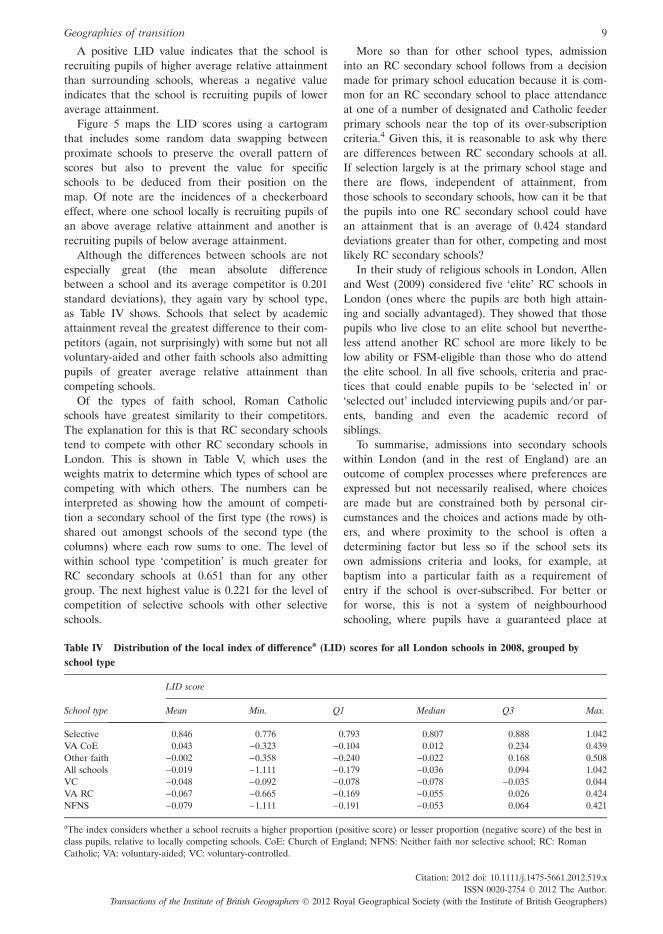
Although the differences between schools are notespecially great (the mean absolute differencebetween a school and its average competitor is 0.201standard deviations), they again vary by school type,as Table IV shows. Schools that select by academicattainment reveal the greatest difference to their com-petitors (again, not surprisingly) with some but not allvoluntary-aided and other faith schools also admittingpupils of greater average relative attainment thancompeting schools.
Of the types of faith school, Roman Catholicschools have greatest similarity to their competitors.The explanation for this is that RC secondary schoolstend to compete with other RC secondary schools inLondon. This is shown in Table V, which uses theweights matrix to determine which types of school arecompeting with which others. The numbers can beinterpreted as showing how the amount of competi-tion a secondary school of the first type (the rows) isshared out amongst schools of the second type (thecolumns) where each row sums to one. The level ofwithin school type ‘competition’ is much greater forRC secondary schools at 0.651 than for any othergroup. The next highest value is 0.221 for the level ofcompetition of selective schools with other selectiveschools.
More so than for other school types, admissioninto an RC secondary school follows from a decisionmade for primary school education because it is com-mon for an RC secondary school to place attendanceat one of a number of designated and Catholic feederprimary schools near the top of its over-subscriptioncriteria.4 Given this, it is reasonable to ask why thereare differences between RC secondary schools at all.If selection largely is at the primary school stage andthere are flows, independent of attainment, fromthose schools to secondary schools, how can it be thatthe pupils into one RC secondary school could havean attainment that is an average of 0.424 standarddeviations greater than for other, competing and mostlikely RC secondary schools?
In their study of religious schools in London, Allenand West (2009) considered five ‘elite’ RC schools inLondon (ones where the pupils are both high attain-ing and socially advantaged). They showed that thosepupils who live close to an elite school but neverthe-less attend another RC school are more likely to below ability or FSM-eligible than those who do attendthe elite school. In all five schools, criteria and prac-tices that could enable pupils to be ‘selected in’ or‘selected out’ included interviewing pupils and ⁄ or par-ents, banding and even the academic record ofsiblings.
To summarise, admissions into secondary schoolswithin London (and in the rest of England) are anoutcome of complex processes where preferences areexpressed but not necessarily realised, where choicesare made but are constrained both by personal cir-cumstances and the choices and actions made by oth-ers, and where proximity to the school is often adetermining factor but less so if the school sets itsown admissions criteria and looks, for example, atbaptism into a particular faith as a requirement ofentry if the school is over-subscribed. For better orfor worse, this is not a system of neighbourhoodschooling, where pupils have a guaranteed place at
Table IV Distribution of the local index of differencea (LID) scores for all London schools in 2008, grouped byschool type
School type
LID score
Mean Min. Q1 Median Q3 Max.
Selective 0.846 0.776 0.793 0.807 0.888 1.042VA CoE 0.043 )0.323 )0.104 0.012 0.234 0.439Other faith )0.002 )0.358 )0.240 )0.022 0.168 0.508All schools )0.019 )1.111 )0.179 )0.036 0.094 1.042VC )0.048 )0.092 )0.078 )0.078 )0.035 0.044VA RC )0.067 )0.665 )0.169 )0.055 0.026 0.424NFNS )0.079 )1.111 )0.191 )0.053 0.064 0.421
aThe index considers whether a school recruits a higher proportion (positive score) or lesser proportion (negative score) of the best inclass pupils, relative to locally competing schools. CoE: Church of England; NFNS: Neither faith nor selective school; RC: RomanCatholic; VA: voluntary-aided; VC: voluntary-controlled.
Geographies of transition 9
Citation: 2012 doi: 10.1111/j.1475-5661.2012.519.xISSN 0020-2754 � 2012 The Author.
Transactions of the Institute of British Geographers � 2012 Royal Geographical Society (with the Institute of British Geographers)
their local school, but is one where, for most schools,and especially the most popular that are neither faithbased nor academically selective, geography matters(Hamnett and Butler 2011).
The key question for both proponents and oppo-nents of school choice policies is whether those poli-cies are acting to increase or decrease the separationsof one group of pupils from another, be it that thosegroups are defined by some measure of wealth ordeprivation, ethnicity or, as here, academic attain-ment prior to leaving primary school. As we haveseen, for critics of school choice the concern is thatthe ‘choice’ is played out on an unlevel playing field.
Their concern is that it is a choice more for thosewith the social and economic capital to ensure theirchoice is met (by living closest to the most desirableschools, for example, or by a timely reawakening offaith prior to when school choices are made), and theeffects of this inequality will be to increase social seg-regation between schools (Ball 2002; Gewirtz et al.1995).
In regard to segregation by ability, this paper beganby citing Gibbons and Telhaj (2007), who found thatalmost nothing changed during the period from 1996to 2002 in regard to the way pupils of differing age-11ability are sorted into different secondary schools. It
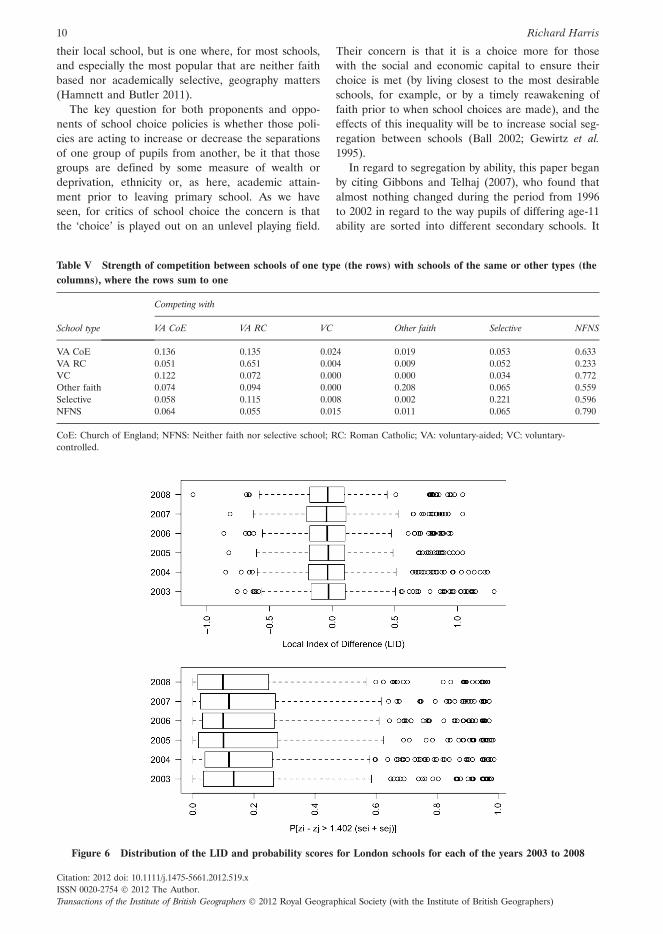
Table V Strength of competition between schools of one type (the rows) with schools of the same or other types (thecolumns), where the rows sum to one
School type
Competing with
VA CoE VA RC VC Other faith Selective NFNS
VA CoE 0.136 0.135 0.024 0.019 0.053 0.633VA RC 0.051 0.651 0.004 0.009 0.052 0.233VC 0.122 0.072 0.000 0.000 0.034 0.772Other faith 0.074 0.094 0.000 0.208 0.065 0.559Selective 0.058 0.115 0.008 0.002 0.221 0.596NFNS 0.064 0.055 0.015 0.011 0.065 0.790
CoE: Church of England; NFNS: Neither faith nor selective school; RC: Roman Catholic; VA: voluntary-aided; VC: voluntary-controlled.
Figure 6 Distribution of the LID and probability scores for London schools for each of the years 2003 to 2008
10 Richard Harris
Citation: 2012 doi: 10.1111/j.1475-5661.2012.519.xISSN 0020-2754 � 2012 The Author.Transactions of the Institute of British Geographers � 2012 Royal Geographical Society (with the Institute of British Geographers)
ends with a similar observation: there is no evidenceto suggest that the separation of relatively higher andlower attaining pupils in the transition from primaryto secondary school is increasing within London overthe period 2003 to 2008. Whether differencesbetween the secondary schools are assessed using theprobability-based approach of the section above(‘Assessing differences between schools’), or by thelocal index of difference in this section, very littlechanges, as Figure 6 illustrates. One reason for thiscould be the lack of genuine choice:
Parents in England today are supposedly offered increasingdiversity and choice [but] in fact, many face a ‘dizzyinglysteep hierarchy of institutions’ in which schools consis-tently reflect and reinforce social divisions. (Benn 2011,87, quoting Professor Tim Brighouse)
Conclusions
This paper has used methods of statistical and spatialanalysis to consider whether higher prior attainingpupils separate from lower attaining ones by theschools they choose or are allocated to in the transi-tion from primary to secondary school. There is evi-dence that they do, with selective schools especiallybut also faith schools with most control over theiradmissions criteria more likely to receive the best inclass pupils.Despite this, there is not any evidence that the
degree of separation is either increasing or worsening.As such, this paper lends support to the findings ofother authors, especially Gibbons and Telhaj (2007),and also Gorard et al. (2003), and Croxford andPaterson (2006) who also find no evidence that thealleged marketisation of education (Gewirtz et al.1995) and the promotion of choice is exacerbatingsocial (or ethnic) segregation between schools. Ofcourse, London may not be representative of otherparts of England. Nevertheless, combined, the 33local authorities of Greater London school morepupils than any other conurbation in the country.
The degree of separation found is most likelyunderestimated. Pupils who attend a fee-charging sec-ondary school are omitted from the analysis (about14% of pupils on average in London, but over 40%for the borough of Kensington and Chelsea; MacLeod2007), as are pupils who attend a primary school inLondon but then move outside the region to anadjoining county. Also omitted are pupils with verylow standardised test scores.
Despite the omissions, two questions remain:whether the separations (the differences betweenschools) matter, and why they persist. The first ofthese can be considered educationally, asking whetherthe separation harms the educational prospects of
some or more of the pupils. Hamnett et al. (2007a)provide evidence that a pupil going to a school inEast London is more likely to do better at (age 16)GCSE examination than is predicted by their ownpersonal characteristics if they attend a better-performing school than a poorer-performing one. Thiscould be due to a positive peer effect on learning.The impact of such peer effects is mixed. In a widerstudy of secondary schools across England, Gibbonsand Telhaj (2006) suggest that peer effects do existbut are tiny in effect. Proud (2010) suggests the effectmay be stronger within primary schools.
In answer to why the differences between schoolsare neither rising nor falling, two suggestions areoffered. First is the trend of a rising mean test scoreand a decreasing standard deviation year-by-year from2003 to 2008. This is evident in Table I and means itbecomes increasingly difficult for any one secondaryschool to recruit the best prior-attaining studentsbecause students become increasingly similar. Yet thisdoes not explain why the differences are being main-tained not decreased.
A more compelling reason is the one alluded towhen discussing the patterns of transition in Londonand the markets in which schools compete. They aregeographical. What is more, they will remain geo-graphical for so long as admissions criteria for popu-lar schools employ geographical criteria, for so longas ease of access is important for school choice, andfor so long as people value the community role ofschools. Of course, there are exceptions to geographi-cally based selection, generally found amongst selec-tive and faith schools. However, selective schools are,by definition, academically selective, whereas faithschools tend to recruit pupils from more affluentbackgrounds. If geography is the main determinant ofschool allocations, if selective and some faith schoolsare the main options to overcome that geography,and given that over the study period the number ofselective and faith schools is largely unaltered(Table I), it is not surprising to find little change.
To overcome this stasis, one option is to rationschool places in ways that are less geographicallybound. Whether that would be desirable is not clear.A random lottery and allocation of places across alocal region might improve the social mix, but couldalso make it extremely difficult for pupils to make thejourney from home to school, split friendship groupsthat would otherwise apply to the same secondaryschool and support each other in the transition, andwould act against the idea that schools have subjectspecialisms that, in principle at least, are offered topupils to choose from. Where it was tried (in Brightonand Hove), admittedly on top of a catchment-basedsystem, it failed to give poorer children better accessto the most popular schools (Allen et al. 2012).
Geographies of transition 11
Citation: 2012 doi: 10.1111/j.1475-5661.2012.519.xISSN 0020-2754 � 2012 The Author.
Transactions of the Institute of British Geographers � 2012 Royal Geographical Society (with the Institute of British Geographers)
Although this paper provides no evidence thatstratification by prior academic ability is increasingwithin the local markets for school places, it remainsa concern that the separations of higher and lowerattaining pupils persist at all. Whatever else, there isno evidence here that (constrained) choice is leadingto more academically mixed schools. Whether thecorollary of this finding is to expand choice (but notas a rhetorical tool to balance supply and demand) orto more vigorously defend the virtues of ‘all-in’ localcomprehensive schools (Benn 2011) is debatable.
Acknowledgements
My grateful thanks to the three anonymous refereeswho made extremely helpful and perceptive com-ments on an early draft of this paper. They saved mefrom a foolish mistake. Remaining foolishness ismine.
Notes
1 The possibility remains that pupils from more wealthyhouseholds live closer to the more regarded secondaryschools and are therefore more likely to attend themthan other pupils in their primary class.
2 The procedure will also always find ‘significant’ differ-ences between at least some schools because the averageconfidence interval is adjusting until it contains 95 percent of the area under a normal distribution. For thisreason, the pairwise tests that follow from it are treatednot as tests of statistical significance in a formal sensebut more as a benchmark for finding substantively inter-esting differences between types of school.
3 GCSEs - General Certificates of Education - are dis-cipline-based examinations taken by most pupils in state-funded schools, usually at age sixteen.
4 For an example, see http://www.sacredheart.southwark.sch.uk/uploads/File/Policies/ADMISSIONS%20POLICY.doc (accessed 30 January 2012).
References
Allen R and Vignoles A 2007 What should an index of schoolsegregation measure? Oxford Review of Education 33 643–68
Allen R and West A 2009 Religious schools in London:school admissions, religious composition and selectivityOxford Review of Education 35 471–94
Allen R and West A 2011 Why do faith secondary schoolshave advantaged intakes? The relative importance ofneighbourhood characteristics, social background and reli-gious identification amongst parents British EducationalResearch Journal 37 691–712
Allen R, Burgess S and McKenna L 2012 The short-runimpact of using lotteries for school admissions: earlyresults from Brighton and Hove’s reforms Transactions ofthe Institute of British Geographers doi: 10.1111/j.1475-5661.2012.00511.x
Ball S J 2002 Class strategies and the education market: themiddle classes and social advantage Routledge Falmer,London
Benn M 2011 School wars: the battle for Britain’s educationVerso, London
Brighouse H 2002 School choice and social justice new edi-tion Oxford University Press, Oxford
Brimicombe A 2007 Ethnicity, religion and residential segre-gation in London: evidence from a computational typologyof minority communities Environment and Planning B 34884–904
Burgess S, Wilson D and Lupton R 2005 Parallel lives? Eth-nic segregation in schools and neighbourhoods Urban Stud-ies 42 1027–56
Burgess S, Briggs A, McConnell B and Slater H 2006 Schoolchoice in England: background facts CMPO Working PaperSeries No. 06 ⁄ 159 (http://www.bristol.ac.uk/cmpo/publications/papers/2006/wp159.pdf) Accessed 30 January 2012
Burgess S, Johnston R, Key T, Propper C and Wilson D2008 The transition of pupils from primary to secondaryschool in England Transactions of the Institute of BritishGeographers 33 388–403
Butler T and Hamnett C 2010 ‘You get what you are given’:the limits to parental choice in east London Environmentand Planning A 42 2431–50
Croxford L and Paterson L 2006 Trends in social class segre-gation between schools in England, Wales and Scotlandsince 1984 Research Papers in Education 21 381–406
DCSF 2008 Strengthening transfers and transition: partnershipsfor progress Department for Children, Schools and Fami-lies, London
DCSF 2009 Your child, your schools, our future: building a21st century schools system Department for Children,Schools and Families, London
Galindo-Rueda F and Vignoles A 2005 The heterogeneouseffect of selection in secondary schools: understanding thechanging role of ability London School of Economics andPolitical Science, London (http://eprints.lse.ac.uk/19440/)Accessed 30 January 2012
Gewirtz S, Ball S J and Bowe R 1995 Markets, choice andequity in education Open University Press, Buckingham
Gibbons S and Telhaj S 2006 Peer effects and pupil attain-ment: evidence from secondary school transition Centre forthe Economics of Education Discussion Paper 63 LondonSchool of Economics and Political Science, London (http://eprints.lse.ac.uk/19421/) Accessed 30 January 2012
Gibbons S and Telhaj S 2007 Are schools drifting apart?Intake stratification in English secondary schools UrbanStudies 44 1281–305
Gibson A and Asthana S 2000 Local markets and the polariza-tion of public-sector schools in England and Wales Transac-tions of the Institute of British Geographers 25 303–19
Gibson A and Asthana S 2003 What’s in a number? Com-mentary on Gorard and Fitz’s ‘Investigating the determi-nants of segregation between schools’ Research Papers inEducation 15 133–53
Goldstein H and Healy M J R 1995 The graphical presenta-tion of a collection of means Journal of the Royal StatisticalSociety, Series A (Statisitcs in society), 158 175–7
Goldstein H and Noden P 2003 Modelling social segregationOxford Review of Education 29 225–37
12 Richard Harris
Citation: 2012 doi: 10.1111/j.1475-5661.2012.519.xISSN 0020-2754 � 2012 The Author.Transactions of the Institute of British Geographers � 2012 Royal Geographical Society (with the Institute of British Geographers)
Goldstein H and Noden P 2004 A response to Gorard onsocial segregation Research Papers in Education 30 441–2
Gorard S 2000 Here we go again: a reply to ‘What’s in anumber?’ by Gibson and Asthana Research Papers in Edu-cation 15 155–62
Gorard S 2004 Comments on ‘Modelling social segregation’by Goldstein and Noden Oxford Review of Education 33669–77
Gorard S 2007 What does an index of school segregationmeasure? A commentary on Allen and Vignoles OxfordReview of Education 33 669–77
Gorard S, Taylor C and Fitz J 2003 Schools, markets andchoice policies RoutledgeFalmer, London
Hamnett C and Butler T 2011 ‘Geography matters’: the roledistance plays in reproducing educational inequality inEast London Transactions of the Institute of British Geogra-phers 36 479–500
Hamnett C, Ramsden M and Butler T 2007a Social back-ground, ethnicity, school composition and educationalattainment in East London Urban Studies 44 1255–80
Hamnett C, Butler T and Ramsten M 2007b Education, eth-nicity and attainment in East London Urban Studies 441255–80
Harris R 2011a Measuring segregation – a geographical taleEnvironment and Planning A 43 1747–53
Harris R 2011b Segregation by choice? Social and ethnic dif-ferences between English schools in Bakker J, Denessen E,Peters D and Walraven G eds International perspectives oncountering school segregation Garant, Apeldoorn NL 67–82
Harris R and Johnston R 2003 Spatial scale and neighbour-hood regeneration in England: a case study of Avon Envi-ronment and Planning C: Government and Policy 21 651–62
Harris R and Johnston R 2008 Primary schools, markets andchoice: studying polarization and the core catchment areasof schools Applied Spatial Analysis and Policy 1 59–84
Hastings M 2009 No one admires high-achievers more thanme – but you’ll never get social mobility by passing lawsagainst the middle classes The Daily Mail online 14 January(http://www.dailymail.co.uk/debate/article-1114670/MAX-HASTINGS-No-admires-high-achievers–youll-social-mobility-passing-laws-middle-classes.html) Accessed 30 January2012
Johnston R and Jones K 2010 Measuring segregation – acautionary tale Environment and Planning A 42 1264–70
Johnston R, Burgess S, Wilson D and Harris R 2006 Schooland residential ethnic segregation: an analysis of variationsacross England’s Local Education Authorities RegionalStudies 40 973–90
Johnston R, Burgess S, Harris R and Wilson D 2007 ‘Sleep-walking towards segregation’? The changing ethnic compo-
sition of English schools, 1997–2003: an entry cohort anal-ysis Transactions of the Institute of British Geographers 3373–90
Jones H 2009 School catchment areas and house prices: aBristol study Unpublished dissertation, University of Bris-tol
Lloyd C D 2012 Analysing the spatial scale of populationconcentrations by religion in Northern Ireland using globaland local variograms International Journal of GeographicalInformation Science in press
MacLeod D 2007 Private school pupil numbers in declineguardian.co.uk 9 November (http://www.guardian.co.uk/education/2007/nov/09/schools.uk) Accessed 30 January2012
Merry M S 2011 Does segregation matter? in Bakker J,Denessen E, Peters D and Walraven G eds Internationalperspectives on countering school segregation Garant,Apeldoorn NL 249–60
Peach C 2009 Slippery segregation: discovering or manufac-turing ghettos? Journal of Ethnic and Migration Studies 351381–95
Poulsen M, Johnston R and Forrest J 2001 Intraurban eth-nic enclaves: introducing a knowledge-based classificationmethod Environment and Planning A 33 2071–82
Proud S 2010 Peer effects in English primary schools: an IVestimation on the effect of a more able peer group on age11 examination results CMPO Working Paper Series No.10 ⁄ 248 (http://www.bristol.ac.uk/cmpo/publications/papers/2010/wp248.pdf) Accessed 30 January 2012
Randall J 2009 How the class war backfired and put socialmobility into retreat The Daily Telegraph online 30 July(http://www.telegraph.co.uk/finance/comment/jeffrandall/5941721/How-the-class-war-backfired-and-put-social-mobility-into-retreat.html) Accessed 30 January 2012
Reardon S F and O’Sullivan D 2004 Measures of spatial seg-regation Sociological Methodology 34 121–62
Shuttleworth I G, Lloyd C D and Martin D J 2011 Exploringthe implications of changing census output geographies forthe measurement of residential segregation: the exampleof Northern Ireland 1991–2001 Journal of the Royal Statisti-cal Society: Series A 174 1–16
Sutherland R, Yee W C, McNess E and Harris R 2010 Sup-porting learning in the transition from primary to secondaryschools University of Bristol, Bristol (http://www.bris.ac.uk/education/news/2010/16.html) Accessed 30 January2012
Weekes-Bernard D 2007 School choice and ethnic segregationThe Runnymede Trust, London
Geographies of transition 13
Citation: 2012 doi: 10.1111/j.1475-5661.2012.519.xISSN 0020-2754 � 2012 The Author.
Transactions of the Institute of British Geographers � 2012 Royal Geographical Society (with the Institute of British Geographers)