Embed Size (px)
Citation preview

Geography 372 Fall 2003 November 4, 20031
Remote Sensing of the Land Surface:
High Spatial Resolution
Remote Sensing of the Land Surface:
High Spatial ResolutionMichael D. King & Compton J. Tucker
Outline Land remote sensing at high spatial resolution Satellite sensors enabling remote sensing of land cover at high
spatial resolution– Landsat RBV, MSS, TM, ETM+– Spot HRV– Terra ASTER
Orbital characteristics Instrument characteristics
– Spacecraft, spatial resolution, swath width, sensor characteristics, and unique characteristics
Land properties as observed by Landsat and ASTER

Geography 372 Fall 2003 November 4, 20032
Characteristics of Landsat Missions
Characteristics of Landsat Missions
Satellite Launched DecommissionedRBV Bands MSS Bands
TM Bands Orbit
Landsat 1 July 23, 1972 January 6, 19781-3(simultaneous images)
4-7 None 18 days/900 km
Landsat 2January 22, 1975February 25, 19821-3(simultaneous images)
4-7 None 18 days/900 km
Landsat 3 March 5, 1978 March 31, 1983A-D(one-band side-by-side images)
4-8* None 18 days/900 km
Landsat 4 July 16, 1982 – None 1-4 1-7 16 days/705 kmLandsat 5 March 1, 1984 – None 1-4 1-7 16 days/705 kmLandsat 6October 5, 1993Failure upon launchNone None 1-7
(plus pan)16 days/705 km
Landsat 7 April 15, 1999 May 31, 2003 None None 1-7(plus pan)
16 days/705 km

Geography 372 Fall 2003 November 4, 20033
The orbital period of a satellite around a planet is given by
where 0 = orbital period (sec)
Rp = planet radius (6380 km for Earth)
H = orbit altitude above planet’s surface (km)gs = acceleration due to gravity (0.00981 km s-2 for
Earth)
Definition of Orbital Period of a Satellite
Definition of Orbital Period of a Satellite
T0=2π(Rp+ ′ H )
Rp+ ′ H
gsRp2

Geography 372 Fall 2003 November 4, 20034
Landsat-1, -2, and -3 Observatory Configuration
Landsat-1, -2, and -3 Observatory Configuration
Solar array
Multispectral Scanner (MSS)
Return Beam Vidicon (RBV) camerasData collection antenna

Geography 372 Fall 2003 November 4, 20035
Spectral Sensitivity of the Four Landsat MSS Bands
Spectral Sensitivity of the Four Landsat MSS Bands
Bands compared with the spectral sensitivity of the three emulsion layers used in color and color infrared film

Geography 372 Fall 2003 November 4, 20036
Landsat MSS Operating Configuration
Landsat MSS Operating Configuration

Geography 372 Fall 2003 November 4, 20037
Ground Resolution Cell Size versus MSS Pixel Size
Ground Resolution Cell Size versus MSS Pixel Size
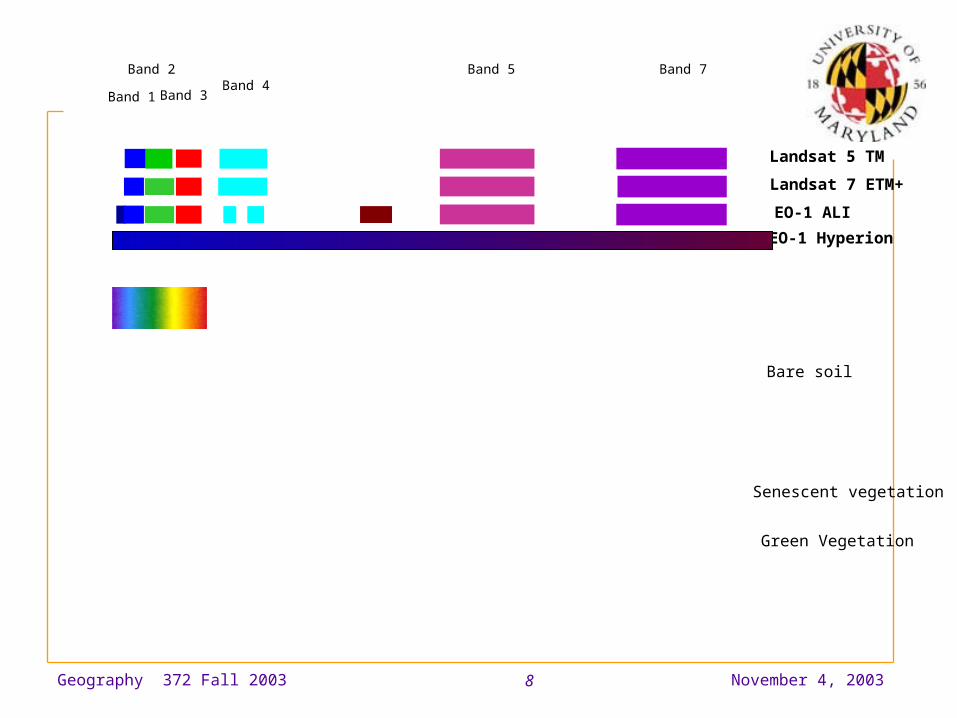
Geography 372 Fall 2003 November 4, 20038
Landsat 5 TM
EO-1 Hyperion
Landsat 7 ETM+
EO-1 ALI
Green Vegetation
Senescent vegetation
Bare soil
Band 2
Band 3Band 4
Band 5 Band 7
Band 1
Geography 372 Fall 2003 November 4, 20039
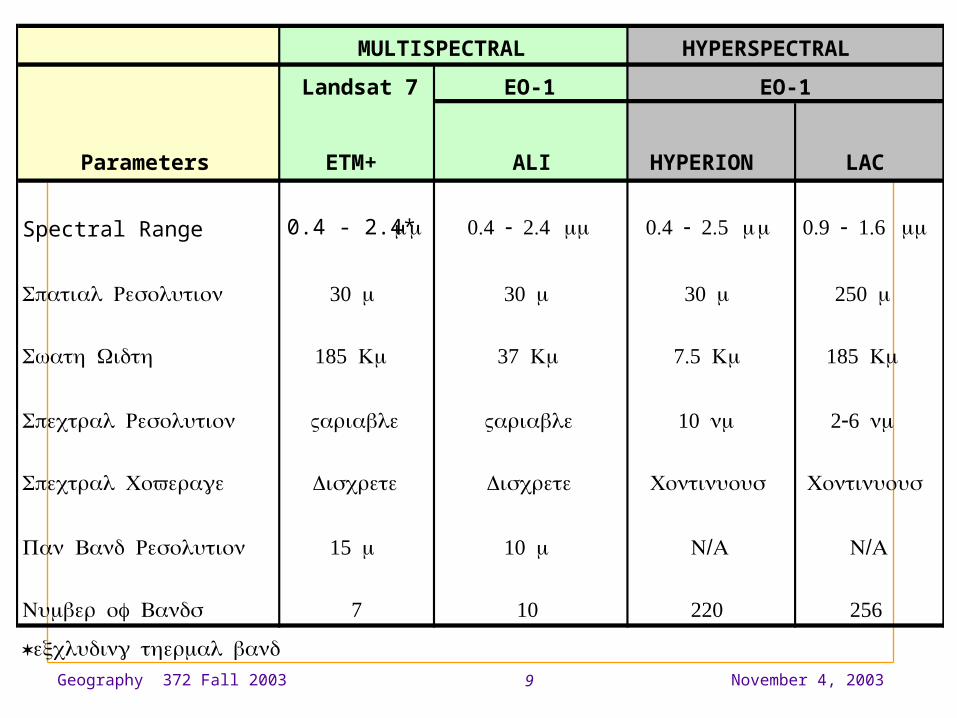
Satellite systems and sensorsSatellite systems and sensorsMULTISPECTRAL HYPERSPECTRAL
Landsat 7 EO-1 EO-1
Parameters ETM+ ALI HYPERION LAC
Spectral Range 0.4 - 2.4* μm 0.4 - 2.4 μm 0.4 - 2.5 μm 0.9 - 1.6 μm
Spatial Resolution 30 m 30 m 30 m 250 m
Swath Width 185 Km 37 Km 7.5 Km 185 Km
Spectral Resolution Variable Variable 10 nm 2-6 nm
Spectral Coverage Discrete Discrete Continuous Continuous
Pan Band Resolution 15 m 10 m /N A /N A
Number of Bands 7 10 220 256
* excluding thermal band

Geography 372 Fall 2003 November 4, 200310
Sun-Synchronous Orbit of Landsat-4 and -5
Sun-Synchronous Orbit of Landsat-4 and -5

Geography 372 Fall 2003 November 4, 200311
Successful LaunchSuccessful Launch

Geography 372 Fall 2003 November 4, 200312

Geography 372 Fall 2003 November 4, 200313
Landsat 7 Swathing PatternLandsat 7 Swathing Pattern

Geography 372 Fall 2003 November 4, 200314
Swath Progression PatternSwath Progression Pattern

Geography 372 Fall 2003 November 4, 200315
Landsat-4 and -5 Observatory Configuration
Landsat-4 and -5 Observatory Configuration
High gain antenna
Multispectral Scanner (MSS)
Solar array
Thematic Mapper (TM)S-band antenna

Geography 372 Fall 2003 November 4, 200316
Thematic Mapper Optical Path and Projection of Detector IFOVs on
the Earth’s Surface
Thematic Mapper Optical Path and Projection of Detector IFOVs on
the Earth’s Surface

Geography 372 Fall 2003 November 4, 200317
Schematic of TM Scan Line Correction Process
Schematic of TM Scan Line Correction Process
(b) Correction for satellite motion
(a) Uncompensated scan lines
(c) Compensated scan lines
Geography 372 Fall 2003 November 4, 200318

Geography 372 Fall 2003 November 4, 200319
Side-LapComposting, no interpolation

Geography 372 Fall 2003 November 4, 200320
Side-LapComposting, no interpolation

Geography 372 Fall 2003 November 4, 200321
Before After
Multi-pass compositing, no Interpolation

Geography 372 Fall 2003 November 4, 200322
Landsat’s BandsLandsat’s Bands
Landsat collects monochrome images in each band by measuring radiance & reflectance in each channel. When viewed individually, these images appear as shades of gray
Geography 372 Fall 2003 November 4, 200323
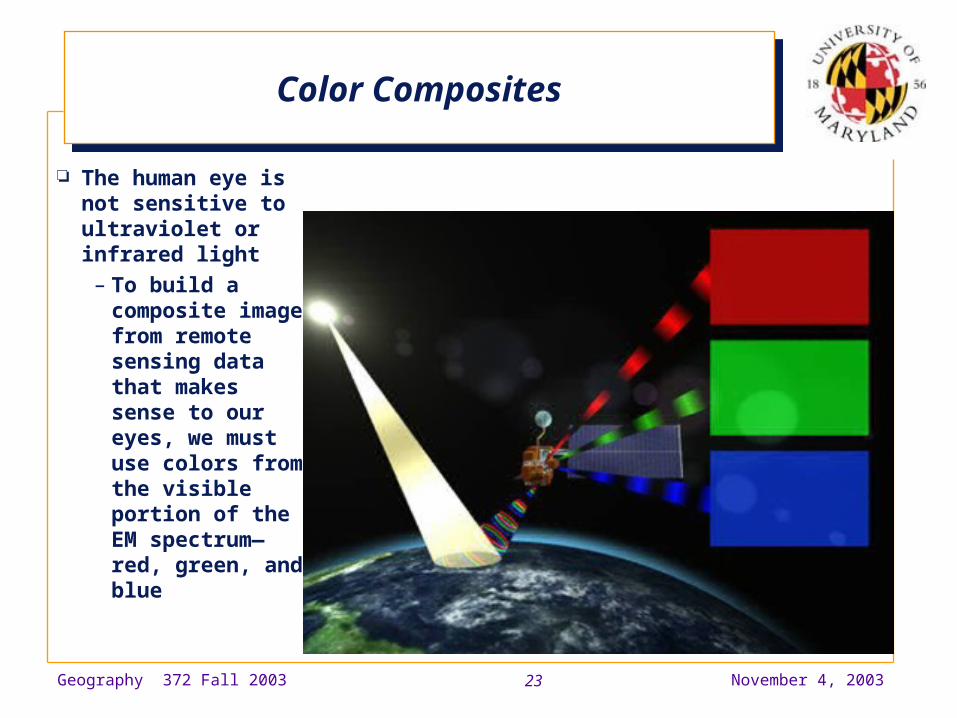
The human eye is not sensitive to ultraviolet or infrared light– To build a
composite image from remote sensing data that makes sense to our eyes, we must use colors from the visible portion of the EM spectrum—red, green, and blue
Color CompositesColor Composites

Geography 372 Fall 2003 November 4, 200324
This image was produced using the red, green, & blue bands from Landsat’s Thematic Mapper– Note the washed out
appearance of the landscape due to atmospheric effects
‘True Color’ Landsat TM Image‘True Color’ Landsat TM Image
R =0.66 µmG =0.56 µmB =0.48 µm
Geography 372 Fall 2003 November 4, 200325
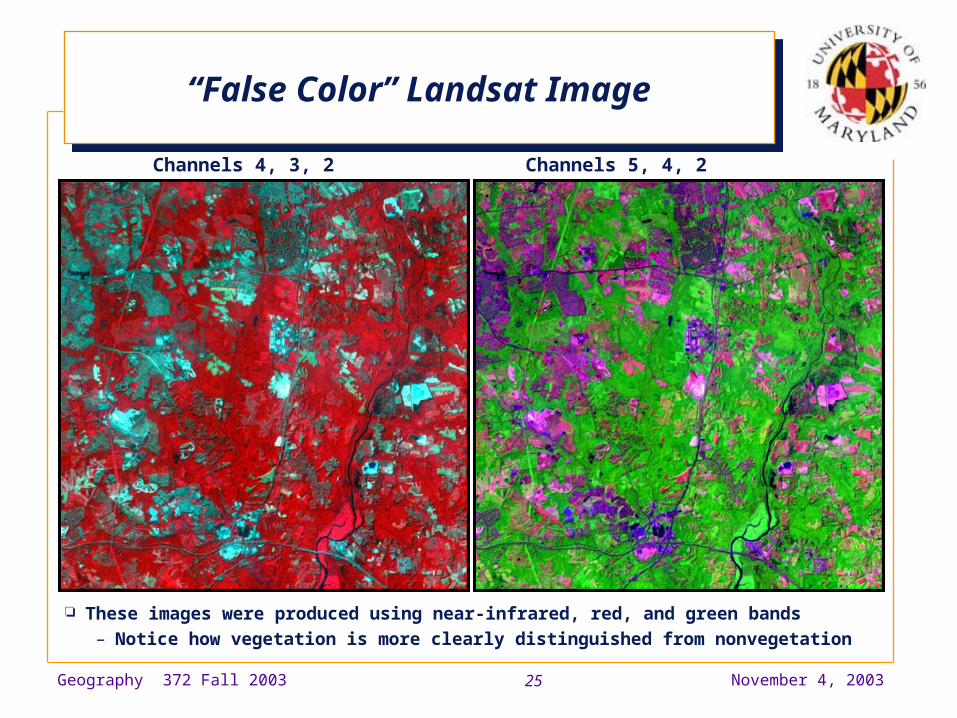
“False Color” Landsat Image“False Color” Landsat Image
These images were produced using near-infrared, red, and green bands– Notice how vegetation is more clearly distinguished from nonvegetation
Channels 4, 3, 2 Channels 5, 4, 2

Geography 372 Fall 2003 November 4, 200326
San Francisco Onion Skin Animation
San Francisco Onion Skin Animation
QuickTime™ and aCinepak decompressor
are needed to see this picture.

Geography 372 Fall 2003 November 4, 200327
Landsat 7Landsat 7
Launched April 15, 1999

Geography 372 Fall 2003 November 4, 200328
Enhanced Thematic Mapper Plus (ETM+)
Enhanced Thematic Mapper Plus (ETM+)
NASA & USGS, Landsat 7– launched April 15, 1999– 705 km polar orbit,
descending (10:00 a.m.) Sensor Characteristics
– 7 spectral bands ranging from 0.48 to 11.5 µm
– 1 panchromatic band (0.5-0.9 µm)
– cross-track scan mirror with 185 km swath width
– Spatial resolutions:» 15 m (panchromatic)» 30 m (spectral)
– Calibration:» 5% reflectance accuracy» 1% thermal IR accuracy» onboard lamps,
blackbody, and shutter» solar diffuser

Geography 372 Fall 2003 November 4, 200329
Thematic Mapper Optical Path and Projection of Detector IFOVs on
the Earth’s Surface
Thematic Mapper Optical Path and Projection of Detector IFOVs on
the Earth’s Surface

Geography 372 Fall 2003 November 4, 200330
Landsat 7 Goals & ObjectivesLandsat 7 Goals & Objectives
Land use and land cover change– Agricultural evaluations, forest management inventories,
water resource estimates, coastal zone appraisals– Growth patterns of urban development, Spring run-off
contaminants in lakes, land use in tropical rainforests, health of temperate conical forests, mapping wildfire hazards in Yosemite
Vegetation patterns– Annual cycle of vegetation dynamics, drought stress, and
flooding– Dune reactivation in the US Great Plains, precision
farming and land management Glaciers and snow cover
– Growth and retreat– Gradual changes in the Antarctic ice sheet
Geological surveys– Volcanic hazards and lava lakes

Geography 372 Fall 2003 November 4, 200331
Chesapeake & Delaware BaysChesapeake & Delaware Bays
R =0.66 µmG =0.56 µmB =0.48 µm Baltimore
Washington
May 28, 1999

Geography 372 Fall 2003 November 4, 200332
Benefits of Landsat 7 over other Missions
Benefits of Landsat 7 over other Missions
Mission Continuity– Spanning 25 years of multispectral imaging of the
Earth’s surface, starting in 1972 Global Survey Mission
– Approximately one quarter of the Earth’s landmass is imaged every 16 days» Every landmass will have seasonal coverage
Affordable Data Products– Landsat 7 data products are available from the EROS
Data Center» Prices dropped from approximately $5,000 (Landsat’s 4
& 5) to $600 (Landsat 7) per scene

Geography 372 Fall 2003 November 4, 200333
Washington, DCWashington, DC
19911991 19991999
Landsat 5Infrared band
Landsat 7panchromatic
band

Geography 372 Fall 2003 November 4, 200334
Washington, DC DetailWashington, DC Detail
19911991 19991999
Landsat 5Infrared band
Landsat 7panchromatic
band

Geography 372 Fall 2003 November 4, 200335
Phoenix Development and Growth:1973-1992
Phoenix Development and Growth:1973-1992
Multispectral Scanner (MSS)
QuickTime™ and aSorenson Video decompressorare needed to see this picture.

Geography 372 Fall 2003 November 4, 200336
San Francisco Bay from Landsat 7San Francisco Bay from Landsat 7
R =0.66 µmG =0.56 µmB =0.48 µm
Golden Gate
Bridge
Bay Bridge
Oakland Airport

Geography 372 Fall 2003 November 4, 200337
Cape CanaveralCape Canaveral
R =0.66 µmG =0.56 µmB =0.48 µm

Geography 372 Fall 2003 November 4, 200338
Flood of the Mississippi River in 1993
Flood of the Mississippi River in 1993
Before the floods After the floodsLandsat 5 TM
QuickTime™ and aCinepak decompressor
are needed to see this picture.

Geography 372 Fall 2003 November 4, 200339
Flood of the Limpopo River in Mozambique
Flood of the Limpopo River in Mozambique
The Limpopo River in Mozambique before and after the flooding from Cyclone Eline
About 700 people were killed and thousands were displaced by this event
August 22, 1999 March 2, 2000Landsat 7 ETM+
QuickTime™ and aCinepak decompressor
are needed to see this picture.
Geography 372 Fall 2003 November 4, 200340
Cape Town & the Western CapeCape Town & the Western Cape
QuickTime™ and aSorenson Video decompressorare needed to see this picture.

Geography 372 Fall 2003 November 4, 200341
Landsat 7 Data Archived during First 400 Days of Operation
Landsat 7 Data Archived during First 400 Days of Operation

Geography 372 Fall 2003 November 4, 200342
Bolivia from Landsat: 1984-1998Bolivia from Landsat: 1984-1998
Thematic MapperR =2.21 µmG =0.83 µmB =0.56 µm
Colorado College
Garden of the Gods Country
Club
QuickTime™ and aCinepak decompressor
are needed to see this picture.