Embed Size (px)
Citation preview

MAY19C111U10101
C11
1U1
01
01
ADDITIONAL MATERIALS
In addition to this paper you may use a calculator and a ruler if required.
INSTRUCTIONS TO CANDIDATES
Answer both questions in Section A.Answer one question from Section B.Use black ink or black ball-point pen. Do not use pencil or gel pen. Do not use correction fluid.Write your name, centre number and candidate number in the spaces at the top of this page.Write your answers in the spaces provided in this booklet.If additional space is required you should use the lined pages at the end of this booklet. The question number(s) should be clearly shown.
INFORMATION FOR CANDIDATES
The number of marks is given in brackets [ ] at the end of each question.
Your ability to spell, punctuate and use grammar and specialist terms accurately will be assessed in your answer to question 2 (d).
LDE*(S19-C111U10-1)© WJEC CBAC Ltd.
GCSE
C111U10-1
GEOGRAPHY A – Component 1Changing Physical and Human Landscapes
TUESDAY, 21 MAY 2019– AFTERNOON1 hour 30 minutes
S19-C111U10-1
Surname
Other Names
CandidateNumber
0
CentreNumber
For Examiner’s use only
Question MaximumMark
MarkAwarded
1 34
2 34
SPaG 4
either 3 16
or 4 16
Total 88

2
02
Examineronly
(C111U10-1)
SECTION A: CORE THEMES
Answer all of the questions in this section.
CORE THEME 1: Landscapes and Physical Processes
1. (a) Study the OS Map 1.1 below. It shows part of the Mendip Hills which is an Area of Outstanding Natural Beauty (AONB). A full key appears on page 32.
OS Map 1.1 Part of the Mendip Hills AONB
© WJEC CBAC Ltd.
(i) Give the four figure grid reference for the square outlined in red. Circle the correct answer below. [1]
5248 4853 5348
(ii) Circle the correct answer in the following sentence.
The contours in the red box on this map are close together which means that the slopes are steep / gentle / flat. [1]
(iii) Many people visit this part of the UK each year. Give two features of this landscape that attract visitors. [2]
0 1km
N50 51 52 53 5554
5047
48
50
47
48
50
49 49
51 52 53 54 55
A

Turn over.03
3Examiner
only
© WJEC CBAC Ltd. (C111U10-1)
C11
1U1
01
03
(iv) Describe one positive impact and one negative impact of having many visitors in a physical landscape you have studied. [4]
Positive . . . . . . . . . . . . . . . . . . . . . . . . . . . . . . . . . . . . . . . . . . . . . . . . . . . . . . . . . . . . . . . . . . . . . . . . . . . . . . . . . . . . . . . . . . . . . . . . . . . . . . . . . . . . . . . . . . . . . . . . . . . . . . . . . . . . . . . . . . . . . . . . . . . . . . . . . . . . . . . . . . . . . . . . . . . .
Negative . . . . . . . . . . . . . . . . . . . . . . . . . . . . . . . . . . . . . . . . . . . . . . . . . . . . . . . . . . . . . . . . . . . . . . . . . . . . . . . . . . . . . . . . . . . . . . . . . . . . . . . . . . . . . . . . . . . . . . . . . . . . . . . . . . . . . . . . . . . . . . . . . . . . . . . . . . . . . . . . . . . . . . . . . .

4
04
Examineronly
© WJEC CBAC Ltd. (C111U10-1)
(b) Study Photograph 1.2 below. It shows Flamborough Head on the east coast of Yorkshire.
Photograph 1.2 Flamborough Head
Landform Tick (√)
Wave-cut platform
Arch
Wave-cut notch
(i) Identify landform A.
Tick (√) the correct box below. [1]
A

Turn over.05
5Examiner
only
© WJEC CBAC Ltd. (C111U10-1)
(ii) Complete the paragraph by selecting the correct term from the box below. [3]
C11
1U1
01
05
joints gorges bedding planes
attrition spits hydraulic action
longshore drift stacks
The headland at Flamborough is composed of resistant rock.
However, there are horizontal lines of weakness in the cliffs which are
known as . . . . . . . . . . . . . . . . . . . . . . . . . . . . . . . . . . . . . . . . . . . . . . . . . . . . . . . . . . . . . . . . . . . These lines of weakness can be eroded
easily by . . . . . . . . . . . . . . . . . . . . . . . . . . . . . . . . . . . . . . . . . . . . . . . . . . . . . . . . . . . . . . . . . . . Further erosion can lead to the
formation of caves, arches and . . . . . . . . . . . . . . . . . . . . . . . . . . . . . . . . . . . . . . . . . . . . . . . . . . . . . . . . . . . . . . . . . . .
(iii) Explain why rock falls occur on the cliffs of some UK coastlines. [6]

6
06
Examineronly
© WJEC CBAC Ltd. (C111U10-1)
(c) The coastline to the south of Flamborough Head is composed of rocks which are much less resistant to erosion. Study Table 1.3 below.
Table 1.3 Erosion rates at 11 places along the east coast of Yorkshire
Erosion rates in metres per yearbetween 1989-2015
0.120.030.951.081.490.870.981.201.170.681.60
(i) Calculate the median value for these erosion rates. Show your working in the space below. [2]
(ii) Explain why the median value may not be regarded as the most appropriate measure of central tendency for these erosion rates? [2]
The median value is: . . . . . . . . . . . . . . . . . . . . . . . . . . . . . . . . . . . . . . . . . . . . . . . . . . . . . . . .

Turn over.07
7Examiner
only
© WJEC CBAC Ltd. (C111U10-1)
(iii) Coastal management strategies are used to reduce the effects of erosion. For one coastal management strategy, explain why there can be unintended consequences of human intervention. [4]
C11
1U1
01
07

8
08 © WJEC CBAC Ltd. (C111U10-1)
(d) Study the information in Resource Box 1.4 below and Photograph 1.5 on page 9.
Resource 1.4 - Information about the Nottingham flood defence scheme
NottinghamCity Centre
N Colwick
Long Eaton
Beeston
River T
rent
AttenboroughNature CentreAttenboroughNature Centre
Sawley
WestBridgford
0 1km
Keymajor roadsminor roadsurban areas
One of the biggest inland flood protection schemes in the UK opened along the river Trent in September 2012.
• Nottingham has had a long history of flooding. • Flooding in the year 2000 damaged hundreds of homes and businesses. • The Environment Agency scheme cost £45m. It was originally estimated to cost £51m.
• The flood defences are along a 27 kilometre stretch of the river Trent from Sawley (near Long Eaton) to Colwick.
• The work included the raising and rebuilding of flood embankments, constructing new flood walls and replacing or raising flood gates.
• Work was carried out at Sawley, Attenborough, Beeston, Nottingham and Colwick.
Map of the River Trent

Turn over.09
9Examiner
only
© WJEC CBAC Ltd. (C111U10-1)
Is ‘hard’ engineering the best option to reduce the risk of flooding in the city of Nottingham and the surrounding areas? Justify your reasons. [8]
C11
1U1
01
09
Photograph 1.5 - the River Trent at Attenborough Nature Centre

10
(C111U10-1)10
Examineronly
End of Question 1
© WJEC CBAC Ltd.

(C111U10-1) Turn over.
C11
1U1
01
11
11
11Examiner
only
© WJEC CBAC Ltd.
CORE THEME 2: Rural-Urban Links
2. (a) Study Map 2.1 below.
Map 2.1 – Urban areas in Dorset
N
Lyme Regis
Sherborne
DorchesterBridport
WILTSHIRESOMERSET
HANTS.
DORSET
She
y
WeymouthSwanage
Urban area
Poole
Bournemouth
Christchurch
(i) Name one urban area in the south east of Dorset. [1]
(ii) Bournemouth is the largest urban area in Dorset and has a large sphere of influence. Tick (√) one box below to give the correct definition of sphere of influence. [1]
Definition Tick (√)
The daily movement of people into towns and cities to work.
The rank order of places from villages to towns and cities.
The area which is served by a town or city.
(iii) Give one reason why towns and cities have a large sphere of influence. [2]

12
12
Examineronly
© WJEC CBAC Ltd. (C111U10-1)
(b) Study Graph 2.2 and Table 2.3 below.
Graphs 2.2 Population Pyramids for Dorset in 2008 and 2033 (predicted)
Population 151 500
Population aged 65+ 33 470
(i) Use Table 2.3 to calculate the percentage of people aged 65+ who lived in Poole in 2015. Show your working. [2]
MalesFemales
Percentage of Total Population Percentage of Total Population04 2 2 46 68 810 10
AGE90+
85-8980-8475-7970-7465-6960-6455-5950-5445-4940-4435-3930-3425-2920-2415-1910-14
5-90-4
04 2 2 46 68 810 10
AGE90+
85-8980-8475-7970-7465-6960-6455-5950-5445-4940-4435-3930-3425-2920-2415-1910-14
5-90-4
Percentage aged 65+: . . . . . . . . . . . . . . . . . . . . . . . . . . . . . . . . . . . . . . . . . . . . . . . . . . . . . . . .
2008 2033 (predicted)
Table 2.3 – Population data for Poole, Dorset (2015)

Turn over.13
13Examiner
only
© WJEC CBAC Ltd. (C111U10-1)
C11
1U1
01
13
(ii) Give two ways in which the structure of the over 65 population is predicted to change in Dorset by 2033. [2]
(iii) Describe two ways in which an ageing population will create challenges for the UK. [4]

14
14
Examineronly
© WJEC CBAC Ltd. (C111U10-1)
(iv) The county of Dorset is largely rural with a sparse population. Explain why the population of many remote rural areas is declining. [6]

Turn over.15
15Examiner
only
© WJEC CBAC Ltd.
Statement Tick (√)
The Amazon Centres are evenly distributed throughout the UK
There are Amazon Centres in every country of the UK
There is a cluster of Amazon Centres in central England
Scotland has the fewest Amazon Centres
The one Amazon Centre in Wales is in the south of the country
There are fewer centres in the northern part of the UK than the southern part
(C111U10-1)
(c) Amazon is a large internet retailer. Study Map 2.4 below.
Map 2.4 – Amazon Centres in the UK
C11
1U1
01
15
N
WALES
ENGLAND
COOOOOSCOTLAND
ERNNORTHERDDLALAIRELAND
= Amazon Centre=
(i) Tick (√) three correct statements in the table which describe the distribution and location of Amazon Centres in the UK. [3]

16
16 © WJEC CBAC Ltd. (C111U10-1)
(ii) Give one reason why use of the Internet has a negative impact on the high street of towns and cities. [2]
(iii) State three ways in which towns and cities have improved the quality of the high street environment for shoppers. [3]
Way 1: . . . . . . . . . . . . . . . . . . . . . . . . . . . . . . . . . . . . . . . . . . . . . . . . . . . . . . . . . . . . . . . . . . . . . . . . . . . . . . . . . . . . . . . . . . . . . . . . . . . . . . . . . . . . . . . . . . . . . . . . . . . . . . . . . . . . . . . . . . . . . . . . . . . . . . . . . . . . . . . . . . . . . . . . . . . . . . . .
Way 2: . . . . . . . . . . . . . . . . . . . . . . . . . . . . . . . . . . . . . . . . . . . . . . . . . . . . . . . . . . . . . . . . . . . . . . . . . . . . . . . . . . . . . . . . . . . . . . . . . . . . . . . . . . . . . . . . . . . . . . . . . . . . . . . . . . . . . . . . . . . . . . . . . . . . . . . . . . . . . . . . . . . . . . . . . . . . . . . .
Way 3: . . . . . . . . . . . . . . . . . . . . . . . . . . . . . . . . . . . . . . . . . . . . . . . . . . . . . . . . . . . . . . . . . . . . . . . . . . . . . . . . . . . . . . . . . . . . . . . . . . . . . . . . . . . . . . . . . . . . . . . . . . . . . . . . . . . . . . . . . . . . . . . . . . . . . . . . . . . . . . . . . . . . . . . . . . . . . . . .
Examineronly
Turn over.17
17Examiner
only
© WJEC CBAC Ltd. (C111U10-1)
(d) Study the information in Resource Box 2.5 on page 17 and page 18.
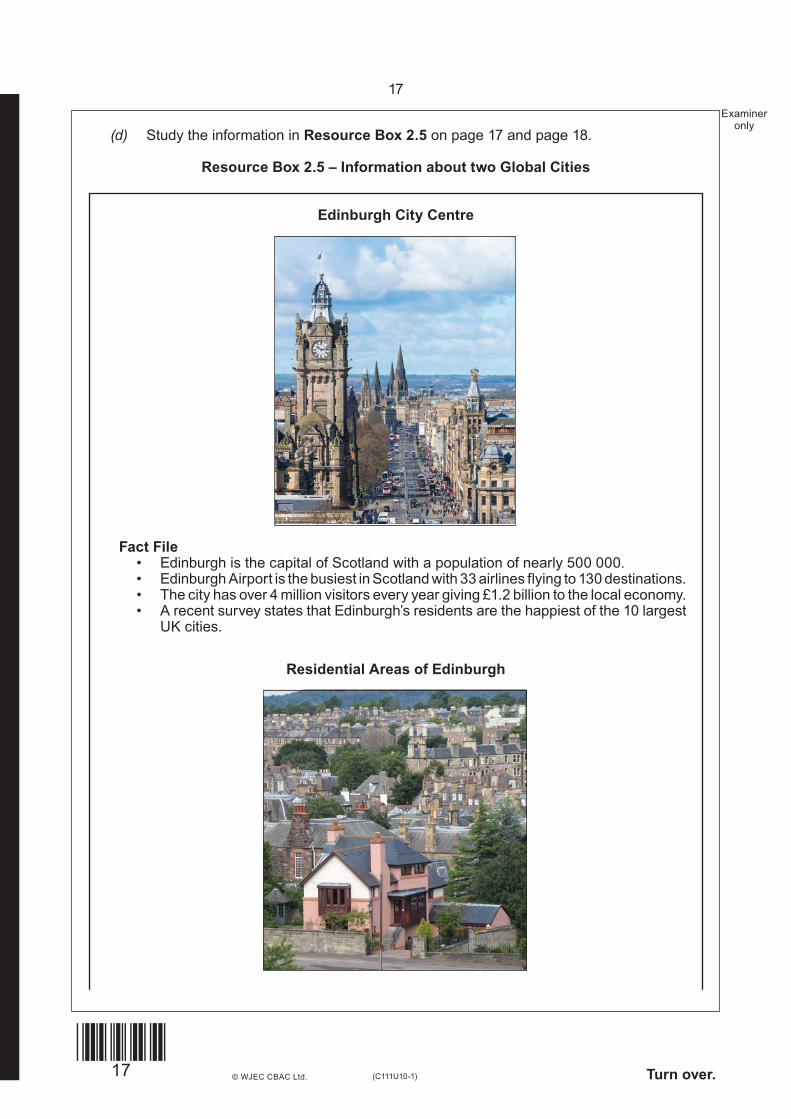
Resource Box 2.5 – Information about two Global Cities
Edinburgh City Centre
Residential Areas of Edinburgh
Fact File • Edinburgh is the capital of Scotland with a population of nearly 500 000. • Edinburgh Airport is the busiest in Scotland with 33 airlines flying to 130 destinations. • The city has over 4 million visitors every year giving £1.2 billion to the local economy. • A recent survey states that Edinburgh’s residents are the happiest of the 10 largest
UK cities.

18
18
Examineronly
© WJEC CBAC Ltd. (C111U10-1)
Chennai City Centre
Residential Areas of Chennai
In 2016 both Edinburgh and Chennai were recognised as global cities linking some
important regions to the world economy.
Fact File • Chennai is the 4th largest city of India and has a population of 6.4 million. • It is well connected to all the other main cities in India and its international airport
is the 4th busiest in the country. • Chennai has a booming economy and is well known for its car industry and software
services. • It is considered to be the cultural centre of southern India.
Resource Box 2.5 continued

Turn over.19
19Examiner
only
© WJEC CBAC Ltd. (C111U10-1)
‘Global cities in HICs have fewer and different challenges compared to global cities in NICs or LICs.’ How far do you agree with this statement? [8]
Your ability to spell, punctuate and use grammar and specialist terminology accurately will be assessed in your answer to this question. [4]
End of Question 2

20
20 © WJEC CBAC Ltd. (C111U10-1)
SECTION B: OPTIONS
Answer one question in this section.Choose either Question 3 (Theme 3) OR Question 4 (Theme 4).
THEME 3: Tectonic Landscapes and Hazards
3. (a) Study Graph 3.1 below.
Graph 3.1 – Seismometer readings during an earthquake event
20:15– 5
5
0
amou
nt o
f sha
king
time in hours20:20 20:25 20:30 20:35
Describe the changes shown on the graph. [2]
(b) (i) Give two human factors that increase the vulnerability of communities to tectonic hazards. [2]
Examineronly
(ii) Explain why pyroclastic flows are a significant volcanic hazard. [4]
Turn over.21
21Examiner
only
© WJEC CBAC Ltd. (C111U10-1)
22
22 © WJEC CBAC Ltd. (C111U10-1)
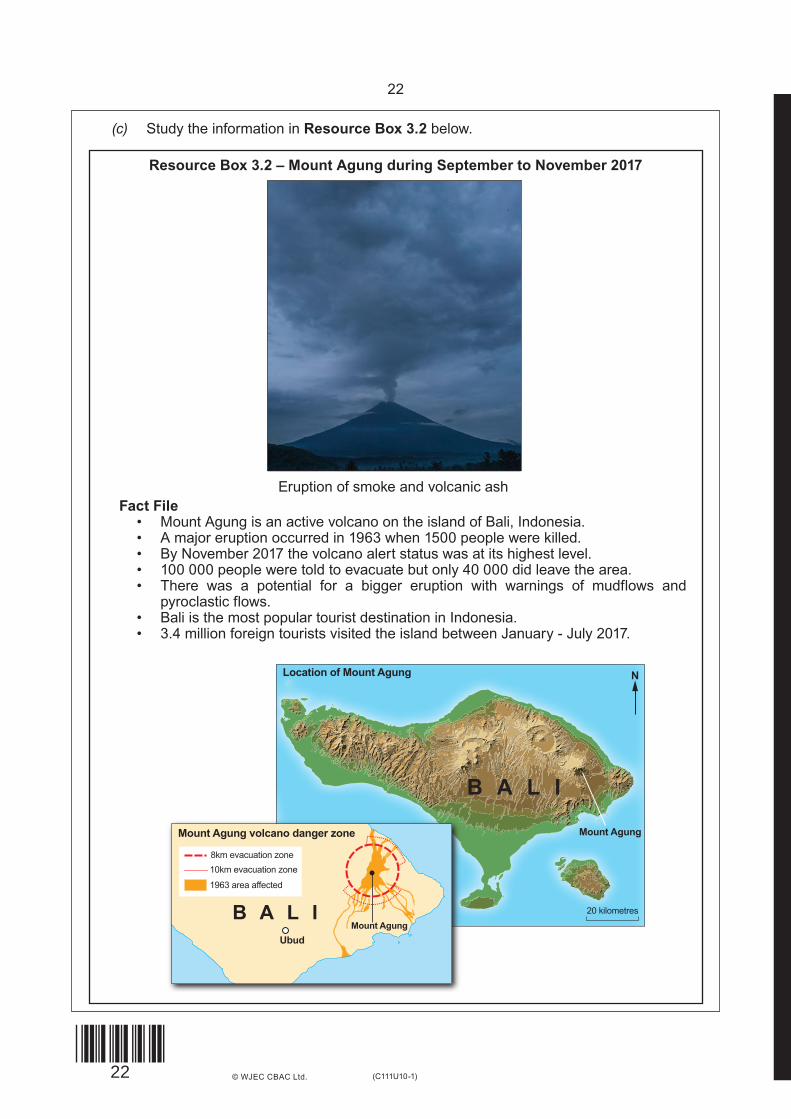
Mount Agung
Location of Mount Agung N
20 kilometres
B A L I
Mount AgungUbud
8km evacuation zone10km evacuation zone
1963 area affected
B A L I
Mount Agung volcano danger zone
Fact File • Mount Agung is an active volcano on the island of Bali, Indonesia. • A major eruption occurred in 1963 when 1500 people were killed. • By November 2017 the volcano alert status was at its highest level. • 100 000 people were told to evacuate but only 40 000 did leave the area. • There was a potential for a bigger eruption with warnings of mudflows and
pyroclastic flows. • Bali is the most popular tourist destination in Indonesia. • 3.4 million foreign tourists visited the island between January - July 2017.
Resource Box 3.2 – Mount Agung during September to November 2017
Eruption of smoke and volcanic ash
(c) Study the information in Resource Box 3.2 below.

(C111U10-1)23 Turn over.
23
© WJEC CBAC Ltd.
Should permanent exclusion zones be set up around all active volcanoes to reduce the risks associated with eruptions? Justify your decision. [8]
End of Question 3
Examineronly

24
24
Examineronly
© WJEC CBAC Ltd. (C111U10-1)
THEME 4: Coastal Hazards and their Management
If you have answered question 3, do not answer question 4.
4. (a) Study Graph 4.1 below.
Graph 4.1 – Sea levels between 1990 – 2017
0
20
40
60
80
1990 1995 2000 2005 2010 2015 2017date
sea
leve
l cha
nge
(mm
)
Describe the changes shown on the graph. [2]
(b) (i) Give two human factors that increase the vulnerability of communities to coastal hazards. [2]

Turn over.25
25Examiner
only
© WJEC CBAC Ltd. (C111U10-1)
(ii) Explain why powerful storms can cause coastal flooding. [4]

26
26 © WJEC CBAC Ltd. (C111U10-1)
(c) Study the information in Resource Box 4.2 below.
Resource Box 4.2 – Fairbourne on the west coast of Wales
Fairbourne Village
0 1km
6160 62 63 64
6160 62 63 64
12
13
14
15
12
13
14
High risk of flooding
15
51 52 53
N
Fact File • It is the responsibility of local councils in England and Wales to prepare a Shoreline
Management Plan (SMP). • They have to decide whether or not to build new coastal defences (or repair old
ones). • Fairbourne has a population of 721 (Census 2011). • The SMP for Fairbourne recommends that the village will enter into managed
retreat in 2025. The council will then stop maintaining the sea defences. • Angry villagers have not accepted the predictions that sea level rise will affect their
village. • Fairbourne’s 2 mile long Blue Flag beach attracts visitors throughout the year.
The land is very flat, only just above sea level and at high risk of flooding

Turn over.27
27Examiner
only
© WJEC CBAC Ltd. (C111U10-1)
Should all communities be protected from coastal flooding in the face of rising sea levels? Justify your decision. [8]
End of Question 4
END OF PAPER

28
28 © WJEC CBAC Ltd. (C111U10-1)
BLANK PAGE
PLEASE DO NOT WRITEON THIS PAGE

(C111U10-1) Turn over.
29
29 © WJEC CBAC Ltd.
Questionnumber
Additional page, if required.Write the question number(s) in the left-hand margin.
Examineronly

Questionnumber
Additional page, if required.Write the question number(s) in the left-hand margin.
Examineronly
30 (C111U10-1)
30
© WJEC CBAC Ltd.

BLANK PAGE
PLEASE DO NOT WRITEON THIS PAGE
(C111U10-1)31 Turn over.
31
© WJEC CBAC Ltd.

32 (C111U10-1)
32
© WJEC CBAC Ltd.
ROADS AND PATHS
RAILWAYS
PUBLIC RIGHTS OF WAY
OTHER PUBLIC ACCESS
BOUNDARIES
WATER FEATURES
Not necessarily rights of way LAND FEATURES
Landranger series (1:50 000 scale)LANDRANGER MAP SYMBOLS
B 4518
B 885 A 855
Danger Area
1
M1
A 470
A 493
Ferry V
Elevated
Junction number
Servicearea
Unfenced Dual carriageway
Footbridge
BridgeRoad generally more than 4m wide
Road generally less than 4m wide
Motorway (dual carriageway)
Primary Route
Main road
Road under construction
Secondary road
Narrow road with passing places
Other road, drive or track
Path
Gradient: steeper than 20% (1 in 5)/14% to 20% (1 in 7 to 1 in 5)Gates / Road tunnel
Ferry (passenger) / Ferry (vehicle)
FootpathBridlewayRestricted byway (not for use bymechanically propelled vehicles)
The representation on this map of any other road,track or path is no evedence of the existence of aright of way.
National Trail, Scotland’s Great Trails,European Long Distance Path andselected Recreational Routes
Cycle Network number;National / Regional
Contours are at 10metres vertical interval
Heights are to thenearest metre abovemean sea level
Other route with public access(not normally shown in urban areas)
The exact nature of the rights onthese routes and the existence ofany restrictions may be checkedwith the local highway authority.Alignments are based on the bestinformation available. These routesare not shown on maps of ScotlandFiring and Test Ranges in the area.
Danger! Observe warning notices.
County, Unitary Authority, Metropolitan Districtor London Borough
Public rights of way shown on this map have beentaken from local authority definitive maps and lateramendments.The symbols show the defined route so far as thescale of the mapping will allow.
Rights of way are liable to change and may not beclearly defined on the ground. Please check withthe relevant local authority for the latestinformation. Rights of way are not shown on mapsin Scotland.
Byway open to all traffic
On-road cycle route
Traffic-free cycle route
LC
a
ruin
Level crossing
Light rail system station
Siding
Station, (a) principalTrack multiple or single
Track under constructionLight rail system,narrow gauge or tramwayBridges, footbridge
Tunnel, cutting Viaduct, embankment
District
National
National Park
Bridge
Canal
Towpath
Aqueduct
Lake
Weir Normal tidal limit
Canal (dry)
SlopesMarsh or salting
Lock
SandDunes
Footbridge
Cliff
Flat rockFord
MudShingle
BeaconLighthouse (in use)
Lighthouse (disused)
High water markLow water mark
Current or former place of worship;with towerwith spire, minaret or dome
Heliport
Triangulation pillar
Place of worship
Wind pump
Wind turbine
Electricity transmission line(pylons shown at standard spacing)
Pipe line(arrow indicates direction of flow)
Buildings
Important building (selected)
Bus or coach station
Glass structure
Graticule intersection at 5' intervals
Windmill with or without sails
Mast
Landfill site or slag/spoil heap
Cutting, embankment
Coniferous wood
Non-coniferous wood
Mixed wood
Orchard
Park or ornamental ground
Access land (symbols indicateowner or agency - see below)
National Trust; always open,limited access - observe local signs
National Trust for Scotland;always open, limited access -observe local signs
Forestry Commission
Natural Resources Wales
50
14 4
BrCemy
CGCHCollFmHo
HosplMP
MSMus
PPCPHStaSchTHUniv
550
580
600
650
Scree
Clif f
Clif f
Outcrop
Where two heights are shown, the first isthe height of the natural ground in thelocation of the triangulation pillar, and thesecond (in brackets) to a separate pointwhich is the natural summit.
Recreation / leisure / sports centre
RomanNon-Roman
Site of battle(with date)
1066
Visible earthworkSite of antiquity
Selected places of tourist interest
Golf course or links
Youth hostel
Walks / trails
Camp site / Caravan site
Camping and caravan site
Picnic site
Viewpoint 180°
Viewpoint 360°
Information centre, all year / seasonal
Nature reserve
Visitor centre
Garden / arboretum
Park & Ride, all year / seasonal
Parking
World Heritage site or area
BridgeCemetryCattle gridClubhouseCollegeFarmHouseHospitalMilepost
MilestoneMuseumPost officePublic convenience (in rural areas)Public houseStationSchoolTown Hall, Guildhall or equivalentUniversity
Phone, public / emergency / roadside assistance
Not shown on maps of Scotland
ABBREVIATIONS
HEIGHTS HEIGHTS
ARCHAEOLOGICAL AND HISTORICAL INFORMATION
TOURIST INFORMATION
See website for full list
Ferry P


![1 Tourism Geography[1]](https://img.pdfslide.net/doc/110x75/541c87107bef0abf718b5c0c/1-tourism-geography1.jpg)