Embed Size (px)
Citation preview

Hanandita and Tampubolon Int J Health Geogr (2016) 15:13 DOI 10.1186/s12942-016-0043-y
RESEARCH
Geography and social distribution of malaria in Indonesian Papua: a cross-sectional studyWulung Hanandita* and Gindo Tampubolon
Abstract
Background: Despite being one of the world’s most affected regions, only little is known about the social and spatial distributions of malaria in Indonesian Papua. Existing studies tend to be descriptive in nature; their inferences are prone to confounding and selection biases. At the same time, there remains limited malaria-cartographic activity in the region. Analysing a subset (N = 22,643) of the National Basic Health Research 2007 dataset (N = 987,205), this paper aims to quantify the district-specific risk of malaria in Papua and to understand how socio-demographic/eco-nomic factors measured at individual and district levels are associated with individual’s probability of contracting the disease.
Methods: We adopt a Bayesian hierarchical logistic regression model that accommodates not only the nesting of individuals within the island’s 27 administrative units but also the spatial autocorrelation among these locations. Both individual and contextual characteristics are included as predictors in the model; a normal conditional autoregressive prior and an exchangeable one are assigned to the random effects. Robustness is then assessed through sensitivity analyses using alternative hyperpriors.
Results: We find that rural Papuans as well as those who live in poor, densely forested, lowland districts are at a higher risk of infection than their counterparts. We also find age and gender differentials in malaria prevalence, if only to a small degree. Nine districts are estimated to have higher-than-expected malaria risks; the extent of spatial varia-tion on the island remains notable even after accounting for socio-demographic/economic risk factors.
Conclusions: Although we show that malaria is geography-dependent in Indonesian Papua, it is also a disease of poverty. This means that malaria eradication requires not only biological (proximal) interventions but also social (dis-tal) ones.
Keywords: Malaria, Map, Papua, Indonesia, Bayesian, Spatial, Multilevel
© 2016 Hanandita and Tampubolon. This article is distributed under the terms of the Creative Commons Attribution 4.0 Interna-tional License (http://creativecommons.org/licenses/by/4.0/), which permits unrestricted use, distribution, and reproduction in any medium, provided you give appropriate credit to the original author(s) and the source, provide a link to the Creative Com-mons license, and indicate if changes were made. The Creative Commons Public Domain Dedication waiver (http://creativecom-mons.org/publicdomain/zero/1.0/) applies to the data made available in this article, unless otherwise stated.
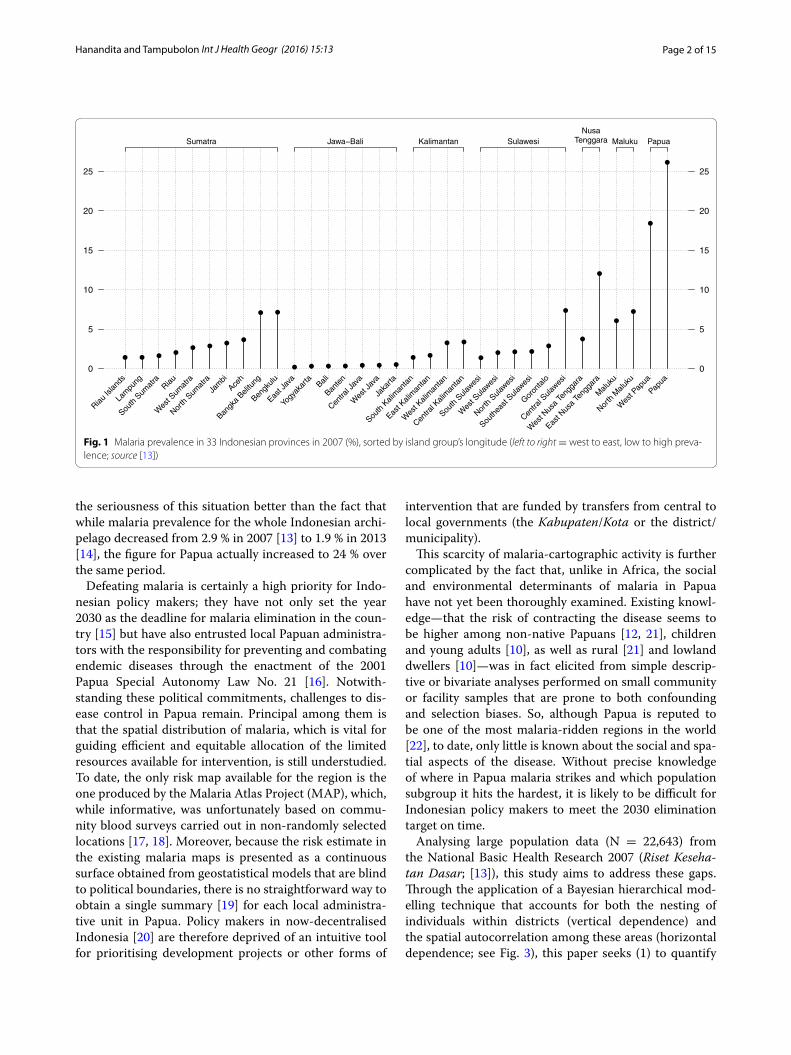
BackgroundMalaria, a mosquito-borne infectious disease that inflicts devastating health [1, 2] and economic [3–5] costs on society, remains a major problem in Indonesian Papua [6] (Fig. 1). This region of mixed-parasite endemic-ity is located in the easternmost part of the Indonesian archipelago (Fig. 2) and is classified by the World Health Organization (WHO) as hyper-endemic area with annual
parasite incidence (API) greater than 10 % (nationwide API < 1%; [7]) and parasite prevalence (PP) as high as 50–75 % (nationwide PP < 1%; [8]). Malaria accounts for a considerable proportion (15–34 %) of total hospital workload in the region [9]; mortality due to severe anae-mia [10] as well as multi-drug resistance with high rate of therapeutic failure (65–95 %) have been documented [11, 12]. In 2007, the Ministry of Health of the Republic of Indonesia [13] estimated that the infectious disease was prevalent among one-fifth (22.25 %) of the Papuan population—a figure that is seven times higher than the national average (Fig. 1). Perhaps nothing can highlight
Open Access
International Journal of Health Geographics
*Correspondence: [email protected] Cathie Marsh Institute for Social Research (CMIST), University Manchester, Oxford Road, Manchester M13 9PL, UK
Page 2 of 15Hanandita and Tampubolon Int J Health Geogr (2016) 15:13
the seriousness of this situation better than the fact that while malaria prevalence for the whole Indonesian archi-pelago decreased from 2.9 % in 2007 [13] to 1.9 % in 2013 [14], the figure for Papua actually increased to 24 % over the same period.
Defeating malaria is certainly a high priority for Indo-nesian policy makers; they have not only set the year 2030 as the deadline for malaria elimination in the coun-try [15] but have also entrusted local Papuan administra-tors with the responsibility for preventing and combating endemic diseases through the enactment of the 2001 Papua Special Autonomy Law No. 21 [16]. Notwith-standing these political commitments, challenges to dis-ease control in Papua remain. Principal among them is that the spatial distribution of malaria, which is vital for guiding efficient and equitable allocation of the limited resources available for intervention, is still understudied. To date, the only risk map available for the region is the one produced by the Malaria Atlas Project (MAP), which, while informative, was unfortunately based on commu-nity blood surveys carried out in non-randomly selected locations [17, 18]. Moreover, because the risk estimate in the existing malaria maps is presented as a continuous surface obtained from geostatistical models that are blind to political boundaries, there is no straightforward way to obtain a single summary [19] for each local administra-tive unit in Papua. Policy makers in now-decentralised Indonesia [20] are therefore deprived of an intuitive tool for prioritising development projects or other forms of
intervention that are funded by transfers from central to local governments (the Kabupaten/Kota or the district/municipality).
This scarcity of malaria-cartographic activity is further complicated by the fact that, unlike in Africa, the social and environmental determinants of malaria in Papua have not yet been thoroughly examined. Existing knowl-edge—that the risk of contracting the disease seems to be higher among non-native Papuans [12, 21], children and young adults [10], as well as rural [21] and lowland dwellers [10]—was in fact elicited from simple descrip-tive or bivariate analyses performed on small community or facility samples that are prone to both confounding and selection biases. So, although Papua is reputed to be one of the most malaria-ridden regions in the world [22], to date, only little is known about the social and spa-tial aspects of the disease. Without precise knowledge of where in Papua malaria strikes and which population subgroup it hits the hardest, it is likely to be difficult for Indonesian policy makers to meet the 2030 elimination target on time.
Analysing large population data (N = 22,643) from the National Basic Health Research 2007 (Riset Keseha-tan Dasar; [13]), this study aims to address these gaps. Through the application of a Bayesian hierarchical mod-elling technique that accounts for both the nesting of individuals within districts (vertical dependence) and the spatial autocorrelation among these areas (horizontal dependence; see Fig. 3), this paper seeks (1) to quantify
Riau Is
lands
Lam
pung
South
Sum
atra
Riau
Wes
t Sum
atra
North
Sum
atra
Jam
bi
Aceh
Bangk
a Beli
tung
Bengk
ulu
East J
ava
Yogy
akar
taBali
Bante
n
Centra
l Jav
a
Wes
t Jav
a
Jaka
rta
South
Kali
man
tan
East K
alim
anta
n
Wes
t Kali
man
tan
Centra
l Kali
man
tan
South
Sula
wesi
Wes
t Sula
wesi
North
Sula
wesi
South
east
Sulawes
i
Goron
talo
Centra
l Sula
wesi
Wes
t Nus
a Te
ngga
ra
East N
usa
Teng
gara
Malu
ku
North
Malu
ku
Wes
t Pap
ua
Papua
0
5
10
15
20
25
0
5
10
15
20
25
Sumatra Jawa−Bali Kalimantan SulawesiNusa
Tenggara Maluku Papua
Fig. 1 Malaria prevalence in 33 Indonesian provinces in 2007 (%), sorted by island group’s longitude (left to right = west to east, low to high preva-lence; source [13])

Page 3 of 15Hanandita and Tampubolon Int J Health Geogr (2016) 15:13
the district-specific risk of malaria in Papua and (2) to understand how socio-demographic/economic factors measured at individual and district levels are associated with an individual’s probability of contracting the dis-ease. The novelty of this paper is threefold. First, in using
randomly sampled population data from Indonesia’s larg-est public health study, this paper avoids the problem of confounding and selection biases that beset earlier stud-ies mentioned above. Second, through its spatial analy-sis of irregular lattice data, this study is able to deliver a
Fig. 2 Setting of the study

Page 4 of 15Hanandita and Tampubolon Int J Health Geogr (2016) 15:13
single risk summary for each district and municipality in Papua, which is the lowest autonomous administrative unit in the Indonesian political system. Finally, the pre-sent study is also distinguished from others in its multi-level analysis of individual and contextual determinants of malaria, avoiding ecological fallacy [23, 24].
The remainder of this paper is structured as follows. The next section describes the study site, data, meas-ures and modelling techniques. Third section presents the results. Fourth section discusses the findings. Finally, fifth section concludes.
MethodsStudy siteThis study was carried out in the western half, or the Indonesian side, of the New Guinea island, commonly referred to as the Papua or Irian Jaya region among Indonesians (Fig. 2). Lying between latitudes 0–9◦ South and longitudes 124–141◦ East, the climate of Papua is entirely tropical, with a dry season typically occurring from April–October and a wet season from October–April. Most of Papua’s land area is covered by forests. Apart from a mountain range stretching more than 1500 km from the west to central east of the island, the topography of Papua is shaped by the extensive presence of swamps, wetlands, mangroves, savannah grasslands, lakes and rivers. Rain persists throughout the year (150–270 days of rain per year), yielding 2000–3000 mm of annual rainfall [25, 26]. The average humidity is 80–90 % while the average temperature is about 26◦ Celsius, with an average maximum of 30◦ and an average minimum of 22◦ [25, 26].
According to the latest census conducted in 2010 [27], the population of Papua is 3.6 million (2 % of Indone-sia’s population) living in an area of 420,540 km2 (22 %
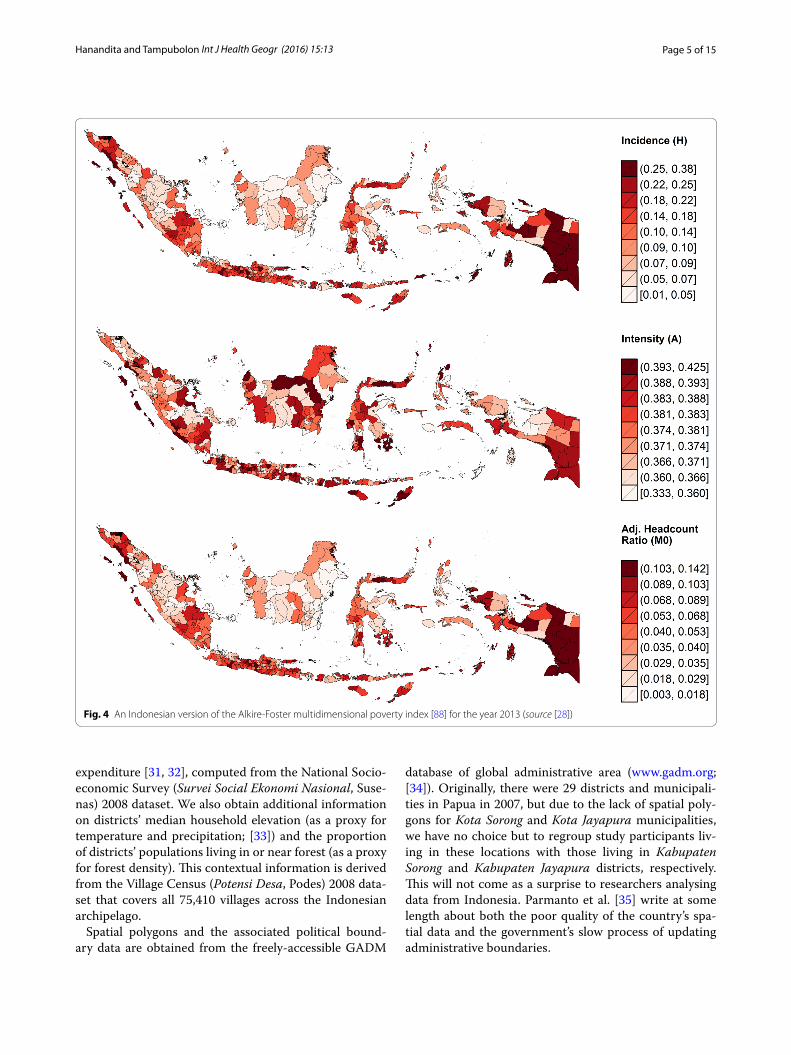
of the country’s land area), with a population density of just 9 persons per square kilometre (the lowest in Indo-nesia). As many as 70–75 % of Papuans live in rural areas [27]. Despite hosting one of the planet’s largest gold min-ing operations (the Grassberg mine in Mimika district), Papuan society is plagued by poverty and under-devel-opment. As shown in Fig. 4, Hanandita and Tampubo-lon [28] estimate that approximately a quarter of Papuan adults aged 18 and older were multidimensionally poor in 2013; collectively, they were subjected to about 10 % of the total deprivation (in terms of income, illness episodes, morbidity, schooling and literacy) potentially experienced by all adult Indonesian that year. The combination of geo-graphic features, climate conditions and extreme poverty provides a suitable environment for malaria transmission, both biologically and socially [4, 29, 30].
DataWe analyse data drawn from the National Basic Health Research (Riset Kesehatan Dasar, Riskesdas) 2007. Involving 987,205 individuals from 258,366 households in 440 districts, Riskesdas is the largest public health study ever conducted by the Ministry of Health of the Republic of Indonesia [13]. For our analysis, we sampled individu-als of all ages living in Papua, yielding a total sample size of 22,643 individuals.
Information on each respondent’s malaria status, age, sex, use of insecticide-treated net (ITN), and urban/rural residential location is available from the Riskesdas 2007 dataset. However, because the household consump-tion expenditure module was not administered to sur-vey respondents living in a number of Papuan districts, we are unable to include a measure of individual income. Instead, we obtain a measure of wealth in the form of each district’s median per capita household consumption
District 3 District 4 District 5 District 6
Fig. 3 Illustration of hierarchical and spatial dependence
Page 5 of 15Hanandita and Tampubolon Int J Health Geogr (2016) 15:13
expenditure [31, 32], computed from the National Socio-economic Survey (Survei Social Ekonomi Nasional, Suse-nas) 2008 dataset. We also obtain additional information on districts’ median household elevation (as a proxy for temperature and precipitation; [33]) and the proportion of districts’ populations living in or near forest (as a proxy for forest density). This contextual information is derived from the Village Census (Potensi Desa, Podes) 2008 data-set that covers all 75,410 villages across the Indonesian archipelago.
Spatial polygons and the associated political bound-ary data are obtained from the freely-accessible GADM
database of global administrative area (www.gadm.org; [34]). Originally, there were 29 districts and municipali-ties in Papua in 2007, but due to the lack of spatial poly-gons for Kota Sorong and Kota Jayapura municipalities, we have no choice but to regroup study participants liv-ing in these locations with those living in Kabupaten Sorong and Kabupaten Jayapura districts, respectively. This will not come as a surprise to researchers analysing data from Indonesia. Parmanto et al. [35] write at some length about both the poor quality of the country’s spa-tial data and the government’s slow process of updating administrative boundaries.
Fig. 4 An Indonesian version of the Alkire-Foster multidimensional poverty index [88] for the year 2013 (source [28])
Page 6 of 15Hanandita and Tampubolon Int J Health Geogr (2016) 15:13
Of the 22,643 individuals selected as our study sample, 871 (3.8 %) have missing values and are thus excluded from the subsequent multivariate modelling exercise. This data-cleaning procedure produces a final complete-case sample size of 21,772 individuals, corresponding to 96.2 % of the original Papuan sample of the Riskesdas 2007 study. Informed consent was obtained prior to data collection; study participants’ confidentiality was strictly protected by means of anonymisation [13].
Measures and a priori expectationsThe outcome variable, namely the individual’s malaria status, is coded as a binary variable whose value equals one (malaria-positive) if, within the past month, the study participant had been diagnosed with laboratory-confirmed malaria, suffered from high fever accompanied by chills, sweating, or headache, or took anti-malarial drugs [13]. Age is treated as a 7-category ordinal variable indicating the respondent’s age group (0–4, 5–14, 15–24, 25–34, 35–44, 45–54, and 55+). Sex, ITN use, and urban/rural residential location are each entered as a dummy variable representing female individuals, respondents who slept under an ITN the night prior to data collection, and those living in rural areas, respectively.
The three contextual variables are operationalised in the following way. Because no district has a median ele-vation between 200 and 1200 m, median household ele-vation is treated as a dummy variable indicating whether the majority of the district’s population lives in lowland (≤200 m above sea level) or highland (≥1200 m). The pro-portion of a district’s population living in or near forest is multiplied by a factor of 10 and used as a continuous var-iable. For ease of interpretation as well as for capturing a possible non-linear relationship, district median income is split into quintiles before being entered into the sta-tistical model described next as a set of four dummy variables indicating the relative wealth of each district in Papua. With this set up, we then set the reference indi-viduals (the intercept) in the model to represent urban, ITN non-user, male infants living in the poorest, least-densely-forested, highland district.
A priori, we expect that the chance of contracting malaria will be relatively high among individuals living in rural areas and in poor, densely forested, lowland dis-tricts of Papua. This is because the extant literature has already hinted that:
• there is an inverse relationship between temperature (hence altitude and latitude) and the length of the plasmodium growth-cycle [4, 30, 36, 37];
• the micro-climate of forests enhances anophelines breeding sites and prolongs their survival as adults [38, 39];
• the pollution and high population density of urban areas entail poor mosquito habitats and low biting frequency [29, 40]; and that
• poverty creates conditions (poor housing, lack of health knowledge, negative health behaviours) that favour the spread of infectious diseases and restrict access to prevention and treatment [41–43].
We also expect that the probability of being malaria-pos-itive will be high among those who do not sleep under ITN due to the lack of a physical barrier separating them from the mosquitoes [44]. Mendis et al. [45] suggest that the ‘male rather than female’ as well as the ‘working age rather than infant or elderly’ infection patterns that are commonly found in South East Asian countries are unlikely to hold in high endemicity areas such as Papua. Studies from Peru [46], Bangladesh [41, 47], Malawi [48], Gambia [49], and India [50] present conflicting evidence regarding the age and gender distributions of malaria.
Modelling techniquesTo predict the malaria status of individual i living in dis-trict j, a Bayesian generalised linear model (GLM) with random effects is fitted [51, 52]. We assume, for the data model, that a person’s malaria status arises from the reali-sation of a Bernoulli trial with the probability of success (malaria-positive) πij as shown in Eq. 1. In the process model (Eqs. 2 and 3), we take the logit of πij and model it as a linear combination of observed individual (xij) and contextual (xj) characteristics with parameter vector β plus an unobserved district-specific effect ξj. The ξj can be intuitively understood as random intercepts indicating how much the risk of contracting malaria in each district varies from the island’s average (β0) after accounting for the effects of all observed covariates (
∑Pp=1 βpxpij). This
district-specific effect is further decomposed additively into its spatially structured (uj) and unstructured (vj) com-ponents, which, in combination, are capable of incorpo-rating the dependency structure of spatially correlated multilevel data (Fig. 3) into the modelling process [53].
(1)yij ∼ Bernoulli(πij)
(2)logit(πij) = (Xβ)ij + ξj
(3)log
[
πij
1− πij
]
= β0 +
P∑
p=1
βpxpij + uj + vj
(4)β ∼ Normal(0, 10−4)
(5)uj|uk , j �= k , τu ∼ Normal
1
Nj
�
j∼k
uk ,1
Njτu
Page 7 of 15Hanandita and Tampubolon Int J Health Geogr (2016) 15:13
The body of epidemiology and parasitology research [54–57] suggests that either ignoring spatial heterogene-ity (vertical dependency) induced by the clustering of individuals within areas of residence or omitting spatial autocorrelation (horizontal dependency) among adjacent areas could result in severely underestimated uncertainty with respect to the estimation of regression parameters; in some cases, it could even result in biased estimates (see [24, 58, 59] for elaboration in general context). Chirombo et al. [48] suggest that, technicalities aside, the spatially structured random effect uj plays a crucial role in captur-ing the unmeasured between-area variation in access to health facilities and interventions, while the unstructured component vj is useful for absorbing the unobserved level of immunity to malaria that varies randomly across the locations. In general, one may view this random effects specification as a method of incorporating the effects of unmeasurable natural and social features that transcend political borders.
Prior distributions for the unknown random param-eters are specified as follows. The regression parameter β , which determines how the risk of malaria is distributed across socio-demographic/economic strata in Papua, is assigned a diffuse normal prior with mean zero and extremely low precision (Eq. 4). The spatially structured random effect uj is given a conditional autoregressive (CAR) prior [60] whose mean and precision depend on the structure as well as the number (Nj) of the adjacent first-order neighbours (j ∼ k) of each district (Eq. 5). The binary adjacency matrix for this prior is constructed using queen contiguity criteria [61]; the implied neigh-bourhood graph is shown in the top panel of Fig. 2. This Markov random field (MRF) approach to spatial model-ling has been recently applied to analyses of malaria in Malawi [48, 62], antenatal care in Kenya [63], and child-hood health outcomes in Tanzania, Malawi and Zambia [64, 65], among others. Best et al. [66] and Kauermann et al. [67] report the relatively good performance of the MRF model in comparison to other spatial-statistical and spatial-econometrics models. For the spatially unstruc-tured random effect vj, a typical normal prior with an exchangeable structure is assumed (Eq. 6). We then choose Gamma(0.001, 0.001), a proper approximation of a Jeffreys non-informative prior [68], as the default prior for the precisions of uj and vj (Eqs. 7 and 8) although later (in Figs. 6, 8), we also conduct sensitivity analysis using alternative Gamma(a, b) hyperpriors [69].
(6)vj ∼ Normal(0, τv)
(7)τu ∼ Gamma(10−3, 10−3)
(8)τv ∼ Gamma(10−3, 10−3)
Marginal posterior distributions of model parameters are obtained using integrated nested Laplace approxi-mation (INLA), which is not only a valid but also an effi-cient alternative to the commonly used Markov Chain Monte Carlo (MCMC) simulation method [70–73]. To facilitate interpretation, we derive quantities that are of particular interest to policy makers, such as the odds ratio (exp[β], exp[ξj]), the probability of excess risk (Pr[exp{ξj} > 1|y] = Pr[ξj > 0|y]), the baseline probabil-ity of malaria infection (logit−1[β0 + ξj] = logit−1[β0j]), as well as the fraction of district-level variance attributed to spatial autocorrelation (φ = σ 2
u/[σ2u + σ 2
v ]). A devi-ance information criterion (DIC; [74]) is used to evaluate the performance of the full model against the null. Where a density curve is not shown, we summarise the posterior distribution of a model parameter using its mean, accom-panied by the 95 % credible interval.
ResultsDescriptive and bivariate analysisThe second column in Table 1 shows the univariate description of the sample. Confirming the official tabula-tion released by the Ministry of Health [13], about one-fifth of study participants (21.06 %) reported they had been infected with malaria. In the sample, sex appears to be distributed equally; about 60 % of study partici-pants are of working age (≥15 years old); the vast major-ity (78 %) of them are ITN non-users or rural dwellers. With respect to elevation, it appears that only 6 out of 27 districts (22.22 %) are categorised as highland dis-tricts (≥1200 m). It turns out that about half ( p̂ = 0.52 ; SD = 0.24) of Papuan population live in the vicinity of forest; and assuming a historical 1 US Dollar (USD) to 10,000 Indonesian Rupiah (IDR) exchange rate, the dis-trict median per capita daily consumption expenditure is around USD 1.30 (SD = 0.50).
The magnitude of bivariate associations between an individual’s malaria status and its predictors is presented in the rightmost column of Table 1. Confirming conven-tional wisdom, the analysis suggests that Papuans living in rural area or in poor, densely forested, lowland districts are at a relatively higher risk of contracting malaria than their counterparts in urban or highland settings. Age and gender do not seem to explain much of the between-individual variability in disease prevalence, although there appears to be a weak indication for the presence of a threshold effect in the relationship between age and malaria status. Contradicting a priori expectation, the analysis shows that the odds of being malaria-positive increase with respondents’ use of ITN on the night prior to data collection. Of course, it is prudent to note that this paradoxical finding could arise from our application of a simple GLM that neither adjusts for confounding nor

Page 8 of 15Hanandita and Tampubolon Int J Health Geogr (2016) 15:13
accounts for the complex dependency structure of the data. Whether this unexpected ITN effect is simply a sta-tistical artefact is to be tested in the multivariate analysis presented next.
Multivariate analysisFigure 5 displays the confounding-adjusted odds ratios (diamond) along with their 80 % (bold line) and 95 % (fine line) credible intervals. The most striking feature of the analysis is that the odds of contracting malaria for indi-viduals living in lowland districts versus those in high-land districts have doubled from 1.65 (95 % CI 1.51–1.79) in the simple bivariate model to 2.99 (95 % CI 1.84–4.59) in the multivariate model. Living in a rural area (OR 1.43, 95 % CI 1.29–1.57) and in a densely forested district
(OR 1.08, 95 % CI 1.00–1.17) are both associated with higher odds of being malaria-positive; their posterior means (credible intervals) do not, however, vary much from those obtained from the previous bivariate model. The analysis also makes the socio-economic gradient of malaria prevalence in Papua much clearer. The odds of being infected with malaria seem to follow a non-linear, monotonically decreasing function of district median income such that individuals living in the richest 20 % of districts have 38 % lower odds of being malaria-positive, holding all other factors constant. The multivariate analy-sis also presents evidence of the existence of a threshold effect in the relationship between age and malaria status, because only the elderly (55+ age group) seem to have a distinctively elevated risk of malaria. In addition, the sex difference is now more precisely estimated, with female individuals having 4 % lower odds than their male coun-terparts. After controlling for all of these, however, we still find an unexpected positive ITN effect, with study participants who slept under a bed-net estimated to have 25 % higher odds of contracting malaria. We discuss plausible explanations for this in the discussion section.
Table 2 compares the performance of the fully specified model against the null model. Clearly, the full fits bet-ter than the null, as its improvement in terms of model deviance (D̄) far outweighs the increased model complex-ity (pD), leading to a 94.36 point smaller DIC statistic. The covariates seem to have a strong explanatory power; their inclusion into the model leads to a 71 % reduction in the between-district variability of malaria prevalence (σ 2
u + σ 2v ). These covariates account for a dispropor-
tionately larger proportion of the spatially unstructured between-district variability (σ 2
v ) than the structured one (σ 2
u ), which, in turn, inflate the proportion of variance attributed to spatial autocorrelation (φ) from just 4 % in the empty model to 32 % in the full model. In Fig. 6, we test the sensitivity of regression parameters with respect to the specification of alternative Gamma hyperpriors. Results show that the posteriors are robust to the choice of commonly suggested hyperpriors, albeit with some degree of variation around the width of the credible intervals of the intercept and contextual determinants. Nevertheless, since their means, medians and modes are all very close, the interpretation above remains.
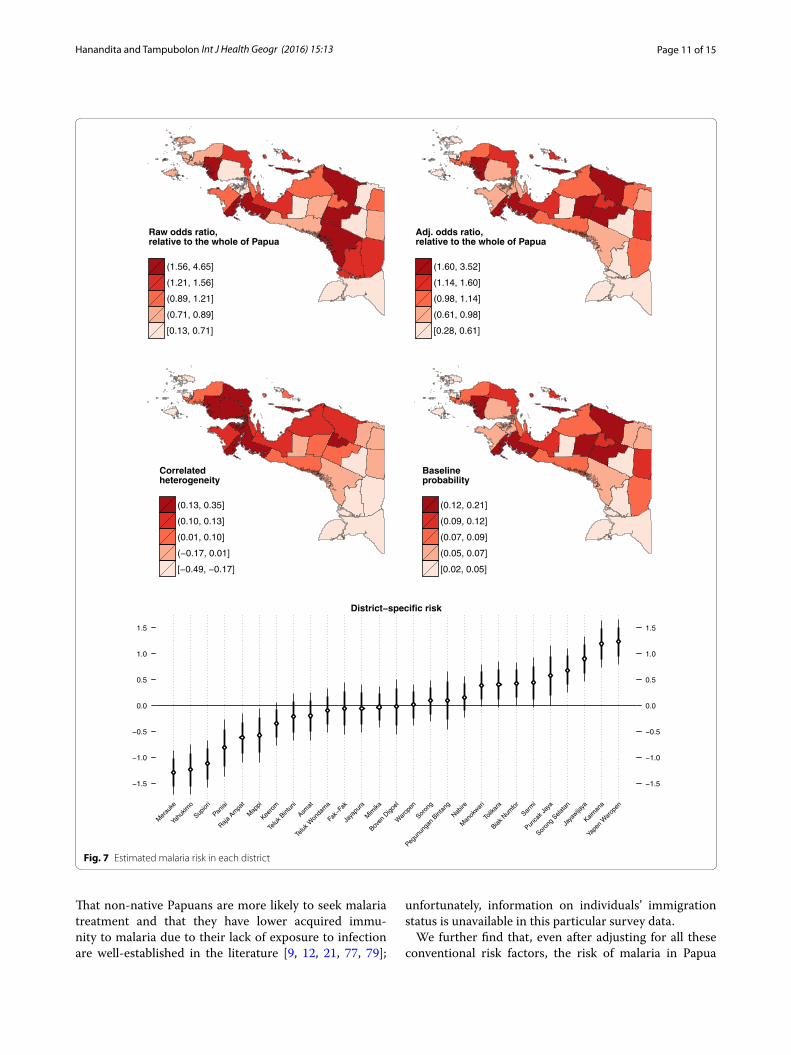
Having investigated the social and environmental cor-relates of malaria in Papua, we now turn our attention to Fig. 7, which shows the spatial distribution of the disease. The raw odds ratio (exp[ξj]) displayed in the top-left panel shows where in Papua malaria is more prevalent (Null model), whereas the adjusted odds ratio shown in the top-right panel indicates which district has higher than expected prevalence after accounting for the effect of predictor variables in the Full model. It should
Table 1 Descriptive and bivariate analysis
Variable Summary statistic
Unadjusted odds ratio [95 % CI]
Individual characteristics (N = 22,643)
Malaria status
No 78.94 %
Yes 21.06 %
Sex
Male 49.62 % 1.00
Female 50.38 % 0.96 [0.90, 1.02]
Age group
0–4 (Infant) 12.39 % 1.00
5–14 26.84 % 0.93 [0.83, 1.04]
15–24 14.36 % 0.90 [0.80, 1.02]
25–34 16.41 % 1.02 [0.90, 1.15]
35–44 14.98 % 1.01 [0.90, 1.15]
45–54 9.40 % 1.03 [0.90, 1.18]
55+ 5.62 % 1.15 [0.98, 1.35]
Sleep under ITN
No 78.62 % 1.00
Yes 21.38 % 1.15 [1.07, 1.25]
Residential location
Urban 22.14 % 1.00
Rural 77.86 % 1.43 [1.31, 1.55]
District characteristics (N = 27)
Median household elevation
Highland (≥1200 m) 22.22 % 1.00
Lowland (≤200 m) 77.78 % 1.65 [1.51, 1.79]
Proportion living in or near forest
0.52 ± 0.24 1.07 [1.05, 1.08]
Median income
Quintile 1 (poorest) 22.22 % 1.00
Quintile 2 18.52 % 1.41 [1.27, 1.57]
Quintile 3 22.22 % 0.95 [0.87, 1.04]
Quintile 4 18.52 % 0.91 [0.82, 1.01]
Quintile 5 (richest) 18.52 % 0.72 [0.66, 0.80]

Page 9 of 15Hanandita and Tampubolon Int J Health Geogr (2016) 15:13
be appreciated that, although the spatial patterning of malaria does not seem to vary that much between the two models, its variability is clearly reduced after the inclu-sion of the covariates. Apparent in the middle-left panel is the gradient of spatially correlated heterogeneity (uj, in logit scale) that varies smoothly from the north-western side (high risk) to the south-eastern side (low risk) of the island. The middle-right panel re-expresses the estimated risk in terms of how likely, in the probability scale, the reference individuals are to be infected with malaria in each district (logit−1[β0 + ξj]). Finally, in the bottommost panel of the same figure, we rank the district-specific risk estimates (ξj, in logit scale) along with their 80 % (bold line) and 95 % (fine line) credible intervals. It is evident from these plots that, net of differentials in observable
characteristics, four districts have unambiguously higher-than-expected malaria risks (Yapen Waropen, Kaimana, Jayawijaya, and Sorong Selatan). However, it is only when we apply Richardson’s criterion [75] to the poste-rior probability distributions (Pr[exp{ξj} > 1|y]) that we become aware of nine districts whose risks are deemed to be positively significant (Table 3). According to this criterion, clusters of elevated malaria risks are identi-fied in north-central Papua, near Biak and Yapen islands, and around the north-western area. Figure 8 shows that this risk ranking exercise is robust to the assumption of hyperprior distributions.
DiscussionAnalysing a subset of the largest public health data ever collected in Indonesia (National Basic Health Research 2007; N = 987,205), this study quantifies the district-spe-cific risk of malaria in Papua and investigates how the dis-ease is distributed across socio-demographic/economic strata. We predict the malaria status of 21,740 Papuans living in 27 districts using a Bayesian logistic regression model that accounts for the clustering of individuals within their areas of residence and the spatial autocor-relation among these locations. Both individual (age, sex, bed-net use, urban/rural) and contextual characteristics
Richest vs Poorest District
Q4 vs Poorest District
Q3 vs Poorest District
Q2 vs Poorest District
Proportion living in or near forest
Lowland vs Highland
Rural vs Urban
Sleep under ITN
55+ vs Infant
45−54 vs Infant
35−44 vs Infant
25−34 vs Infant
15−24 vs Infant
5−14 vs Infant
Female vs Male
Intercept
0.62 [0.35, 1.01]
0.71 [0.39, 1.19]
0.72 [0.41, 1.17]
0.98 [0.52, 1.66]
1.08 [1.00, 1.17]
2.99 [1.84, 4.59]
1.43 [1.29, 1.57]
1.25 [1.14, 1.38]
1.18 [1.00, 1.39]
1.07 [0.92, 1.23]
1.07 [0.93, 1.21]
1.09 [0.96, 1.23]
0.94 [0.82, 1.07]
0.94 [0.83, 1.05]
0.94 [0.88, 1.00]
0.07 [0.04, 0.13]
0.2 1 1.8 2.6 3.4 4.2
Fig. 5 Posterior means of adjusted odds ratio and their 80 and 95 % credible intervals
Table 2 Summary of model fit
Statistic Null model Full model
D̄ 20,656.42 20,553.76
pD 26.59 34.89
DIC 20,683.01 20,588.65
σ 2u + σ 2
v0.76 0.22
φ 0.04 0.32

Page 10 of 15Hanandita and Tampubolon Int J Health Geogr (2016) 15:13
(elevation, forest density, median income) are included as predictors in the model.
In the analysis, a spatial gradient that varies smoothly from the north-western (higher risk) to the south-eastern (lower risk) areas of the island is identified; after tak-ing this patterning into account, we then calculate, rank and map malaria risk in each district. We find that, even within this hyper-endemic island, the extent of spatial variation is not negligible. The model estimates that, while the baseline probability of malaria infection is about 2–5 % in the healthiest 20 % of districts, the fig-ure can be as high as 12–21 % in the least healthy ones. This means that a typical male Papuan infant would have a 4–5 times higher probability of suffering from malaria if he were born in high-risk districts instead of in low-risk districts. Whether or not this inequality is acceptable within the current climate of Papua’s special autonomy [76] and Indonesia’s political decentralisation [20] is, of course, open to public debate.
Our risk mapping exercise further reveals three clus-ters of statistically significant high-risk districts located in north-central Papua (Sarmi, Tolikara, Puncak Jaya and Jayawijaya), near Biak and Yapen islands (Biak Num-for and Yapen Waropen), and around the north-western area of the island (Kaimana, Sorong Selatan and Manok-wari). Because this risk ranking is independent of com-mon socio-demographic/economic differentials and does seem to be robust to prior assumptions, health policy makers or planners may, therefore, want to conduct fur-ther epidemiological studies in these areas to unravel the possible social and environmental drivers of this
excess risk. Furthermore, should there ever emerge an urgent need for allocating limited funds or human-cap-ital resources in order to help local autonomous Papuan administrators achieve the country’s 2030 malaria elimi-nation target [15], the Indonesian government could now consider utilising risk estimates and probabilistic maps presented in this study as a tool for prioritising develop-ment projects or other forms of intervention that may be funded by transfers from central to local governments. Such risk mapping activity is of high relevance for policy makers because the success of malaria control in many under-resourced countries often depends on targeted development of much-needed healthcare facilities in remote and sparsely populated areas [17, 77].
Independent of the aforementioned spatial effect, an elevated malaria risk is associated with living in rural areas, in densely forested districts, and in lowlands. This can be explained by the biology of the disease, as we have noted earlier. The literature suggests that these places provide not only a conducive environment for successful completion of the plasmodium growth-cycle [4, 30, 36, 37] but also a suitable breeding site and feeding ground for the anopheles vector [29, 38–40]. Small increases in malaria risk are also associated with being male and with being over age 55. These differentials may be driven by social norms with regards to gender roles and risk-exposure preferences [41, 45, 48, 78]—for instance, women (children) should stay safe at home while men (adults) have to work outside to provide for the fam-ily—although we ought to note that these effects may yet be confounded by the respondent’s immigration status.
Intercept
−6 −5 −4 −3 −2 −1 0
Female vs Male
−0.2 −0.1 0.0 0.1
5−14 vs Infant
−0.3 −0.1 0.1 0.2 0.3
15−24 vs Infant
−0.4 −0.2 0.0 0.2
25−34 vs Infant
−0.2 0.0 0.2 0.4
35−44 vs Infant
−0.2 0.0 0.2 0.4
45−54 vs Infant
−0.4 −0.2 0.0 0.2 0.4
55+ vs Infant
−0.2 0.0 0.2 0.4 0.6
Sleep under ITN
0.0 0.1 0.2 0.3 0.4 0.5
Rural vs Urban
0.1 0.2 0.3 0.4 0.5 0.6
Lowland vs Highland
−1 0 1 2 3
Proportion living near forest
−0.2 0.0 0.2 0.4 0.6
Q2 vs Poorest District
−3 −2 −1 0 1 2 3
Q3 vs Poorest District
−3 −2 −1 0 1 2
Q4 vs Poorest District
−3 −2 −1 0 1 2
Richest vs Poorest District
−3 −2 −1 0 1 2
Hyperpriors
Ga(1,0.0005)Ga(1,0.00005)Ga(1,0.001)Ga(1,0.01)Ga(1,0.1)Ga(0.5,0.0005)
Ga(0.01,0.01)Ga(10,0.35)Ga(0.001,0.001)Ga(0.00001,0.00001)Ga(0.0005, 0.0005)Ga(1,0.005)
Fig. 6 Posterior density of fixed effects coefficients (β) under some alternative hyperprior specifications, logit scale
Page 11 of 15Hanandita and Tampubolon Int J Health Geogr (2016) 15:13
That non-native Papuans are more likely to seek malaria treatment and that they have lower acquired immu-nity to malaria due to their lack of exposure to infection are well-established in the literature [9, 12, 21, 77, 79];
unfortunately, information on individuals’ immigration status is unavailable in this particular survey data.
We further find that, even after adjusting for all these conventional risk factors, the risk of malaria in Papua
District−specific risk
−1.5
−1.0
−0.5
0.0
0.5
1.0
1.5
−1.5
−1.0
−0.5
0.0
0.5
1.0
1.5
Mer
auke
Yahu
kimo
Supior
i
Paniai
Raja A
mpa
t
Map
pi
Keero
m
Teluk
Bint
uni
Asmat
Teluk
Won
dam
a
Fak−
Fak
Jaya
pura
Mim
ika
Boven
Digo
el
War
open
Soron
g
Pegun
unga
n Bint
ang
Nabire
Man
okwar
i
Tolik
ara
Biak N
umfor
Sarm
i
Punca
k Jay
a
Soron
g Sela
tan
Jaya
wijaya
Kaiman
a
Yape
n W
arop
en
Baselineprobability
(0.12, 0.21]
(0.09, 0.12]
(0.07, 0.09]
(0.05, 0.07]
[0.02, 0.05]
Correlatedheterogeneity
(0.13, 0.35]
(0.10, 0.13]
(0.01, 0.10]
(−0.17, 0.01]
[−0.49, −0.17]
Adj. odds ratio,relative to the whole of Papua
(1.60, 3.52]
(1.14, 1.60]
(0.98, 1.14]
(0.61, 0.98]
[0.28, 0.61]
Raw odds ratio,relative to the whole of Papua
(1.56, 4.65]
(1.21, 1.56]
(0.89, 1.21]
(0.71, 0.89]
[0.13, 0.71]
Fig. 7 Estimated malaria risk in each district

Page 12 of 15Hanandita and Tampubolon Int J Health Geogr (2016) 15:13
remains far from evenly distributed by income level. Pap-uans living in the richest districts are estimated to have 38 % lower odds of having the disease than their peers in
the poorest districts. So, if our reference infant were born in one of the richest districts, his estimated probability of being malaria-positive would be just 4 % instead of 6 %. This demonstrates that an income gradient in malaria prevalence indeed exists, even in Indonesia’s most deprived island group (recall Fig. 4). This finding is there-fore consistent with the hypothesis that poverty creates conditions (poor housing, lack of knowledge, negative health behaviours) that favour the spread of infectious diseases and restrict access to prevention and treatment [5, 41–43].
Contrary to conventional wisdom, our analysis reveals that respondents’ use of ITN has a positive association with being malaria-positive. Initially, we suspected that this might be attributable to confounding or to an unac-counted data dependency structure in our naïve bivariate analysis. However, after fitting the fully specified multi-variate model, the association persists. One plausible explanation is that a systematic bias due to differential item functioning (DIF) [80, 81] is at play, meaning that
Fak−Fak
−3 −2 −1 0 1 2 3
Kaimana
−1 0 1 2 3
Manokwari
−1 0 1 2
Raja Ampat
−3 −2 −1 0 1 2
Sorong Selatan
−1 0 1 2 3
Sorong
−2 −1 0 1 2
Teluk Bintuni
−2 −1 0 1 2
Teluk Wondama
−2 −1 0 1 2
Asmat
−2 −1 0 1 2
Biak Numfor
−1 0 1 2
Boven Digoel
−3 −2 −1 0 1 2
Jayapura
−2 −1 0 1 2
Jayawijaya
−1 0 1 2 3
Keerom
−2 −1 0 1
Mappi
−3 −2 −1 0 1 2
Merauke
−3 −2 −1 0
Mimika
−2 −1 0 1 2
Nabire
−2 −1 0 1 2
Paniai
−3 −2 −1 0 1 2
Pegunungan Bintang
−3 −2 −1 0 1 2 3
Puncak Jaya
−2 −1 0 1 2 3 4
Sarmi
−2 −1 0 1 2 3
Supiori
−3 −2 −1 0 1
Tolikara
−1 0 1 2
Waropen
−2 −1 0 1 2
Yahukimo
−3 −2 −1 0 1
Yapen Waropen
−1 0 1 2 3
Hyperpriors
Ga(1,0.0005)Ga(1,0.00005)Ga(1,0.001)Ga(1,0.01)
Ga(1,0.1)Ga(0.5,0.0005)Ga(0.01,0.01)Ga(10,0.35)
Ga(0.001,0.001)Ga(0.00001,0.00001)Ga(0.0005, 0.0005)Ga(1,0.005)
Fig. 8 Posterior density of district-specific effects (ξj) under some alternative hyperprior specifications, logit scale
Table 3 Risk category, based on Richardson et al. [75]
a Pr(ξj > 0|y) ≥ 0.80
b Pr(ξj > 0|y) ≤ 0.20
c 0.20 < Pr(ξj > 0|y) < 0.80
Positively significanta Negatively significantb Not significantc
Yapen Waropen Merauke Teluk Wondama
Kaimana Yahukimo Fak-fak
Jayawijaya Supiori Jayapura
Sorong Selatan Paniai Mimika
Biak Numfor Raja Ampat Boven Digoel
Puncak Jaya Mappi Waropen
Manokwari Keerom Pegunungan Bintang
Tolikara Teluk Bintuni Sorong
Sarmi Asmat Nabire

Page 13 of 15Hanandita and Tampubolon Int J Health Geogr (2016) 15:13
ITN users may over-report their illnesses simply because they are more aware of malaria symptoms than their non-user peers [44, 49, 82]. An equally plausible explanation is that this counter-intuitive result is actually an artefact of the targeted distribution of ITN to the less healthy sub-population, such that individuals who use ITN are actu-ally those who have already been infected [83]. Another explanation, as documented in one ethnographic study from Malawi [42], is that economically disadvantaged individuals may use the net to enhance their outdoor income-generating activities (such as fishing), which could in turn, lead to increased risk exposure. Under-standing which of these scenarios fits the reality in Papua is, indeed, a good motivation for future investigations.
The present study is not without limitations. One is that, due to a lack of data, we are unable to investi-gate how the prevalence of malaria varies by individual income and immigration status. Secondly, we are una-ble to estimate malaria risks in Kota Sorong and Kota Jayapura municipalities because their spatial polygons are not available. A more serious limitation, however, pertains to our use of clinical malaria data, which are fraught with measurement error. In the presence of DIF, clinical data could overestimate the true prevalence of malaria; but in hyper-endemic areas, they may just as easily underestimate the true prevalence because of the presumably high incidence of asymptomatic malaria [29, 49]. Somi et al. [82] point out that such measure-ment error, among other things, is often responsible for the attenuated estimates of socio-economic gradient in malaria prevalence (attenuation bias).
Despite these limitations, the present study still con-tributes to the literature in several ways. First, to the best of our knowledge, this study is among the first to provide a probabilistic characterisation of how malaria is distributed spatially and socially within Indonesian Papua. The Bayesian hierarchical modelling framework we adopt in this paper has proven to be useful and fea-sible for the purpose; policy makers could, therefore, consider employing it more routinely in the planning and evaluation of malaria elimination efforts in the country. The study is further distinguished in its use of randomly sampled population data, which have helped us contain to a large extent the threat of confounding and selec-tion biases that limit the generalisability of existing com-munity or facility studies [84]. Finally, the present study shows that in addition to being geography-dependent, malaria in Indonesian Papua is also a disease of poverty. A comprehensive malaria elimination programme in this region should therefore consider not only proximal fac-tors impacting the biology of the plasmodium parasite and the anopheles vector but also distal socio-economic conditions facilitating malaria transmission [5, 29, 85,
86]. This means that classical health interventions via bed-net distribution, insecticide residual spraying, cura-tive medication, and environmental controls should ide-ally be implemented alongside development programmes in the forms of job-creation, investment in education, income redistribution, and provision of affordable and accessible healthcare facilities [42, 87]. Unless the socio-economic factors that modulate the risk of infection are addressed, malaria elimination efforts in Papua will not be as effective as they are intended to be.
ConclusionThis study is among the few to consider both the social and spatial distributions of malaria in Indonesian Papua, a hyper-endemic area that has received only little interna-tional attention due to the lack of data. The analysis shows that although malaria is geography-dependent in Papua, it is also a disease of poverty. This means that its eradica-tion requires not only biological (proximal) interventions but also social (distal) ones. This finding is generally con-sistent with the body of literature linking socio-economic deprivation with malaria; it could, therefore, inform policy-making beyond Papuan context. This study also demonstrates the utility and feasibility of Bayesian hier-archical model for understanding the distribution of the infectious disease. Bayesian inference is still computation-ally more expensive than the classical one. However, as computing power continues to increase and new, efficient algorithms—such as one used in the present study—are devised, this flexible disease mapping technique could be employed more routinely in the planning and evalua-tion of malaria elimination efforts in other resource-poor settings.
AbbreviationsWHO: World Health Organization; API: annual parasite incidence; PP: parasite prevalence; MAP: Malaria Atlas Project; mm: millimetre; Riskesdas: Riset Kesehatan Dasar; ITN: insecticide-treated net; Susenas: Survei Sosial Ekonomi Nasional; Podes: Potensi Desa; GADM: Global Administrative Area database; GLM: generalised linear model; CAR: conditional autoregressive; MRF: Markov random field; INLA: integrated nested Laplace approximation; MCMC: Markov Chain Monte Carlo; DIC: deviance information criterion; USD: US Dollar; IDR: Indonesian Rupiah; SD: standard deviation; CI: credible interval; OR: odds ratio; DIF: differential item functioning.
Authors’ contributionsWH conceived the study, analysed and interpreted the data, and wrote and edited the manuscript. GT contributed to the interpretation of the results and editing of the manuscript. Both the authors have read and approved the final manuscript.
AcknowledgementsWH thanks Johan Koskinen for his expert statistical advice. This manuscript has benefited from helpful comments from Hill Kulu and the participants of Advanced Quantitative Methods Mini-symposium in Manchester, 3 November 2015. WH’s research is supported by the Economic and Social Research Council (ESRC), UK [ES/J500094/1] (PhD project: ‘Essays on Poverty and Health in Indonesia’). All errors remain the authors’ responsibility.

Page 14 of 15Hanandita and Tampubolon Int J Health Geogr (2016) 15:13
Competing interestsThe authors declare that they have no competing interests.
Received: 21 December 2015 Accepted: 30 March 2016
References 1. Guyatt HL, Snow RW. The epidemiology and burden of Plasmodium
falciparum-related anemia among pregnant women in sub-Saharan Africa. Am J Trop Med Hyg. 2001;64(1S):36–44.
2. Holding PA, Snow RW. Impact of Plasmodium falciparum malaria on performance and learning: review of the evidence. Am J Trop Med Hyg. 2001;64(1S):68–75.
3. Gallup JL, Sachs JD. The economic burden of malaria. Am J Trop Med Hyg. 2001;64(1S):85–96.
4. Sachs J, Malaney P. The economic and social burden of malaria. Nature. 2002;415(6872):680–5.
5. Teklehaimanot A, Meija P. Malaria and poverty. Ann N Y Acad Sci. 2008;1136(1):32–7.
6. Webster D. Malaria kills one child every 30 seconds. J Publ Health Policy. 2001;22(1):23–33.
7. WHO. Malaria and its control in the WHO South-East Asia Region; 2012. World Health Organization, Regional Office for South-East Asia. http://www.searo.who.int/entity/malaria/topics/Malaria_factsheetWMD2012.pdf.
8. WHO. World Malaria Report 2014; 2014. World Health Organization. http://www.who.int/malaria/publications/world_malaria_report/en/.
9. Karyana M, Burdarm L, Yeung S, Kenangalem E, Wariker N, Maristela R, et al. Malaria morbidity in Papua Indonesia, an area with multidrug resist-ant Plasmodium vivax and Plasmodium falciparum. Malar J. 2008;7:148.
10. Douglas NM, Pontororing GJ, Lampah DA, Yeo TW, Kenangalem E, Poes-poprodjo JR, et al. Mortality attributable to Plasmodium vivax malaria: a clinical audit from Papua Indonesia. BMC Med. 2014;12:217.
11. Sumawinata IW, Bernadeta, Leksana B, Sutamihardja A, Subianto PB, Sekartuti, et al. Very high risk of therapeutic failure with chloroquine for uncomplicated Plasmodium falciparum and P. vivax malaria in Indonesian Papua. Am J Trop Med Hyg. 2003;68(4):416–20.
12. Tjitra E, Anstey NM, Sugiarto P, Warikar N, Kenangalem E, Karyana M, et al. Multidrug-resistant Plasmodium vivax associated with severe and fatal malaria: a prospective study in Papua, Indonesia. PLoS Med. 2008;5(6):e128.
13. Kemenkes. Laporan Nasional Riskesdas 2007; 2008. Ministry of Health, The Republic of Indonesia [online, accessed 22 January 2014]. http://labdata.litbang.depkes.go.id/menu-download/menu-download-laporan.
14. Kemenkes. Laporan Nasional Riskesdas 2013; 2013. Ministry of Health, The Republic of Indonesia [online, accessed 18 November 2015]. http://labdata.litbang.depkes.go.id/menu-download/menu-download-laporan.
15. Kemenkes. Keputusan Menteri Kesehatan Republik Indonesia Nomor 293/MENKES/SK/IV/2009 Tentang Eliminasi Malaria Di Indonesia; 2009. Ministry of Health, The Republic of Indonesia.
16. LNRI No 135. Undang-Undang Republik Indonesia Nomor 21 Tahun 2001 Tentang Otonomi Khusus Bagi Provinsi Papua; 2001. Lembaran Negara Republik Indonesia Tahun 2001 Nomor 135.
17. Elyazar IRF, Gething PW, Patil AP, Rogayah H, Kusriastuti R, Wismarini DM, et al. Plasmodium falciparum malaria endemicity in Indonesia in 2010. PLoS ONE. 2011;6(6):e21315.
18. Elyazar IRF, Gething PW, Patil AP, Rogayah H, Sariwati E, Palupi NW, et al. Plasmodium vivax malaria endemicity in Indonesia in 2010. PLoS ONE. 2012;7(5):e37325.
19. Wall MM. A close look at the spatial structure implied by the CAR and SAR models. J Stat Plan Inference. 2004;121(2):311–24.
20. Hill H, editor. Regional dynamics in a decentralized Indonesia. Singapore: ISEAS Publishing; 2014.
21. Barcus MJ, Basri H, Picarima H, Manyakori C, Sekartuti Elyazar I, et al. Demographic risk factors for severe and fatal vivax and falciparum malaria among hospital admissions in northeastern Indonesian Papua. Am J Trop Med Hyg. 2007;77(5):984–91.
22. CDC. Where Malaria Occurs; 2010. Centers for Disease Control and Prevention [online, accessed 18 November 2015]. http://www.cdc.gov/malaria/about/distribution.html.
23. Obaldia N. Determinants of low socio-economic status and risk of Plas-modium vivax malaria infection in Panama (2009–2012): a case–control study. Malar J. 2015;14:14.
24. Snijders TAB, Bosker RJ. Multilevel analysis: an introduction to basic and advanced multilevel modeling. 2nd ed. London: SAGE; 2012.
25. BPS Papua. Rata-rata Suhu Udara, Kelembaban, Tekanan Udara, Kecepa-tan Angin, Curah Hujan, Hari Hujan, dan Penyinaran Matahari Menurut Stasiun di Provinsi Papua 2010–2013; 2015. Badan Pusat Statistik Provinsi Papua [online, accessed 18 November 2015]. http://papua.bps.go.id/linkTabelStatis/view/id/14.
26. BPS Papua Barat. Iklim; 2015. Badan Pusat Statistik Provinsi Papua Barat [online, accessed 18 November 2015]. http://irjabar.bps.go.id/Subjek/view/id/151#subjekViewTab3|accordion-daftar-subjek1.
27. BPS. Sensus Penduduk 2010; 2010. Badan Pusat Statistik [online, accessed 18 November 2015]. http://sp2010.bps.go.id/index.php/site/index.
28. Hanandita W, Tampubolon G. Multidimensional poverty in Indonesia: trend over the last decade (2003–2013). Social Indicators Research. 2015;(Online First):1–29. doi:10.1007/s11205-015-1044-0.
29. Lowe R, Chirombo J, Tompkins AM. Relative importance of climatic, geo-graphic and socio-economic determinants of malaria in Malawi. Malar J. 2014;12:416.
30. Manh BH, Clements ACA, Thieu NQ, Hung NM, Hung LX, Hay SI, et al. Social and environmental determinants of malaria in space and time in Viet Nam. Int J Parasitol. 2011;41(1):109–16.
31. Deaton A, Zaidi S. Guidelines for constructing consumption aggregates for welfare analysis; 2002. Living Standards Measurement Study Working Paper No. 135, World Bank. https://openknowledge.worldbank.org/handle/10986/14101.
32. Howe LD, Galobardes B, Matijasevich A, Gordon D, Johnston D, Onwu-jekwe O, et al. Measuring socio-economic position for epidemiological studies in low- and middle-income countries: a methods of measure-ment in epidemiology paper. Int J Epidemiol. 2012;41(3):871–86.
33. Weiss DJ, Mappin B, Dalrymple U, Bhatt S, Cameron E, Hay SI, et al. Re-exam-ining environmental correlates of Plasmodium falciparum malaria endemic-ity: a data-intensive variable selection approach. Malar J. 2015;14:68.
34. GADM. GADM database of Global Administrative Areas; 2015. [online, accessed 1 October 2015]. http://www.gadm.org/.
35. Parmanto B, Paramita MV, Sugiantara W, Pramana G, Scotch M, Burke DS. Spatial and multidimensional visualization of Indonesia’s village health statistics. Int J Health Geogr. 2008;7:30.
36. Alegana VA, Wright JA, Nahzat SM, Butt W, Sediqi AW, Habib N, et al. Modelling the incidence of Plasmodium vivax and Plasmodium falciparum malaria in Afghanistan 2006–2009. PLoS ONE. 2014;9(7):e102304.
37. CDC. Ecology of Malaria; 2015. Centers for Disease Control and Preven-tion [online, accessed 18 November 2015]. http://www.cdc.gov/malaria/about/biology/ecology.html.
38. Ernst KC, Lindblade KA, Koech D, Sumba PO, Kuwuor DO, John CC, et al. Environmental, socio-demographic and behavioural determinants of malaria risk in the western Kenyan highlands: a case–control study. Trop Med Int Health. 2009;14(10):1258–65.
39. Stresman GH. Beyond temperature and precipitation: ecological risk fac-tors that modify malaria transmission. Acta Trop. 2010;116(3):167–72.
40. Mmbando BP, Kamugisha ML, Lusingu JP, Francis F, Ishengoma DS, Theander TG, et al. Spatial variation and socio-economic determinants of Plasmodium falciparum infection in northeastern Tanzania. Malar J. 2011;10:145.
41. Haque U, Soares Magalhães RJ, Mitra D, Kolivras KN, Schmidt WP, Haque R, et al. The role of age, ethnicity and environmental factors in modulating malaria risk in Rajasthali, Bangladesh. Malar J. 2011;10:367.
42. Ingstad B, Munthali AC, Braathen SH, Grut L. The evil circle of poverty: a qualitative study of malaria and disability. Malar J. 2012;11:15.
43. WHO. Global Report for Research on Infectious Diseases of Poverty; 2012. World Health Organization. http://www.who.int/tdr/publications/global_report/en/.
44. Opeskin B. Malaria in Pacific populations: seen but not heard? J Popul Res. 2009;26(2):175–99.
45. Mendis K, Sina BJ, Marchesini P, Carter R. The neglected burden of Plas-modium vivax malaria. Am J Trop Med Hyg. 2001;64(1S):97–106.
46. Guthmann JP, Llanos-Cuentas A, Palacios A, Hal AJ. Environmental factors as determinants of malaria risk. A descriptive study on the northern coast of Peru. Trop Med Int Health. 2002;7(6):518–25.

Page 15 of 15Hanandita and Tampubolon Int J Health Geogr (2016) 15:13
• We accept pre-submission inquiries
• Our selector tool helps you to find the most relevant journal
• We provide round the clock customer support
• Convenient online submission
• Thorough peer review
• Inclusion in PubMed and all major indexing services
• Maximum visibility for your research
Submit your manuscript atwww.biomedcentral.com/submit
Submit your next manuscript to BioMed Central and we will help you at every step:
47. Haque U, Soares Magalhães RJ, Reid HL, Clements ACA, Ahmed SM, Islam A, et al. Spatial prediction of malaria prevalence in an endemic area of Bangladesh. Malar J. 2010;9:120.
48. Chirombo J, Lowe R, Kazembe L. Using structured additive regression models to estimate risk factors of malaria: analysis of 2010 Malawi malaria indicator survey data. PLoS ONE. 2014;9(7):e101116.
49. Sonko ST, Jaiteh M, Jafali J, Jarju LBS, D’Alessandro U, Camara A, et al. Does socio-economic status explain the differentials in malaria parasite prevalence? Evidence from the Gambia. Malar J. 2014;13:449.
50. Yadav K, Dhiman S, Rabha B, Saikia PK, Veer V. Socio-economic determi-nants for malaria transmission risk in an endemic primary health centre in Assam, India. Infect Dis Poverty. 2014;3:19.
51. Gelman A, Hill J. Data analysis using regression and multilevel/hierarchi-cal models. Analytical methods for social research. New York: Cambridge University Press; 2007.
52. Kruschke JK. Doing bayesian data analysis: a tutorial with R and BUGS. Oxford: Academic Press; 2010.
53. Lawson AB. Bayesian disease mapping: hierarchical modeling in spatial epidemiology, 2nd edn. Interdisciplinary statistics Series. Boca Raton: CRC Press; 2013.
54. Basáñez MG, Marshall C, Carabin H, Gyorkos T, Joseph L. Bayesian statistics for parasitologists. Trends Parasitol. 2004;20(2):85–91.
55. Clements ACA, Lwambo NJS, Blair L, Nyandindi U, Kaatano G, Kinung’hi S, et al. Bayesian spatial analysis and disease mapping: tools to enhance planning and implementation of a schistosomiasis control programme in Tanzania. Trop Med Int Health. 2006;11(4):490–503.
56. Magalhães RJS, Clements ACA, Patil AP, Gething PW, Brooker S. The applications of model-based geostatistics in helminth epidemiology and control. Adv Parasitol. 2011;74:267–96.
57. Thomson MC, Connor SJ, D’Alessandro U, Rowlingson B, Diggle P, Cress-well M, et al. Predicting malaria infection in Gambian children from satel-lite data and bed net use surveys: the importance of spatial correlation in the interpretation of results. Am J Trop Med Hyg. 1999;61(1):2–8.
58. Goldstein H. Multilevel statistical models, 4th edn. Wiley series in prob-ability and statistics. Sussex: Wiley; 2011.
59. Jones K. Do multilevel models ever give different results? n.d. Multilevel models: An introduction and FAQs, Centre for Multilevel Modelling, University of Bristol [online, accessed 18 November 2015]. http://www.bristol.ac.uk/cmm/learning/multilevel-models/.
60. Besag J, York J, Mollié A. Bayesian image restoration, with two applica-tions in spatial statistics. Ann Inst Stat Math. 1991;43(1):1–20.
61. Bivand RS, Pebesma EJ, Gómez-Rubio V. Applied spatial data analysis with R. Use R!. New York: Springer; 2008.
62. Kazembe LN. Spatial modelling and risk factors of malaria incidence in northern Malawi. Acta Trop. 2007;102(2):126–37.
63. O’Meara WP, Platt A, Naanyu V, Cole D, Ndege S. Spatial autocorrelation in uptake of antenatal care and relationship to individual, household and village-level factors: results from a community-based survey of pregnant women in six districts in western Kenya. Int J Health Geogr. 2013;12:55.
64. Kandala NB, Fahrmeir L, Klasen S, Priebe J. Geo-additive models of child-hood undernutrition in three sub-Saharan African countries. Popul Space Place. 2009;15(5):461–73.
65. Kazembe LN. An additive regression model for investigating the relation-ship between childhood health and socio-economic status. Spat Spatio-temporal Epidemiol. 2013;6:71–84.
66. Best N, Richardson S, Thomson A. A comparison of Bayesian spatial mod-els for disease mapping. Stat Methods Med Res. 2005;14:35–59.
67. Kauermann G, Haupt H, Kaufmann N. A hitchhiker’s view on spa-tial statistics and spatial econometrics for lattice data. Stat Model. 2012;12(5):419–40.
68. Lunn D, Jackson C, Best N, Thomas A, Spiegelhalter D. The BUGS book: a practical introduction to bayesian analysis. Boca Raton: CRC Press; 2012.
69. Pascutto C, Wakefield JC, Best NG, Richardson S, Bernardinelli L, Staines A, et al. Statistical issues in the analysis of disease mapping data. Stat Med. 2000;19(17–18):2493–519.
70. Bivand RS, Gómez-Rubio V, Rue H. Spatial data analysis with R-INLA with some extensions. J Stat Softw. 2015;63(20):1–31.
71. Blangiardo M, Cameletti M. Spatial and spatio-temporal bayesian models with R-INLA. Chichester: Wiley; 2015.
72. Martino S, Rue H. Case studies in Bayesian computation using INLA. In: Mantovan P, Secchi P, editors. Complex data modeling and computa-tionally intensive statistical methods. Contributions to statistics. Milan: Springer; 2010. p. 99–114.
73. Schrödle B, Held L. A primer on disease mapping and ecological regres-sion using INLA. Comput Stat. 2011;26(2):241–58.
74. Spiegelhalter DJ, Best NG, Carlin BP, Linde AVD. Bayesian meas-ures of model complexity and fit. J R Stat Soc Ser B Stat Methodol. 2002;64(4):583–639.
75. Richardson S, Thomson A, Best N, Elliott P. Interpreting posterior relative risk estimates in disease-mapping studies. Environ Health Perspect. 2004;112(9):1016–25.
76. Resosudarmo BP, Mollet JA, Raya UR, Kaiwai H. Development in Papua after special autonomy. In: Hill H, editor. Regional dynamics in a decen-tralized Indonesia. Singapore: ISEAS Publishing; 2014. p. 433–59.
77. Elyazar IRF, Hay SI, Baird JK. Malaria distribution, prevalence, drug resist-ance and control in Indonesia. Adv Parasitol. 2011;74:41–175.
78. Ricci F. Social implications of malaria and their relationships with poverty. Mediterr J Hematol Infect Dis. 2012;4(1):e2012048.
79. Baird JK, Basri H, Weina P, Maguire JD, Barcus MJ, Picarema H, et al. Adult Javanese migrants to Indonesian Papua at high risk of severe disease caused by malaria. Epidemiol Infect. 2003;131:791–7.
80. Hanandita W, Tampubolon G. Does reporting behaviour bias the measurement of social inequalities in self-rated health in Indonesia? An anchoring vignette analysis. Qual Res. 2015; (Online First):1–13. doi:10.1007/s11136-015-1152-y.
81. Sen A. Health: perception versus observation. BMJ. 2002;324(7342):860–1. 82. Somi MF, Butler JR, Vahid F, Njau JD, Kachur SP, Abdulla S. Use of proxy
measures in estimating socioeconomic inequalities in malaria prevalence. Trop Med Int Health. 2008;13(3):354–64.
83. Pitt MM, Rosenzweig MR, Gibbons DM. The determinants and conse-quences of the placement of government programs in Indonesia. In: van de Walle D, Nead K, editors. Public spending and the poor: theory and evidence. Maryland: John Hopkins University Press; 1995. p. 114–49.
84. Worrall E, Basu S, Hanson K. Is malaria a disease of poverty? A review of the literature. Trop Med Int Health. 2005;10(10):1047–59.
85. Allotey P, Reidpath DD, Pokhrel S. Social sciences research in neglected tropical diseases 1: the ongoing neglect in the neglected tropical dis-eases. Health Res Policy Syst. 2010;8:32.
86. Tusting LS, Willey B, Lucas H, Thompson J, Kafy HT, Smith R, et al. Socio-economic development as an intervention against malaria: a systematic review and meta-analysis. Lancet. 2013;382(9896):963–72.
87. de Castro MC, Fisher MG. Is malaria illness among young children a cause or a consequence of low socioeconomic status? evidence from the united Republic of Tanzania. Malar J. 2012;11:161.
88. Alkire S, Foster J. Counting and multidimensional poverty measurement. J Pub Econ. 2011;95(7–8):476–87.