Embed Size (px)
Citation preview
Jamie Evans & Katie Cross (July 2021)
Personal Finance Research Centre (PFRC) University of Bristol
THE GEOGRAPHY OF GAMBLING
PREMISES IN BRITAIN
Summary:
Nearly three-quarters of consumers say that they would not want gambling premises on their ‘ideal’ high street,
and there are concerns from those with lived experience of gambling harms that such venues “prey on those
that can’t afford it and have taken over streets in rundown areas and towns”. With the UK Government’s
commitment to ‘level-up’ the country, it is therefore important to understand the geography of gambling
premises throughout Britain and the extent to which it matches other types of geographical inequalities between
areas.
The Gambling Commission reports that as of March 2020 there were still over 10,000 gambling premises in
Britain – more than the number of stores (9,968) run by the eight largest supermarket chains in the country.
This report introduces various academic and grey literature on the geography of gambling premises and also
presents new analyses of gambling licensing data from local authorities. We find that:
• A long-running trend of gambling premises being more common in deprived areas persists in Britain. As
of November 2020, 21% of gambling premises were based within the most deprived decile of areas in
the country, compared to just 2% in the least deprived decile. By way of comparison, just 10% of
supermarkets were located in the most deprived decile and 7% were in the least deprived decile.
• The relationship with deprivation is stronger for ‘family entertainment centres’ (FECs, also commonly
called ‘amusement arcades’) – with 34% of such venues located in the most deprived decile. Bingo
venues and adult gaming centres (AGCs) also have a strong relationship with deprivation, while it is
slightly weaker (but still significant) for casinos and betting shops.
• Seaside towns continue to have a close relationship with gambling. Coastal areas are home to nearly
three-quarters (72%) of FECs, with all of the top ten places with the most FECs being well-known seaside
resorts. In comparison, 29% of AGCs, 25% of bingo venues, 18% of casinos and just 10% of betting shops
are located in coastal places.
• There are a range of instances of gambling premises being located in close proximity to potentially
vulnerable populations. For example, of the 348 gambling treatment centres we were able to map, 20%
had gambling premises within a 100m radius, while 50% had one within a 250m radius. Meanwhile nearly
10% (2,221 of 23,729) of schools in England (as of 2019) had a gambling premise within a 250m radius
(approximately a five-minute walk) of the school’s postcode – affecting approximately 742,000 school
pupils (out of 8.2 million).
While local authorities cannot currently decline a premises licence based solely on the view that there are already
too many in the area, there are various examples across the country of local authorities which have introduced
policies to restrict gambling premises where there is evidence that it may harm vulnerable populations. A recent
House of Lords select committee report meanwhile argues that the Gambling Act should be amended to give
licensing committees deciding upon gambling licences similar powers to those available to them when deciding
licences related to the sale of alcohol.
2
1. Introduction
While online gambling has grown at pace in recent years, ‘land-based’ gambling remains a key part
of the industry. In 2019-20, gambling at land-based venues accounted for nearly half (44%) of the
industry’s £10.2 billion gross gambling yield in Britain (excluding lotteries) (Gambling Commission,
2020).
Despite a decline in numbers in recent years, the Gambling Commission report that there were still
more than 10,000 licensed gambling premises in Great Britain as of March 2020. By way of
comparison, this is more than the number of stores (9,968) run by the eight largest supermarket
chains in Britain (in terms of market share).1
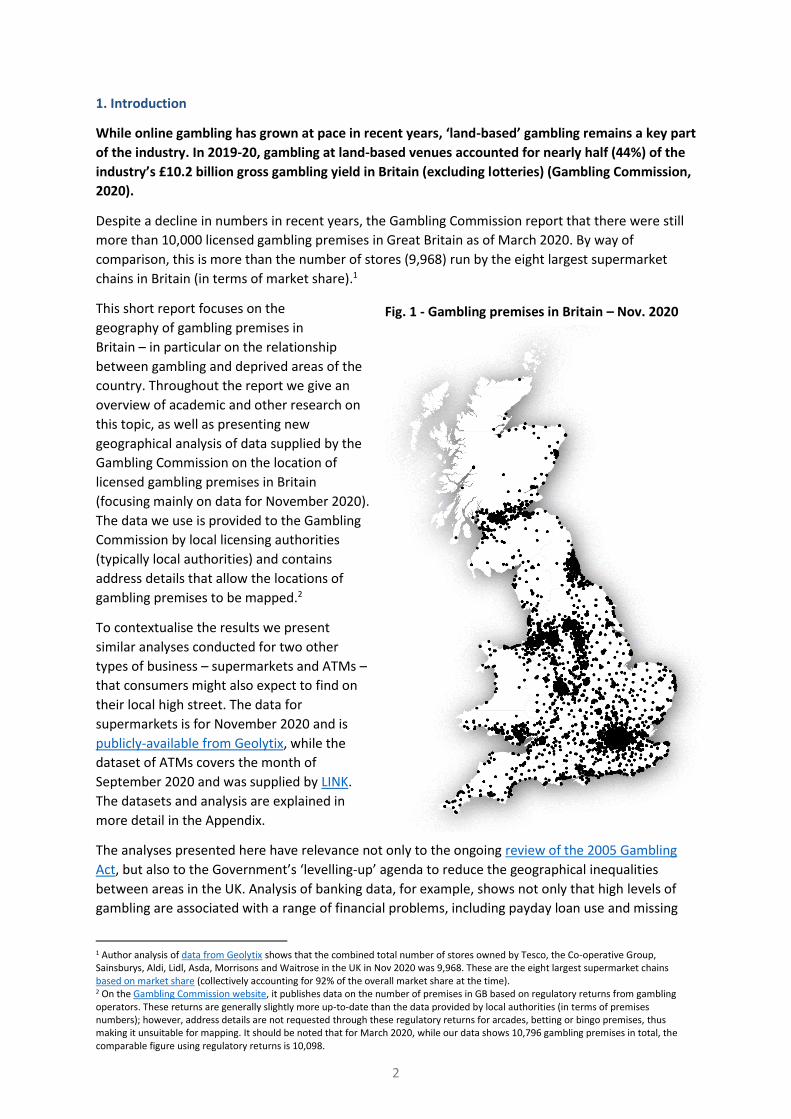
This short report focuses on the
geography of gambling premises in
Britain – in particular on the relationship
between gambling and deprived areas of the
country. Throughout the report we give an
overview of academic and other research on
this topic, as well as presenting new
geographical analysis of data supplied by the
Gambling Commission on the location of
licensed gambling premises in Britain
(focusing mainly on data for November 2020).
The data we use is provided to the Gambling
Commission by local licensing authorities
(typically local authorities) and contains
address details that allow the locations of
gambling premises to be mapped.2
To contextualise the results we present
similar analyses conducted for two other
types of business – supermarkets and ATMs –
that consumers might also expect to find on
their local high street. The data for
supermarkets is for November 2020 and is
publicly-available from Geolytix, while the
dataset of ATMs covers the month of
September 2020 and was supplied by LINK.
The datasets and analysis are explained in
more detail in the Appendix.
The analyses presented here have relevance not only to the ongoing review of the 2005 Gambling
Act, but also to the Government’s ‘levelling-up’ agenda to reduce the geographical inequalities
between areas in the UK. Analysis of banking data, for example, shows not only that high levels of
gambling are associated with a range of financial problems, including payday loan use and missing
1 Author analysis of data from Geolytix shows that the combined total number of stores owned by Tesco, the Co-operative Group, Sainsburys, Aldi, Lidl, Asda, Morrisons and Waitrose in the UK in Nov 2020 was 9,968. These are the eight largest supermarket chains based on market share (collectively accounting for 92% of the overall market share at the time). 2 On the Gambling Commission website, it publishes data on the number of premises in GB based on regulatory returns from gambling operators. These returns are generally slightly more up-to-date than the data provided by local authorities (in terms of premises numbers); however, address details are not requested through these regulatory returns for arcades, betting or bingo premises, thus making it unsuitable for mapping. It should be noted that for March 2020, while our data shows 10,796 gambling premises in total, the comparable figure using regulatory returns is 10,098.
Fig. 1 - Gambling premises in Britain – Nov. 2020
THE GEOGRAPHY OF GAMBLING PREMISES IN BRITAIN, 2018-2020
3
mortgage payments, but also that harm happens even at relatively low levels of gambling
(Muggleton et al., 2021).
2. The geography of gambling premises
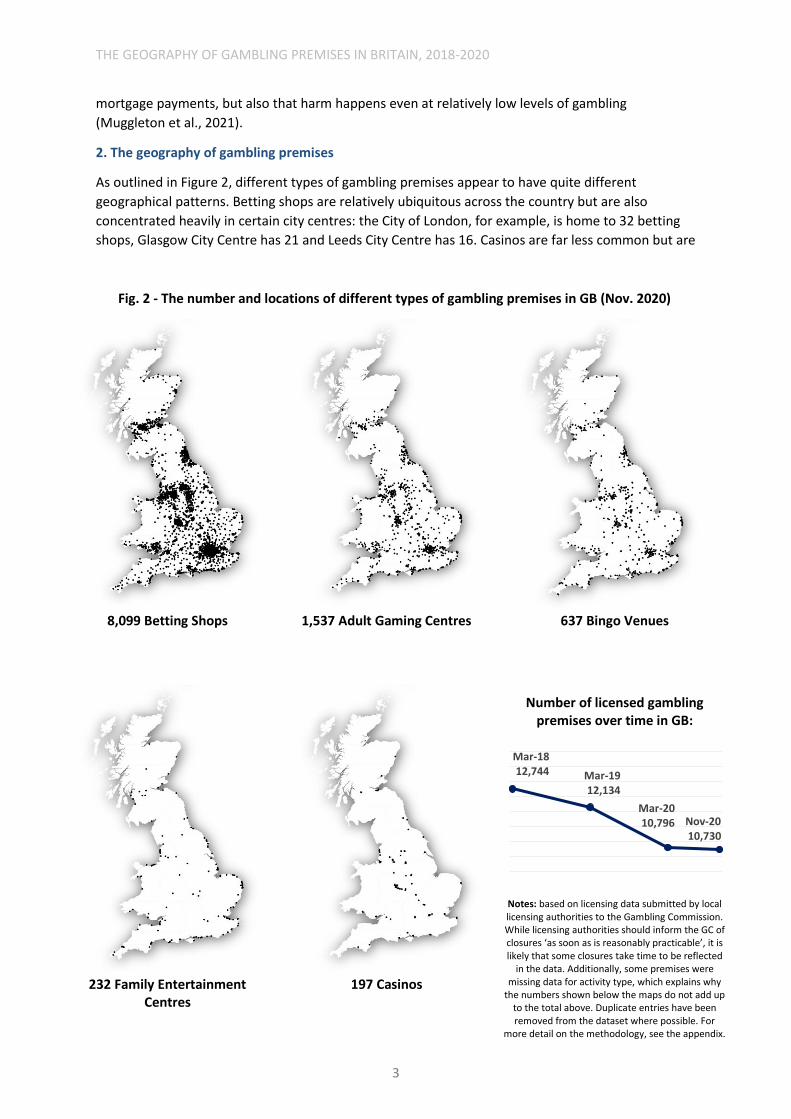
As outlined in Figure 2, different types of gambling premises appear to have quite different
geographical patterns. Betting shops are relatively ubiquitous across the country but are also
concentrated heavily in certain city centres: the City of London, for example, is home to 32 betting
shops, Glasgow City Centre has 21 and Leeds City Centre has 16. Casinos are far less common but are
Fig. 2 - The number and locations of different types of gambling premises in GB (Nov. 2020)
8,099 Betting Shops
1,537 Adult Gaming Centres 637 Bingo Venues
Number of licensed gambling premises over time in GB:
Notes: based on licensing data submitted by local licensing authorities to the Gambling Commission. While licensing authorities should inform the GC of closures ‘as soon as is reasonably practicable’, it is likely that some closures take time to be reflected
in the data. Additionally, some premises were missing data for activity type, which explains why
the numbers shown below the maps do not add up to the total above. Duplicate entries have been removed from the dataset where possible. For
more detail on the methodology, see the appendix.
232 Family Entertainment Centres
197 Casinos
Mar-1812,744 Mar-19
12,134
Mar-2010,796 Nov-20
10,730
THE GEOGRAPHY OF GAMBLING PREMISES IN BRITAIN, 2018-2020
4
also more apparent in larger city centres, while Adult Gaming Centres (AGCs) and bingo venues tend
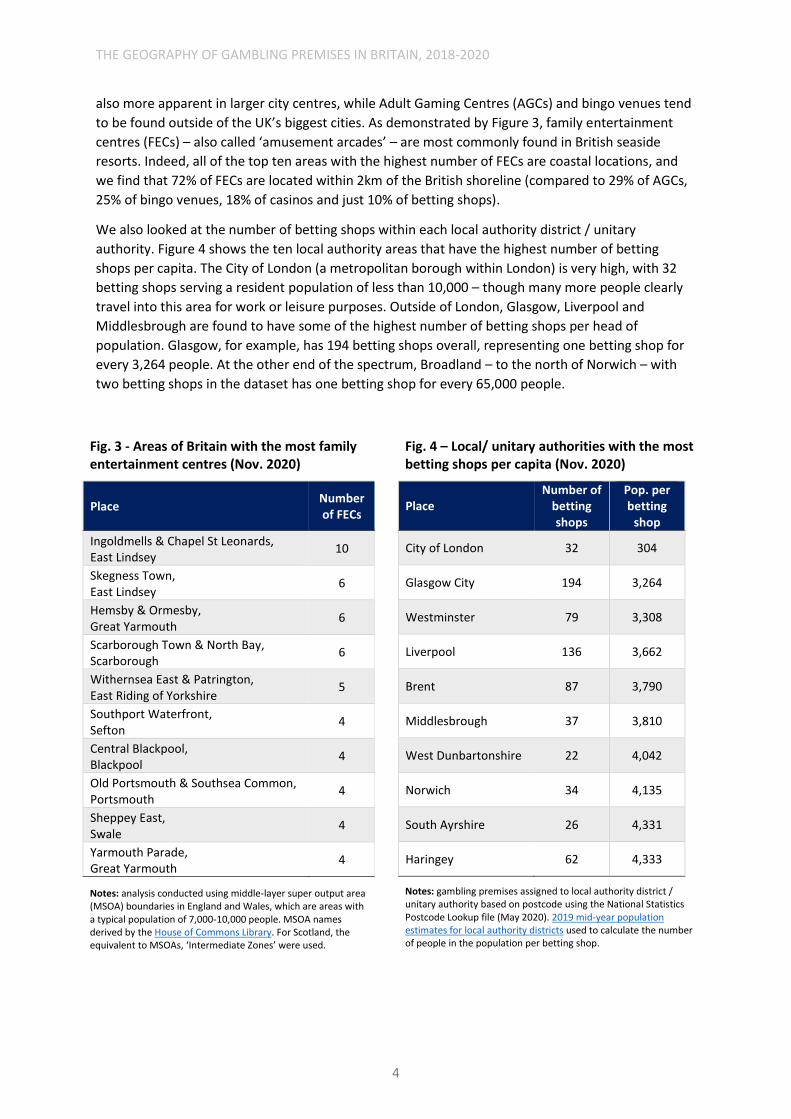
to be found outside of the UK’s biggest cities. As demonstrated by Figure 3, family entertainment
centres (FECs) – also called ‘amusement arcades’ – are most commonly found in British seaside
resorts. Indeed, all of the top ten areas with the highest number of FECs are coastal locations, and
we find that 72% of FECs are located within 2km of the British shoreline (compared to 29% of AGCs,
25% of bingo venues, 18% of casinos and just 10% of betting shops).
We also looked at the number of betting shops within each local authority district / unitary
authority. Figure 4 shows the ten local authority areas that have the highest number of betting
shops per capita. The City of London (a metropolitan borough within London) is very high, with 32
betting shops serving a resident population of less than 10,000 – though many more people clearly
travel into this area for work or leisure purposes. Outside of London, Glasgow, Liverpool and
Middlesbrough are found to have some of the highest number of betting shops per head of
population. Glasgow, for example, has 194 betting shops overall, representing one betting shop for
every 3,264 people. At the other end of the spectrum, Broadland – to the north of Norwich – with
two betting shops in the dataset has one betting shop for every 65,000 people.
Fig. 3 - Areas of Britain with the most family entertainment centres (Nov. 2020)
Place Number of FECs
Ingoldmells & Chapel St Leonards, East Lindsey
10
Skegness Town, East Lindsey
6
Hemsby & Ormesby, Great Yarmouth
6
Scarborough Town & North Bay, Scarborough
6
Withernsea East & Patrington, East Riding of Yorkshire
5
Southport Waterfront, Sefton
4
Central Blackpool, Blackpool
4
Old Portsmouth & Southsea Common, Portsmouth
4
Sheppey East, Swale
4
Yarmouth Parade, Great Yarmouth
4
Notes: analysis conducted using middle-layer super output area (MSOA) boundaries in England and Wales, which are areas with a typical population of 7,000-10,000 people. MSOA names derived by the House of Commons Library. For Scotland, the equivalent to MSOAs, ‘Intermediate Zones’ were used.
Fig. 4 – Local/ unitary authorities with the most betting shops per capita (Nov. 2020)
Place Number of
betting shops
Pop. per betting
shop
City of London 32 304
Glasgow City 194 3,264
Westminster 79 3,308
Liverpool 136 3,662
Brent 87 3,790
Middlesbrough 37 3,810
West Dunbartonshire 22 4,042
Norwich 34 4,135
South Ayrshire 26 4,331
Haringey 62 4,333
Notes: gambling premises assigned to local authority district / unitary authority based on postcode using the National Statistics Postcode Lookup file (May 2020). 2019 mid-year population estimates for local authority districts used to calculate the number of people in the population per betting shop.
THE GEOGRAPHY OF GAMBLING PREMISES IN BRITAIN, 2018-2020
5
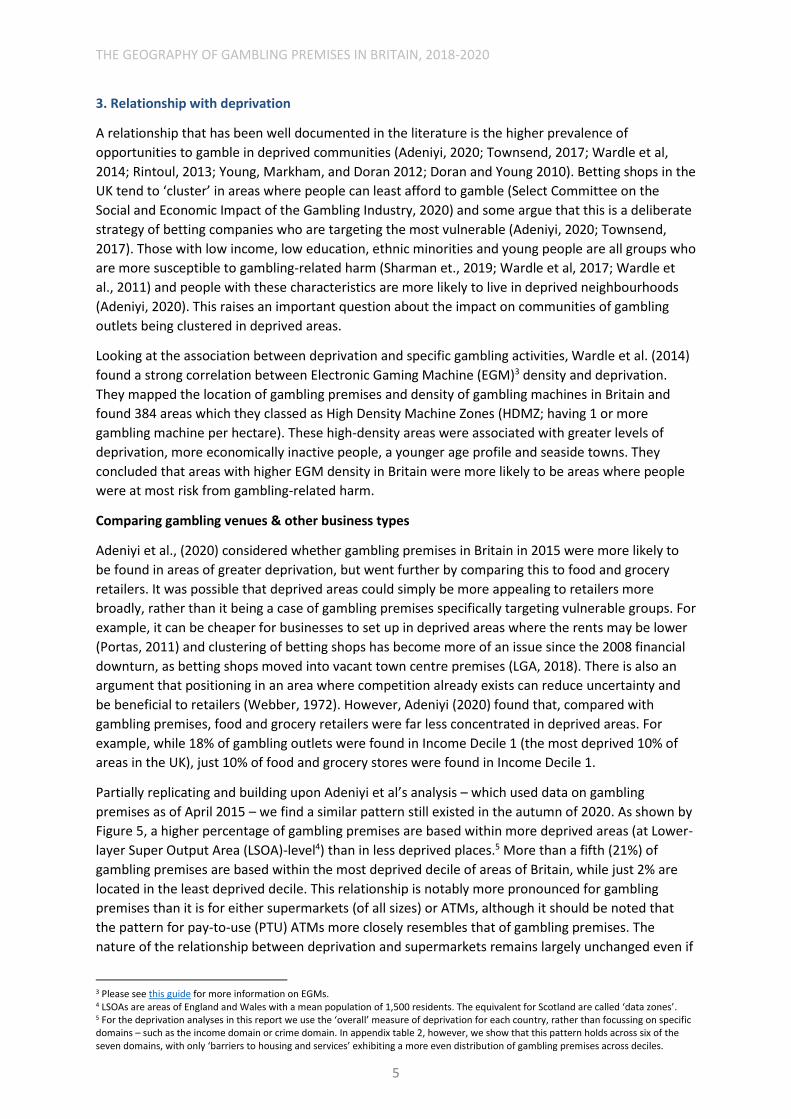
3. Relationship with deprivation
A relationship that has been well documented in the literature is the higher prevalence of
opportunities to gamble in deprived communities (Adeniyi, 2020; Townsend, 2017; Wardle et al,
2014; Rintoul, 2013; Young, Markham, and Doran 2012; Doran and Young 2010). Betting shops in the
UK tend to ‘cluster’ in areas where people can least afford to gamble (Select Committee on the
Social and Economic Impact of the Gambling Industry, 2020) and some argue that this is a deliberate
strategy of betting companies who are targeting the most vulnerable (Adeniyi, 2020; Townsend,
2017). Those with low income, low education, ethnic minorities and young people are all groups who
are more susceptible to gambling-related harm (Sharman et., 2019; Wardle et al, 2017; Wardle et
al., 2011) and people with these characteristics are more likely to live in deprived neighbourhoods
(Adeniyi, 2020). This raises an important question about the impact on communities of gambling
outlets being clustered in deprived areas.
Looking at the association between deprivation and specific gambling activities, Wardle et al. (2014)
found a strong correlation between Electronic Gaming Machine (EGM)3 density and deprivation.
They mapped the location of gambling premises and density of gambling machines in Britain and
found 384 areas which they classed as High Density Machine Zones (HDMZ; having 1 or more
gambling machine per hectare). These high-density areas were associated with greater levels of
deprivation, more economically inactive people, a younger age profile and seaside towns. They
concluded that areas with higher EGM density in Britain were more likely to be areas where people
were at most risk from gambling-related harm.
Comparing gambling venues & other business types
Adeniyi et al., (2020) considered whether gambling premises in Britain in 2015 were more likely to
be found in areas of greater deprivation, but went further by comparing this to food and grocery
retailers. It was possible that deprived areas could simply be more appealing to retailers more
broadly, rather than it being a case of gambling premises specifically targeting vulnerable groups. For
example, it can be cheaper for businesses to set up in deprived areas where the rents may be lower
(Portas, 2011) and clustering of betting shops has become more of an issue since the 2008 financial
downturn, as betting shops moved into vacant town centre premises (LGA, 2018). There is also an
argument that positioning in an area where competition already exists can reduce uncertainty and
be beneficial to retailers (Webber, 1972). However, Adeniyi (2020) found that, compared with
gambling premises, food and grocery retailers were far less concentrated in deprived areas. For
example, while 18% of gambling outlets were found in Income Decile 1 (the most deprived 10% of
areas in the UK), just 10% of food and grocery stores were found in Income Decile 1.
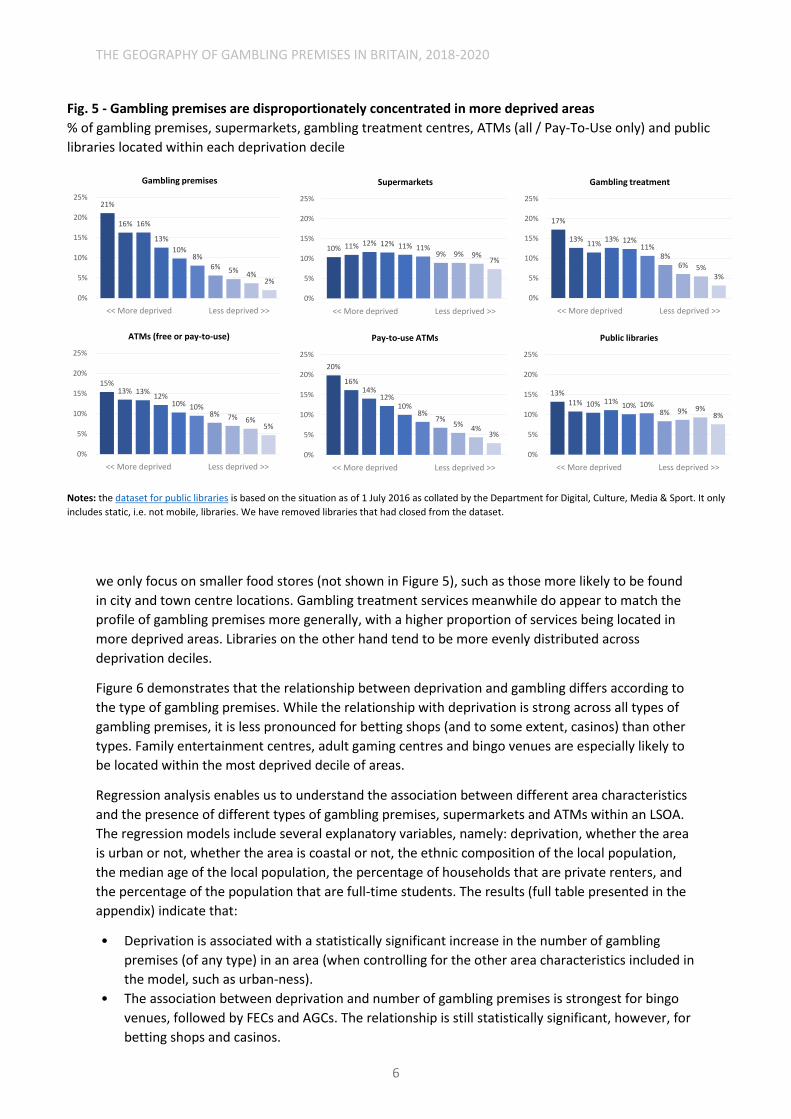
Partially replicating and building upon Adeniyi et al’s analysis – which used data on gambling
premises as of April 2015 – we find a similar pattern still existed in the autumn of 2020. As shown by
Figure 5, a higher percentage of gambling premises are based within more deprived areas (at Lower-
layer Super Output Area (LSOA)-level4) than in less deprived places.5 More than a fifth (21%) of
gambling premises are based within the most deprived decile of areas of Britain, while just 2% are
located in the least deprived decile. This relationship is notably more pronounced for gambling
premises than it is for either supermarkets (of all sizes) or ATMs, although it should be noted that
the pattern for pay-to-use (PTU) ATMs more closely resembles that of gambling premises. The
nature of the relationship between deprivation and supermarkets remains largely unchanged even if
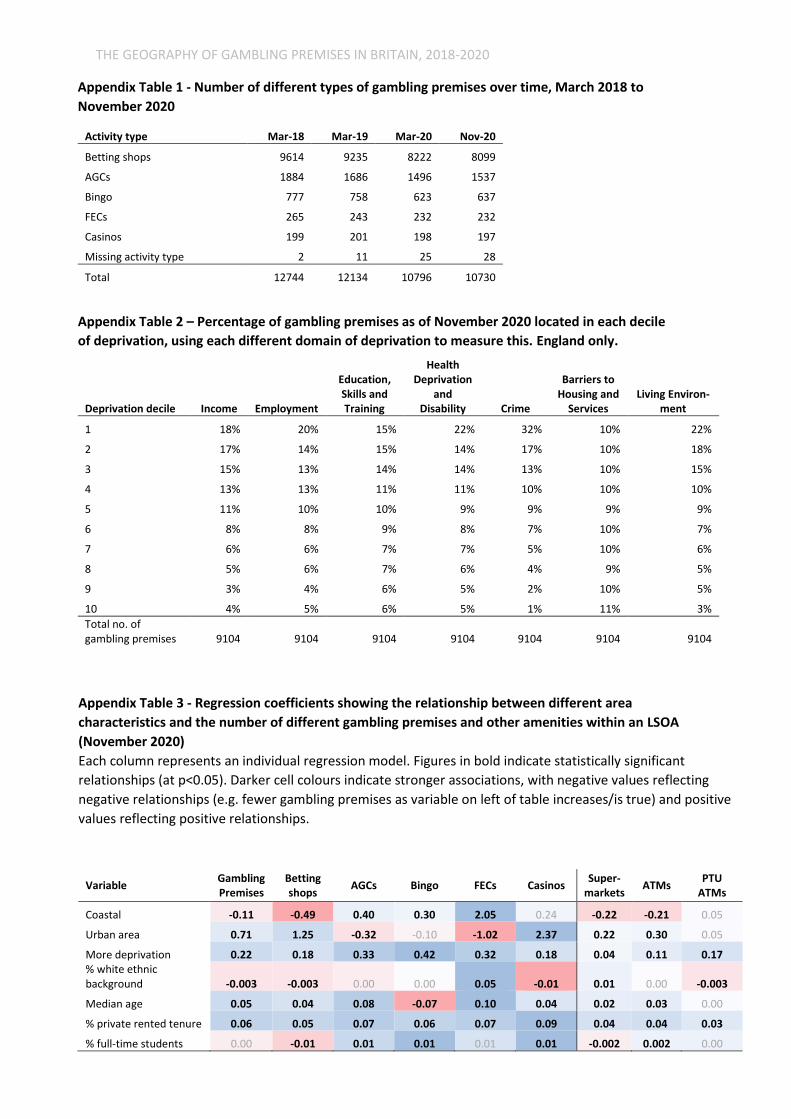
3 Please see this guide for more information on EGMs. 4 LSOAs are areas of England and Wales with a mean population of 1,500 residents. The equivalent for Scotland are called ‘data zones’. 5 For the deprivation analyses in this report we use the ‘overall’ measure of deprivation for each country, rather than focussing on specific domains – such as the income domain or crime domain. In appendix table 2, however, we show that this pattern holds across six of the seven domains, with only ‘barriers to housing and services’ exhibiting a more even distribution of gambling premises across deciles.
THE GEOGRAPHY OF GAMBLING PREMISES IN BRITAIN, 2018-2020
6
we only focus on smaller food stores (not shown in Figure 5), such as those more likely to be found
in city and town centre locations. Gambling treatment services meanwhile do appear to match the
profile of gambling premises more generally, with a higher proportion of services being located in
more deprived areas. Libraries on the other hand tend to be more evenly distributed across
deprivation deciles.
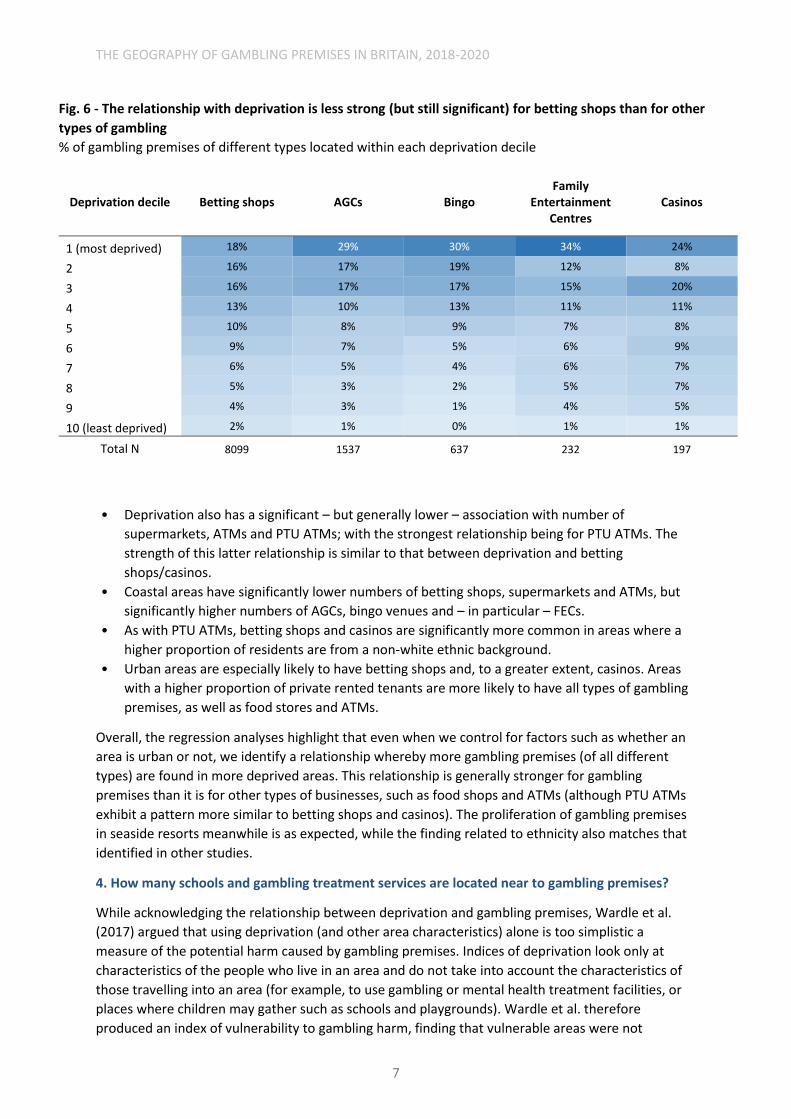
Figure 6 demonstrates that the relationship between deprivation and gambling differs according to
the type of gambling premises. While the relationship with deprivation is strong across all types of
gambling premises, it is less pronounced for betting shops (and to some extent, casinos) than other
types. Family entertainment centres, adult gaming centres and bingo venues are especially likely to
be located within the most deprived decile of areas.
Regression analysis enables us to understand the association between different area characteristics
and the presence of different types of gambling premises, supermarkets and ATMs within an LSOA.
The regression models include several explanatory variables, namely: deprivation, whether the area
is urban or not, whether the area is coastal or not, the ethnic composition of the local population,
the median age of the local population, the percentage of households that are private renters, and
the percentage of the population that are full-time students. The results (full table presented in the
appendix) indicate that:
• Deprivation is associated with a statistically significant increase in the number of gambling
premises (of any type) in an area (when controlling for the other area characteristics included in
the model, such as urban-ness).
• The association between deprivation and number of gambling premises is strongest for bingo
venues, followed by FECs and AGCs. The relationship is still statistically significant, however, for
betting shops and casinos.
Fig. 5 - Gambling premises are disproportionately concentrated in more deprived areas
% of gambling premises, supermarkets, gambling treatment centres, ATMs (all / Pay-To-Use only) and public
libraries located within each deprivation decile
Notes: the dataset for public libraries is based on the situation as of 1 July 2016 as collated by the Department for Digital, Culture, Media & Sport. It only
includes static, i.e. not mobile, libraries. We have removed libraries that had closed from the dataset.
13%11% 10% 11%
10% 10%8% 9% 9%
8%
0%
5%
10%
15%
20%
25%
<< More deprived Less deprived >>
Public libraries
20%
16%14%
12%10%
8%7%
5%4%
3%
0%
5%
10%
15%
20%
25%
<< More deprived Less deprived >>
Pay-to-use ATMs
15%13% 13%
12%10% 10%
8% 7% 6%5%
0%
5%
10%
15%
20%
25%
<< More deprived Less deprived >>
ATMs (free or pay-to-use)
17%
13%11%
13% 12%11%
8%6% 5%
3%
0%
5%
10%
15%
20%
25%
<< More deprived Less deprived >>
Gambling treatment
10% 11% 12% 12% 11% 11%9% 9% 9%
7%
0%
5%
10%
15%
20%
25%
<< More deprived Less deprived >>
Supermarkets
21%
16% 16%
13%
10%8%
6% 5%4%
2%
0%
5%
10%
15%
20%
25%
<< More deprived Less deprived >>
Gambling premises
THE GEOGRAPHY OF GAMBLING PREMISES IN BRITAIN, 2018-2020
7
• Deprivation also has a significant – but generally lower – association with number of
supermarkets, ATMs and PTU ATMs; with the strongest relationship being for PTU ATMs. The
strength of this latter relationship is similar to that between deprivation and betting
shops/casinos.
• Coastal areas have significantly lower numbers of betting shops, supermarkets and ATMs, but
significantly higher numbers of AGCs, bingo venues and – in particular – FECs.
• As with PTU ATMs, betting shops and casinos are significantly more common in areas where a
higher proportion of residents are from a non-white ethnic background.
• Urban areas are especially likely to have betting shops and, to a greater extent, casinos. Areas
with a higher proportion of private rented tenants are more likely to have all types of gambling
premises, as well as food stores and ATMs.
Overall, the regression analyses highlight that even when we control for factors such as whether an
area is urban or not, we identify a relationship whereby more gambling premises (of all different
types) are found in more deprived areas. This relationship is generally stronger for gambling
premises than it is for other types of businesses, such as food shops and ATMs (although PTU ATMs
exhibit a pattern more similar to betting shops and casinos). The proliferation of gambling premises
in seaside resorts meanwhile is as expected, while the finding related to ethnicity also matches that
identified in other studies.
4. How many schools and gambling treatment services are located near to gambling premises?
While acknowledging the relationship between deprivation and gambling premises, Wardle et al.
(2017) argued that using deprivation (and other area characteristics) alone is too simplistic a
measure of the potential harm caused by gambling premises. Indices of deprivation look only at
characteristics of the people who live in an area and do not take into account the characteristics of
those travelling into an area (for example, to use gambling or mental health treatment facilities, or
places where children may gather such as schools and playgrounds). Wardle et al. therefore
produced an index of vulnerability to gambling harm, finding that vulnerable areas were not
Fig. 6 - The relationship with deprivation is less strong (but still significant) for betting shops than for other
types of gambling
% of gambling premises of different types located within each deprivation decile
Deprivation decile Betting shops AGCs Bingo Family
Entertainment Centres
Casinos
1 (most deprived) 18% 29% 30% 34% 24%
2 16% 17% 19% 12% 8%
3 16% 17% 17% 15% 20%
4 13% 10% 13% 11% 11%
5 10% 8% 9% 7% 8%
6 9% 7% 5% 6% 9%
7 6% 5% 4% 6% 7%
8 5% 3% 2% 5% 7%
9 4% 3% 1% 4% 5%
10 (least deprived) 2% 1% 0% 1% 1%
Total N 8099 1537 637 232 197
THE GEOGRAPHY OF GAMBLING PREMISES IN BRITAIN, 2018-2020
8
necessarily always the most deprived. Some affluent areas, for example, had gambling treatment
services that would also attract groups who may be vulnerable to gambling harm. As such, they
suggest that the placement of gambling premises in these areas may be problematic.
Using geographical information systems (GIS), we therefore measured the distance (as the crow
flies) from schools and gambling treatment services to the nearest gambling premises. This is based
on their postcode, rather than exact coordinates; therefore, measurements will not be fully precise
(postcodes in the UK on average are home to around 15 properties).
Using data for England only, we find that 2,221 of 23,729 schools (as of 2019) had at least one
gambling outlet within 250m of the school’s postcode (approximately a five-minute walk for a child).
This means that approximately 742,000 pupils (out of 8.2 million) are within a five-minute walk from
at least one gambling outlet when they are at school. In addition, 292 schools (with a combined total
of 86,000 pupils) had three or more gambling premises within the same distance – 206 of these
schools are primary schools.
Of the 348 local gambling treatment services in Britain that we were able to map, 68 (20%) were
within 100m (as the crow flies) of a gambling outlet; while 173 (50%) were within 250m.
5. More gambling premises = more harm?
Understanding the spatial patterns of gambling outlets is important as the literature suggests that
living closer to gambling outlets, or in an area with a higher density of gambling opportunities, can
be associated with an increase in gambling behaviour and gambling related harm (St-Pierre et al.
2014; Rush et al. 2007; Pearce et al. 2008; Welte et al. 2009).
Pearce et al. (2008), for example, found that people living close to gambling venues (less than 0.7km
away) were twice as likely to be ‘problem gamblers’ than individuals living further from venues
(more than 3.1km away). Welte et al., (2009) found that for young people in particular (aged 18-21),
the likelihood of encountering gambling problems, as opposed to never gambling, increased by 39%
for each additional form of gambling operator located within their local area. Astbury and Wardle
(2016) showed that people living close to a concentration of Licensed Betting Offices (LBOs) had
higher rates of problem gambling. They highlighted that the concentration of LBOs was an important
factor when it came to differences in gambling behaviour, even more so than a simple count of
outlets near to a player’s home.
Ofori Dei et al (2021) examined the impact of both actual exposure to casinos and slot machines in
the local area and also perceived exposure, i.e. whether individuals believed there were too many
gambling outlets in their area or an acceptable level. Their analysis (of survey data from Canada in
2008/09) indicated that actual exposure was significantly associated with problem gambling risk,
while perceived exposure was connected to problem gambling severity. Based on this, the authors
concluded that “problem gambling can be reduced by placing restrictions on gambling venue
locations and advertising.”
However, not all the literature suggests an association between geographical accessibility and
disordered gambling behaviour (St-Pierre et al. 2014). For example, a study in Canada showed that
while there was a rise in problem gambling one year after a casino opened in Quebec, after
following up two and four years later this increase was no longer identifiable (Jacques & Ladouceur,
2006). It has been argued that the impact of geographical accessibility on problem gambling may
plateau over time as a community adapts (Abbott, 2006). Where studies have found a relationship
between accessibility and harm, the strength of the findings vary. It has therefore been suggested
that the relationship between geographical accessibility and gambling-related harm is multi-faceted
THE GEOGRAPHY OF GAMBLING PREMISES IN BRITAIN, 2018-2020
9
and accessibility needs to take into account wider environmental factors that could moderate the
relationship (St-Pierre et al., 2014).
It should be noted though that the growing emphasis in recent years on online gambling means that
there is arguably now a lack of up-to-date literature on the impact of geographical accessibility on
gambling harms in Britain. As we discuss in the final section, there may therefore be a need to
explore this impact in greater detail, with newer forms of data (such as bank transaction data)
offering interesting possibilities for such analysis.
6. Do consumers and local businesses want gambling premises on their high street?
The clustering of betting shops in one location can indicate that an area is underperforming (HHD,
2019; RSPH, 2015) and there are arguments that they make areas less desirable: for people to live in,
visit and for businesses to invest in (Portas, 2011).
For over a decade there has been a focus on how to bring back life to high streets, which have
struggled since the 2008 financial crisis, the rise in online retail, and other factors – most recently
the coronavirus pandemic – which changed the way that people shop and businesses operate
(Portas, 2011). It has been argued that the rise in vacant premises has led to an increase in clustering
of gambling outlets in town centres (LGA, 2018), as ‘low-quality’ retailers such as betting shops and
pawnbrokers tend to thrive in locations with low rents in which other retailers do not perform well
(HDH, 2019). By improving these poorly performing high streets, that concentrate in deprived areas,
it could encourage a greater diversity of shops and facilities and therefore help improve the physical
and mental health outcomes for those who live in the community (PHE, 2018).
The Harper Dennis Hobbs Vitality Index scores retail centres based on their ‘retail health’ (HHD,
2019). It looks at a combination of factors, including the level of upmarket shops, vacancy rates and
the proportion of ‘low-quality’ retail operators such as pawnbrokers, money lenders and
bookmakers. In response to the 2019 rankings, Jonathan De Mello, Head of Retail Consultancy at
Harper Dennis Hobbs, said: “The changing face of the high street means retailers need to be
confident their investment is likely to pay off. Quality retailers don’t want to be surrounded by
empty units, discount stores and betting shops, which are a clear indicator of deprivation in the
area” (HDH, 2019b).
In 2015, the Royal Society for Public Health introduced its ‘Health on the High Street’ campaign,
which argued that high streets have an important role to play in promoting the health of residents
(RSPH, 2015). It argued that certain businesses such as fast-food outlets and betting shops can
enable and support poor health behaviours. Its research showed that over half of the UK population
(54%) believe that betting shops discourage healthy choices and over half (52%) believe they have a
negative impact on mental wellbeing. The RSPH also developed an index for rating the health of high
streets and found that unhealthy businesses cluster in areas of higher deprivation and lower life
expectancy. It argued that reshaping these high streets to be more “health promoting” is an
important part of “redressing this imbalance”. It recommended that Local Authorities be given
greater planning powers to prevent clustering of betting shops as well as limiting each type of
business on a high street to 5% to avoid oversaturation (RSPH, 2018). The same point was made by
the Portas review in 2011, which noted that too many of one type of retailer “tips the balance of the
location and inevitably puts off potential retailers and investors” (Portas, 2011).
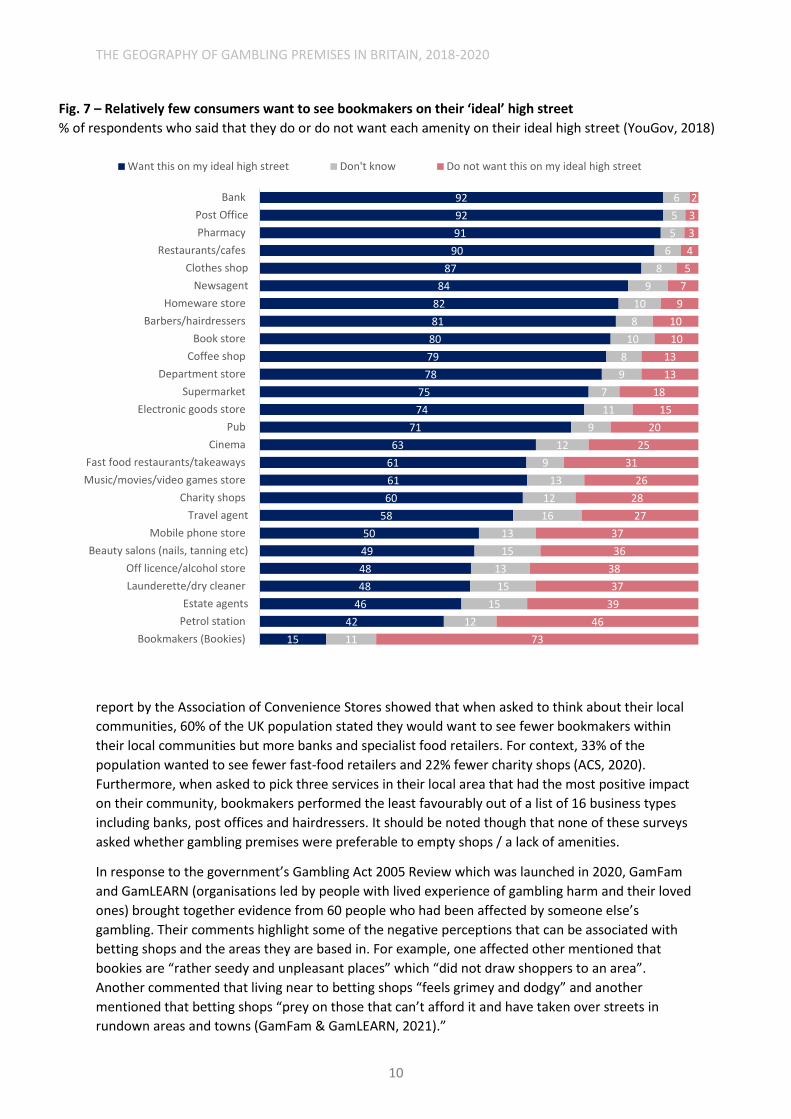
The general population also appears unenthused about the prospect of gambling premises in their
local area. For example, a YouGov survey showed that 73% of the UK population would not want to
see betting shops when picturing their ‘ideal high street’ (YouGov, 2018). As shown in Figure 7,
betting shops performed much less favourably compared to all other businesses listed. Similarly, a
THE GEOGRAPHY OF GAMBLING PREMISES IN BRITAIN, 2018-2020
10
report by the Association of Convenience Stores showed that when asked to think about their local
communities, 60% of the UK population stated they would want to see fewer bookmakers within
their local communities but more banks and specialist food retailers. For context, 33% of the
population wanted to see fewer fast-food retailers and 22% fewer charity shops (ACS, 2020).
Furthermore, when asked to pick three services in their local area that had the most positive impact
on their community, bookmakers performed the least favourably out of a list of 16 business types
including banks, post offices and hairdressers. It should be noted though that none of these surveys
asked whether gambling premises were preferable to empty shops / a lack of amenities.
In response to the government’s Gambling Act 2005 Review which was launched in 2020, GamFam
and GamLEARN (organisations led by people with lived experience of gambling harm and their loved
ones) brought together evidence from 60 people who had been affected by someone else’s
gambling. Their comments highlight some of the negative perceptions that can be associated with
betting shops and the areas they are based in. For example, one affected other mentioned that
bookies are “rather seedy and unpleasant places” which “did not draw shoppers to an area”.
Another commented that living near to betting shops “feels grimey and dodgy” and another
mentioned that betting shops “prey on those that can’t afford it and have taken over streets in
rundown areas and towns (GamFam & GamLEARN, 2021).”
Fig. 7 – Relatively few consumers want to see bookmakers on their ‘ideal’ high street
% of respondents who said that they do or do not want each amenity on their ideal high street (YouGov, 2018)
92
92
91
90
87
84
82
81
80
79
78
75
74
71
63
61
61
60
58
50
49
48
48
46
42
15
6
5
5
6
8
9
10
8
10
8
9
7
11
9
12
9
13
12
16
13
15
13
15
15
12
11
2
3
3
4
5
7
9
10
10
13
13
18
15
20
25
31
26
28
27
37
36
38
37
39
46
73
Bank
Post Office
Pharmacy
Restaurants/cafes
Clothes shop
Newsagent
Homeware store
Barbers/hairdressers
Book store
Coffee shop
Department store
Supermarket
Electronic goods store
Pub
Cinema
Fast food restaurants/takeaways
Music/movies/video games store
Charity shops
Travel agent
Mobile phone store
Beauty salons (nails, tanning etc)
Off licence/alcohol store
Launderette/dry cleaner
Estate agents
Petrol station
Bookmakers (Bookies)
Want this on my ideal high street Don't know Do not want this on my ideal high street
THE GEOGRAPHY OF GAMBLING PREMISES IN BRITAIN, 2018-2020
11
7. What are local authorities doing about this?
As highlighted above, the evidence shows that clustering of betting shops is not generally not
considered desirable by local residents and may promote unhealthy choices within an area.
However, under the Gambling Act 2005 there is often little that local authorities can do to prevent
this and many have felt frustrated at their lack of control over clustering of certain gambling
premises (LGA, 2018). Under the current Act (part 8; 153) local authorities are required to “aim to
permit” the use of a premises for gambling if they are consistent with the licencing objectives. These
are:
• Preventing gambling from being a source of crime or disorder, being associated with crime or
disorder or being used to support crime.
• Ensuring that gambling is conducted in a fair and open way.
• Protecting children and other vulnerable persons from being harmed or exploited by gambling.
Currently, local authorities cannot decline a premises licence based on the expected demand for the
facilities (Gambling Act, 2005), meaning they cannot argue solely that there are already too many in
the area or are not wanted by the community.
Proliferation of betting shops or other types of gambling premises is not in itself a reason to decline
a premises licence. However, it can be relevant if a new premises could increase harm to vulnerable
persons. For example, Westminster City Council was able to refuse a premises licence in an area
which already had multiple premises, by demonstrating a new betting shop would be a high risk to
those vulnerable to gambling harm (LGA, 2018). It highlighted for example that the location in
question had several hostels for the homeless (Citizens Advice Westminster, 2014).
Similarly, Tower Hamlets Council has adopted a gambling policy which restricts opening of new
gambling premises near schools, hospitals, resident homes for the elderly and near any venues
where a Gamblers Anonymous meeting is held (Tower Hamlets, 2019). It states it will take the local
area profile into account and will pay particular attention to applications where the proximity of the
premises to vulnerable groups is likely to present a risk to the third licencing objective of consumer
protection. This highlights the importance of establishing an evidence base, knowing the
characteristics of the local area and what impact a premise could have on those vulnerable to harm.
Several councils have developed initiatives and conducted area-specific research to better
understand gambling harm locally. For example, Sheffield City Council has provided a detailed
understanding of gambling-related harm within its Joint Strategic Needs Assessment (Sheffield City
Council, 2019), which aims to improve the health and wellbeing of the local community (Department
of Health, 2012). It highlighted that areas in Sheffield with higher student populations and those
with greater deprivation have higher gambling prevalence rates. Further examples of local initiatives
can be found in the Gambling Commission’s Local Authority Toolkit (Gambling Commission, no date)
and provide a range of ways that local authorities are growing their evidence base to help
understand and reduce gambling harm within their local areas.
Some councils have included specific gambling strategies within their local plans. For example,
Newham Council received Planning Inspectorate approval for a cumulative impact approach
(Newham Council, 2015). It can restrict the number of betting shops and fast-food outlets being
located within typical walking distance of one another (400m radius) and aims for 67% of the leisure
use in town centres being ‘quality leisure’ (excluding betting shops and takeaways). It did this by
providing a strong evidence base and looking at the impact that clustering of these types of
businesses has on its vulnerable residents and viability of town centres.
THE GEOGRAPHY OF GAMBLING PREMISES IN BRITAIN, 2018-2020
12
Despite there being examples of evidence and policy being used by local authorities to prevent
clustering of gambling premises, it still remains difficult to challenge a license application. Even
where there are objections, applications are likely to be successful under the current framework
(RSPH, 2021). As part of the 2005 Gambling Act Review (Department for Digital, Culture, Media &
Sport, 2020), the government has asked for evidence about whether local authorities have enough
powers to fulfil their responsibilities in respect to licensing (see question 43). A House of Lords select
committee has therefore argued that “The Act should be amended to give licensing committees the
same powers as they already have when deciding on the licensing of premises for the sale of
alcohol” (House of Lords Select Committee on the Social and Economic Impact of the Gambling
Industry, 2020). It argues that local authorities should be able to decide where a betting shop is
located based on what is good for the community as a whole.
8. Further research
Gambling is complex and what works for one community might not work for another when it comes
to reducing gambling-related harm. If greater powers did exist to prevent the overall number or
location of gambling premises, many questions would remain. For example:
• If the number or location of gambling premises were restricted:
o What could happen to the empty premises, would these remain vacant and reduce the
economic viability of an area?
o Would there be a greater shift to online gambling?
• What impact might Covid have? There has been a steady decline in the number of betting shops
for the last six years and the closure of premises during the pandemic will likely exacerbate this
further (Gambling Commission, 2020). It will be important to look at which premises remain
after the pandemic and where these are in relation to vulnerable groups e.g., deprived areas or
those with younger populations.
• How could this interact with other policies? For example, the government is also looking for
evidence relating to whether they should increase the number of machines allowed in casinos
(DCMS, 2020; see Q41). If the number of premises reduced but at the same time the number of
machines increased in larger venues, could the overall access to gambling in a community
remain the same? What impact would fewer venues with more machines have on the local area
and gambling related harm?
It is unknown what impact preventing a new gambling outlet or restricting clustering of premises
could have on reducing gambling harm, especially if several policies were introduced in conjunction.
What is clear is that local authorities are well-placed to understand their local area, the type of
people that live there and what their local community needs to thrive, both economically and
regarding the health of residents.
Furthermore, evidence is essential when assessing the needs of communities. Local authorities and
the wider public health community would benefit if more data were made available on factors such
as local gambling spend and the prevalence of gambling harms at different geographical scales.
GambleAware, for example, has recently published maps indicating the severity of gambling harms
and demand for gambling treatment services across the country at local authority and ward-level
(GambleAware, 2021); there would be merit in analysing this data together with the premises data
given in this report.
Clearly, gambling operators are also well-placed to provide useful data on gambling spend/harms
and could do so under a similar scheme to that via which banks disclose lending data at postcode
sector level. In Australia for example, much richer data is available on gambling spend. Each state is
required to collect information on gambling which is then collated at a national level to produce the
THE GEOGRAPHY OF GAMBLING PREMISES IN BRITAIN, 2018-2020
13
annual Australian Gambling Statistics report (Queensland Government Statistician's Office, 2021).
The state of Victoria publish data in relation to gambling expenditure, at venue and Local
Government Area level (Victorian Commission for Gambling and Liquor Regulation, no date), which
has enabled analysis into how spend compares with local area characteristics such as deprivation
(Rintoul, et al 2013). See here for more information on the level of data available in Australia.
Likewise, bank transaction data (as utilised by Muggleton et al. (2021)) could provide detailed, cross-
operator data on card-based gambling spend within local areas or be used to assess the impact on
consumers’ gambling behaviour in various situations (for example, if a local gambling premise is
closed do customers switch to online gambling or continue to gamble at a land-based venue
elsewhere?). Such information would be invaluable for understanding how to prevent gambling
harm and where best to focus resources.
Reference List
Abbott M, Volberg RA. Gambling and
pathological gambling: growth industry and
growth pathology of the 1990’s. Community
Mental Health in New Zealand1996;9:22–31.
Adeniyi, O., Brown, A., Whysall, P., (2020).
‘Retail location preferences: A comparative
analysis’, Journal of Retailing and Consumer
Services, 55.
https://doi.org/10.1016/j.jretconser.2020.102
146
Association of Convenience Stores, (2019).
‘Community Barometer 2019’, personal
communication for additional data not
published.
Astbury G, Wardle H. (2016). ‘Examining the
effect of proximity and concentration of B2
machines to gambling play’. London (UK):
Responsible Gambling Trust.
Citizens Advice Westminster (2014). ‘New
betting shop licence refused in Westminster’
Department for Business Innovation & Skills,
(2011). ‘Understanding High Street
Performance: Executive Summary’, Prepared
for the Department for Business, Innovation
and Skills by Genecon LLP and Partners.
Department for Digital, Culture, Media &
Sport, (2020). ‘Policy Paper: Review of the
Gambling Act 2005 Terms of Reference and
Call for Evidence’.
Department of Health, (2012). ‘Statutory
Guidance on Joint Strategic Needs
Assessments and Joint Health and Wellbeing
Strategies’.
Doran, B., & Young, M. (2010). ‘Predicting the
spatial distribution of gambling vulnerability:
An application of gravity modeling using ABS
Mesh Blocks’, Applied Geography, 30 (1), 141-
152.
https://doi.org/10.1016/j.apgeog.2009.04.002
GambleAware (2021) ‘GambleAware GB
Maps’.
Gambling Act, (2005).
https://www.legislation.gov.uk/ukpga/2005/1
9/contents
Gambling Commission, (no date). ‘Licensing
authority toolkit’.
Gambling Commission, (2020). ‘Gambling
Industry Statistics: April 2015 to March 2020’.
GamFam, & GamLearn, (2021). ‘#We are the
Evidence too. The views and evidence of
people with lived experience of gambling
harms: A response to the DCMS Gambling Act
Review’.
Harper Dennis Hobbs, (2019). ‘2019 Vitality
Index’.
Harper Dennis Hobbs, (2019b). ‘Cambridge
once again tops the HDH Retail Vitality
rankings’.
THE GEOGRAPHY OF GAMBLING PREMISES IN BRITAIN, 2018-2020
14
Jacques, C., & Ladouceur, R (2006). ‘A
Prospective Study of the Impact of Opening a
Casinoon Gambling Behaviours: 2- and 4-Year
Follow-Ups’, Can J Psychiatry, 51, (12).
Local Government Association, (2018).
‘Tackling gambling related harm – a whole
council approach’.
London Borough of Tower Hamlets, (2019).
Gambling Act 2005: The London Borough of
Tower Hamlets Gambling Policy 2019-2022’.
Muggleton, N., Parpart, P., Newall, P., Leake,
D., Gathergood, J. & Stewart, N. (2021) ‘The
association between gambling and financial,
social and health outcomes in big financial
data’. Nature Human Behaviour, 5: 319-326.
Newham London, (2015). ‘Newham’s Local
Plan Detailed Sites and Policies Development
Plan Document Pre-publication Draft.
Evidence Base: Cumulative Impact v2.
Pearce, J., Mason, K., Hiscock, R., & Day, P.
(2008). ‘A national study of neighbourhood
access to gambling opportunities and
individual gambling behaviour’, Journal of
Epidemiology and Community Health, 62,
862–868. doi:10.1136/jech.2007.068114
Portas, M. (2011). ‘The Portas Review: an
Independent Review into the Future of Our
High Streets’. Department for Business,
Innovation and Skills.
Public Health England, (2018). ‘Healthy High
Streets Good place-making in an urban
setting’.
Queensland Government Statistician's Office,
Queensland Treasury (2021). ‘Australian
Gambling Statistics’, Explanatory notes, 36th
edition’.
Rintoul, A. C., Livingstone, C., Jolley, D., &
Mellor, A. P. (2013). ‘Modelling vulnerability
to gambling related harm: how disadvantage
predicts gambling losses’, Addiction Research
& Theory, 21, (4).
https://doi.org/10.3109/16066359.2012.7275
07
Royal Society for Public Health, (2015), ‘Health
on the High Street 2015’.
Royal Society for Public Health, (2018).
‘Health on the High Street: Running on
Empty’.
Royal Society for Public Health, (2021). ‘How
to challenge a licence application’.
Rush, B., Veldhuizen, S., Adlaf, E. (2007).
‘Mapping the prevalence of problem
gambling and its association with treatment
accessibility and proximity to gambling
venues’, Journal of Gambling Issues 20, 193–
213. http://dx.doi.org/10.4309/jgi.2007.20.6
Select Committee on the Social and Economic
Impact of the Gambling Industry (2020).
‘Gambling Harm – Time for Action’, Authority
of the House of Lords.
Sharman, S., Butler, K., &Roberts, A. (2019).
‘Psychosocial risk factors in disordered
gambling: A descriptive systematic overview
of vulnerable populations’, Addictive
Behaviors, 99.
https://doi.org/10.1016/j.addbeh.2019.10607
1.
Sheffield City Council, (2019). ‘Gambling:
Sheffield Joint Strategic Needs Assessment’.
St-Pierre, R., A., Walker, D., M., Derevensky,
J., Gupta, R. (2014). ‘How availability and
accessibility of gambling venues influence
problem gambling: A review of the literature’.
Gaming Law Review and Economics 18, 150–
172. DOI: 10.1089/glre.2014.1824.
Townshend, T.G., (2017). ‘Toxic high streets’,
J. Urban Des. 22 (2), 167–186. https://doi.
org/10.1080/13574809.2015.1106916.
Victorian Commission for Gambling and
Liquor Regulation (no date). ‘Gaming
expenditure by venue’
Wardle, H., Keily, R., Astbury, G., & Reith, G.
(2014). 'Risky places?': mapping gambling
machine density and socio-economic
deprivation. Journal of Gambling Studies,
THE GEOGRAPHY OF GAMBLING PREMISES IN BRITAIN, 2018-2020
15
30(1), 201–212.
https://doi.org/10.1007/s10899-012-9349-2
Wardle, H., Asbury, G., & Thurstain-Goodwin,
M. (2017). ‘Mapping risk to gambling
problems: a spatial analysis of two regions in
England’, Addiction Research & Theory, 25:6,
512-524.
https://doi.org/10.1080/16066359.2017.1318
127
Webber, M.J. (1972). ‘The Impact of
Uncertainty on Location’. MIT Press,
Cambridge, MA.
Welte, J. W., Wieczorek, W. F., Barnes, G. M.,
Tidwell, M.-C.,& Hoffman, J. H. (2004). ‘The
relationship of ecological and geographic
factors to gambling behavior and pathology’,
Journal of Gambling Studies, 20, 405–423. doi:
10.1007/s10899-004-4582-y.
Smith, M., (2018). ‘Here’s what Britain’s ideal
high street looks like’, YouGov.
Young, M., Markham, F., & Doran, B. (2012).
‘Placing Bets: gambling venues and the
distribution of harm’, Australian Geographer,
43 (4), 425-444.
https://doi.org/10.1080/00049182.2012.7313
02.
Contains National Statistics data © Crown
copyright and database right 2021.
Contains public sector information licensed
under the Open Government Licence v3.0.
ATM data © LINK 2021
Appendix
Data sources
Data on the location of gambling premises was provided to the research team by the Gambling
Commission, as part of a national register of premises licences for gambling that it maintains. This
dataset is provided to the Gambling Commission by local licensing authorities, which are usually the
local authority where the premise is located. The Gambling Commission cautions that “whilst we
make every effort to assure the data, it may contain errors, duplications or there may be omissions.”
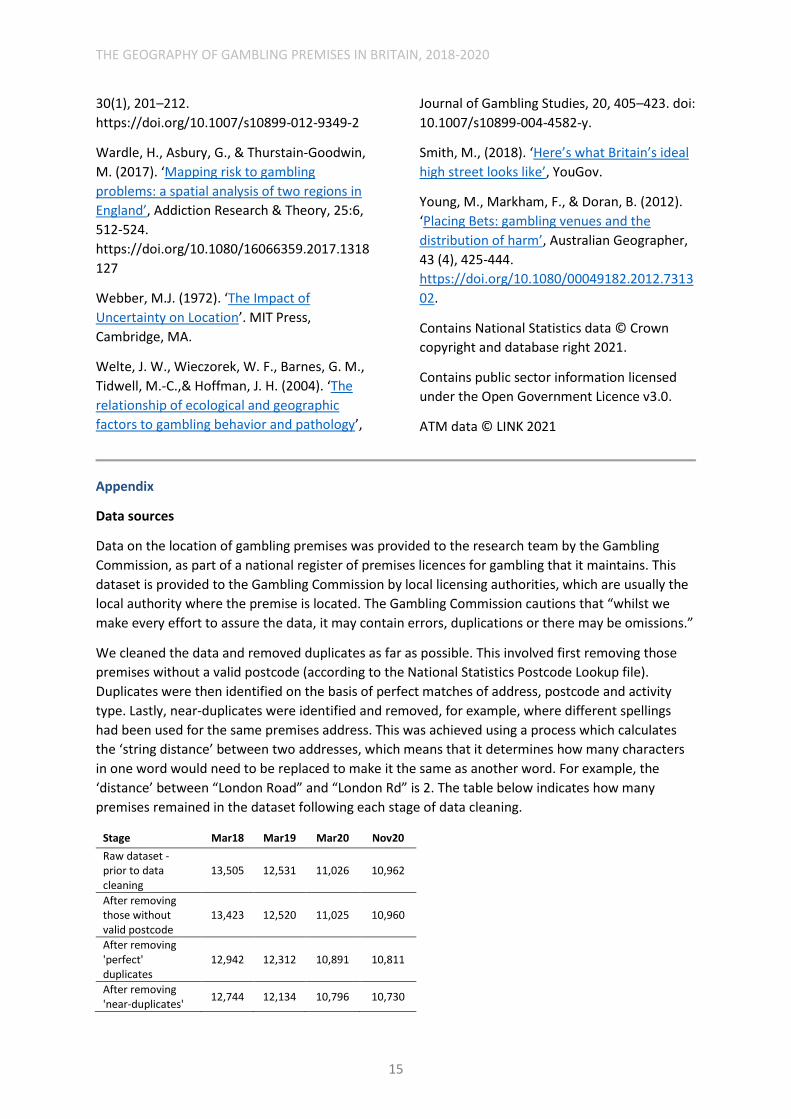
We cleaned the data and removed duplicates as far as possible. This involved first removing those
premises without a valid postcode (according to the National Statistics Postcode Lookup file).
Duplicates were then identified on the basis of perfect matches of address, postcode and activity
type. Lastly, near-duplicates were identified and removed, for example, where different spellings
had been used for the same premises address. This was achieved using a process which calculates
the ‘string distance’ between two addresses, which means that it determines how many characters
in one word would need to be replaced to make it the same as another word. For example, the
‘distance’ between “London Road” and “London Rd” is 2. The table below indicates how many
premises remained in the dataset following each stage of data cleaning.
Stage Mar18 Mar19 Mar20 Nov20
Raw dataset - prior to data cleaning
13,505 12,531 11,026 10,962
After removing those without valid postcode
13,423 12,520 11,025 10,960
After removing 'perfect' duplicates
12,942 12,312 10,891 10,811
After removing 'near-duplicates'
12,744 12,134 10,796 10,730
THE GEOGRAPHY OF GAMBLING PREMISES IN BRITAIN, 2018-2020
16
It should be noted that some premises within the dataset are those for which a licence was being
applied at the time the dataset was created. This applied to between 1,103 and 1,251 premises in
March 2018-2020 but had dropped to just 379 by November 2020. They mainly appear to be licence
re-applications for existing premises; for example, of the 1,251 ‘applications’ in the March 2020
dataset, we estimate that at least 74% of these were already gambling premises as of March 2018.
The remaining ones may be entirely new applications (which could in due course be declined). The
fact that we saw a reduction in the number of applications between March 2020 and November
2020 is likely to mean that we will see a further reduction in the number of gambling premises in
due course, as fewer premises look to be renewing their licences.
As mentioned in the report, it should also be noted that the overall number of gambling premises in
our dataset is slightly higher than published elsewhere by the Gambling Commission, using data on
regulatory returns from gambling operators. This is because licensing authorities submit licensing
data to the Gambling Commission ‘as soon as practicably possible’ but this does not always mean
that closures are reflected in the dataset immediately. However, address details are not requested
through these regulatory returns for arcades, betting or bingo premises, thus making it unsuitable
for the mapping purposes of this report. It should be noted that for March 2020, while our data
shows 10,796 gambling premises in total, the comparable figure using regulatory returns is 10,098.
The other sources of data used in these analyses are:
• Geolytix supermarket and food store dataset (for November 2020 – N=16,273): Supermarket
Retail Points | Geolytix
• ATM dataset provided by LINK (for September 2020 – N= 63,590).
• School census for England (2018-2019), collated by the Department for Education: Schools,
pupils and their characteristics: January 2019 - GOV.UK (www.gov.uk)
• Location of gambling treatment premises: from GamCare and Gamblers Anonymous. Data
for a small number of NHS clinics was also added manually to the dataset. (N=348)
• Department for Digital, Culture, Media & Sport: public libraries in England: basic dataset (as
on 1 July 2016). Libraries marked as closed and those with a postcode that wasn’t valid when
matched with the National Statistics Postcode Lookup file were removed from the analyses,
leaving a total of 3,003 libraries.
Analysis
Statistical analysis and data preparation was conducted in R. The various premises datasets were
matched to other geographical and census data based on their postcode, using the National
Statistics Postcode Lookup file (for May 2020). LSOAs were also categorised as ‘coastal’ or not, based
on GIS analysis of the distance (as the crow flies) between LSOA (or data zone in Scotland)
population weighted centre and the nearest point on the UK coastline. Those LSOAs within 2km of
the coastline were identified as being ‘coastal’.
Basic descriptive statistics and cross-tabulations were produced to explore the data, while poisson
regression was used to explore the relationship between the number of gambling premises in an
LSOA and various area/population characteristics (while controlling for other characteristics). The
results of these are shown below. Distances between premises and schools/treatment centres were
calculated using QGIS.
THE GEOGRAPHY OF GAMBLING PREMISES IN BRITAIN, 2018-2020
17
Appendix Table 3 - Regression coefficients showing the relationship between different area
characteristics and the number of different gambling premises and other amenities within an LSOA
(November 2020)
Each column represents an individual regression model. Figures in bold indicate statistically significant
relationships (at p<0.05). Darker cell colours indicate stronger associations, with negative values reflecting
negative relationships (e.g. fewer gambling premises as variable on left of table increases/is true) and positive
values reflecting positive relationships.
Variable Gambling Premises
Betting shops
AGCs Bingo FECs Casinos Super-
markets ATMs
PTU ATMs
Coastal -0.11 -0.49 0.40 0.30 2.05 0.24 -0.22 -0.21 0.05
Urban area 0.71 1.25 -0.32 -0.10 -1.02 2.37 0.22 0.30 0.05
More deprivation 0.22 0.18 0.33 0.42 0.32 0.18 0.04 0.11 0.17 % white ethnic background -0.003 -0.003 0.00 0.00 0.05 -0.01 0.01 0.00 -0.003
Median age 0.05 0.04 0.08 -0.07 0.10 0.04 0.02 0.03 0.00
% private rented tenure 0.06 0.05 0.07 0.06 0.07 0.09 0.04 0.04 0.03
% full-time students 0.00 -0.01 0.01 0.01 0.01 0.01 -0.002 0.002 0.00
Appendix Table 1 - Number of different types of gambling premises over time, March 2018 to
November 2020
Activity type Mar-18 Mar-19 Mar-20 Nov-20
Betting shops 9614 9235 8222 8099
AGCs 1884 1686 1496 1537
Bingo 777 758 623 637
FECs 265 243 232 232
Casinos 199 201 198 197
Missing activity type 2 11 25 28
Total 12744 12134 10796 10730
Appendix Table 2 – Percentage of gambling premises as of November 2020 located in each decile
of deprivation, using each different domain of deprivation to measure this. England only.
Deprivation decile Income Employment
Education, Skills and Training
Health Deprivation
and Disability Crime
Barriers to Housing and
Services Living Environ-
ment
1 18% 20% 15% 22% 32% 10% 22%
2 17% 14% 15% 14% 17% 10% 18%
3 15% 13% 14% 14% 13% 10% 15%
4 13% 13% 11% 11% 10% 10% 10%
5 11% 10% 10% 9% 9% 9% 9%
6 8% 8% 9% 8% 7% 10% 7%
7 6% 6% 7% 7% 5% 10% 6%
8 5% 6% 7% 6% 4% 9% 5%
9 3% 4% 6% 5% 2% 10% 5%
10 4% 5% 6% 5% 1% 11% 3%
Total no. of gambling premises 9104 9104 9104 9104 9104 9104 9104