Embed Size (px)
Citation preview

Geography of Homelessness
M A R C H 2 0 1 0
RESEARCH REPORTS ON HOMELESSNESS
Meghan Henry
M William Sermons

The National Alliance to End Homelessness is a non-partisan, mission-driven organiza-tion committed to preventing and ending homelessness in the United States. TheAlliance is a leading voice on the issue of homelessness. The Alliance analyzes policy anddevelops pragmatic, cost-effective policy solutions. The Alliance works collaborativelywith the public, private, and nonprofit sectors to build state and local capacity, leadingto stronger programs and policies that help communities achieve their goal of endinghomelessness. We provide data and research to policymakers and elected officials inorder to inform policy debates and educate the public and opinion leaders nationwide.
Copyright © 2010. The Homelessness Research Institute at the National Alliance to EndHomelessness.
The Homelessness Research Institute, the research and education arm of the NationalAlliance to End Homelessness, works to end homelessness by building and disseminat-ing knowledge that drives program and policy change. The goals of the Institute are tobuild the intellectual capital around solutions to homelessness; to advance data andresearch to ensure that policymakers, practitioners, and the caring public have the bestinformation about trends in homelessness and emerging solutions; and to engage themedia to ensure intelligent reporting on the issue of homelessness.

ContentsSummary 3
Introduction 4
Defining the Spectrum 4
Homelessness by Geographic Category 6
Prevalence of Homelessness 9
Examining Urban Homelessness 11
Homeless Assistance System—Bed Inventory 14
Conclusion 17
Appendix 19
Geography of Homelessness

List of FiguresFigure 1 Continua of Care by Geographic Category 5
Figure 2 Percent of Total Homelessness in 2007 by Geography 6
Figure 3 Subpopulations by Geography 7
Figure 4 Subgroups by Geographic Category 8
Figure 5 Homeless Persons per 10,000 by Geographic Category 9
Figure 6 Distribution of CoC Homeless Rates by Number of CoCs 10
Figure 7 Distribution of Urban CoCs by Type 12
Figure 8 Percentage Change in Homeless Population by Urban Type 13
Figure 9 Entire Existing Housing Inventory 15
Figure 10 Entire Inventory Under Development 17
List of TablesTable 1 CoCs in each Geographic Category 5
Table 2 Subpopulations by Geographic Category 7
Table 3 Rates of Homelessness by Urban Type per 10,000 people 14
Table 4 Bed Inventory, 2007 15
Table 5 Existing Inventory of Emergency Shelter and Transitional Housing Beds, 2007 16
2

SummaryIn 2007 there were 671,859 people experiencing homelessness on any given night.
These people were counted in big cities and small towns across the country. Previ-ously, little has been known (outside of anecdotal evidence) about how many peopleexperience homelessness in urban, rural and suburban areas. Data collected by commu-nities and reported to the Department of Housing and Urban Development (HUD) hasbeen aggregated and reported at the state or national level. In this report, for the firsttime, each community that has submitted data on homelessness has been classified intoone of five categories ranging from completely urban to completely rural. Various aspectsof the homeless population and homeless assistance system in each category have beenanalyzed to determine whether homelessness differs across disparate geographic types.This report details the findings of our analysis and provides some interesting, if some-times unexpected, differences. This report includes the following findings:
� Approximately 77 percent of the total homeless population in the U.S. was countedin areas considered completely urban; 4 percent was counted in areas consideredcompletely rural.
� Urban areas also have the highest rate of homelessness, with approximately 29homeless people per 10,000. By contrast, rural areas have a rate of less than halfthat, with 14 people experiencing homelessness per 10,000.
� In both rural and urban areas, a majority of people who are chronically homeless areunsheltered—living on the streets, in cars, abandoned buildings, and other placesnot meant for human habitation.
� The percent of persons in families with children who are unsheltered is quite low inurban areas compared to the other geographies; rural areas have almost double thepercent of unsheltered persons in families compared to urban areas.
� Cities with populations of over 500,000 people (Major Cities) account for 51 percentof the homeless population counted in urban areas, but only account for 34 percentof total population in those areas.
� Major Cities experienced an increase (4 percent) in homelessness between 2005 and2007, while all other geographic areas experienced declines; Major Cities also saw anincrease of over 13 percent in the number of homeless persons in families, while allother areas experienced significant declines.
� Major Cities have rates of homelessness that exceed those of other urban areas andare three times higher than the rates of homelessness in rural areas.
� Emergency shelter beds constitute a larger portion of the bed inventory in rural areaswhile permanent supportive housing and transitional housing make up a larger shareof the inventory in urban areas.
� In all geographic areas, there are more permanent supportive housing beds underdevelopment than any other bed type.
3

IntroductionHomelessness is commonly thought to be an urban issue, a perception that is rein-
forced by the presence of homeless people on the streets of major cities and inthe characterization of homelessness in the media. And while homelessness in urbanareas tends to be more visible, areas outside of urban centers are also affected by home-lessness. The same structural issues that cause homelessness in cities—lack of affordablehousing and low incomes—exist in rural areas and contribute to the number of peoplewho are homeless in those areas.
In recent years, there has been a growth in knowledge around the size and characteristicsof the U.S. homeless population. Data submitted by local communities to the Departmentof Housing and Urban Development (HUD) has been analyzed and incorporated into reportsproduced by the National Alliance to End Homelessness, HUD, and other organizations. Inall of these reports, data from communities of varying types and sizes—suburban towns,major cities, rural counties, and entire states—were aggregated to either the state ornational level with limited attempt to account for differences in geographic characteristics.However, a more in-depth understanding of the geography of homelessness provides addi-tional valuable insight into the scope of the homelessness problem and its solutions. Datacollected by communities are imperfect, and come with numerous limitations and caveats.These include changes in data collection methods and coverage areas, which are a particu-lar concern for both dense urban areas and expansive rural areas. However, they are thebest available data at this time with which to analyze homelessness in the United States.
Defining the SpectrumData on homelessness is reported at an administrative geography unit called a Con-
tinuum of Care (CoC) through which federal homelessness funding is awarded.CoCs range widely from single cities to entire states. This heterogeneity makes it difficultto ascertain exactly what fraction of homelessness is located in rural or urban areas. In2007, in the 50 states and the District of Columbia, there were 457 CoCs. In order to ana-lyze homelessness by geographic community type, we classified each of the CoCs basedon its urban or rural constitution into one of five categories—rural, mostly rural, urban-rural mix, mostly urban, and urban. The map in Figure 1 shows the 457 CoCs and the geo-graphic categories to which they belong. As previously stated, CoCs are often largegeographic areas made up of a combination of rural and urban counties. This report usesthe Housing Assistance Council (HAC) definitions of “urban county” and “rural county,”
41 The Housing Assistance Council Definition of Urban and Rural can be found here: http://www.ruralhome.org/dataportal/index.php?option=com_content&task=view&id=3&Itemid=5&limit=1&limitstart=1

which are a composite of the U.S. Census Bureau and the Office of Management and Bud-get definitions.1 The definitions of each category are as follows:
� “Urban” CoCs are made up of singular cities, urban counties, or regions made upentirely of urban counties.
� A CoC is considered “Rural” if it is a singular rural county or a group of counties thatis almost entirely rural in composition.
� “Mostly Urban” CoCs are those in which 80 percent or more of the counties are urbanand/or more than 80 percent of the general population resides in the urban areas ofthe CoC.
� CoCs are considered “Mostly Rural” if more than 80 percent of the counties are rural and/or more than 80 percent of the general population reside in the rural parts of the CoC.
� The “Urban-Rural Mix” CoCs are regional CoCs that are not sufficiently urban to beclassified as mostly urban and not sufficiently rural to be considered mostly rural.
The numbers of CoCs that belong to each category are outlined in Table 1 along with thepercent of CoCs in each category. Overwhelmingly, CoCs are urban, accounting for almosttwo-thirds of all CoCs. Second in number are Rural CoCs, accounting for over 16 percent.Table 1 and the map in Figure 1 show the range and level of diversity that exists among CoCs.
Figure 1 Continua of Care by Geographic Category
Table 1 CoCs in each Geographic Category
Category Number of CoCs Percent of Total CoCs
Urban 293 64.11
Rural 74 16.19
Urban-Rural Mix 48 10.50
Mostly Urban 24 5.25
Mostly Rural 18 3.945

6
Homelessness by Geographic Category
The share of the total homeless population counted within the 457 CoCs is brokendown by category and illustrated in Figure 1. The distribution of the estimated
671,859 people experiencing homelessness in the United States is overwhelmingly urbanin orientation, with almost 77 percent of people experiencing homelessness counted inUrban CoCs (see Figure 2). Together, Urban and Mostly Urban CoCs account for over 82percent of all people experiencing homelessness. Conversely, the number of people expe-riencing homelessness who were countedin Rural or Mostly Rural CoCs account foronly 7 percent of the total number ofhomeless people in the United States.
Despite the sizable majority of peopleexperiencing homelessness in urbanareas nationally, homelessness withinindividual states has a higher degree ofvariability. Statewide CoCs such asWyoming, North Dakota, South Dakota,and Montana are mostly rural in compo-sition and as such have high amounts ofrural homelessness. Additionally, in 22percent of states, over 50 percent of peo-ple experiencing homelessness wascounted in Rural or Mostly Rural CoCs. While quantifying the level of rural homelessnessis complicated by various methodological challenges, this analysis uses the best dataavailable to determine the extent of homelessness in both Urban and Rural areas.
Subgroups by Geographic Type
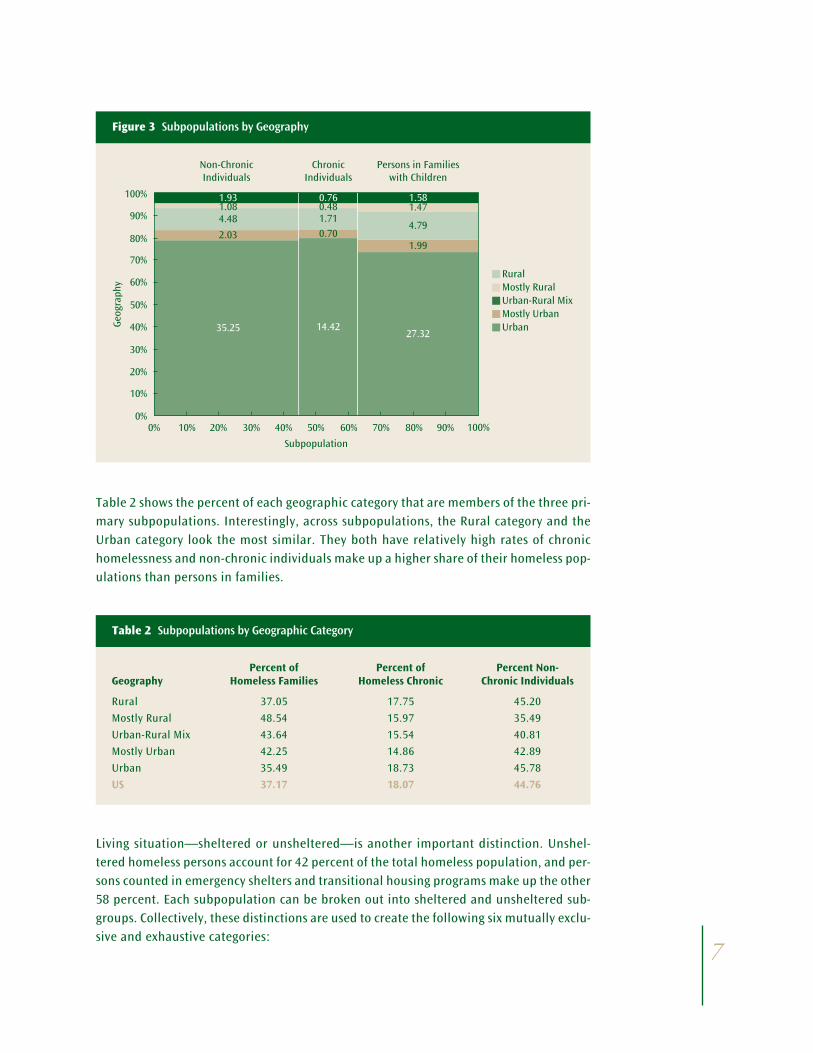
Nationally, the homeless population has three primary subpopulations: persons in fam-ilies with children, non-chronically homeless individuals, and chronically homeless indi-viduals. Persons in families with children account for 37 percent of the total homelesspopulation, chronically homeless persons account for 18 percent of the homeless popu-lation, and non-chronically homeless individuals account for the remaining 45 percent.Figure 3 below shows the distribution of the homeless population by subpopulation andgeographic category. Each block represents a share of the total homeless population inthe United States. For example, non-chronic individuals in Urban areas comprise 35.25percent of the total homeless population, while persons in families with children in Ruralareas account for only 1.58 percent of the total homeless population in the country.
Figure 2 Percent of Total Homelessnessin 2007 by Geography
Rural4.27 Urban-Rural Mix
11.04Mostly Urban5.14
Mostly Rural2.73
Urban76.82
7
Table 2 shows the percent of each geographic category that are members of the three pri-mary subpopulations. Interestingly, across subpopulations, the Rural category and theUrban category look the most similar. They both have relatively high rates of chronichomelessness and non-chronic individuals make up a higher share of their homeless pop-ulations than persons in families.
Living situation—sheltered or unsheltered—is another important distinction. Unshel-tered homeless persons account for 42 percent of the total homeless population, and per-sons counted in emergency shelters and transitional housing programs make up the other58 percent. Each subpopulation can be broken out into sheltered and unsheltered sub-groups. Collectively, these distinctions are used to create the following six mutually exclu-sive and exhaustive categories:
Figure 3 Subpopulations by Geography
100%
90%
80%
70%
60%
50%
40%
30%
20%
10%
0%0% 10% 20% 30% 40% 50%
Subpopulation
Geog
raph
y
Non-ChronicIndividuals
ChronicIndividuals
Persons in Familieswith Children
RuralMostly Rural
Mostly UrbanUrban
Urban-Rural Mix
60% 70% 80% 90% 100%
1.931.084.48
2.03
35.25
0.760.481.710.70
14.42
1.581.47
4.79
1.99
27.32
Table 2 Subpopulations by Geographic Category
Percent of Percent of Percent Non-Geography Homeless Families Homeless Chronic Chronic Individuals
Rural 37.05 17.75 45.20
Mostly Rural 48.54 15.97 35.49
Urban-Rural Mix 43.64 15.54 40.81
Mostly Urban 42.25 14.86 42.89
Urban 35.49 18.73 45.78
US 37.17 18.07 44.76

8
� Sheltered persons in families with children� Unsheltered persons in families with children � Sheltered chronically homeless individuals� Unsheltered chronically homeless individuals� Sheltered non-chronically homeless individuals� Unsheltered non-chronically homeless individuals
Figure 4 shows the geographic distribution of the six exhaustive subgroups outlined above.In each geographic category across the spectrum, persons in families and non-chronicallyhomeless individuals are the two largest subpopulations and are of similar size. In this way,each of the subpopulations is similar in geographic distribution to the total homeless pop-ulation. There are, however, three observations that stand out as noteworthy.
First, the percent of persons in families with children who are unsheltered is quite low inurban areas compared to the other four geographic categories. Rural areas have a rate ofunsheltered persons in families that is almost double that of urban areas. Second, thepercent of the chronically homeless population that is unsheltered exceeds 60 percent inall categories but one, Mostly Rural. Both Urban and Rural areas have high rates ofunsheltered chronic homelessness. While the majority of chronically homeless individu-als in most categories is unsheltered, the higher rates in the Rural and Urban categoriesis notable.
Finally, the Mostly Rural category is different from the other categories in almost everyway. Almost 50 percent of its population is persons in families with children, higher thanother categories and higher than the national rate of 37 percent. This category also hasnoticeably fewer unsheltered individuals—both non-chronically homeless and chroni-
Figure 4 Subgroups by Geographic Category
Perc
etn
of H
omel
ess
by G
eogr
aphi
c Ca
teog
ory
Non-ChronicallyHomeless
ChronicallyHomeless
Homeless Persons in Families with Children
UnshelteredSheltered
Rural
15.3
21.8
MostlyRural
16.7
31.8
Mix
18.0
25.7
MostlyUrban
16.1
26.2
Urban
8.6
26.9
Rural
18.3
26.9
MostlyRural
10.9
24.6
Mix
18.2
22.6
MostlyUrban
16.7
26.2
Urban
19.7
26.1
Rural
11.8
5.9
MostlyRural
6.2
9.7
Mix
9.6
5.9
MostlyUrban
9.2
5.7
Urban
12.6
6.10
10
20
30
40
50
60
70
80
90
100

9
cally homeless—and a higher rate of sheltered chronically homeless. The number of CoCsin this group is small (N=17) and is made up primarily of Statewide and Balance of StateCoCs. While it is unclear how, the geographic size of these CoCs (often most or all of a state)likely plays some role.
Prevalence of Homelessness
While it is unsurprising that there would be more homeless people in urban areas,the issue of prevalence is one that has been less definitive. Nationally, rural
areas have higher rates of poverty, deep poverty, and unemployment, factors commonlyassociated with homelessness.2 In this section, we take a closer look at CoCs to examinehow rates of homelessness in Rural CoCs compare to those in Urban areas. To do this, wecalculated rates of homelessness for each CoC using 2007 homelessness counts (the lastyear for which comprehensive data are available), and U.S. Census data.
Collectively, Urban CoCs have the highest rate of homelessness, with approximately 29people per 10,000. Mostly Urban CoCs rank second with a rate of 19 homeless people per10,000, and Rural areas fall third with 14 people per 10,000 (see Figure 5).
2 Homeless Assistance Council, Poverty in Rural America. June, 2006.
Figure 5 Homeless Persons per 10,000 by Geographic Category
Hom
eles
s Pe
rson
s pe
r 10
,000
Rural
Geography
Urban-RuralMix
Mostly RuralUrban Mostly Urban
29
19
1412
8
0
5
10
15
20
25
30
35

10
There are some Rural CoCs with very high rates of homelessness, and two of the highest ratesin the country belong to Rural CoCs (see Appendix A). However, the rates of homelessnesswithin the Rural category vary widely (wider than any other category), and as a group, RuralCoCs have a rate of only half that of Urban CoCs. There are a number of explanations for theobserved rate of homelessness being lower than what might have been expected: manyextremely poor people in rural areas do not stay in shelters but rather double-up with fam-ily or friends or live in substandard housing, and many leave rural areas in search ofincreased employment opportunities and homeless services. While rural areas certainlyhave poverty to contend with—1 in 5 rural counties have rates of poverty over 20 percent—homelessness as HUD defines it is less prevalent in these areas than in urban areas.3
Overall Distribution of CoCs by Rate of Homelessness
We found that the rates of homelessness in the United States vary widely, from less than1 person per 10,000 to over 216 people per 10,000. Figure 6 shows the distribution of CoCsby their rate of homelessness. While there is a wide distribution, most CoCs (91 percent)have rates of fewer than 50 persons per 10,000, and almost one-third had rates between10 and 20 people per 10,000.
Continua of Care with Highest Rates of Homelessness
Though the mean rate of homelessness is just under 23 persons per 10,000, there are anumber of CoCs with very high rates—the ten highest have rates between 96 and 216 peo-
3 http://www.ers.usda.gov/briefing/IncomePovertyWelfare/ruralpoverty/
Figure 6 Distribution of CoC Homeless Rates by Number of CoCs
Homeless Persons per 10,000
Num
ber
of C
oCs
0.00
Mean = 22.3948N = 457
0
10
15
20
25
100
20.00 40.00 60.00 80.00 100.00 >120.00

ple per 10,000 (see Appendix A). While 7 out of 10 of the highest rates of homelessnessare Urban, only 3 are big cities. Detroit, MI has the highest rate of homelessness in theUnited States, with over 216 people per 10,000. Mendocino County, CA and MonroeCounty, FL, both Rural CoCs, follow at second and third with 161 people per 10,000 and147 homeless people per 10,000 respectively. Appendices A and B outline the CoCs withthe highest rates of homelessness as well as the CoCs with the highest numbers of home-less people. Detroit, MI is the only CoC to appear in both tables.
Examining UrbanHomelessness
As stated earlier, a majority of people experiencing homelessness are experiencingit in urban areas. Approximately 77 percent of the U.S. homeless population in
2007 was counted in places considered completely urban, and over 60 percent of thehomeless population was living in metropolitan areas of greater than 1,000,000 people.Because of this heavy urban bias, trends in homelessness nationally largely reflect trendsin urban homelessness. However, closer examination of urban homelessness revealsinteresting variation among urban places, particularly when comparing major cities toother urban areas.
There is much variation in size, density and overall urban character of CoCs within theUrban category. It includes big cities like New York City, with over 8 million residents,suburban communities like Fairfax County, VA and small communities like Amarillo,Texas, with less than 200,000 residents. In this section, we examine homelessness withinthe Urban category by further categorizing the 295 Urban CoCs into smaller and morehomogeneous groups and comparing homeless population size, rates of homelessness,and changes across these urban geographic types.
To determine the type of urban area we used criteria similar to that used by the EconomicResearch Service at the U.S Department of Agriculture to develop the Rural-Urban Con-tinuum Codes.4 We categorized each Urban CoC into one of four categories: Major City,Major Metropolitan Statistical Areas (MSA), Large MSA, and Small MSA. Appendix C pro-vides the definition of each category and examples of CoCs in each category.
The distribution of Urban CoCs by type is shown in Figure 7. Overwhelmingly, the UrbanCoCs are located within Major MSAs (n = 130) or Large MSAs (n=101). Major Cities and CoCsin Small MSAs represent only a small share of the total number of Urban CoCs (n = 33 and31, respectively).
114 http://www.ers.usda.gov/Briefing/Rurality/RuralUrbCon/

12
Homeless Population by Urban Geographic Type
As shown in Figure 7, there is a direct correlation between how urban a category is andthe percent of urban homelessness in that category. As CoCs decrease in population size,the share of the urban homeless population counted in those CoCs declines as well. MajorCities account for over half (51 percent) of the urban homeless population, followed byMajor MSAs (29 percent), Large MSAs (17 percent, and finally, the least urban category,Small MSAs (2.7 percent).
Interestingly, the distribution of the urban homeless population is not reflective of thedistribution of the total urban population. Though Large and Small MSAs account for sim-ilar shares of the total urban population (20 and 2.7 percent, respectively) as they do ofthe urban homeless population, this is not the case for the two more urban categories.While accounting for over half of the urban homeless population, Major Cities accountfor just one-third of the total urban population.5 Conversely, Major MSAs comprise alarger share (43 percent) of the total urban population than they do the urban homelesspopulation. This indicates that the higher level of homelessness, in Major Cities particu-larly, is not completely accounted for by population size.
Population Change between 2005 and 2007
Between 2005 and 2007, the United States population grew by 4.5 percent.6 The total pop-ulation of the 295 Urban CoCs grew by roughly the same amount (4.3 percent). Popula-
Figure 7 Distribution of Urban CoCs by Type
0
20
40
60
80
100
120
140
Num
ber
of C
oCs
Perc
ent o
f Pop
ulat
ion
Percent of UrbanHomeless Population
Percent of TotalUrban Population
0
10
20
30
40
33
Major City(Pop. > 500,000)
MostUrban
LeastUrban
Major MSA(Pop. > 1,000,000)
Large MSA(Pop. > 250,000
and < 1,000,000)
Small MSA(Pop. < 250,000)
51.36
28.61
17.32
2.73
20.13
42.96
34.18
130
101
31
50
60
2.70
5 Urban Homeless population and total population are defined here as the population within the 295 CoCs thatare considered urban.6 U.S. Census Bureau, 2005, 2007
tion growth across the four urban types ranged from a low of 2.8 percent in Major MSAsto a high of 5.6 percent in small MSAs.
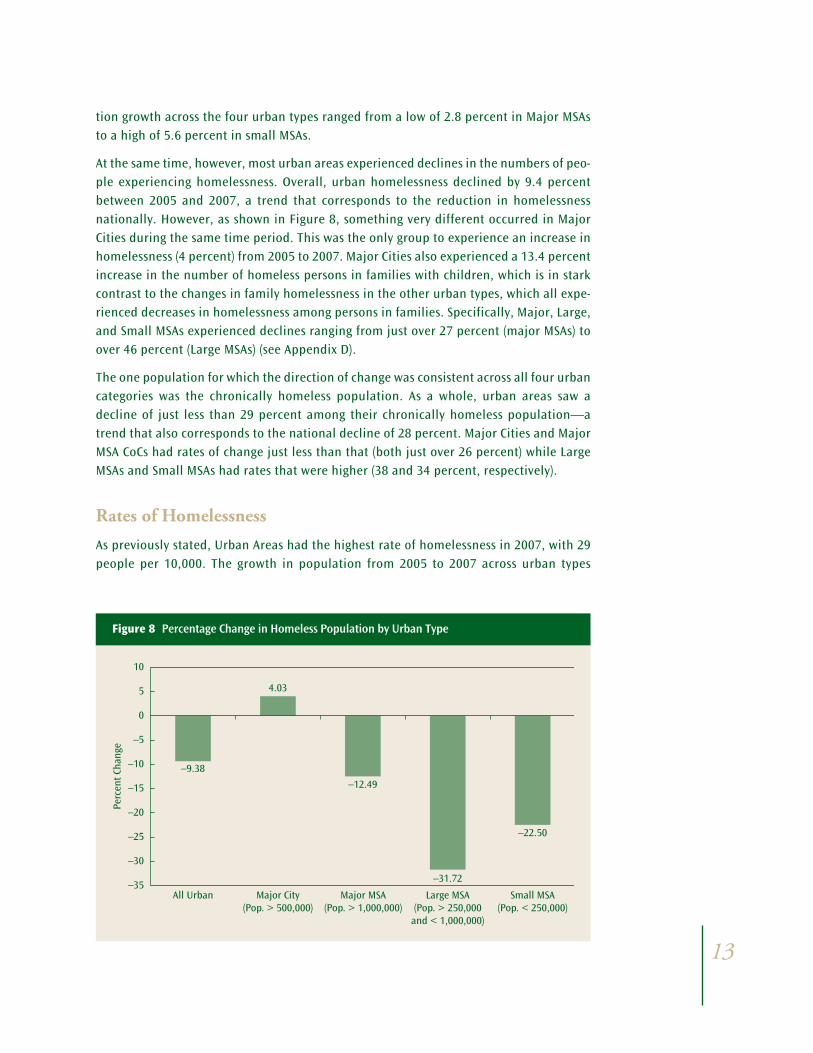
At the same time, however, most urban areas experienced declines in the numbers of peo-ple experiencing homelessness. Overall, urban homelessness declined by 9.4 percentbetween 2005 and 2007, a trend that corresponds to the reduction in homelessnessnationally. However, as shown in Figure 8, something very different occurred in MajorCities during the same time period. This was the only group to experience an increase inhomelessness (4 percent) from 2005 to 2007. Major Cities also experienced a 13.4 percentincrease in the number of homeless persons in families with children, which is in starkcontrast to the changes in family homelessness in the other urban types, which all expe-rienced decreases in homelessness among persons in families. Specifically, Major, Large,and Small MSAs experienced declines ranging from just over 27 percent (major MSAs) toover 46 percent (Large MSAs) (see Appendix D).
The one population for which the direction of change was consistent across all four urbancategories was the chronically homeless population. As a whole, urban areas saw adecline of just less than 29 percent among their chronically homeless population—atrend that also corresponds to the national decline of 28 percent. Major Cities and MajorMSA CoCs had rates of change just less than that (both just over 26 percent) while LargeMSAs and Small MSAs had rates that were higher (38 and 34 percent, respectively).
Rates of Homelessness
As previously stated, Urban Areas had the highest rate of homelessness in 2007, with 29people per 10,000. The growth in population from 2005 to 2007 across urban types
13
Figure 8 Percentage Change in Homeless Population by Urban Type
–9.38
Major City(Pop. > 500,000)
All Urban
Perc
ent C
hang
e
Major MSA(Pop. > 1,000,000)
Large MSA(Pop. > 250,000
and < 1,000,000)
Small MSA(Pop. < 250,000)
4.03
–12.49
–31.72
–22.50
–35
–30
–25
–20
–15
–10
–5
0
5
10

14
matched by declines (in most categories) in homeless populations resulted in lower ratesof homelessness for each urban category in 2007.
Within the Urban category, the rates of homelessness vary widely. Major Cities had thehighest rates of homelessness in both 2005 and 2007, with rates of 44 and 43 per 10,000,respectively (see Table 3). Due to a growth in population that outpaced their growth inhomelessness, the rates of homelessness in Major Cities still declined. CoCs in Major MSAshad the lowest rates of homelessness in both years with rates of 22 people per 10,000 in2005 and 19 people per 10,000 in 2007. The two groups with more significant declines inhomelessness experienced more signifi-cant declines in rates of homelessness,with the rates in Large MSAs decreasing byover 13 points from 38 to 25 people per10,000 in 2007 and Small MSAs decreas-ing by 10 points from 39 to 29 people per10,000.
This closer examination of the urban cat-egory has revealed some interesting ifunexpected differences between urbangeographic types. The trends in MajorCities departed from the other categorieswhen comparing homeless populationsize, rates, and changes between 2005and 2007.
Homeless Assistance System—Bed InventoryAs part of an annual application for funding, CoCs are required by HUD to collect
data on the number of beds available to people experiencing homelessness. Thethree principle bed types are emergency shelter beds, transitional housing beds, and per-manent supportive housing beds (PSH). CoCs identify the number of beds in each categorythat are designated for each subpopulation, persons in families with children and indi-viduals. Together, these distinctions are used to create six different bed types. The tablebelow outlines the distribution of beds (number and percent) by bed type. With the excep-
Table 3 Rates of Homelessness by UrbanType per 10,000 people
Rate Rate 2007 2005
Major City 43 44(Pop. > 500,000)
Major MSA 19 22(Pop. > 1,000,000)
Large MSA 25 38(Pop. > 250,000 and < 1,000,000)
Small MSA 29 39(Pop. < 250,000)
All Urban CoCs 29 33

tion of PSH for families which accounts for a much smaller share, there is only modestvariation in the percent of beds in each category.
Distribution of Existing Inventory by Geography
In 2007, there were 611,169 existing emergency shelter, transitional housing, and PSHbeds. Figure 9 shows the distribution of the entire existing bed inventory. Each segmentrepresents a percent of the total number of emergency shelter, transitional housing, andPSH beds in each geographic category. While there are similar numbers of beds in eachcategory nationally, there are differences when examining them by geographic category.
Three observations stand out as noteworthy:
� Emergency shelter accounts for a larger share of the bed inventory in the more ruralcategories;
15
Table 4 Bed Inventory, 2007
Bed Type Number of Beds Percent of Total Beds
Emergency shelter beds for families 98,061 16.15
Emergency shelter beds for individuals 112,640 18.55
Transitional housing beds for families 111,116 18.30
Transitional housing beds for individuals 97,886 16.12
Permanent supportive housing beds for families 72,205 11.89
Permanent supportive housing beds for individuals 115,288 18.99
Total Beds 611,159 100.00
Figure 9 Entire Existing Bed Inventory
UrbanOther
MajorCity
Perc
ent o
f Be
d In
vent
ory
MostlyUrban
Urban-RuralMix
MostlyRural
U.S.Rural
1816 22
18 15 12
18
1719
1221
14
19
18
16
1624
7
21 16
14
19 2010
23
14
1124 21
7
22 1618
16 1811
19 1619
16 1812
0
10
20
30
40
50
60
70
80
90
100
PSH Individual
TH Individual
ES Individual
PSH Family
TH Family
ES Family

16
� In Major Cities a notably larger share of the beds are PSH beds; and� Transitional housing represents a larger portion of the inventory in non-Major City
urban areas.
Capacity of the System
Emergency shelter and transitional housing beds are considered part of the homeless assis-tance system. Those who utilize PSH beds are not considered homeless by HUD’s defini-tion, and thus those beds are not included in this section which focuses on temporary bedsfor people who are experiencing homelessness. In 2007, there were approximately 420,000year round beds for people experiencing homelessness. Table 5 shows the existing total,family, and individual bed inventory by geographic category. Additionally, it shows thenumber of homeless people in each geographic category for every bed available.
Overall, these rates range from a low of 1.0 homeless person for every bed in Mostly Ruralareas to a high of 1.7 homeless people per bed in Major Cities and Rural areas. The ratesvary somewhat when accounting for subpopulations. For every geographic category, theratio of homeless individuals to the number of beds available to them is higher than theratio of homeless family people per family bed. In Major Cities and Rural areas there aremore than 2 homeless individuals per each individual bed. There is only one category inwhich there are fewer people than there are beds. In Mostly Rural areas, there are fewerhomeless persons in families than there are beds designated for them.
Table 5 Existing Inventory of Emergency Shelter and Transitional Housing Beds, 2007
Homeless Persons in Homeless
Families with Individuals TotalChildren per Homeless
Family per Family Individual Individual Total People perGeography Beds Beds Beds Beds Beds Total Beds
Major City 78,238 1.2 79,062 2.2 157,300 1.7
Urban Other 76,363 1.2 80,504 2.0 156,867 1.6
Mostly Urban 10,429 1.3 9,921 1.8 20,350 1.5
Urban-Rural Mix 25,158 1.3 23,304 1.8 48,462 1.5
Mostly Rural 10,775 0.9 8,784 1.2 19,559 1.0
Rural 8,214 1.4 8,951 2.1 17,165 1.7
U.S. 209,177 1.2 210,526 2.0 419,703 1.6
Inventory under Development
Those beds that are fully funded though not yet available for occupancy are considered“under development.” In 2007, there were approximately 43,000 such emergency shel-ter, transitional housing, and PSH beds. Approximately 69 percent, or 30,000, were PSHbeds. About 20 percent (8,700) were transitional housing beds and the remaining 11 per-cent (4,700) were emergency shelter beds. Figure 10 shows the entire bed inventory underdevelopment by geographic category. Each bar segment represents a share of the total

number of emergency shelter, transitional housing, and PSH beds that are being addedto the existing inventory. This chart deviates widely from the distribution of the existingstock shown in Figure 9. PSH comprises a majority of the new inventory in every geo-graphic category, and in Major Cities it makes up more than 80 percent of additional beds.
The number of PSH beds under development adds roughly 18 percent to the total exist-ing PSH stock (see Appendix G). By geography, these increases range from a low of 16 per-cent in Major Cities and geographically mixed CoCs to a high of 24 percent in Rural CoCs.However, the number of shelter and transitional housing beds under development wouldadd only 3 percent to the total existing shelter inventory. By geography, the increases inemergency shelter and transitional housing inventory range from a low of 1.8 percent inMajor Cities to a high of over 6 percent of added inventory in Rural areas (Appendix G).
Analysis of the housing inventory data increases our understanding of both the dimen-sions of the existing homeless assistance system as well as the new direction the home-less assistance system is taking. The data on beds under development show a clear anduniversal movement toward permanent supportive housing.
ConclusionThis report illustrates that there exist differences when examining homelessness by
geography. Rural areas have a much smaller share of the overall homeless popu-lation (4 percent compared with 77 percent), and they have a much higher proportion of
17
Figure 10 Entire Inventory Under Development
UrbanOther
MajorCity
Perc
ent o
f H
ousi
ng S
tock
MostlyUrban
Urban-RuralMix
MostlyRural
U.S.Rural
3
7
54
2 6
289
11
38
414
236
10
33
13 18 19 13
15
32
515 20 10
15 30
7
2414
16 12
26
9 1225
7
10
43
412
25
0
10
20
30
40
50
60
70
80
90
100
PSH Individual
TH Individual
ES Individual
PSH Family
TH Family
ES Family

unsheltered homeless persons in families with children than their urban counterparts.Rural areas also dedicate a much higher share of their bed inventory to emergency shel-ter compared with the more urban areas that favor PSH and transitional housing.
There are also some interesting differences within the Urban category. Major Citiesaccount for 51 percent of the urban homeless population but only one-third of the totalurban population. While other urban areas experienced declines in homelessnessbetween 2005 and 2007, Major Cities experienced an increase. Further, the rates of home-lessness in Major Cities are much higher than those of all other geographic types, andthree times higher than the rate of homelessness in Rural areas
However, this report also shows that in some ways there is little difference between cat-egories, and in some areas of this analysis rural areas and urban areas look surprisinglysimilar. The distribution of their homeless populations by families, non-chronic individ-uals, and chronic individuals are nearly identical. Both geographic types have issues ofcapacity, with over two homeless individuals per bed available. And while rural areashave rates of less than half that of urban areas (14 and 29 people per 10,000, respectively),two of the top three highest rates in the country belong to Rural CoCs.
This report has provided some additional insight to the problem of homelessness in theUnited States. Understanding the various dimensions of homelessness can help us under-stand the right ways to intervene, lighting the path towards ending homelessness in thiscountry.
18

AppendicesAppendix A CoCs with Highest Rates of Homelessness, 2007
Rate per Total Homelessness Geography Continuum of Care 10,000 People 2007
Urban Detroit, MI 216.0 18,062
Rural Mendocino County, CA 161.3 1,422
Rural Monroe County, FL 146.9 1,121
Urban Portland, ME 116.0 741
Urban Watsonville/Santa Cruz City & 111.7 2,789County, CA
Mostly Rural Central Oregon 110.5 2,029
Urban Merced City & County, CA 109.3 2,641
Urban Santa Maria/Santa Barbara 106.1 4,253County, CA
Urban Boston, MA 98.0 5,104
Urban District of Columbia 96.6 5,320
Appendix B CoCs with Highest Numbers of People Experiencing Homelessness, 2007
Rate per Total HomelessGeography Continuum of Care 10,000 people 2007
Urban Los Angeles City & County, CA 75.0 68,608
Urban New York City, NY 61.9 50,372
Urban Detroit, MI 216.0 18,062
Urban Las Vegas/Clark County, NV 66.7 11,417
Urban-Rural Mix Texas Balance of State 18.7 10,636
Urban Houston/Harris County 24.9 10,363
Urban-Rural Mix Georgia Balance of State 16.8 10,255
Urban Metropolitan Denver 34.2 8,698Homeless Initiative, CO
Urban Phoenix/Mesa/Maricopa 23.2 8,448County Regional, AZ
Urban Seattle/King County, WA 44.1 7,902
19

20
Appendix C Urban Category Names, Definitions, and Examples
Name Definition Examples
Major City CoCs that contain a Major San Diego City, CA City with a population of New York City, NYover 500,000. Columbus/Franklin County, OH
Atlanta/DeKalb, Fulton Counties, GA
Major MSA CoCs that do not contain a Ft Lauderdale/Broward County, FLmajor city, but are within a Minneapolis/Hennepin County, MNMajor Metropolitan Statistical Cambridge, MAArea (MSA) with a population Sacramento City and County, CAof over 1,000,000.
Large MSA CoCs within a Large MSA with Colorado Springs/El Paso County, COa population of over 250,000 Honolulu, HIbut less than 1,000,000. Albany City & County, NY
Spokane, WA
Small MSA CoCs within in a Small MSA Bangor/Penobscot County, MEwith a population fewer than Racine City & County, WI250,000. Amarillo, TX
Sioux City/Dakota, Woodbury Counties, IA
Appendix D Percent Change in Homeless Subpopulations between 2005 and 2007 by Urban Type
Percent Percent Change— Percent
Percent Change— Persons in Change—Change— Chronically Families with Total
Urban Type N= Homeless Homeless Children Population
Major City 33 4.03 –26.35 13.39 5.37
Major MSA 130 –12.49 –26.07 –27.11 2.84
Large MSA 101 –31.72 –38.16 –46.43 5.32
Small MSA 31 –22.50 –34.55 –39.57 5.64
All Urban CoCs 295 –9.38 –28.75 –17.48 4.26

21
Appendix F Existing Permanent Supportive Housing Stock; Units and Percent by Subpopulation
Existing PercentExisting Percent Existing Percent PSH beds for PSH for
PSH beds PSH for PSH for PSH for Chronically ChronicallyGeography for Families Families Individuals Individuals Homeless Homeless
Major City 27,849 34.78 35,615 44.48 16,598 20.73
Urban Other 31,500 42.26 27,480 36.87 15,557 20.87
Mostly Urban 1,981 32.17 3,039 49.35 1,138 18.48
Urban Rural Mix 6,648 42.81 6,473 41.68 2,408 15.51
Mostly Rural 1,665 37.88 1,953 44.43 778 17.70
Rural 2,562 37.62 3,364 49.39 885 12.99
Total 72,205 38.51 77,924 41.56 37,364 19.93
Appendix E Percent of Inventory Under Development by Geographic Category: EmergencyShelter and Transitional Housing
12.71
18.23
12.25
10.42
28.25
11.69
8.64 18.12
23.18
12.33
26.98
18.46
32.63
22.21 35.72
25.10
42.79
30.99
39.03
37.34 27.79
20.39
31.61
26.51
24.05
29.36
35.64 37.61
TH Individual
Transitional Housing
ES Individual TH FamilyES Family
Emergency Shelter
0 10 20 30 40 50 60 70 80 90 100
Major City
Urban other
Mostly Urban
Urban-Rural Mix
Mostly Rural
Rural
Total

22
App
endi
x G
Perc
ent I
ncre
ase
in In
vent
ory
Afte
r U
nits
Und
er D
evel
opm
ent A
re A
dded
to T
otal
Inve
ntor
y
Incr
ease
in
Tot
al
Incr
ease
In
crea
se
Incr
ease
In
crea
se
Incr
ease
Sh
elte
r an
d Em
erge
ncy
Tran
siti
onal
Em
erge
ncy
Tran
siti
onal
In
crea
se
in P
SH f
or
Incr
ease
Tr
ansi
tion
al
Shel
ter
for
Hou
sing
for
Sh
elte
r fo
r H
ousi
ng f
or
Incr
ease
in
in P
SH f
or
Chro
nica
lly
in P
SH f
or
Geo
grap
hyH
ousi
ngFa
mili
esFa
mili
esIn
divi
dual
sIn
divi
dual
sTo
tal P
SHFa
mili
esH
omel
ess
Indi
vidu
als
Maj
or C
ity
1.81
0.56
2.84
1.21
2.81
16.3
813
.72
15.9
512
.85
Urb
an o
ther
4.14
2.62
4.81
3.49
4.44
18.6
411
.29
19.5
29.
23M
ostl
y U
rban
5.06
6.55
6.02
2.47
4.11
26.0
917
.60
27.4
28.
74U
rban
-Rur
al M
ix2.
991.
203.
422.
884.
3216
.16
8.23
16.8
86.
62M
ostl
y Ru
ral
3.05
1.27
4.78
1.94
4.65
19.4
68.
3121
.10
5.19
Ru
ral
6.11
4.62
5.80
6.19
6.27
23.9
517
.46
19.8
49.
08To
tal
3.21
1.72
4.15
2.59
3.88
18.0
312
.33
18.1
510
.69

National Alliance to End Homelessness1518 K Street, NWSuite 410Washington, DC 20005
www.endhomelessness.org