Embed Size (px)
Citation preview

PNNL-16887
Geologic Descriptions for the Solid-Waste Low Level Burial Grounds BN Bjornstad DC Lanigan September 2007 Prepared for the U.S. Department of Energy under Contract DE-AC05-76RL01830


PNNL-16887
Geologic Descriptions for the Solid-Waste Low Level Burial Grounds B.N. Bjornstad D.C. Lanigan September 2007 Prepared for the U.S. Department of Energy under Contract DE-AC05-76RL01830 Pacific Northwest National Laboratory Richland, Washington 99352

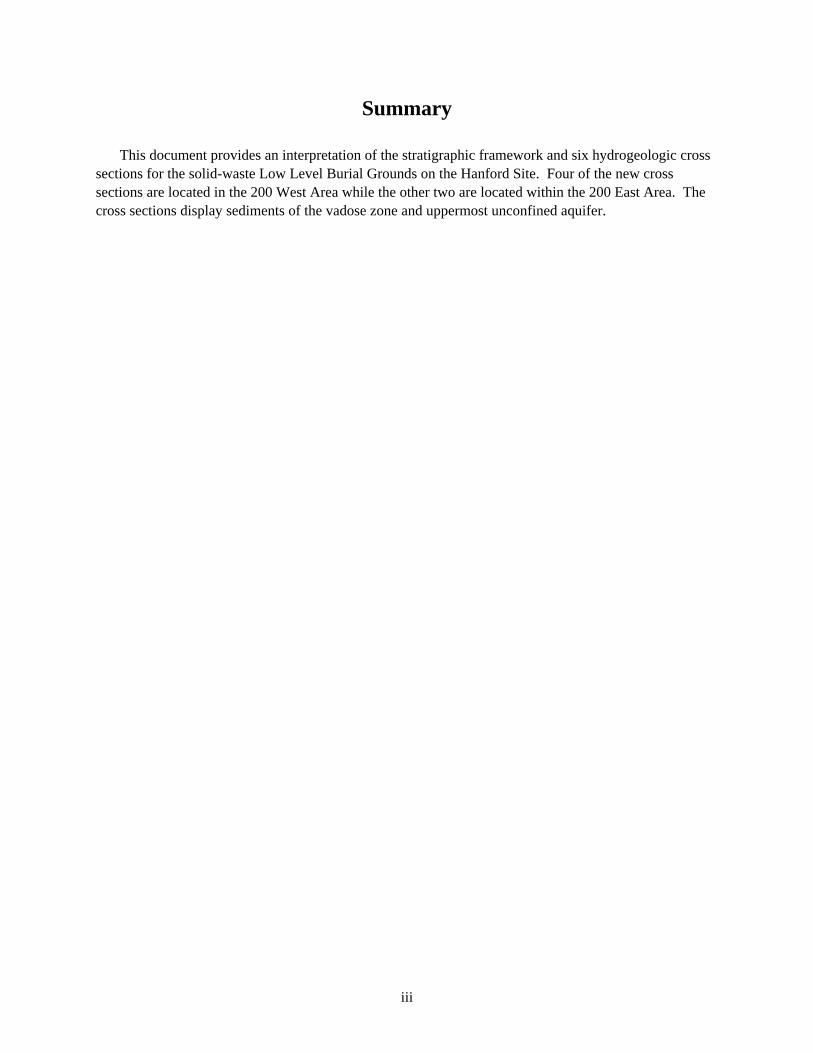
Summary
This document provides an interpretation of the stratigraphic framework and six hydrogeologic cross sections for the solid-waste Low Level Burial Grounds on the Hanford Site. Four of the new cross sections are located in the 200 West Area while the other two are located within the 200 East Area. The cross sections display sediments of the vadose zone and uppermost unconfined aquifer.
iii


Contents
Summary ...................................................................................................................................................... iii Acronyms and Abbreviations .....................................................................................................................vii 1.0 Introduction ..................................................................................................................................... 1.1 2.0 Stratigraphic Framework ................................................................................................................. 2.1
2.1 Ringold Formation ................................................................................................................. 2.3 2.2 Cold Creek Unit (CCU).......................................................................................................... 2.4 2.3 Hanford Formation ................................................................................................................. 2.6
3.0 Geologic Descriptions for the Solid-Waste Low Level Burial Grounds: 200 West Area .............. 3.1 4.0 Geologic Descriptions for the Solid-Waste Low Level Burial Grounds: 200 East Area ................ 4.1 5.0 Data Availability and Quality.......................................................................................................... 5.1 6.0 References ....................................................................................................................................... 6.1
v

Figures
1.1 Location Map for Four New Cross Sections Constructed in the 200 West Area ...................... 1.2 1.2 Location Map for Two New Cross Sections Constructed in the 200 East Area ........................ 1.3 2.1 Fence Diagram across the 200 Area Plateau, Hanford Site ....................................................... 2.1 2.2 Stratigraphic Cross Section of the Vadose Zone Within the Western Pasco Basin................... 2.2 2.3 Thickness and Distribution of Cataclysmic Flood Deposits Within the Central Pasco Basin... 2.3 2.4 A Pair of Vertical Clastic Dikes ................................................................................................ 2.8 2.5 A Polygonal, Clastic Dike Network Exposed Atop the Deflated Surface of the Hanford
Formation................................................................................................................................... 2.9 3.1 Fence Diagram Showing the Relationship Between Stratigraphic Units at the T, TX, and
TY WMA................................................................................................................................... 3.3 3.2 Location of Geologic Cross Sections Within LLWMA-3. ........................................................ 3.3 3.3 Cross Section is Located in 1.1.................................................................................................. 3.4 3.4 Geologic Cross Section B-B’ through a portion of LLWMA-3 ............................................... 3.6 3.5 Geologic Cross Section C-C’ through a portion of LLWMA-3 ............................................... 3.7 3.6 Location of Geologic Cross Sections Within LLWMA-4 ......................................................... 3.9 3.7 Geologic Cross Section D-D’ through a portion of LLWMA-4................................................ 3.10 4.1 Fence Diagram Showing the Relationship Between Stratigraphic Units at the B, BX, and
BY WMA................................................................................................................................... 4.3 4.2 Geologic Cross Section X-X’ through LLWMA-2 ................................................................... 4.4 4.3 Location of Cross Section X-X’ in LLWMA-2......................................................................... 4.5 4.4 Geologic Cross Section Y-Y’ .................................................................................................... 4.6 4.5 Location of Cross Section Y-Y’ in LLWMA-1......................................................................... 4.7
Tables
3.1 Stratigraphic Terminology for the Vadose Zone and Upper Unconfined Aquifer Beneath the 200 West Area Low Level Burial Grounds ............................................................................... 3.1
4.1 Stratigraphic Terminology for the Vadose Zone and Upper Unconfined Aquifer Beneath the 200 East Area Low Level Burial Grounds................................................................................. 4.2
5.1 Boreholes Used for LLBG Cross Sections ................................................................................ 5.2
vi

Acronyms and Abbreviations
CCU Cold Creek Unit GD gravel-dominated ISSD interbedded sand- and silt-dominated LLBG low level burial grounds LLW low level waste LLWMA low level waste management area MLLW mixed low level waste SD sand-dominated TOC top of casing WMA waste management area
vii

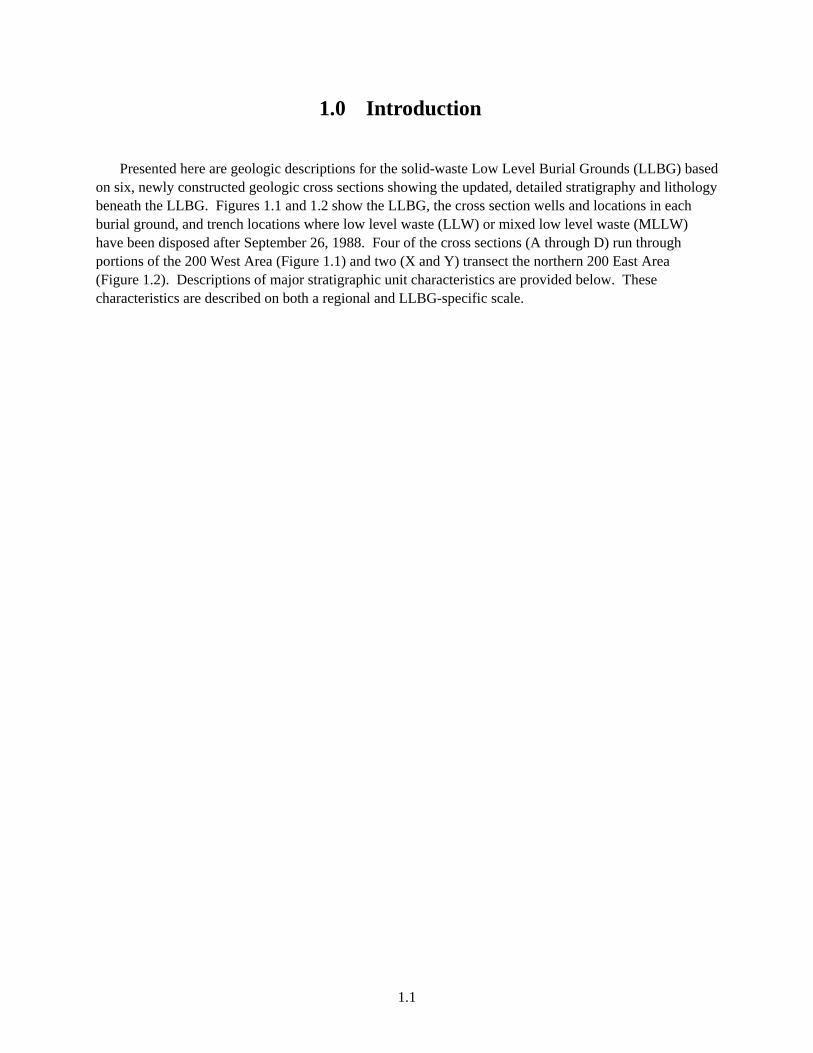
1.0 Introduction
Presented here are geologic descriptions for the solid-waste Low Level Burial Grounds (LLBG) based on six, newly constructed geologic cross sections showing the updated, detailed stratigraphy and lithology beneath the LLBG. Figures 1.1 and 1.2 show the LLBG, the cross section wells and locations in each burial ground, and trench locations where low level waste (LLW) or mixed low level waste (MLLW) have been disposed after September 26, 1988. Four of the cross sections (A through D) run through portions of the 200 West Area (Figure 1.1) and two (X and Y) transect the northern 200 East Area (Figure 1.2). Descriptions of major stratigraphic unit characteristics are provided below. These characteristics are described on both a regional and LLBG-specific scale.
1.1

Figure 1.1. Location Map for Four New Cross Sections Constructed in the 200 West Area
1.2

Figure 1.2. Location Map for Two New Cross Sections Constructed in the 200 East Area
1.3


2.0 Stratigraphic Framework
The generalized stratigraphy beneath the Hanford Site and LLBG’s consists of, in ascending order, the Columbia River Basalt Group, the Ringold Formation, the Cold Creek Unit (CCU) (formerly named the Plio-Pleistocene unit), and the Hanford formation. The CCU and Hanford formation are both informal designations. A fence diagram showing the three-dimensional variation of the units that occur between the surface and the top of the Columbia River Basalt Group within the 200 Areas is presented in Figure 2.1. The subsurface depth interval shown in Figure 2.1 includes primarily the vadose zone and the suprabasalt aquifer underlying the 200 Areas.
A more-detailed geologic cross section showing the stratigraphic relationships within the upper unconfined aquifer and vadose zone for the western Pasco Basin is presented in Figure 2.2. Thin veneers of Holocene alluvium, colluvium, and/or eolian sediments locally overlie these principal geologic units. Summaries of the suprabasalt stratigraphic unit characteristics from a regional perspective are provided below. More detailed descriptions of regional suprabasalt stratigraphy are described elsewhere (Lindsey 1995; DOE 1988, 2002).
Figure 2.1. Fence Diagram across the 200 Area Plateau, Hanford Site (from Reidel and Chamness 2007)
2.1

Figure 2.2. Stratigraphic Cross Section of the Vadose Zone Within the Western Pasco Basin.
Cross section is located in Figure 2.3. From DOE (2002).
2.2

Figure 2.3. Thickness and Distribution of Cataclysmic Flood Deposits (i.e., Hanford Formation) Within
the Central Pasco Basin. Cross section A-A’ is represented in Figure 2.2. From DOE (2002).
2.1 Ringold Formation
The Ringold Formation blankets Columbia River basalt over most of the Pasco Basin. The Ringold Formation records fluvial-lacustrine deposition associated with the ancestral Columbia River drainage system, following the last eruption of basalt at the Hanford Site about 10.5 m.y. ago (Tallman et al. 1981, DOE 1988, Lindsey et al. 1994, Lindsey 1995). Deformation of the Yakima folds, which began in the middle Miocene Epoch, concurrent with the Columbia River basalt volcanism, continued into Ringold time so the centers of down-warped basins received more sediments than the margins. The Ringold Formation is up to 600 ft (185 m) thick in the center of the basin and pinches out against the basin-bounding basalt ridges. While a thick sequence (up to 500 ft) of Ringold Formation is present under the
2.3

200 West Area, the Ringold Formation appears to be completely missing (due to post-Ringold incision and erosion) from beneath the northern portion of the 200 East Area, where the LLBG’s are located.
The Ringold Formation consists of semi-indurated clay, silt, fine- to coarse-grained sand, and variably cemented granule to cobble gravel. Ringold Formation sediments have been classified into five sediment facies associations: 1) fluvial gravel, 2) fluvial sand, 3) overbank deposits, 4) lacustrine deposits, and 5) alluvial fan deposits. More-detailed descriptions of these facies are presented in Lindsey (1995, 1996). Most of the unconfined aquifer in the Pasco Basin lies within the member of Wooded Island (Unit E) of the Ringold Formation. Erosional remnants of the Ringold member of Taylor Flat locally overlie Ringold Unit E.
2.2 Cold Creek Unit (CCU)
After a period of post-Ringold incision, the eroded surface of the Ringold Formation was locally weathered and/or covered with accretionary deposits of the CCU. These deposits consist of fluvial, eolian and/or colluvial sediment, often pedogenically altered (Bjornstad 1990; Slate 1996, 2000; DOE 2002). The CCU includes those deposits formerly referred to as the “Plio-Pleistocene unit” and “pre-Missoula Gravels,” as well as the “early Palouse soil” and “caliche layer” within the 200 West Area. The new name was given to these deposits because more-recent studies suggest these materials are all of late Pliocene age (DOE 2002).
The CCU represents deposits that accumulated within the central Pasco Basin during the period between about 2 to 3 million years ago, which brackets two significant geologic events. The older event is a regional base-level drop and subsequent incision of the Ringold Formation (DOE 1988). The younger event is the initiation of Ice Age cataclysmic flooding, which began at the beginning of the Pleistocene, about 1.5 to 2.5 million years ago (Bjornstad et al. 2001; Bjornstad 2006).
The CCU is not obviously apparent in the 200 East Area, except in the vicinity of B Tank Farm where there lies a silt-dominated unit up to 35 ft thick (Wood et al. 2000). The character and thickness of the massive silt layer suggests it is more likely equivalent to the overbank-eolian facies of the CCU (DOE 2002) than a slackwater sequence within the Hanford formation. Beneath this layer is up to 50 ft of coarse-grained, basalt-rich gravel (Figure 2.1) most likely equivalent to mainstream alluvial facies of the CCU. Where the silt layer is missing, as it is in the 200 East LLBG’s, it is not possible to distinguish coarse-grained CCU from overlying coarse-grained Hanford formation. Therefore, for the LLBG cross sections presented in this report, we show the Hanford formation extending to the top of basalt bedrock, even though the lower part of the Hanford formation may in fact be equivalent to the CCU.
In contrast to the 200 East Area the CCU is very distinctive and easily identified in the 200 West Area. Here, the CCU can be subdivided into two distinct subunits: a lower and upper subunit, which together may be up to 75 ft thick.
Lower Cold Creek Subunit. The lower CCU consists of basaltic to quartzitic gravels, sands, silt, and clay that are cemented with one or more layers of secondary, pedogenic CaCO3 (i.e., caliche). The upper boundary is usually sharp and distinct in contrast to the lower boundary, which is commonly gradational and overprinted onto the underlying Ringold Formation within the west-central Pasco Basin. The concentration of CaCO3 within the caliche is generally 20 to 30 wt% but can range from 5 to 70 wt%. Diagnostic features of the caliche include (1) advanced induration, (2) white color, (3) presence of
2.4

pedogenic structures (e.g., root traces, animal burrows, or soil horizonation), as well as an erratic geophysical log (i.e., natural gamma) response (DOE 1988, Bjornstad 1990). The overall thickness of the caliche beneath the 200 West Area is highly variable but is generally less than 10 m (30 ft). Within the of 200 West Area, the top of the caliche dips consistently to the southwest about 1 degree toward the ancestral Cold Creek channel (see Figure 2.2). The lower CCU represents the old, buried land surface, which likely existed for a million years or more prior to the onset of Pleistocene Ice Age flooding.
Calcic soils are classified and subdivided into several morphogenetic stages (Gile et al. 1966; Machette 1985) Characteristic features associated with calcic soil development in lower CCU range from a few small calcareous filaments (Stage I) to a meter or more of massive carbonate-plugged horizons with >50 wt% CaCO3 (Stage IV-V). Where no significant aggradation or degradation has occurred, the relative amount of CaCO3 present can provide a rough approximation for the duration of soil development (Slate 1996, 2000). Stage I calcic soils may form in as little as a few tens of thousands of years, while advanced stages of calcic soil development (>Stage IV) may require a million years or more to develop. Calcic paleosols of the CCU beneath the 200 West Area are classified as Stage I to V, with Stage III being most common (Slate 2000).
Considerable variability may exist internally within the lower CCU because of natural heterogeneity inherent in soils and soil-forming processes, which vary under different physical, chemical, and biological conditions (e.g., moisture, grain size, aspect, mineralogy, bioturbation, and microbial activity). An additional complicating factor is that the land surface during late Pliocene time was locally undergoing changes via fluvial and eolian activity, which resulted in variable rates of aggradation, degradation, and soil development (Bjornstad 1990; DOE 1988; Slate 1996, 2000; Wood et al. 2001). For example, in the southern portion of the 200 West Area, only a single, relatively thin (<1 m), Stage IV-V calcic soil (Appendix A, cross section A-A’) is present, which developed directly on top of the eroded surface of the Ringold Formation. The CaCO3 overprint is superimposed onto a variety of rock types, including silt, quartz-feldspar-rich sand and gravel, and locally derived basaltic sand and gravel (Slate 1996, 2000; Lindsey et al. 2000). However, in the northern 200-West Area, the thickness and character of the lower CCU is very different. Up to five separate calcic horizons are present (Slate 1996, 2000) in a sequence up to 15 m (50 ft) thick and mostly developed in post-Ringold fluvial-overbank to eolian parent materials. Multiple, calcic-rich zones are separated by relatively noncalcareous, uncemented sand, silt and locally indigenous, basaltic sand and/or gravel (Bjornstad 1990; Slate 1996, 2000; Wood et al. 2001). Multiple calcic horizons within the lower CCU indicate that local aggradation occurred periodically between periods of soil development. This is demonstrated on detailed cross section A-A’ (Appendix A-1).
Upper Cold Creek Subunit. Cohesive and compact, massive to laminated and stratified fine-grained sand and silt belong to the upper CCU. This brown- to yellow-colored unit, formerly referred to as “early Palouse soil” is also described as micaceous, very well sorted, and moderately to strongly calcareous, with relatively high natural background-gamma activity (Bjornstad 1990, DOE 2002). These properties impart this unit with a uniquely high moisture-retention capacity. This unit is over 15 m (50 ft) thick in the southern portion of the 200 West Area (Connelly et al. 1992).
The upper CCU is easily distinguished from the underlying caliche (lower CCU) based on sudden change in color, sorting, degree of cementation, and natural gamma activity (Bjornstad 1990, DOE 2002). Furthermore, while the upper CCU may be compact and cohesive, it is generally uncemented, in contrast to the underlying pedogenically altered caliche. Even though the upper CCU may contain moderate to high concentrations of CaCO3, the carbonate is evenly disseminated as detrital grains. The bulk of the
2.5
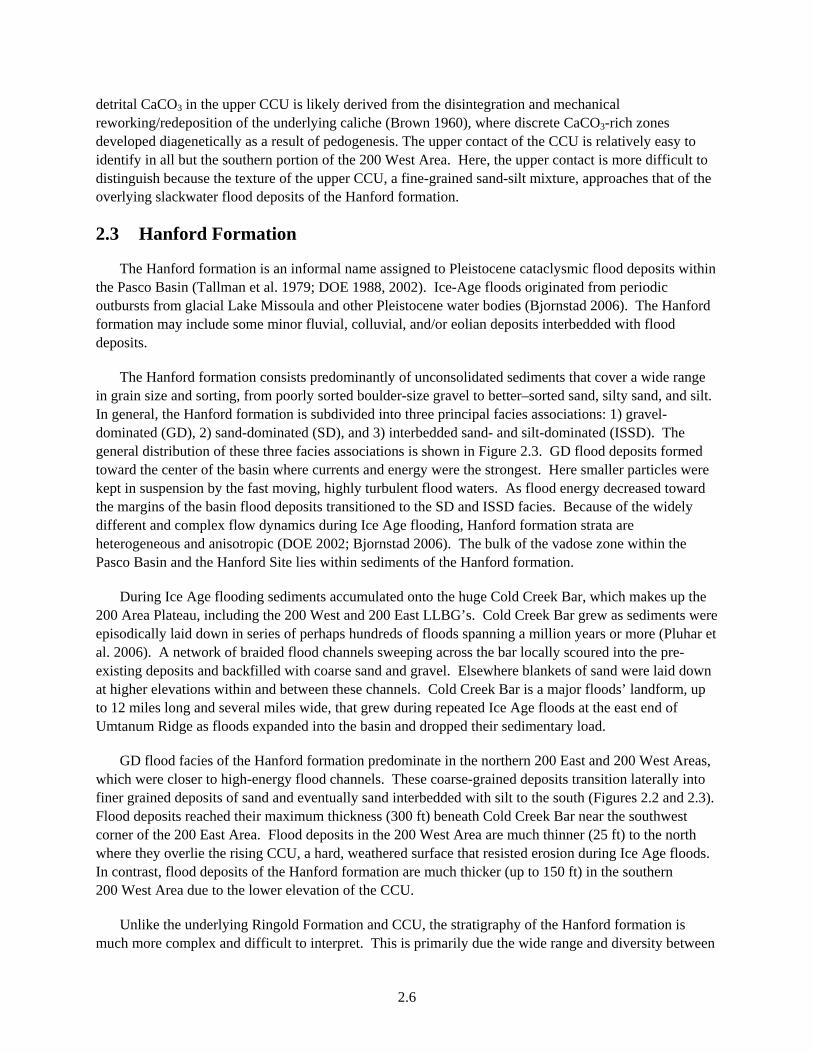
detrital CaCO3 in the upper CCU is likely derived from the disintegration and mechanical reworking/redeposition of the underlying caliche (Brown 1960), where discrete CaCO3-rich zones developed diagenetically as a result of pedogenesis. The upper contact of the CCU is relatively easy to identify in all but the southern portion of the 200 West Area. Here, the upper contact is more difficult to distinguish because the texture of the upper CCU, a fine-grained sand-silt mixture, approaches that of the overlying slackwater flood deposits of the Hanford formation.
2.3 Hanford Formation
The Hanford formation is an informal name assigned to Pleistocene cataclysmic flood deposits within the Pasco Basin (Tallman et al. 1979; DOE 1988, 2002). Ice-Age floods originated from periodic outbursts from glacial Lake Missoula and other Pleistocene water bodies (Bjornstad 2006). The Hanford formation may include some minor fluvial, colluvial, and/or eolian deposits interbedded with flood deposits.
The Hanford formation consists predominantly of unconsolidated sediments that cover a wide range in grain size and sorting, from poorly sorted boulder-size gravel to better–sorted sand, silty sand, and silt. In general, the Hanford formation is subdivided into three principal facies associations: 1) gravel-dominated (GD), 2) sand-dominated (SD), and 3) interbedded sand- and silt-dominated (ISSD). The general distribution of these three facies associations is shown in Figure 2.3. GD flood deposits formed toward the center of the basin where currents and energy were the strongest. Here smaller particles were kept in suspension by the fast moving, highly turbulent flood waters. As flood energy decreased toward the margins of the basin flood deposits transitioned to the SD and ISSD facies. Because of the widely different and complex flow dynamics during Ice Age flooding, Hanford formation strata are heterogeneous and anisotropic (DOE 2002; Bjornstad 2006). The bulk of the vadose zone within the Pasco Basin and the Hanford Site lies within sediments of the Hanford formation.
During Ice Age flooding sediments accumulated onto the huge Cold Creek Bar, which makes up the 200 Area Plateau, including the 200 West and 200 East LLBG’s. Cold Creek Bar grew as sediments were episodically laid down in series of perhaps hundreds of floods spanning a million years or more (Pluhar et al. 2006). A network of braided flood channels sweeping across the bar locally scoured into the pre-existing deposits and backfilled with coarse sand and gravel. Elsewhere blankets of sand were laid down at higher elevations within and between these channels. Cold Creek Bar is a major floods’ landform, up to 12 miles long and several miles wide, that grew during repeated Ice Age floods at the east end of Umtanum Ridge as floods expanded into the basin and dropped their sedimentary load.
GD flood facies of the Hanford formation predominate in the northern 200 East and 200 West Areas, which were closer to high-energy flood channels. These coarse-grained deposits transition laterally into finer grained deposits of sand and eventually sand interbedded with silt to the south (Figures 2.2 and 2.3). Flood deposits reached their maximum thickness (300 ft) beneath Cold Creek Bar near the southwest corner of the 200 East Area. Flood deposits in the 200 West Area are much thinner (25 ft) to the north where they overlie the rising CCU, a hard, weathered surface that resisted erosion during Ice Age floods. In contrast, flood deposits of the Hanford formation are much thicker (up to 150 ft) in the southern 200 West Area due to the lower elevation of the CCU.
Unlike the underlying Ringold Formation and CCU, the stratigraphy of the Hanford formation is much more complex and difficult to interpret. This is primarily due the wide range and diversity between
2.6

erosion and deposition that occurred during the waxing and waning of perhaps hundreds of separate Ice Age flood events. The end result is a series of heterogeneous and laterally discontinuous strata within the Hanford formation. This was a much more complex depositional environment than that compared to “simple” fluvial, pedogenic, and eolian environments that deposited the Ringold Formation and CCU strata.
GD Facies Association. GD facies were deposited by high-energy floodwaters in or immediately adjacent to the main cataclysmic flood channels (Figure 2.3). GD facies generally consists of poorly sorted, coarse-grained sand and pebble- to boulder-size gravel, which may display an open-framework fabric, massive bedding, plane to low-angle bedding, and/or large-scale, planar-tabular, fore-set bedding in outcrop. The gravel clasts (dominated by basalt) are usually subangular to subrounded. GD facies may grade vertically, as well as laterally, into SD facies.
Erosional unconformities (defined by intercalated finer-grained layers) may represent separate floods, but where fines have been completely eroded during subsequent floods, it is not possible to evaluate the number of floods. Therefore, commonly, these coarse grained deposits are lumped together leaving the appearance as if only a single flood is represented within most sequences of GD facies. In general, the absence of paleosols or other disconformities within flood-gravel sequences suggests that most or all older flood deposits were stripped away or reworked via erosional scouring by the last (late Pleistocene) flood(s). Occasionally, scour and fill features and gradations within flood-gravel sequences may be present, indicating multiple floods, or flow variations that occurred during a single flood.
GD deposits of the Hanford formation are distinguished from the Ringold Formation by a greater percentage of basalt clasts, with less rounding and poorer sorting for the Hanford formation. Coarse-grained Ringold Formation deposits are generally more cemented and/or compacted with a pervasive, distinct rusty orange, red, or brown stain compared to the Hanford formation, which is unconsolidated and typically gray in color. Saturated hydraulic conductivity of the GD facies of the Hanford formation is generally orders of magnitude greater than GD facies of the Ringold Formation. Associated sedimentary structures are also different; coarse-grained Ringold Formation deposits are more horizontally bedded while the Hanford formation displays large-scale, fore-set cross-bedding.
SD Facies Association. SD deposits of the Hanford formation consist of variably graded sand sequences several or more meters thick. Minor amounts of silty fine sand to silt may cap some of the beds. Generally, SD facies formed at higher elevations where floodwaters were starved of gravel, and/or adjacent to main flood channelways during the dissipating stages of flooding, or perhaps as crevasse splay-like deposits proximal to overflowing flood channels. SD deposits of the Hanford formation typically display horizontal to ripple laminations in outcrop. Normal and reverse grading between different sand sizes is common, adding to the heterogeneity and anisotropy of this facies type. Volumetrically, the SD facies is the predominant facies type within the 200 Areas (Figure 2.3). SD facies may grade vertically, as well as laterally, into GD facies or the ISSD facies.
ISSD Facies Association. ISSD facies characteristically consist of regularly graded beds of slackwater sand and silt, otherwise known as Touchet Beds or “rhythmites”. Individual rhythmites range from a few centimeters to a meter in thickness (Baker et al. 1991, Smith 1993), and when exposed in outcrop can be traced laterally for hundreds of meters or more. Slackwater flood deposits of the ISSD facies are most prevalent around the margins of the Pasco Basin and up back-flooded tributary valleys along floods routes. Occasional pebble- to boulder-sized clasts found floating within the fine-grained
2.7

matrix of facies association ISSD most likely represent ice-rafted erratics that floated in on icebergs (Bjornstad 2006).
ISSD facies of the Hanford formation provide a record of the occurrence of multiple floods. This is because in slackwater environments the erosive power of the floods was diminished, resulting in little or no erosion during (and between) flood events. While minor erosion may occur associated with localized scouring along the bases of some beds, the upper portions of rhythmites are predominantly composed of silt that settled out of suspension and blanketed slackwater areas with a relatively continuous layer of cohesive, fine-grained sand and/or silt. This cohesive layer, which mantles most ISSD rhythmites, helps to protect the underlying rhythmites sequence from erosion during subsequent floods. ISSD facies may grade vertically, as well as laterally, into SD facies.
Clastic Dikes. Clastic dikes are near-vertical features that cut across horizontally layered beds (Figure 2.4). Dikes vary from less than 1 inch to 6 feet or more wide and range from a few to over 100 feet long. They are commonly associated with, but not restricted to, slackwater flood deposits and most often observed within the SD and ISSD facies of the Hanford formation. In contrast, clastic dikes are much less common in the GD facies (Bjornstad 2006).
Figure 2.4. A Pair of Vertical Clastic Dikes (arrows). These dikes crosscut SD flood deposits exposed
along the White Bluffs just east of the Hanford Site. The dikes stand out here because they contain more cohesive silt and are better able to withstand attack by strong winds, which are actively eroding these bluffs.
Most dikes occur as sharp-walled, near-vertical features filled with multiple layers of sand that is loosely held together. Thin linings of silt and/or clay separate the margins of dikes as well as layers internal to the dike. Linings are commonly 0.03 mm to 1.0 mm in thickness, but linings up to about 10 mm are known. The width of individual infilling layers ranges from as little as 0.01 mm to more than 30 cm and their length can vary from about 0.2 m to more than 20 m. Infilling sediments are typically poor- to well-sorted sand, but may contain clay, silt, and gravel.
Clastic dikes last formed during or soon after Ice Age flooding, when the sediments were still wet. Although some dikes appear to have been filled from below, others suggest filling from above. Clastic dikes may be the result of ground shaking, which caused the wet sediments to liquefy and flow along paths of weakness down into or up along vertical earthquake-generated cracks in the flood deposits. The last episode of clastic dike formation occurred during (or immediately after) one of the last floods, about 15,000 years ago (Bjornstad 2006).
2.8

Clastic dikes and presumably earthquakes, were not a normal occurrence with flooding and it may just be a coincidence that an earthquake occurred during or soon after the last flood. This is based on evidence that shows clastic dikes extend all the way to the top of the last-glacial flood deposits. If there were a direct link between flooding and earthquakes and clastic dike formation, many more clastic dikes would exist that are truncated at the tops of beds lower in the sequence. Instead, clastic dikes usually cut across entire sequences of slackwater flood beds, indicating one primary clastic dike forming event (perhaps precipitated by an earthquake) at the end of flooding. It’s possible some dikes may have been used multiple times and may record many separate flood events and/or seismic events, with the last opening and filling of dikes occurring during the last flood.
Clastic dikes occur in swarms and form four types of networks (Fecht et al. 1999): 1) regular-shaped polygonal-patterns, 2) irregular-shaped, polygonal-patterns, 3) pre-existing fissure fillings, and 4) random occurrences. In Figure 2.5 an expansive interconnected network of clastic dikes is shown. Unlike most other places in the area, windblown silt and sand don’t completely cover flood deposits at this location. Clastic dikes are difficult to see from the ground but are clearly visible on aerial photographs because they contain more fine-grained material than the sediment between dikes. Dikes stand out in relief and retain more moisture and, therefore, attract different kinds of plants. This contrast in moisture and vegetation is what makes the dikes visible in aerial photographs (Figure 2.5).
Clastic dikes in the LLBG’s probably occur randomly in the GD facies (Hanford formation units H1 and H3) and may form regular-shaped polygons in the SD facies (Hanford formation unit H1a and H2). A few dikes have also been observed to extend through the CCU into the underlying Ringold Formation.
Figure 2.5. A Polygonal, Clastic Dike Network Exposed atop the Deflated Surface of the Hanford
Formation (SD facies). Enhanced aerial photograph clearly shows interconnected network of regularly-spaced, multisided clastic dikes. Clastic-dike polygons (blue) disappear under a cover of more recent sand dunes, which are younger than the floods, in the upper right. Highway 240 runs diagonally across lower left corner of image.
2.9


3.0 Geologic Descriptions for the Solid-Waste Low Level Burial Grounds: 200 West Area
This section provides a geologic description of the upper unconfined aquifer and vadose zone beneath LLBG WMA-3 and WMA-4 within the 200 West Area. A fence diagram of the local area and four simplified and generalized cross sections are also presented in this section. More detailed cross sections, showing the actual lithology and facies distributions for each of the wells is presented in Appendix A.
All the primary post-basalt stratigraphic units are present beneath the 200 West Area, including the Ringold Formation, CCU and Hanford formation (Table 3.1). The general three-dimensional distribution of these units within LLBG WMA-3 and WMA-4 is shown by the fence diagram for WMA T-TX-TY (Figure 3.1), located just east of the 200 West LLBG’s. In terms of unit thickness, the vadose zone is roughly split between the Ringold Formation and the Hanford formation that are divided by a thinner CCU. However, relative unit thicknesses vary somewhat in the LLBG particularly from north to south.
A total of three cross sections are represented for LLWMA-3 (Figure 3.2). One of these cross sections (A-A’) extends southward across LLWMA-4 as well.
The upper unconfined aquifer and lower vadose zone lie within ancestral river gravels of the Ringold Formation, Unit E (Member of Wooded Island). This unit dips to the southwest toward the axis of the Cold Creek Syncline, which lies south of the 200 West Area. Because of the Cold Creek Syncline the Ringold Unit E is thicker to the south (300 ft) than to the north (200 ft). Similarly, in the northern 200 West Area, Ringold Unit E extends over 120 ft above the maximum water table while to the south it only extends to within 40 ft above the maximum water table (Figure 3.3). The maximum water table used here is that measured in groundwater monitoring wells since the 1940’s.
Table 3.1. Stratigraphic Terminology for the Vadose Zone and Upper Unconfined Aquifer Beneath the 200 West Area LLBG
Stratigraphic Symbol Formation Facies / Subunit Description Genesis
Backfill NA Backfill
GD sequence consisting of poorly to moderately sorted cobbles, pebbles, and coarse to medium sand with some silt derived from coarse-grained Hanford formation (H1 Unit) excavated around tanks and trenches.
Anthropogenic
H1a Unit H1a (SD facies association)
SD flood sequence composed of mostly horizontal to tabular cross-bedded sand to pebbly sand. Some sand beds capped with thin layers of silty sand to sandy silt.
Cataclysmic flood deposits (moderate energy)
H1 Unit H1 (GD facies association)
GD flood sequence composed of mostly poorly sorted, basaltic, sandy gravel to silty sandy gravel.
Cataclysmic flood deposits (high-energy)
H2
Hanford formation
Unit H2 (SD facies association)
SD flood sequence composed of mostly horizontal to tabular cross-bedded sand to pebbly sand. Some sand beds capped with thin layers of silty sand to sandy silt.
Cataclysmic flood deposits (moderate energy)
3.1

Table 3.1. (contd)
Stratigraphic Symbol Formation Facies / Subunit Description Genesis
CCUu Upper subunit
Silty sequence consisting of massive to interstratified, well sorted silt and fine sand. Uncemented but may be moderately to strongly calcareous from detrital CaCO3. Equivalent to the “early Palouse soil” (Brown 1970; Tallman et al. 1979; DOE 1988; and DOE-GJO 1997) and the Hanford Formation(?)/Plio-Pleistocene (?) deposits (H/PP) of Wood et al. (2001). Also equivalent to the upper Plio-Pleistocene unit (Lindsey et al. 2001; Sobczyk 2001) and the fine-grained, laminated to massive [CCUf(lam-msv)] lithofacies of the Cold Creek unit (DOE 2002). Same as PPu of Lindsey et al. (2001).
Post-Ringold Fm. eolian and/or overbank alluvial deposits
CCUl
Cold Creek unit
Lower subunit
Calcic paleosol sequence, consisting of interbedded layers of pedogenically altered to unaltered gravel, sand, silt, and/or clay, cemented together with one or more layers of secondary CaCO3, originally referred to as “caliche” (Brown 1959). Since then the name has evolved from the Plio-Pleistocene unit (Bjornstad 1984, DOE 1988, DOE-GJO 1997, Slate 2000), the Plio-Pleistocene calcrete facies (DOE 1988, Wood et al. 2001), the lower Plio-Pleistocene unit (Lindsey et al. (2001), and the coarse- to fine-grained, CaCO3-cemented lithofacies [CCUc-f(calc)] of the Cold Creek unit (DOE 2002). Same as PPc of Lindsey et al. (2001).
Calcic paleosols developed on eroded Ringold or post-Ringold Fm. eolian and/or fluvial deposits
Rtf Member of Taylor Flat
Fine-grained Ringold Formation sequence consisting of interstratified, well bedded fine to coarse sand to silt. Equivalent to the upper Ringold unit (DOE 1988).
Ancestral Columbia River System fluvial channel, crevasse splay, and/or overbank deposits
Rwie
Ringold Formation
Member of Wooded Island, Unit E
Coarse-grained Ringold Formation sequence, consisting of mostly moderately sorted, quartzitic sandy gravel to silty sandy gravel. Equivalent to middle Ringold unit (DOE 1988) and the Ringold Unit E gravels (Wood et al. 2001; Lindsey et al. 2001) .
Ancestral Columbia River System fluvial, braided-stream deposits
3.2

Figure 3.1. Fence Diagram Showing the Relationship Between Stratigraphic Units at the T, TX, and TY
WMA (from Reidel and Chamness 2007). The T-TX-TY WMA is located between and just east of the 200-West LLBG.
Figure 3.2. Location of Geologic Cross Sections Within LLWMA-3.
3.3

Figure 3.3. Cross Section is Located in Figure 1.1.
3.4

Locally overlying (or facies equivalent with) Ringold Unit E lies a sequence of finer grained fluvial deposits (mostly sand and silt) of the Ringold Formation, member of Taylor Flat (Rtf) (Figures 3.3 through 3.5). These deposits, up to 40 ft thick, are more often present beneath LLWMA-3 and mostly absent from the LLWMA-4 in the southern 200 West Area (Figure 3.3).
Superimposed onto the eroded Ringold Formation is a weathered calcic paleosol (i.e., caliche), part of the lower CCU. This white, carbonate-cemented unit, which represents the old, buried land surface prior to the onset of Pleistocene Ice Age flooding, dips prominently to the southwest atop a paleoslope that dips gently toward the ancestral Cold Creek channel (see Figure 2.2).
The character and thickness of the lower CCU changes considerably in the 200 West Area from north to south. In the northern 200 West area (LLWMA-3) the calcic paleosol developed on the finer grained Ringold deposits of the Taylor Flat Member (Rtf), while to the south (LLWMA-4) it formed exclusively on top of the eroded Ringold Unit E gravels. At the southern end of LLWMA-4, the caliche forms a single massive layer about 15 ft thick. At the northern end of the 200 West Area, on the other hand, the lower CCU is split into two distinct calcic layers separated by noncalcareous interval, for a total thickness of ~50 ft (Appendix A-1). In between, in the southeast portion of LLWMA-3, the lower CCU pinches down to a single caliche layer as little as 5 ft thick (Figure 3.3).
Immediately overlying the calcic paleosol of the lower CCU is an unconsolidated sequence of relatively uniform, fine-grained, well-sorted, yellowish-brown silt and fine sand of the upper CCU. The upper CCU generally thins from 25 ft at the southern end of LLWMA-4 to as little as a few feet north of LLWMA-3, although some variations in thickness occur along this trend (Figure 3.3). Because of the pronounced dip on the CCU, the CCU surface rises steadily northward to within 25 ft of the present-day ground surface north of LLWMA-3, while the same strata lie deeply buried beneath as much as 150 ft of flood deposits (Hanford formation) at the south end of LLWMA-4 (Figure 3.3).
Ice Age flood deposits (Hanford formation) blanket the CCU everywhere in the 200 West Area LLBG. To the north the flood deposits are composed exclusively of high-energy (GD facies) sandy gravel to silty sandy gravel (Appendix A-1 and A-2). The GD sequence may contain large cobbles and boulders (e.g., 299-W7-10, Appendix A-2) due to its close proximity to a major flood channel that trends along the northern boundary of the 200 West Area. To the south, coarse flood deposits are increasingly interbedded with SD facies deposits. Some ISSD facies may be present at the southern end of LLWMA-4 (e.g., 299-W18-22 and -23; Appendix A-1).
The thickness of the Hanford formation varies significantly from north to south in the 200 West LLBG’s due to south-dipping CCU surface. Flood deposits range from 150 ft thick to the south in well 299-W15-23 (LLWMA-4) to 30 ft thick in well 299-W7-5 at the northern boundary of LLWMA-3 (Figure 3.3).
GD facies of the Hanford formation that underlies the northern portion of LLWMA-3 is also designated as the Hanford formation H1 unit (Lindsey et al. 1994; Wood et al. 2001; Reidel and Chamness 2007). In the central and southern portions of the 200 West Area (including LLWMA-4), the GD facies transitions into a single GD sequence (H1), lying between an upper (H1a) and lower (H2) SD sequence (Figure 3.3). Because finer-scaled gravel and sand interbeds frequently occur within both the GD and SD Hanford formation
3.5

Figure 3.4. Geologic Cross Section B-B’ through a portion of LLWMA-3. Seven special hydraulic-
parameter samples collected from borehole 299-W7-9 are shown
3.6
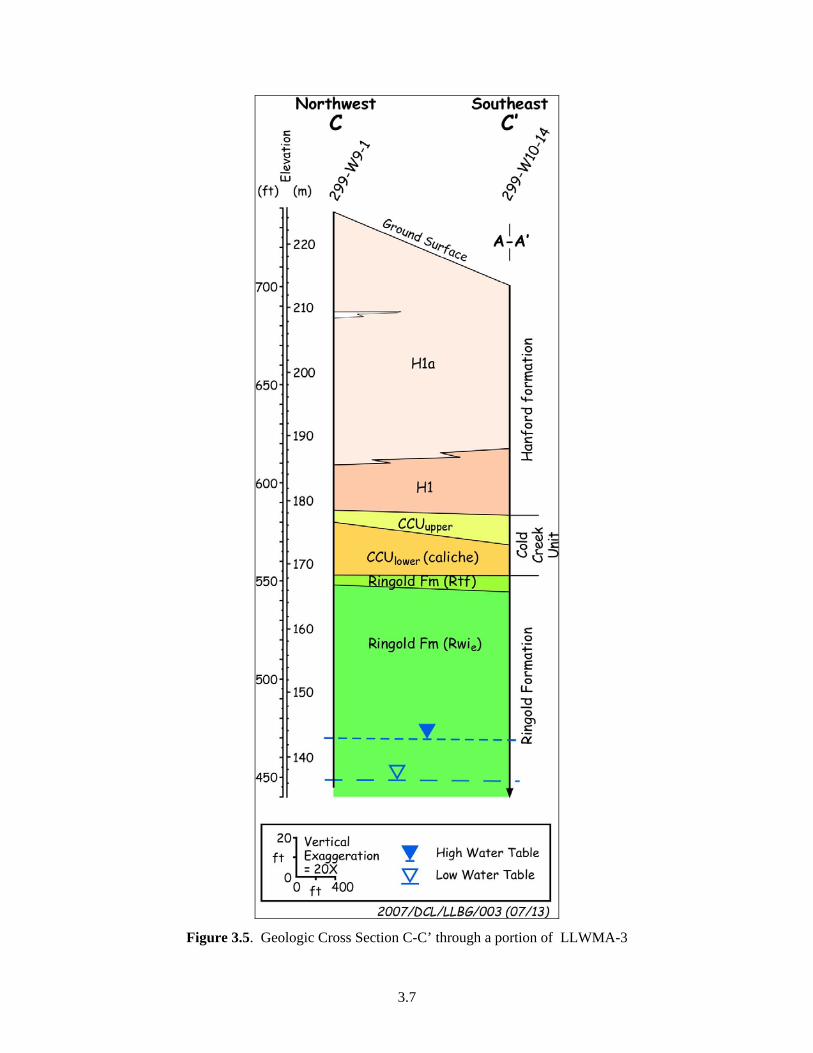
Figure 3.5. Geologic Cross Section C-C’ through a portion of LLWMA-3
3.7

(Appendix A-1), choosing the contacts between them is rather subjective and arbitrary, however, and individual investigators have rarely been in agreement on where to draw the boundaries separating these units.
The distribution of GD vs. SD facies during flooding appears to be a function of proximity to migrating flood channels that swept across Cold Creek Bar during flooding and elevation with respect to these channels. At lower elevations the channels were cut and filled with GD flood deposits, while areas between channels or higher channels were filled or blanketed, with SD flood deposits. The erratic and uneven nature of the surfaces between Hanford formation units (Figure 3.3, Appendix A-1, A-4) is a reflection of the inherently complex depositional environment within a network of migrating, braided channels that existed during repeated Ice Age cataclysmic floods.
In the southwestern portion of LLWMA-3 (Figure 3.5), SD deposits are missing from the bottom of the Hanford formation, so that only a relatively thin GD sequence (H1 unit) lies beneath a thicker SD sequence (H1a unit).
Stratigraphic units and trends observed in LLWMA-4 are similar to those in LLWMA-3. The proportion of Hanford formation to Ringold Formation in the vadose zone, however, is greater for LLWMA-3 relative to LLWMA-4, due to the constant southerly dip of the Ringold Formation and CCU beneath the LLBG’s. A map showing LLWMA-4 and the two cross sections represented in this area is presented in Figure 3.6. Similar to the southern portion of LLWMA-3, the Hanford formation in LLWMA-4 consists of an upper (H1a) and lower (H2) SD sequence, separated by a GD sequence (H1). An exception to this order occurs in well 299-W15-94 (Figure 3.7), which appears to show the opposite order (two GD sequences separated by a SD sequence) (see detailed cross section D-D’ in Appendix A-4). There appears to be no correlation in the Hanford formation between the two closely spaced wells in this cross section. This serves to illustrate the highly variable and discontinuous nature of Hanford formation units, even over short distances.
The concentration of clastic dikes in the 200 West LLBG’s probably increases to the south as the sediments become finer, which is more conducive to clastic-dike development. Therefore, LLWMA-4 probably contains more regular, polygon-forming dikes than the overall coarser-grained LLWMA-3. However, some randomly distributed dikes may occur in the coarse-grained flood deposits (GD facies = H1 unit) of LLWMA-3.
3.8

Figure 3.6. Location of Geologic Cross Sections Within LLWMA-4
3.9

Figure 3.7. Geologic Cross Section D-D’ through a portion of LLWMA-4
3.10

4.0 Geologic Descriptions for the Solid-Waste Low Level Burial Grounds: 200 East Area
This section provides a geologic description of the unconfined aquifer and vadose zone beneath LLBG WMA-1 and WMA-2 within the 200 East Area. Two simplified and generalized cross sections are also presented in this section. More detailed cross sections, showing the actual lithology and facies distributions for each of the boreholes is presented in Appendix A.
The only post-basalt stratigraphic unit present beneath the 200 East Area LLBG’s is the Hanford formation (Table 4.1). The Hanford formation in the 200 East Area has been subdivided into upper (H1) and lower (H3) GD units, separated by a SD unit (H2). The general three-dimensional distribution of these units within LLWMA-1 and LLWMA-2 is shown by the B-BX-BY WMA, located between LLBG WMA-1 and -2 (Figure 4.1). Unlike the 200 West Area stratigraphy, the Ringold Formation and CCU are generally absent under the 200 East Area LLBG.
The Ringold Formation at one time covered this area, but most of it was likely eroded during a period of post-Ringold incision in the late Pliocene Epoch. While some deposits from CCU time appear to be present beneath the B-BX-BY WMA, these too appear to be have been completely eroded from beneath the 200 East LLBG’s, probably during Ice Age flooding, which stripped off all the pre-existing sediments down to the basalt bedrock and subsequently backfilled this area with cataclysmic flood deposits of the Hanford formation.
Four out of five wells at LLWMA-2 used to construct cross section X-X’ (Figure 4.2) encountered the top of basalt. Above basalt, only the Hanford formation appears to be present.
The three Hanford formation units (H1, H2, H3) present beneath the 200 East Area LLBG do not necessarily correlate with units of the same designation within the 200 West Area. The designation is based very loosely on gross lithology (GD [H1 and H3] vs. SD [H2]). Considering the complex hydrodynamics that occurred during flooding and the high degree of inherent heterogeneity observed within the Hanford formation direct one to one correlation between the two areas is unlikely.
The presence of GD vs. SD deposits during flooding is a function of location of migrating flood channels that swept across Cold Creek Bar during flooding and elevation with respect to these channels. At lower elevations the channels were cut and filled with GD flood deposits, while areas between channels or higher-elevation channels were filled, or blanketed, with SD flood deposits. The erratic and uneven surfaces between Hanford formation units in Figure 4.2 reflects the complex nature of channeling and deposition during Ice Age floods. In general, at both LLWMA-1 and -2. a sequence of SD flood sequence (H2) appears to separate a lower (H3) from an upper (H1) GD sequence. An unknown quantity of the GD H3 unit may be equivalent to the mainstream alluvial facies of the CCU (DOE 2002).
The lack of any SD deposits (H2 unit) at well 299-E34-7 suggests a high-energy flood channel persisted here during deposition of the Hanford formation.
4.1

Table 4.1. Stratigraphic Terminology for the Vadose Zone and Upper Unconfined Aquifer Beneath the 200 East Area LLBG.
Stratigraphic Symbol Formation Facies / Subunit Description Genesis
Bacfill NA Backfill
Poorly to moderately sorted cobbles, pebbles, and coarse to medium sand with some silt derived from coarse-grained Hanford formation (H1 Unit) excavated around tanks and trenches (Price and Fecht 1976a)
Anthropogenic
H1 Unit H1
Upper sandy gravel to gravelly sand sequence. Equivalent to the H1 unit discussed by Lindsey et al. (1994, 2001) , the upper gravel sequence discussed by Last et al. (1989) and Lindsey et al. (1992), and the Qfg documented by Reidel and Fecht (1994). Excavated out and missing from most of B Tank Farm.
Cataclysmic flood deposits (high energy)
H2 Unit H2
SD sequence consisting predominantly of SD facies, with multiple graded beds of horizontal to tabular cross-bedded sand to slightly gravelly sand. Graded beds sometimes capped with thin layers of silty sand to silt. Equivalent to H2 unit of Wood et al. (2000) and Lindsey et al. (1994, 2001), the sandy sequence of Last et al. (1989) and Lindsey et al. (1992), and to Qfs documented by Reidel and Fecht (1994).
Cataclysmic flood deposits (moderate energy)
H3
Hanford formation
Unit H3
Lower sandy gravel to gravelly sand sequence. Equivalent to the H3 unit of Lindsey et al. (1994, 2001) lower gravel sequence discussed by Last et al. (1989) and Lindsey et al. (1992), and the Qfg documented by Reidel and Fecht (1994).
Cataclysmic flood deposits (high energy)
4.2

Figure 4.1. Fence Diagram Showing the Relationship Between Stratigraphic Units at the B, BX, and BY
WMA (from Reidel and Chamness 2007). The B-BX-BY WMA is located between LLWMA-1 and -2 Solid-Waste LLBG (see Figure 1.2).
4.3

Figure 4.2. Geologic Cross Section X-X’ through LLWMA-2. Seven special hydraulic-parameter
samples collected from borehole 299-E34-1 are shown. Location of cross section X-X’ is presented in Figure 4.
4.4

Figure 4.3. Location of Cross Section X-X’ in LLWMA-2. Cross section X-X’ is shown on Figure 4.2
Comparable to LLWMA-2, LLWMA-1 located in the northwest corner of the 200 East Area contains a similar sequence of two Hanford formation GD sequences separated by an SD sequence (Figure 4.). While the top of basalt was not encountered in the boreholes represented in cross section Y-Y’, bedrock is probably within a few feet below the bottoms of the boreholes. Nearby wells do not indicate any pre-Hanford formation deposits in this area above basalt bedrock. The SD H2 unit appears to be the thickest unit (<160 ft) beneath LLWMA1 with lesser amounts of GD H1 (~50 ft) and H3 (>70 ft). The contacts between the H1 and H2 units appear to dip eastward. An unknown quantity of the GD H3 unit may be equivalent to the mainstream alluvial facies of the CCU (DOE 2002).
A few clastic dikes may exist within the 200 East LLBG’s. Most of these may be restricted to the SD H2 unit, which lies several tens of feet or more below the surface at the LLBG’s, although a few random dikes may cut through the GD deposits of the H1 and/or H3 units. The quantity of dikes to be expected may be about the same as the northern part of LLWMA-3 in the 200 West Area, however, it is probably significantly less than that of the LLWMA-4 in the southern 200 West Area or southern 200 East Area.
4.5

Figure 4.4. Geologic Cross Section Y-Y’. Six special hydraulic-parameter samples collected from
borehole 299-E32-4 are shown. Cross section is located in Figure 4..
4.6

Figure 4.5. Location of Cross Section Y-Y’ in LLWMA-1. Cross section Y-Y’ is shown on Figure 4.4.
4.7


5.1
5.0 Data Availability and Quality
A listing of the wells used in the cross sections appears in Table 5.1. Wells were selected based on 1) their strategic location with respect to contaminated hot spots within the LLBG, 2) penetrated depth, and 3) data quality. Data used to interpret lithology and stratigraphy, listed by usefulness, included: 1) geologist logs, 2) gamma logs, 3) grain-size data, 4) CaCO3 content, and 5) % moisture, and lastly 6) drillers log. Quality of the data varies widely. For most wells only a few types of data were collected; rarely were all data types represented.
Another factor in considering the quality of the data is the drill method used. Using a hard tool during cable-tool drilling, rotary, or Becker hammer methods pulverize the sediment before bringing to the surface. This can lead to significant misinterpretations of sediment lithology, resulting in misleading information recorded on geologic and drillers logs. For this reason those holes drilled predominantly via drive barrel or other coring techniques, are considered more representative of the true formation and given a higher quality ranking.

Table 5.1. Boreholes Used for LLBG Cross Sections
Area Cross
Section Well # Easting Northing Disc_Z Elev.
(m) Elev. (ft) TD (ft) Data
Availablea%
cored Quality
Rankingb
200W A 699-48-77A 566413.228 137968.857 205.92 675.60 457.70 G, Gm, Cc, M 29 3 A, B 299-W7-5 566476.026 137635.688 205.44 674.01 229.00 G, Gm, Cc, M 4 3 A 299-W7-4 566408.771 137308.243 205.02 672.63 235.00 G, Gm, Cc, M 2 3 A 299-W10-19 566346.190 137037.140 208.35 683.55 238.30 G, Gm 67 2 A 299-W10-31 566266.440 136968.340 209.67 687.88 279.80 G, Gm 0 3 A 299-W10-20 566249.695 136866.607 209.75 688.16 251.00 G, Gm 6 3 A 299-W10-29 566082.980 136828.740 211.62 694.30 287.20 G,Gm 0 3 A 299-W10-30 566082.780 136739.330 210.86 691.81 283.00 G, Gm 0 3 A, C 299-W10-14 566017.194 136608.895 213.57 700.70 462.00 G, Gs, Cc 4 3 A 299-W15-2 566093.762 136336.237 212.41 (1) 693.41 261.00 Gs, D 0 4 A 299-W15-20 566082.884 135964.193 213.07 699.04 245.00 G, Gm 53 2 A 299-W15-23 566083.652 135858.130 213.33 699.89 240.00 G, Gm 29 3 A 299-W15-15 566088.805 135751.493 213.16 699.35 255.00 G, Gm, Gs, Cc 12 3 A, D 299-W15-14 566093.439 135648.274 213.87 (2) 698.19 581.00 G, Gs, Cc 83 2 A 299-W18-26 566091.276 135491.707 213.24 699.62 249.90 G, Gm 40 3 A 299-W18-23 566084.533 135342.438 212.85 698.34 255.00 G, Gm, Gs, Cc 25 3 A 299-W18-27 566090.189 135226.541 210.34 690.09 238.50 G, Gm, Cc, M 74 2 A 299-W18-28 566092.569 135106.788 207.21 679.83 230.10 G, Gm, Cc, M 65 2 A 299-W18-22 566088.632 134990.157 204.25 670.11 455.00 G, Gm, Gs, Cc 0 3 B 299-W8-1 565749.422 137646.639 214.29 703.05 270.50 G, Gm 0 3 B 299-W7-9 565844.438 137646.402 211.14 692.71 252.20 G, Gm 56 2 B 299-W7-1 565932.047 137647.125 210.97 692.15 245.00 G, Gm, Cc, M 14 3 B 299-W7-12 566040.800 137636.300 209.74 688.14 245.00 G, Gm, Cc, M 72 2 B 299-W7-11 566186.200 137636.000 207.72 681.51 234.50 G, Gm, Cc, M 77 2 B 299-W7-3 566292.031 137638.641 206.45 677.33 476.70 G, Gm, Cc 2 3 B, A 299-W7-5 566476.026 137635.688 205.44 674.01 229.00 G, Gm, Cc, M 4 3 B 299-W7-10 566858.212 137457.533 210.43 690.39 244.20 G, Gm 4 3 C 299-W9-01 565657.655 137023.769 225.24 738.96 295.00 G, Gm, Cc, M 19 3 C, A 299-W10-14 566017.194 136608.895 213.57 700.70 462.00 G, Gs, Cc 4 3 D, A 299-W15-14 566093.439 135648.274 213.87 (2) 698.19 581.00 G, Gs, Cc 83 2 D 299-W15-94 566307.580 135640.340 209.41 687.04 278.00 G, Gm 0 3
5.2

Table 5.1. (contd)
5.3
Area Cross
Section Well # Easting Northing Disc_Z Elev.
(m) Elev. (ft) TD (ft) Data
Availablea%
cored Quality
Rankingb
200E Y 299-E32-04 572603.743 137187.218 209.78 688.25 311.00 G 55 3 Y 299-E28-28 572804.351 137108.259 210.354 (3) 687.14 296.00 G, Gm 88 2 Y 299-E33-29 573227.858 137231.193 205.75 675.04 290.50 G, Gm 66 2 X 299-E34-09 574186.020 137429.820 191.82 629.31 234.50 G, Gm, Cc, M 100 1 X 299-E34-01 574642.672 137238.168 192.14 630.37 245.00 D 86 4 X 299-E34-03 575110.254 137301.437 186.86 613.06 213.90 G, Gm, Gs 5 3 X 299-E34-07 575274.184 137357.745 184.32 604.71 205.50 G, Gm 10 3 X 299-E35-01 575459.729 137464.956 182.52 598.82 193.80 G, Gm 13 3
Disc_Z* = Survey point is Brass Cap in concrete pad (1) = Elev. (ft) is 696.90-ft TOC - 3.48-ft Stick-up (01-30-02) (2) = Elev. (ft) is 701.70-ft TOC - 2.8-ft Stick-up (07-13-04) (3) = Elev. (ft) is 690.13-ft TOC - 3.0 Stick-up (04-17-90) a G=geologist log, Gm = gamma log, Gs = grain size, Cc = calcium carbonate, M = moisture, D = drillers log b 1= highest quality/confidence; 4 = lowest quality/confidence


6.0 References
Baker, V. R., B. N. Bjornstad, A. J. Busacca, K. R. Fecht, E. P. Kiver, U. L. Moody, J. G. Rigby, D. F. Stradling, and A. M. Tallman, 1991, “Quaternary Geology of the Columbia Plateau,” in Quaternary Nonglacial Geology Conterminous U.S., Vol. K-2, pp. 215-250, R. B. Morrison (ed.), Geological Society of America, Boulder, Colorado.
Bjornstad, B. N., 1990, Geohydrology of the 218-W-5 Burial Ground, PNL-7336, Pacific Northwest Laboratory, Richland, Washington.
Bjornstad, B.N., K.R. Fecht, and C.J. Pluhar, 2001, Long history of Pre-Wisconsin, Ice Age cataclysmic floods: evidence from southeastern Washington State, Journal of Geology, v. 109, p. 695-713.
Bjornstad, B.N., 2006, On the Trail of the Ice Age Floods: A Geological Field Guide to the Mid-Columbia Basin, Keokee Co. Publishing, Inc., Sandpoint, Idaho, 307 p.
Brown, D. J., 1959, Subsurface Geology of the Hanford Separation Areas, HW-61780, General Electric Company, Richland, Washington.
Brown, D. J.,1960, An Eolian Deposit Beneath the 200 West Area, HW-67549, General Electric Company, Richland, Washington.
Connelly, M.P., B.H. Ford, and J.V. Borghese, 1992a, Hydrogeologic Model for the 200 West Groundwater Aggregate Area, WHC-SD-EN-TI-014, Westinghouse Hanford Company, Richland, Washington.
Connelly, M.P., J.V. Borghese, C.D. Delaney, B.H. Ford, J.W. Lindberg, and S.J. Trent, 1992b, Hydrogeologic Model for the 200 East Groundwater Aggregate Area, WHC-SD-EN-TI-019, Westinghouse Hanford Company, Richland, Washington.
U.S. Department of Energy (DOE). 2002. Standardized Stratigraphic Nomenclature for Post-Ringold-Formation Sediments Within the Pasco Basin. DOE/RL-2002-39, U.S. Department of Energy, Richland Operations Office, Richland Washington.
Fecht, K.R., B.N. Bjornstad, D.G. Horton, G.V. Last, S.P. Reidel, and K.A. Lindsey, 1999, Clastic injection dikes of the Pasco Basin and vicinity: geologic atlas series, BHI-01103, Rev. 0, Bechtel Hanford Company, Richland, Washington.
Gile, L. H., F. F. Peterson, and R. B. Grossman, 1966, “Morphologic and Genetic Sequences of Carbonate Accumulation in Desert Soils,” Soil Sci. 101:347-360.
Last, G. V., B. N. Bjornstad, M. P. Bergeron, D. W. Wallace, D. R. Newcomer, J. A. Schramke, M. A. Chamness, C. S. Cline, S. P. Airhart, and J. S. Wilbur, 1989, Hydrogeology of the 200 Areas Low-Level Burial Grounds – An Interim Report, PNL-6820, 2 Vols., Pacific Northwest Laboratory, Richland, Washington.
1
Lindsey, K.A., 1995, Miocene-to Pliocene-Aged Suprabasalt Sediments of the Hanford Site, South-Central Washington, BHI-00184, Bechtel Hanford Incorporated, Richland, Washington.
Lindsey, K. A. 1996, The Miocene to Pliocene Ringold Formation and Associated Deposits of the Ancestral Columbia River System, South-Central Washington and North-Central Oregon, Open File Report 96-8, Washington State Department of Natural Resources, Olympia, Washington.
Lindsey, K.A., J.L. Slate, G.K Jaeger, K.J. Swett, and R.B. Mercer, 1994, Geologic Setting of the Low-Level Burial Grounds, WHC-SD-EN-TI-290, Rev. 0, Westinghouse Hanford Company, Richland, Washington.
Machette, M. N., 1985, “Calcic Soils of the Southwestern United States,” in Soils and Quaternary Geology of the Southwestern United States, D. L. Weide (ed.), Special Paper No. 203, pp. 1-21, Geological Society of America, Boulder, Colorado.
Pluhar, C.J., B.N. Bjornstad, S.P. Reidel, R.S. Coe, and P.B. Nelson, 2006, Magnetostratigraphic evidence from the Cold Creek bar for onset of ice-age cataclysmic floods in eastern Washington during the Early Pleistocene, Quaternary Research, v. 65, p. 123-135.
Reidel, S.P. and M.A. Chamness, 2007, Geology Data package for the Single-Shell Tank Waste Management Areas at the Hanford Site, PNNL-15955, Pacific Northwest National Laboratory, Richland, Washington.
Slate, J. L., 1996, “Buried Carbonate Paleosols Developed in Pliocene-Pleistocene Deposits of the Pasco Basin, South-Central Washington, U.S.A.,” Quat. Inter. 34-36: 191-196.
Slate, J. L., 2000, Nature and Variability of the Plio-Pleistocene Unit in the 200 West Area of the Hanford Site, BHI-01203, Rev. 0, Bechtel Hanford, Inc., Richland, Washington.
Smith, G. A., 1993, “Missoula Flood Dynamics and Magnitudes Inferred from Sedimentology of Slack-Water Deposits on the Columbia Plateau,” Geol. Soc. of Am. Bul. 195:77-100.
Tallman, A. M., K. R. Fecht, M. Marratt, and G. V. Last, 1979, Geology of the Separations Areas, Hanford Site, South-Central Washington, RHO-ST-23, Rockwell Hanford Operations, Richland, Washington.
Williams, B. A., B. N. Bjornstad, R. Schalla, and W. D. Webber, 2000, Revised Hydrogeology for the Suprabasalt Aquifer System, 200-East Area, Hanford Site, Washington, PNNL-12261, Pacific Northwest National Laboratory, Richland, Washington.
Williams, B. A., B. N. Bjornstad, R. Schalla, and W. D. Webber, 2002, Revised Hydrogeology for the Suprabasalt Aquifer System, 200-West Area, Hanford Site, Washington, PNNL-13858, Pacific Northwest National Laboratory, Richland, Washington.
Wood, M. I., R. Schalla, B. N. Bjornstad, and S. M. Narbutovskih, 2000, Subsurface Conditions Description of the B-BX-BY Waste Management Area, HNF-5507, Rev. 0, CH2M Hill Hanford Group, Inc, Richland, Washington.
2

Wood, M. I., T. E. Jones, R. Schalla, B. N. Bjornstad, and F. N. Hodges, 2001, Surface Conditions Description of the T-TX-TY Waste Management Area, RPP-7123, CH2M Hill Hanford Group, Inc., Richland, Washington.
3