Embed Size (px)
Citation preview
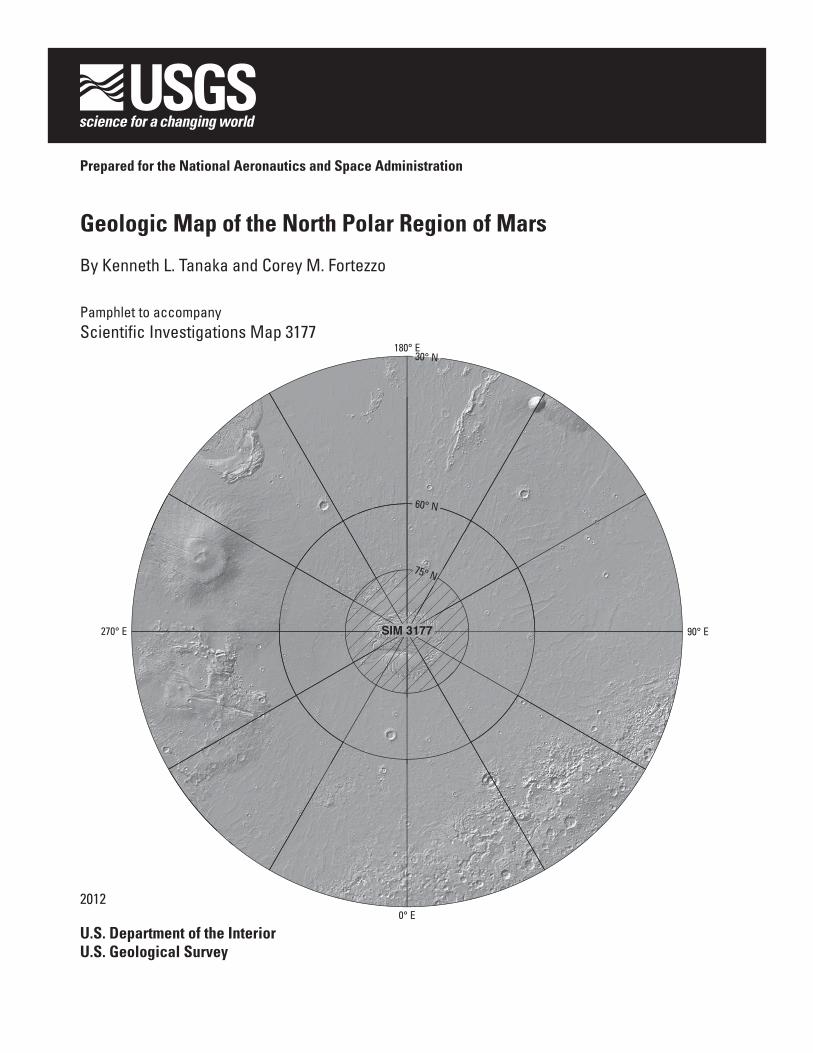
180° E
0° E
30° N
75° N
60° N
90° E270° E SIM 3177
2012
U.S. Department of the InteriorU.S. Geological Survey
Prepared for the National Aeronautics and Space Administration
Geologic Map of the North Polar Region of Mars
By Kenneth L. Tanaka and Corey M. Fortezzo
Pamphlet to accompanyScientific Investigations Map 3177

This page intentionally left blank
i
ContentsIntroduction ....................................................................................................................................................1Geography ......................................................................................................................................................1Base Map and Data ......................................................................................................................................2Methodology ..................................................................................................................................................3Age Determinations ......................................................................................................................................4Geologic Summary ........................................................................................................................................4
Hesperian Period .................................................................................................................................4Early Amazonian Epoch ......................................................................................................................5Middle Amazonian Epoch (?) .............................................................................................................5Late Amazonian Epoch .......................................................................................................................6
References Cited ...........................................................................................................................................7
Tables1. Map units in the Planum Boreum region of Mars: Areas, crater densities, relative and model
absolute ages, and superposition relations. ...........................................................................102. Mapped features. ...................................................................................................................................113. Crater types distinguished in figure 7. ................................................................................................11
Figures1. Shaded-relief view of Mars Global Surveyor (MGS) Mars Orbiter Laser Altimeter (MOLA)
digital elevation model (DEM) of the map region (230 m/pixel; also version at 115 m/pixel used in mapping), which forms the primary map base (map sheet)
2. Mars Reconnaissance Orbiter (MRO) Context Camera (CTX) image mosaic (constructed at 6.2 m/pixel; version provided here is 24 m/pixel due to size) of the Planum Boreum region of Mars in Polar Stereographic projection (map sheet)
3. Mars Odyssey (ODY) mission Thermal Emission Imaging System (THEMIS) visual-range image mosaics of the Planum Boreum region in Polar Stereographic projection (courtesy of P.R. Christensen, Arizona State University) (map sheet)
4. Plot showing locations of Mars Global Surveyor (MOC) (>3 m/pixel) and Mars Reconnaissance Orbiter (HiRISE) (25 cm/pixel) images in the map region obtained during all seasons and released as of May 2009, on a background showing the topography in shaded relief based on the MOLA DEM (map sheet)
5. Composite mosaic of three color images acquired by the Mars Reconnaissance Orbiter Mars Color Imager (MARCI) on October 16th of 2006 during Martian northern summer, solar longitude, Ls = 121° (map sheet)
6. Map of unconformities (red lines) and grabens (black lines with balls in box) in Planum Boreum 1 unit and Planum Boreum 3 unit at full map scale to show detail (map sheet)
7. Plot showing the distribution of impact craters > 2 km in diameter in the map region (see table 3 regarding morphologic and other characteristics) (map sheet)
8. Graphs showing crater size-frequency distributions of impact craters in the map region for the Planum Boreum rupēs unit (red data) (map sheet)

This page intentionally left blank
1
IntroductionThe north polar region of Mars occurs within the cen-
tral and lowest part of the vast northern plains of Mars and is dominated by the roughly circular north polar plateau, Planum Boreum. The northern plains formed very early in Martian time (Nimmo and Tanaka, 2005; Frey, 2006) and have collected volcanic flows and sedimentary materials shed from highland sources (Tanaka and others, 2005b). Planum Boreum has resulted from the accumulation of water ice and dust particles (Thomas and others, 1992; Byrne, 2009). Extensive, uncratered dune fields adjacent to Planum Boreum attest to the active and recent transport and accumulation of sand (Bourke and others, 2008).
Earlier geologic maps of the north polar region are largely based on Viking data and vary in scale from local 1:500,000-scale quadrangles (Dial and Dohm, 1994; Herkenhoff, 2003) to regional 1:5,000,000- (Dial, 1984) and global 1:15,000,000-scale products (Tanaka and Scott, 1987). The most recent formal map covering the region is at 1:15,000,000 scale and used topography and image data from the Mars Global Surveyor and Mars Odyssey missions (Tanaka and others, 2005b), and part of Planum Boreum, Mars Transverse Merca-tor quadrangle 85200 (Skinner and Herkenhoff, 2012) was prepared coincident with this map at 1:500,000 scale using the same datasets herein. In addition, dune forms and migration directions derived from them were mapped by Tsoar and others (1979) using Viking images. Tanaka and Hayward (2008) remapped migration directions and measured local dune spatial densities based on higher resolution post-Viking images. A pre-liminary, page-size version of our map was presented in Tanaka and others (2008).
Our geologic map of Planum Boreum is the first to record this feature’s entire observable stratigraphic record using the various post-Viking image and topography datasets released up until 2009. We also provide much more detail in the map over what was presented by Tanaka and others (2008), including some substantial revisions based on new data and observations. The available data have increased and improved immensely in quantity, resolution, coverage, positional accuracy, and spectral range, enabling us to resolve previously unrecognized geo-morphic features, stratigraphic relations, and compositional information. We also employ more carefully prescribed and effective mapping methodologies and digital techniques as well as formatting guidelines effective at submission (Tanaka and others, 2010). The foremost aspect to our mapping approach is how geologic units are discriminated based primarily on their temporal relations with other units as expressed in unit contacts by unconformities or by gradational relations. Whereas timing constraints of such activity in the north polar region are now better defined stratigraphically, they remain poorly constrained chronologically. The end result is a new reconstruction of the sedimentary, erosional, and structural histories of the north polar region, and how they may have been driven by climate conditions, available geologic materials, and eolian, periglacial, impact, magmatic, hydrologic, and tectonic activity (see Geo-logic Summary).
Geography1
The north polar region lies within the northern lowlands of Mars, which include three regional topographic basins. The largest and deepest of the lowland basins has an irregular shape, contains the north polar region, and has been referred to as either the “north polar basin” (Head and others, 1999, 2002) or “Borealis basin” (Tanaka and others, 2003, 2005b). The plains surrounding Planum Boreum form Vastitas Borealis, which dis-plays hummocky textures at sub-kilometer and kilometer scales (Kreslavsky and Head, 2000; Tanaka and others, 2003) and scat-tered crater forms with surrounding ejecta that stand above the surrounding plains, commonly referred to as “pedestal craters” (for example, Mouginis-Mark, 1979).
The circumpolar areas of Vastitas Borealis within the map area (north of lat 75° N.) include morphologically and topo-graphically diverse landforms. Scandia Cavi form irregularly shaped depressions tens of kilometers across and hundreds of meters deep in the northernmost part of the Scandia region, in among complex, rounded plateaus of Scandia Tholi that are tens to hundreds of kilometers across and tens to hundreds of meters high. Between the Scandia region and Planum Boreum, Olympia Planum forms a kidney-shaped rise that gently slopes overall at 0.10° to 0.15° up to where it peaks before abutting Planum Boreum along the higher standing Olympia Rupēs scarp system at ~lat 85° N. Most of lower Olympia Planum is covered by the broad Olympia Undae dune field, which extends locally into adjacent plains and depressions. Other isolated but concen-trated fields of dunes east of Olympia Planum and into Chasma Boreale make up Hyperboreae, Siton, and Abalos Undae. In this region, Abalos Colles form five prominent, flat-topped or cratered mounds <700 m high and <17 km in diameter. East of these mounds and south of Chasma Boreale, Escorial crater tops an isolated plateau that stands 500 to 700 m high. West of Olympia Planum, the irregularly shaped Olympia Mensae rise <200 m and extend 180 km north-to-south and 400 km east-to-west.
Planum Boreum makes up the ~1000 km diameter near-circular, north polar plateau at the center and lowest part of Borealis basin. The planum is slightly offset from the geographic north pole along the prime meridian, where planum extends south of lat 79° N. Mars’ north pole in the center of Planum Boreum is at an elevation of ~–2570 m, and some parts of the planum rise ~300 m higher. The topo-graphic base of the north polar plateau ranges from –5200 m (between long 300°–315° E.) to –4500 m (between long 60°–110° E.). Thus, the height of the north polar plateau reaches ~2500 to 3000 m above the surrounding plains. The volume of Planum Boreum above the surrounding plains surface amounts to about 1.1 x 10⁶ km3 (Smith and others, 2001).
Planum Boreum has a complex physiographic character. Chasma Boreale forms a 450-km-long canyon that opens up to
1Formal geographic names used in this map have been adopted by the International Astronomical Union (IAU)
2
a width of ~120 km at its mouth and divides a tongue-shaped lobe, Gemina Lingula, from the main part of Planum Boreum. The planum is carved by spiraling systems of troughs each generally between 10 and 300 km long, <20 km wide, com-monly hundreds of meters deep, and mostly asymmetric in north-south profile, with steeper, taller south-facing slopes. The troughs encircling the north pole are named Boreales Scopuli, whereas troughs that incise Gemina Lingula and the margin of Planum Boreum east of the lingula (to long 110° E.) are named Gemini Scopuli. In some areas, gently sloping, arcuate undulations tens of meters deep and roughly parallel with the trend of nearby spiral troughs also mark the planum surface (for example, Blasius and others, 1982; Rodriguez and others, 2007).
The margins of Planum Boreum vary in morphologic character. Troughs and scarps of Gemina Lingula, commonly overlapping, open out to Vastitas Borealis. The Olympia Rupēs scarp system makes up the margin of Planum Boreum along Olympia Planum and makes up the equator-facing slopes of most of the elongate depressions of Olympia Cavi. These cavi are generally 10 to 20 km wide, hundreds to more than a thousand meters deep, and tens of kilometers long. At their eastern margin, Olympia Cavi gradually deepen, lengthen, and coalesce to form Rupes Tenuis, an irregular scarp a few hundred meters to a thousand meters high that defines the outer margin of Planum Boreum between 250° and 300° E. Adjacent to and south of Rupes Tenuis is Abalos Mensa, a domical, triangular plateau ~180 km across. West of Abalos Mensa and below and parallel to Rupes Tenuis is an elongate, low-elevation, southward-sloping plateau known as Tenuis Mensa.
Boola crater (17 km in diameter and centered at lat 81.1° N., long 254.2° E.) occurs near the western termination of Rupes Tenuis. Crotone crater (6.4 km in diameter and centered at lat 82.2° N., long 290.0° E.) is along the narrow trough that separates Rupes Tenuis from Abalos Mensa. The largest crater associated with Planum Boreum is Udzha, a partly buried, 45-km-diameter impact crater that is centered at lat 81.8° N., long 77.2° E. in eastern Gemini Scopuli.
Chasma Boreale displays a complex geographic character. On its northeastern end, the chasma begins with the two arcuate depressions of Boreum and Tenuis Cavi, which display steeply sloping, high-standing southwest-facing walls. At the mouth of Chasma Boreale, the canyon floor becomes a tongue-shaped plateau, Hyperborea Lingula, which rises 200 to 350 m above adjacent Vastitas Borealis. Eastern Hyperborea Lingula is cut by several elongate depressions called Hyperborei Cavi. Pro-nounced polygonal troughs, ridges, and plateaus tens of meters in relief and kilometers in length below southwestern Hyper-borea Lingula form Hyperboreus Labyrinthus.
The polar ice caps of Mars form high-albedo features that undergo seasonal changes, particularly as carbon-dioxide frost waxes and wanes (for example, James and others, 1992). Fol-lowing maximum seasonal retreat in the summer, a water-ice cap remains over much of Planum Boreum and some outlying features, such as Olympia Mensae and parts of the Scandia region--thus defining a residual ice cap (for example, Tanaka and Scott, 1987; Martin and others, 1992).
Base Map and DataThe map is in Polar Stereographic projection from lat 75°
to 90° N. with a central meridian of long 0° E., which runs vertically from the bottom edge of the map to the pole. Longi-tude increases to the east and latitude is planetocentric (Seidel-mann and others, 2002) in accordance with current NASA and U.S. Geological Survey (USGS) cartographic standards. The topography (fig. 1) is derived from millions of measurements acquired by the Mars Orbiter Laser Altimeter (MOLA) instru-ment onboard NASA’s Mars Global Surveyor (MGS) spacecraft (Smith and others, 2001). The measurements were converted into digital elevation models (DEMs) that include a 230 m/pixel DEM for the entire map region as well as a 115 m/pixel DEM from ~lat 78° to 87° N. produced by the MOLA team. Because only sparse, less-reliable data were acquired above lat 87° N., the DEM in this area is entirely interpolated. A shaded-relief base was generated from the DEM with an incidence sun angle of 45° from horizontal, and an artificial, uniform sun azimuth from the upper left (northward along long 225° E. and south-ward along long 45° E.), and no vertical exaggeration. The DEM was then scaled to 1:2,000,000 at the north pole with a resolution of 300 dots per inch.
Post-Viking Orbiter remote-sensing missions to Mars include Mars Global Surveyor (MGS), Mars Odyssey (ODY), Mars Express (MEX), and Mars Reconnaissance Orbiter (MRO). The near-polar orbits of these spacecraft have resulted in a dense concentration of data in the map area.
The Mars Reconnaissance Orbiter (MRO) Context Camera (CTX) image mosaic that we produced as our primary image mapping base has a resolution of 6.2 m/pixel (fig. 2). Mosaic production involved geometrically and photometrically stretch-ing the images using simple and relatively rapid image process-ing techniques, which we were limited to given the available resources and the size of the task.
Gaps in CTX coverage of the plains south of Planum Boreum were mostly filled in by ODY Thermal Emission Imaging System (THEMIS) spring and summer visual (VIS) image mosaics (18–36 m/pixel) (fig. 3). The positioning of the THEMIS VIS and HRSC images generally was not sufficiently accurate for mapping, however. Thus the mapping of contacts and features appearing in these data sets required inferring their locations in the accurately positioned MOLA topographic base. Consequently, location errors of the mapping in these gaps then are generally higher than where CTX image data were available.
Important mapping observations were obtained in places using higher resolution MRO High Resolution Imaging Science Experiment (HiRISE) images (25 cm/pixel) and MGS Mars Orbiter Camera (MOC) narrow-angle images (mostly >3 m/pixel) (fig. 4). However, these data were of insufficient areal extent to serve as mapping bases.
We also consulted derived thematic maps of surface com-position, including water-ice maps produced from spectral data acquired by the MEX-borne Observatoire pour la Minéralogie, l’Eau, les Glaces, et l’Activité (OMEGA) (Langevin and others, 2005, Rodriguez and others, 2007) and the MRO-borne Com-pact Reconnaissance Imaging Spectrometer for Mars (CRISM) (Seelos and others, 2007), and a color map created using Mars
3
Color Imager (MARCI) data (Malin and others, 2008). How-ever, the surface composition of the Planum Boreum region is highly variable temporally due to waxing and waning of the residual water ice cap and the seasonal carbon dioxide frost cap, along with redistribution of dust that can occur from storm activity (Malin and others, 2008). The last product was thus the simplest product to use for the mapping of residual ice, once we georeferenced it (fig. 5), because it represented the extent of the ice cap on one summer Martian day.
MethodologyEffectively organizing, viewing, and manipulating the
available datasets for geologic mapping routinely included detailed, high-resolution analysis of key locations. To facili-tate the complicated data management involved considering the diverse types, sizes, and resolutions of the datasets used, we georegistered the raster datasets into a common projection using the geographic information system (GIS) software pack-age ArcMap 9.2 and 9.3® along with custom plug-ins. Some datasets had to be processed and (or) reprojected using U.S. Geological Survey (USGS) Integrated Software for Imagers and Spectrometers software. The GIS digital environment enabled us to navigate, enhance, and manipulate the data efficiently, as well as digitize map features within a defined and controlled spatial context. We stream digitized our original line work with a vertex spacing of ~500 m in most cases.
We mostly adopt geologic mapping methods used in and partly developed by Tanaka and others (2008). Consistent with the approach that Hansen (2000) applied to Venus mapping, we identify and map rock units and sedimentary cover on the basis of their apparent geologic uniqueness as defined by their primary (formed during emplacement) physical features, areal extent, relative age, and geologic associations. In many cases, distin-guishing primary from secondary (formed after emplacement) features requires careful observation and may be difficult and uncertain where overprinting of secondary features has masked, obliterated, or mixed with primary features. Additional general formatting standards and guidelines for planetary geologic maps that we followed are described by Tanaka and others (2010).
Our map units mostly form unconformity-bounded units (Salvatore, 1994), also known as allostratigraphic units (North American Commission on Stratigraphic Nomenclature, 1983), where a significant hiatus can be inferred between overlying and adjacent units given the unconformity between them. The types of unconformities that bound the map units include (a) unit-wide angular unconformities at the base of a unit, which we interpret as indicative of erosion of underlying strata followed by deposition of the new unit having a noticeably different bedding attitude; (b) disconformities (parallel unconformi-ties) where, in the absence of a distinct, observable erosional signature, other indicators of hiatus exist, such as a surface that collected impact craters and (or) a major change in mate-rial properties and inferred, sustained deviation in emplace-ment style, and (c) combinations of angular unconformities and inferred disconformities arising from layered materials
emplaced by sedimentation over a mixed flat and sloping, eroded surface.
The result is a set of units that are each distinctive in their geologic character and (or) relative age. Because units are mapped based on complex characteristics and relations difficult to summarize in brief descriptive terms, we chose unit names and symbols based on geographic locality and stratigraphic position, as previously used in Tanaka and others (2008) and following the approach of Tanaka and others (2005b). However, significant releases of CTX and HiRISE images and additional observations since those studies have resulted in some addi-tional changes in map unit names.
Circumpolar plains materials above middle latitudes on Mars, except for dunes, are almost entirely mantled by a thin deposit (1–10 m thick at ~lat 40° N.) that may be composed of dust and water ice (Mustard and others, 2001). The geomorphic mapping coincides with inferred near-surface water-equivalent concentrations of 20% to 100% by mass north of lat 50° N. (Feldman and others, 2004). The material may be what the Phoenix lander rests on and investigated; this material forms an icy soil that may be continuous and includes patterned ground (Smith and others, 2009). This same material and patterned ground obscures the fine-scale surface morphology and spectral characteristics of the Early Amazonian materials that underlie it. However, larger features subdued by this deposit such as impact craters kilometers across appear well preserved at MOLA resolution (Garvin and others, 2000). The mantle seems to be an ice-rich, stratigraphic equivalent to our Planum Boreum 2 unit, which appears to be thin but lithic rich. However, as with previ-ous mapping (Tanaka and others, 2005b), we chose not to map this mantle, but instead we map the underlying units in which the larger landforms appear to be mainly formed.
We group the map units into three geographic and geo-morphic categories: Planum Boreum units, circumpolar plains units, and crater material. Unit symbols signify the Amazonian and Hesperian Periods (“A” and “H”, respectively), those units belonging to the Planum Boreum group (small capital “B”), unit name (one or two small letters), and subunit or member (subscripted letter or number).
We map three types of contacts: certain, approximate, and gradational. A certain contact denotes the most precise and best-expressed contacts between well-characterized material units as observed in the mapping datasets. In comparison, an approximate contact is less precisely located due to lower data quality, subtlety or complexity of the contact, and (or) second-ary surface modification; the existence of the contact, however, is generally not in question. A gradational contact is used for complex boundaries where units are intimately mixed together at a scale that cannot be displayed precisely in the map; this includes dispersed dune forms or erosional remnants of one unit that are surrounded by exposures of another unit. Gradational contacts are drawn where the concentration of each bounding unit accounts for ~50% of the area. We also use gradational con-tacts in a few places where the Planum Boreum 2 unit gradually thins out to where most kilometer-scale morphologic features of underlying materials were evident; however, as mentioned previously, the unit may also be grading into a widespread, middle- to high-latitude mantle.
4
We show polar residual ice on and around Planum Boreum as a white stipple pattern, based on a mosaic of MARCI sum-mertime images (fig. 5). The ice appears to be relatively ephem-eral given that it may largely be less than a meter thick, displays ablated surface textures (pits, cracks, ridges, and knobs), shows discontinuous coverage in some HiRISE images, and varies in extent from year to year (Thomas and others, 2000; Malin and Edgett, 2001; Herkenhoff and others, 2002; Tanaka and others, 2008; Byrne, 2009).
Nine mapped grabens are all >5 km in length and generally are made up of several echelon segments as viewed in CTX and HiRISE images, which also display collapse pits along the fault scarps (Nunes and others, 2007; Tanaka and others, 2008). A total of 308 unconformities 659 m to 114 km long were mapped within Planum Boreum 1 and 3 units (fig. 6; 113 are >15 km long in the printed map). We limited our mapping of non-crater material outcrops to those >~4 km in width (2 mm at map scale) and those of crater material >10 km across (5 mm at map scale). Thus, smaller outcrops are absorbed in one or more surrounding units.
Age DeterminationsThe Planum Boreum region includes some of the young-
est sedimentary sequences on Mars. These include the polar layered deposits, which have long been recognized as important materials formed and shaped by polar processes related to the recent climate of Mars. Moreover, the high quality and volume of image and topographic data available and the relatively pris-tine exposures in this region makes it exceptional for defining stratigraphic relations.
Previous workers determined crater densities and impor-tant cross-cutting relationships with adjacent units for some of the polar units described herein at regional scales, including the Vastitas Borealis interior and Scandia region units (Tanaka and others, 2005b) and what amount to be equivalents to our Planum Boreum 1 and 3 units (Herkenhoff and Plaut, 2000; Tanaka, 2005; Banks and others, 2010).
We performed additional crater counts that specifically apply to the unit outcrops in the present map and used the Robbins-Hynek crater database to gather crater statistics for the oldest Planum Boreum rupēs, Vastitas Borealis interior and Scandia region units (Robbins and Hynek, 2009). This data-base for the map region is based on THEMIS infrared images (100 m/pixel) and the MOLA DEM (at 260 m/pixel), resulting in a fairly complete catalog of craters 1.5 to 63 km in diam-eter. From this database, 320 were selected of those > 2 km in diameter for crater statistics (fig. 7). Some craters in the original database were omitted from our survey, because they were (1) mantled by younger units, which prevented confident determi-nation of the unit in which they were impacted; (2) in locations where the identity of the impacted unit was not obvious; (3) so degraded that the preserved crater form did not accurately represent the original diameter of the crater (most of these are in the Planum Boreum rupēs unit); and (4) higher resolution data showed that some of the cataloged craters were more likely
erosional or collapse features rather than impact craters (plotted in black on fig. 7).
For the purpose of crater statistics, we produced a map product in which crater material (unit AHc) outcrops were removed and buried contacts were added as needed to produce a geologic map without crater material (see table 1 for the revised areas for the crater counts). This modified map enabled more accurate determination of the unit surface areas.
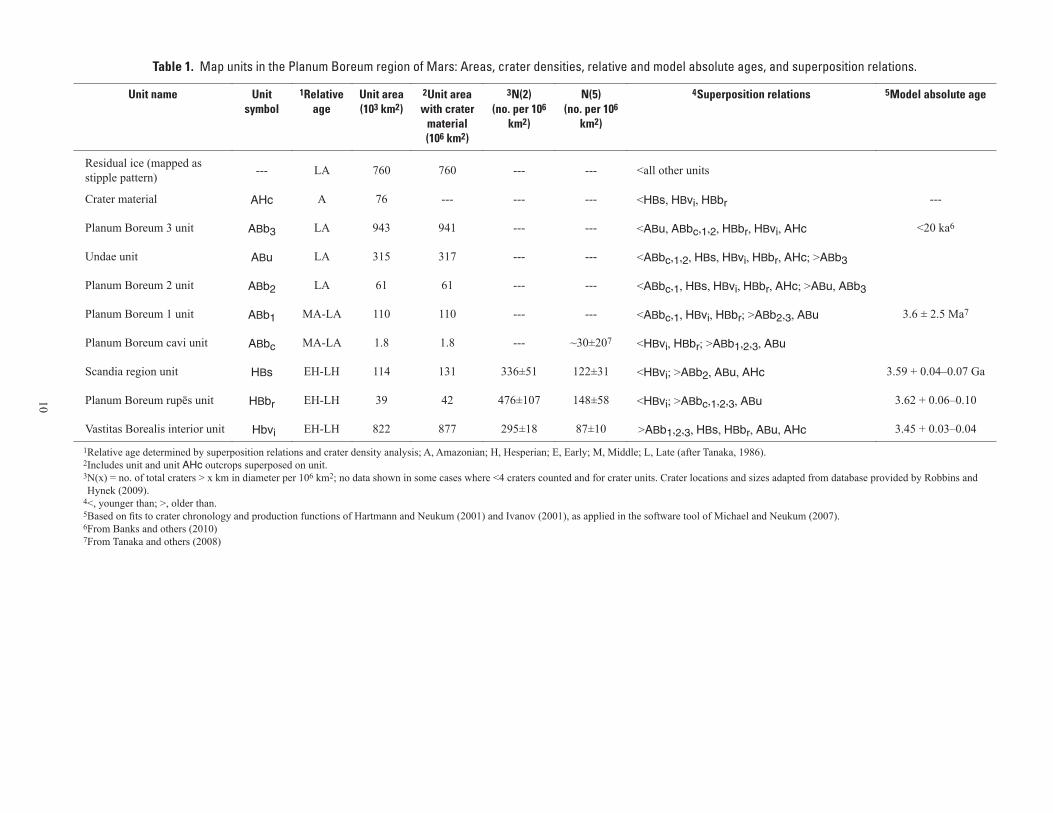
Crater statistics are summarized in table 1 relative to the Martian stratigraphic scheme based on cumulative craters densities > 2 and 5 km diameter (Tanaka, 1986). The full list of craters with their locations, diameters, and map units is provided in Digital Supplement 1. The crater size-frequency distributions are shown in figure 8 in cumulative, incremental, relative, and production-function fit graphical forms (see Crater Analysis Techniques Working Group (1979) for a description of the types of plots). The previous and new crater statistical data are valuable for establishing relative ages of the surfaces and inferring model absolute ages of the material units. For eroded, exhumed, or partly buried units, the crater density provides a lower age limit for emplacement age, which may be much older than the surface age. In addition, crater ages provide a surface mean age. For geologic units whose surface histories are not well understood and complex, calculated surface mean ages may be misleading as many resurfacing events may be aver-aged together, including those that might have locally obliter-ated craters over differing time scales, whereas other craters on surfaces were largely preserved. The Vastitas Borealis interior unit in particular shows an unusual paucity of craters >12 km in diameter; this paucity is not understood and may reflect either an unrecognized deviation from the crater production function possibly caused by target property effects (Werner and others, 2004) or perhaps the true crater production function for Mars (Tanaka and others, 2005a). Given such uncertainties in the statistical samplings of crater populations, the interpretation of the crater-density data, and the form of the crater production distribution, model-based absolute ages are not well constrained for Mars, especially for the Amazonian Period in which such age estimates may be incorrect by as much as a factor of 2 (Hartmann, 2005).
Geologic SummaryHere we discuss the geologic history of the north polar
region of Mars as determined by geologic mapping results and crater size/frequency statistics. This summary is also portrayed graphically in the Correlation of Map Units. Details of the stratigraphic relations and crater statistics are provided in table 1. Helpful cross sections and a graphical stratigraphic section of north polar region units appear in Tanaka and others (2008).
Hesperian Period
The recorded geologic history of the north polar region begins with the Hesperian during which the Vastitas Borealis interior, Scandia region, and Planum Boreum rupēs units were
5
formed as indicated by N(5) crater densities (table 1). The N(5) values are higher than those given by Tanaka and others (2005b), which may in part be due to the higher latitude focus of the current map plus analysis with more comprehensive data (crater diameters from 2 to 5 km). The greater inferred ages also likely reflect older formational ages and longer durations of formation. These units display complex geologic relations and reworked surfaces according to their crater size-frequency distributions, thus reconstructions of their histories are poorly constrained and allow for multiple geologic scenarios.
The Vastitas Borealis interior unit includes troughed, ridged, knobby, and mantled plains materials (for example, Tanaka and Scott, 1987) thought to be composed largely of fluvial and lacustrine (or even paleo-ocean) sediments emplaced during the Early to Late Hesperian and perhaps earlier resulting from the dissection of highland materials by outflow channels that debouched into the northern plains (Lucchitta and others, 1986; Parker and others, 1989). Subsequent degradation of the unit resulted in obliteration of the craters until near the end of the Late Hesperian. South of the map area, the surface age is at the beginning of the Amazonian (Tanaka and others, 2005b).
When emplaced, the Vastitas Borealis interior unit is likely to have contained interstitial water and ice, which may have led to sedimentary diapirism and mud volcanism to form the Scandia region unit made up of knobby and hummocky plains and dome-forming materials and surfaces that superpose, intrude, and otherwise appear to modify the Vastitas Borea-lis interior unit (Tanaka and others, 2003, 2005b). Given the higher density of craters in the Scandia region unit, it appears that resurfacing, including crater degradation, may have con-tinued in the Vastitas Borealis interior unit after the Scandia region unit formed, at similar times but at higher rates in the Vastitas Borealis interior unit, and (or) that some of the craters within the Scandia region unit were exhumed. Such differing degradational histories may have been controlled in part by dif-fering volatile contents.
The Planum Boreum rupēs unit may be a remnant polar ice deposit that was eroded into an irregular shape (Tanaka and others, 2008; Putzig and others, 2009). The unit’s crater den-sity suggests an Early to Late Hesperian surface age, perhaps contemporaneous with outflow channel activity (Tanaka and others, 2005b) and (or) degradation of the Scandia region unit, which could have released volatiles and sand- and dust-sized lithic particles that were transported to the pole and cold trapped (Tanaka, 2005). Several craters of various sizes including Boola (17.0 km) and Crotone (6.4 km) form prominences on the unit above Rupes Tenuis and on Hyperborea Lingula in which material surrounding the crater ejecta blankets were preferen-tially eroded, forming pedestal craters. Similarly, cratered and flat-topped mounds of Abalos Colles may be degraded pedestal craters as well (Tanaka and others, 2008), although these have also been interpreted to be volcanoes (Fagan and Sakimoto, 2009). Given that the surrounding Vastitas Borealis interior unit’s surface is younger than that of the Planum Boreum rupēs unit based on crater-density statistics (table 1), the former unit may be exhumed and (or) resurfaced by other processes such as cryoturbation. Possibly, the Planum Boreum rupēs unit may even represent a remnant of an older set of surfaces of the Vasti-
tas Borealis interior unit, which would indicate that latter unit has had a long history of degradation.
Afterwards, large polygonal troughs formed in the Vasti-tas Borealis interior unit south of Chasma Boreale and around western Scandia Tholi (south of Scandia Cavi outside of map area) and in the lower part of the Planum Boreum rupēs unit exposed on the outer floor of Chasma Boreale. The troughs are apparently Late Hesperian given that they generally underlie impact craters, as previously noted by McGill (1986). Hyper-boreus Labyrinthus represents a set of eroded trough structures in the lower part of the rupēs unit that display ridges indicative of hardening of the trough margins; these ridges may be made up of intruded material similar in origin to the Scandia region unit (Tanaka and others, 2008).
Early Amazonian Epoch
No extensive units are recognized from this epoch either due to lack of deposition or to erosion of deposits formed at this time. Many of the impact craters that produced crater material (unit AHc) in the map region were emplaced during this time (larger craters with preserved ejecta may have formational ages that range from the Late Hesperian to the Late Amazonian, whereas degraded craters may be Early Hesperian). Similarly, pedestal craters scattered across the map region may have formed at various times throughout the Late Hesperian to Ama-zonian (Rodriguez and others, 2010). Notably, the crater statis-tics indicate a paucity of craters less than ~3 km in diameter on the Hesperian units (fig 8). Possibly, many of the craters formed on thin, episodic, ice-rich mantles that when removed left behind the crater pedestals in some instances, but in other cases craters apparently were obliterated. In addition, many of the craters a few hundred to a few thousand meters across in higher resolution CTX and HiRISE images appear to be completely infilled and buried, leaving behind knobs and flat surfaces cut by circular cracks. These features may be widespread, and they may account for the bumpy texture at length scales of hundreds of meters to a few kilometers of the Vastitas Borealis interior unit’s surface in the MOLA DEMs (115 to 460 m/pixel).
Middle Amazonian Epoch (?)
The timing of events described in this epoch is highly uncertain. The Planum Boreum cavi unit appears to be made up of basaltic sand and ice-rich interbeds forming in some places a succession of frozen dunes (Byrne and Murray, 2002; Kocurek and Ewing, 2010). The cavi unit was emplaced onto the eroded margins of the Planum Boreum rupēs unit, during Middle and (or) the earlier part of the Late Amazonian, if two craters >5 km in diameter in Olympia Planum superpose the unit or the over-lying Planum Boreum 1 unit as has been suggested by Tanaka and others (2008). These craters include 19-km-diameter Jojutla in the center of Olympia Planum and an unnamed 6.8-km-diameter crater at lat 81.2° N., long 161.5° E. (the latter crater is ringed on its downslope side by a layered, light-toned pedestal-like scarp probably made up of the Planum Boreum 1 unit underlying the crater’s ejecta and now obscured by dunes of the
6
undae unit). The Planum Boreum cavi unit’s original extent is uncertain and remnants of it are observed in Olympia, Tenuis, and Boreum Cavi and a small depression on the northwest flank of Abalos Mensa. Possibly, the cavi unit results from saltating sand accumulations during high obliquity that alternate with episodes of ice accumulation during lower obliquity, until the sand supply is depleted and (or) is no longer transportable onto the growing deposit due to lower winds during lower obliquity (Herkenhoff and others, 2007).
The Planum Boreum cavi unit appears to grade into the Planum Boreum 1 unit vertically and perhaps horizontally in Boreum Cavus as the dark, sandy layers in the top of the cavi unit become thinner and less common in the unit’s upper section (Tanaka and others, 2008). Therefore, it may be that some lower sections of the Planum Boreum 1 unit also are similar in age to the cavi unit.
Late Amazonian Epoch
The Planum Boreum 1 unit developed during the Late Amazonian (and perhaps beginning in the Middle Amazo-nian as described above) as finely layered (as thin as 10 cm in HiRISE images; Herkenhoff and others, 2007), light-toned, ice-rich deposits hundreds of meters to more than a kilometer thick forming much of Planum Boreum as well as a few outlier plateaus including Abalos and Olympia Mensae. Generally, the layers thicken toward the north pole, and they do not show evi-dence of significant ice flow (Fishbaugh and Hvidberg, 2006). Planum Boreum 1 unit includes hundreds of unconformities, mostly within its lower sections as exposed in outer troughs and scarps of Planum Boreum. These features indicate that accumu-lation locally was commonly interrupted by erosion. In addi-tion, the Planum Boreum cavi and 1 units subsequently eroded broadly and deeply, removing outer parts of proto-Planum Boreum and initiating the spiral trough topography and other large depressions including Olympia, Boreum, and Tenuis Cavi (Tanaka and others, 2008). The huge trough of Chasma Boreale developed in part by preferential accumulations of the Planum Boreum cavi and 1 units over eroded scarps made up of the Planum Boreum rupēs unit (Holt and others, 2010).
The eroded surface of the Planum Boreum 1 unit has a 3.6 ± 2.5 m.y. old crater-retention age (Tanaka, 2005), and thus accu-mulation of the unit predates that age. Moreover, the crater age for Planum Boreum exposures of the unit may signify when the rate of erosion decreased, possibly coincident with when obliq-uity decreased from a range of 25° to 45° to 15° to 35° about 4 to 5 m.y. ago; this resulted in a decrease in insolation by about 40% (Laskar and others, 2002). Thus, in spite of attempts to correlate the layer stratigraphy of the unit to the calculated insolation history (Laskar and others, 2002; Milkovich and Head, 2005), the lack of a firm absolute age for the termination of the Planum Boreum 1 unit prevents a robust temporal reconstruction of these layered deposits. Prior to a few tens of millions of years ago, the obliquity and insolation cannot be calculated with precision due to chaotic variations (Laskar and others, 2004); thus, if the unit is mostly or entirely older than this, age reconstructions cannot be constrained to any helpful precision.
Following erosion of the Planum Boreum cavi and 1 units, deposition of the dark-toned, layered Planum Boreum 2 unit unconformably on these and on the Planum Boreum rupēs unit occurred extensively across the main lobe of Planum Boreum, especially on southern Olympia Planum where Olympia Undae now occurs and in the southern troughs of Olympia Cavi (Rodriguez and others, 2007). The lithic-rich character of this unit indicates that previous to its deposition and during erosion of the Planum Boreum cavi and 1 (and perhaps rupēs) units, the polar region underwent deflation thereby releasing lithic particles. Perhaps the Planum Boreum 2 unit originated as a sand sheet deposit (Rodriguez and others, 2007). The unit is mapped as grading into the Vastitas Borealis interior unit west of Olympia Undae, because a distinct contact between the units is not observed; possibly, the Planum Boreum 2 unit grades into and is stratigraphically equivalent to an icy mantle superposed on most craters marking the interior unit as seen in CTX and HiRISE images. This icy mantle may be the northern extension of one documented extensively in middle latitudes (Mustard and others, 2001).
Next, the dark circumpolar dune fields made up of basaltic sands arose primarily from erosion of the Planum Boreum cavi and 2 units (Byrne and Murray, 2002; Fishbaugh and Head, 2005; Tanaka and others, 2008). Most dune formation and migra-tion preceded emplacement of the Planum Boreum 3 unit, but locally such as in a section of Hyperboreae Undae, dunes appear to have been reactivated, leaving behind depressions within the Planum Boreum 3 unit (Mullins and others, 2006). The dunes generally migrated southward and southwestward from the margins of Planum Boreum and Abalos Mensa, presumably due to katabatic winds, then mostly westward (except eastward east of the mouth of Chasma Boreale) by circumpolar winds (Tsoar and others, 1979; Tanaka and Hayward, 2008). The largest dune sea forms Olympia Undae, which appear to originate from the Planum Boreum 2 unit that underlies these dunes. Spectral map-ping from Thermal Emission Spectrometer (TES) and OMEGA data indicate that the dark sand making up the undae unit contain hydrated and weathered silicate minerals (for example, Band-field, 2002; Wyatt and others, 2004; Horgan and others, 2009). Gypsum as mapped by OMEGA and CRISM hyperspectral data and originating predominantly at the east end of Olympia Undae (Langevin and others, 2005) may be formed within the dunes (Horgan and others, 2009), from fluvial discharges from beneath Planum Boreum (Fishbaugh and others, 2007), or released by aeolian deflation from underlying, gypsum-rich materials in the Vastitas Borealis interior unit perhaps produced by dike propa-gation and hydrothermal groundwater alteration resulting from Alba Mons magmatism (Tanaka and others, 2008).
The Planum Boreum 3 unit accumulated as 6 to 8 light-toned layers on top of most of Planum Boreum as well as on: (a) parts of adjacent plains, especially below Rupes Tenuis (including Abalos and Tenuis Mensae) and along much of the margin of central Gemina Lingula; (b) Olympia Mensae; and (c) in some larger and deeper craters including Dokka, Jojutla, and an unnamed, 31-km-diameter crater at long 89.1° E., lat 77.1° N. The Planum Boreum 3 unit is observed to rest unconform-ably on Planum Boreum cavi and 1 and 2 units within troughs of Borealis and Gemini Scopuli and cavi depressions and
7
mostly embays dunes of the undae unit, except it appears that some dunes continued to migrate after Planum Boreum 3 unit was emplaced, for example at Hyperborea Undae (Mullins and others, 2006). The unit was subsequently degraded and eroded, especially on equator-facing scarps. The scarps and adjacent surfaces of the Planum Boreum 1 and 3 units are darkened by veneers that appear to result from release of hydrated miner-als originating from the Planum Boreum 2 unit (Rodriguez and others, 2007; Horgan and others, 2009). Craters on Planum Boreum are being resurfaced on ~104 year time scales (Tanaka, 2005; Banks and others, 2010); thus emplacement ages of Planum Boreum 2 and 3 units are uncertain.
Residual ice (mapped as a stipple pattern) forms a dis-continuous blanket on much of Planum Boreum and parts of Scandia Cavi and Olympia Mensae. Its ridged and pitted texture indicates that it is likely undergoing deflation at pres-ent (Thomas and others, 2000). Whether or not residual ice relates to accumulation or other significant modification of the underlying Planum Boreum 3 unit, which it locally drapes over (Skinner and Herkenhoff, 2007), is unknown. Waxing and waning of seasonal carbon dioxide frost (Prettyman and others, 2009), local slope failures and erosion that forms mass-wasting and talus features along the steep cavi cliffs (Herkenhoff and others, 2007), and the redistribution of lithic fines in the form of veneers as distributed by storm activity (Rodriguez and others, 2007; Malin and others, 2008) characterize the continued, dynamic nature of the north polar region.
References CitedBandfield, J.L., 2002, Global mineral distributions on Mars:
Journal of Geophysical Research, v. 107, no. E6, 10.1029/2001JE001510.
Banks, M.E., Byrne, Shane, Galla, K.G., and 7 others, 2010, Crater population and resurfacing of the Martian north polar layered deposits: Journal of Geophysical Research, v. 111, E08006, doi:10.1029/2009JE003523.
Blasius, Karl, Cutts, James, and Howard, Alan, 1982, Topog-raphy and stratigraphy of Martian polar layered deposits: Icarus, v. 50, p. 140–160.
Bourke, M.C., Edgett, K.S., and Cantor, B.A., 2008, Recent aeolian dune change on Mars: Geomorphology, v. 94, p. 247–255.
Byrne, Shane, 2009, The polar deposits of Mars: Annual Reviews of Earth and Planetary Science, v. 37, p. 535–560.
Byrne, Shane, and Murray, B.C., 2002, North polar stratigraphy and the paleo-erg of Mars: Journal of Geophysical Research, v. 107, no. E6, 5044, doi:10.1029/2001JE001615.
Crater Analysis Techniques Working Group, 1979, Standard and analysis of crater size-frequency data: Icarus, v. 27, no. 2, p. 464–474.
Dial, A.L., Jr., 1984, Geologic map of the Mare Boreum area of Mars: U.S. Geological Survey Miscellaneous Investiga-tions Series Map I–1640, scale 1:5,000,000.
Dial, A.L., and Dohm, J.M., 1994, Geologic map of science study area 4, Chasma Boreale region of Mars: U.S. Geo-
logical Survey Miscellaneous Investigations Series Map I–2357, scale 1:500,000.
Fagan, A.L., and Sakimoto, S.E.H., 2009, Formation constraints on Martian north polar volcanic edifices [abs.], in Lunar and Planetary Science Conference, 40th, March 23–27, 2009: Houston, Tex., Lunar and Planetary Institute, no. 1976, [CD-ROM].
Feldman, W.C., Prettyman, T.H., Maurice, S., and 12 others, 2004, Global distribution of near-surface hydrogen on Mars: Journal of Geophysical Research, v. 109, E09006, doi:10.1029/2003JE002160.
Fishbaugh, K.E., and Hvidberg, C.S., 2006, Martian north polar layered deposits stratigraphy—Implications for accumula-tion rates and flow: Journal of Geophysical Research, v. 111, E06012, doi:10.1029/2005JE002571.
Fishbaugh, K.E., and Head, J.W., III, 2005, Origin and char-acteristics of the Mars north polar basal unit and implica-tions for polar geologic history: Icarus, v. 174, p. 444–474, doi:10.1016/j.icarus.2004.06.021.
Fishbaugh, K.E., Poulet, François, Chevrier, V., and Langevin, Yves, and Bibring, J.P., 2007, On the origin of gypsum in the Mars north polar region: Journal of Geophysical Research, v. 112, E07002, doi:10.1029/2006JE002862.
Frey, H.V., 2006, Impact crater constraints on, and a chro-nology for, major events in early Mars history: Journal of Geophysical Research, v. 111, E08S91, doi:10.1029/2005JE002449.
Garvin, J.B., Sakimoto, S.E.H., Frawley, J.J., and Schnetzler, Charles, 2000, North polar craterforms on Mars—Geomet-ric characteristics from the Mars Orbiter Laser Altimeter: Icarus, v. 144, p. 329–352.
Hansen, V.L., 2000, Geologic mapping of tectonic plan ets: Earth and Planetary Science Letters, v. 176, p. 527–542.
Hartmann, W.K., 2005, Martian cratering. 8. Isochron refine-ment and the chronology of Mars: Icarus, v. 174, p. 294–320.
Hartmann, W.K., and Neukum, Gerhard, 2001, Cratering chro-nology and the evolution of Mars: Space Sci ence Reviews, v. 96, p. 165–194.
Head, J.W., III, Hiesinger, Harald, Ivanov, M.I., Kreslavsky, M.A., Pratt, Stephen, and Thomson, B.J., 1999, Possible ancient oceans on Mars—Evidence from Mars Orbiter Laser Altimeter data: Science, v. 286, p. 2134–2137.
Head, J.W., III, Kreslavsky, M.A., and Pratt, Stephen, 2002, Northern lowlands of Mars—Evidence for widespread vol-canic flooding and tectonic deformation in the Hesperian Period: Journal of Geophysical Research, v. 107, no. E1, p. 3-1–3-29 (doi:10.1029/2000JE001445).
Herkenhoff, K.E., 2003, Geologic map of the MTM 85080 quadrangle, Chasma Boreale region of Mars: U.S. Geo-logical Survey Geologic Investigations Series Map I–2753, scale 1:500,000.
Herkenhoff, K.E., Byrne, Shane, Russell, P.S., Fishbaugh, K.E., and McEwen, A.S., 2007, Meter-scale morphology of the polar region of Mars: Science, v. 317, p. 1711–1715.
Herkenhoff, K.E., and Plaut, J.J., 2000, Surface ages and resur-facing rates of the polar layered deposits on Mars: Icarus, v. 144, p. 243–253.
8
Herkenhoff, K.E., Soderblom, L.A., and Kirk, R.L., 2002, MOC photoclinometry of the north polar residual cap on Mars [abs.], in Lunar and Planetary Science Conference, 33rd, March 11–15, 2002: Houston, Tex., Lunar and Planetary Institute, no. 1714, [CD-ROM].
Holt, J.W., Fishbaugh, K.E., Byrne, Shane, and 7 others, 2010, The construction of Chasma Boreale on Mars: Nature, v. 465, p. 446–449, doi:10.1038/nature09050.
Horgan, B.H., Bell, J.F., Noe Dobrea, E.Z., and 5 others, 2009, Distribution of hydrated minerals in the north polar region of Mars: Journal of Geophysical Research, v. 114, E01005, doi:10.1029/2008JE003187.
Ivanov, B.A., 2001, Mars/Moon cratering rate ratio estimates: Space Sci ence Reviews, v. 96, p. 87–104.
James, P.B., Kieffer, H.H., and Paige, D.A., 1992, The seasonal cycle of carbon dioxide on Mars, in Kieffer, H.H., Jakosky, B.M., Snyder, C.W., and Matthews, M.S., eds., Mars: Tucson, The University of Arizona Press, p. 934–968.
Kocurek, Gary, and Ewing, R.C., 2010, Frozen dune dynamics, accumulation and preservation of aeolian cross-stratifi-cation in the cavi unit in the north polar region of Mars [abs.], in First International Conference on Mars Sedimen-tology and Stratigraphy, April 19-21, 2010: El Paso, Tex., Lunar and Planetary Institute Contribution No. 1547, p. 26.
Kreslavsky, M.A., and Head, J.W., III, 2000, Kilometer-scale roughness of Mars—Results from MOLA data analy-sis: Journal of Geophysical Research, v. 105, no. E11, p. 26,695–26,711.
Langevin, Yves, Poulet, François, Bibring, J.-P., Gondet, B., 2005, Sulfates in the north polar region of Mars detected by OMEGA/Mars Express: Science, v. 307, p. 1584–1586.
Laskar, Jacques, Correia, A., Gastineau, M., Joutel, F., Levrard, Benjamin, and Robutel, P., 2004, Long term evolution and chaotic diffusion of the insolation quantities of Mars: Icarus, v. 170, p. 343–364.
Laskar, Jacques, Levrard, Benjamin, and Mustard, J.F., 2002, Orbital forcing of the martian polar layered deposits: Nature, v. 419, p. 375–377.
Lucchitta, B.K., Ferguson, H.M., and Summers, Cathy, 1986, Sedimentary deposits in the northern lowland plains, Mars, in Proceedings of the Lunar and Planetary Science Confer-ence, 17th, Part 1, November, 1986: Journal of Geophysi-cal Research, v. 91, supplement, no. B13, p. E166–E174.
Malin, M.C., Calvin, W.M., Cantor, B.A., and 7 others, 2008, Climate, weather, and north polar observations from the Mars Reconnaissance Orbiter Mars Color Imager: Icarus, v. 194, p. 501–512.
Malin, M.C., and Edgett, K.S., 2001, Mars Global Sur veyor Mars Orbiter Camera—Interplanetary cruise through primary mission: Journal of Geophysical Research, v. 106, no. E10, p. 23,429–23,570.
Martin, L.J., James, P.B., Dollfus, A., Iwasaki, K., and Beish, J.D., 1992, Telescopic observations—Visual, photographic, polarimetric, in Kieffer, H.H., Jakosky, B.M., Snyder, C.W., and Matthews, M.S., eds., Mars: Tucson, The Uni-versity of Arizona Press, p. 34–70.
McGill, G.E., 1986, The giant polygons of Utopia, northern Martian plains: Geophysical Research Letters, v. 13, no. 8,
p. 705–708.Michael, Greg, and Neukum, Gerhard, 2007, Refinement of cra-
tering model age for the case of partial resurfacing [abs.], in Lunar and Planetary Science Conference, 38th, March 12–16, 2007: Houston, Tex., Lunar and Planetary Institute, no. 1825, [CD-ROM].
Milkovich, S.M., and Head, J.W., 2005, North polar cap of Mars—Polar layered deposit characterization and identification of a fundamental climate signal: Journal of Geophysical Research, v. 110, E01005, doi:10.1029/2004JE002349.
Mouginis-Mark, P.J., 1979, Martian fluidized crater morphol-ogy—Variations with crater size, latitude, altitude, and target material: Journal of Geophysical Research, v. 84, p. 8011–8022.
Mullins, K.F., Hayward, R.K., and Tanaka, K.L., 2006, Dune forms and ages and associated oblate depressions in the Chasma Boreale region of Planum Boreum, Mars [abs.], in Lunar and Planetary Science Conference, 37th, March 13–17, 2006: Houston, Tex., Lunar and Planetary Institute, no. 1998 [CD-ROM].
Mustard, J.F., Cooper, C.D., and Rifkin, M.K., 2001, Evi dence for recent climate change on Mars from the identification of youthful near-surface ground ice: Nature, v. 412, p. 411–414.
Nimmo, Francis, and Tanaka, K.L. 2005, Early crustal evolution of Mars: Annual Review of Earth and Planetary Sciences, v. 33, p. 133–161.
North American Commission on Stratigraphic Nomen clature, 1983, North American stratigraphic code: American Asso-ciation of Petroleum Geologists Bul letin, v. 67, no. 5, p. 841–875.
Nunes, D.C., Byrne, Shane, and Okubo, C.H., 2007, Recent deformation in the residual northern polar cap of Mars—A breaking story [abs.], in Seventh International Conference on Mars, July 9–13, 2007: Pasadena, Calif., Lunar and Planetary Institute, no. 3264, [CD-ROM].
Parker, T.J., Saunders, R.S., and Schneeberger, D.M., 1989, Transitional morphology in west Deuteronilus Mensae, Mars—Implications for modification of the lowland/upland boundary: Icarus, v. 82, p. 111–145.
Prettyman, T.H., Feldman, W.C., and Titus, T.N., 2009, Charac-terization of Mars’ seasonal caps using neutron spectros-copy: Journal of Geophysical Research, v. 114, E08005, doi:10.1029/2003JE003275.
Putzig, N.E., Phillips, R.J., Campbell, B.A., and 7 others, 2009, Subsurface structure of Planum Boreum from Mars Recon-naissance Orbiter Shallow Radar soundings: Icarus, v. 204, p. 443–457.
Robbins, S. J., and Hynek, B.M., 2009, Progress towards a new global catalog of Martian craters and layered ejecta proper-ties, complete to 1.5 km [abs.], in Mars Crater Consortium Meeting, 12th, September 29–30, 2009: Flagstaff, Ariz., Northern Arizona University, no. 1207 [on-line].
Rodriguez, J.A.P., Tanaka, K.L., Berman, D.C., and Kargel, J.S., 2010, Late Hesperian formation and degradation in a low sedimentation zone of the northern lowlands of Mars: Icarus, v. 210, p. 116–134.
9
Rodriguez, J.A.P., Tanaka, K.L., Langevin, Y., Bourke, M.C., Kargel, J.S., Christensen, P.H., and Sasaki, Sho, 2007, Recent aeolian erosion and deposition in the north polar plateau of Mars: Mars Journal, v. 3, p. 29–41.
Salvatore, Amos, ed., 1994, International stratigraphic guide—A guide to stratigraphic classification, termi nology, and procedure (2d ed.): Boulder, Colo., The Geological Society of America, Inc., 214 p.
Seelos, Frank, Murchie, Scott, Pelkey, Susan, Seelos, Kim, and the CRISM Team, 2007, CRISM multispectral survey campaign—Status and initial mosaics [abs.], in Lunar and Planetary Science Conference, 40th, March 23–27, 2009: Houston, Tex., Lunar and Planetary Institute, no. 2336 [CD-ROM].
Seidelmann, P.K., Abalakin, V.K., Bursa, M., and 8 others, 2002, Report of the IAU/IAG Working Group on Carto-graphic Coordinates and Rotational Ele ments of the Planets and Satellites—2000: Celes tial Mechanics and Dynamical Astronomy, v. 82, p. 83–110.
Skinner, J.A., Jr., and Herkenhoff, K.E., 2007, Final map results of the Olympia Cavi region of Mars (MTM 85200): Geo-logic units and history [abs.], in Abstracts of the Annual Meeting of Planetary Geologic Mappers, Tucson, Ariz. 2007, June 28–29, 2007: Tucson, Ariz.: U.S. Geological Survey Open-File Report 2007–1233.
Skinner, J.A., Jr., and Herkenhoff, K.E., 2012, Geologic map of the MTM 85200 quadrangle, Olympia Rupēs region of Mars: U.S. Geological Survey Scientific Investigation Map 3197, scale 1:500,000.
Smith, D.E., Zuber, M.T., Frey, H.V., and 21 others, 2001, Mars Orbiter Laser Altimeter—Experiment summary after the first year of global mapping of Mars: Journal of Geophysi-cal Research, v. 106, no. E10, p. 23,689–23,722.
Smith, P.H., Tamppari, L.K., Arvidson, R.E., and 33 others, 2009, H2O at the Phoenix Landing site: Science, v. 325, no. 5936, p. 58–61.
Tanaka, K.L., 1986, The stratigraphy of Mars, in Proceedings of the Lunar and Planetary Science Conference, 17th, Part 1, November, 1986: Journal of Geophysical Research, v. 91, supplement, no. B13, p. E139–158.
Tanaka, K.L.,2005, Geology and insolation-driven climatic his-tory of Amazonian north polar materials on Mars: Nature, v. 437, p. 991–994.
Tanaka, K.L., and Hayward, R.K., 2008, Mars’ north circum-polar dunes—Distribution, sources, and migration history [abs.], in Planetary Dunes Workshop; A Record of Climate Change: Houston, Tex., Lunar and Planetary Institute, Abstract no. 7012, [CD-ROM].
Tanaka, K.L., Rodriguez, J.A.P., Skinner, J.A., Jr., and 5 others, 2008, North polar region of Mars—Advances in stratigra-
phy, structure, and erosional modification: Icarus, v. 196, p. 318–358.
Tanaka, K.L., and Scott, D.H., 1987, Geologic map of the polar regions of Mars: U.S. Geological Survey Miscellaneous Investigations Series Map I–1802–C, scale 1:15,000,000.
Tanaka, K.L., Skinner, J.A., Jr., and Barlow, N.G., 2005a, The crater production function for Mars: A–2 cumulative power-law slope for pristine craters >5 km in diameter based on crater distributions for northern plains materials [abs.], in Lunar and Planetary Science Conference, 36th, March 14–18, 2005: Houston, Tex., Lunar and Planetary Institute, no. 2162 [CD-ROM].
Tanaka, K.L., Skinner, J.A., Jr., and Hare, T.M., 2005b, Geo-logic map of the northern plains of Mars: U.S. Geo-logical Survey Scientific Investigations Map 2888, scale 1:15,000,000.
Tanaka, K.L., Skinner, J.A., Jr., and Hare, T.M., 2010, The plan-etary geologic mapping handbook—2009, in Bleamaster, L.F., III, Tanaka, K.L., and Kelley, M.S., eds., Abstracts of the Annual Planetary Geologic Mappers Meeting, San Antonio, Texas, 2009: NASA Conference Publication NASA/CP-2010-216680, Appendix, 21 p.
Tanaka, K.L., Skinner, J.A., Jr., Hare, T.M., Joyal, Taylor, and Wenker, Alisa, 2003, Resurfacing history of the north-ern plains of Mars based on geologic mapping of Mars Global Surveyor data: Journal of Geophysical Research, v. 108, no. E4, p. GDS 24-1–GDS 24-32 (doc. no: 8043, doi:10.1029/ 2002JE001908).
Thomas, P., Squyres, S., Herkenhoff, K., Howard, A., and Murray, B., 1992, Polar deposits of Mars, in Kieffer, H.H., Jakosky, B.M., Snyder, C.W., and Matthews, M.S., eds., Mars: Tucson, The University of Arizona Press, p. 767–795.
Thomas, P.C., Malin, M.C., Edgett, K.E., Carr, M.H., Hartmann, W.K., Ingersoll, A., James, P.B., Soderblom, L.A., Veverka, J., and Sullivan, R., 2000, North–south geological differ-ences between the residual polar caps on Mars: Nature, v. 404, p. 161–164.
Tsoar, Haim, Greeley, Ronald, and Peterfreund, A.R., 1979, Mars—The north polar sand sea and related wind patterns: Journal of Geophysical Research, v. 84, p. 8167–8182.
Werner, S.C., van Gasselt, Stephan, and Neukum, Gerhard, 2004, Giant lowland polygons—Relics of an ancient Mar-tian ocean? [abs.], in Lunar and Planetary Science Confer-ence, 35th, March 15–19, 2004: Houston, Tex., Lunar and Planetary Institute, no. 1905 [CD-ROM].
Wyatt, M.B., McSween, H.Y., Jr., Tanaka, K.L., and Head, J.W., III, 2004, Global geologic context for rock types and surface alteration on Mars: Geology, v. 32, no. 8, p. 645–648.
10
Table 1. Map units in the Planum Boreum region of Mars: Areas, crater densities, relative and model absolute ages, and superposition relations.
Unit name
Unitsymbol
1Relativeage
Unit area(103 km2)
2Unit areawith crater
material(106 km2)
3N(2)(no. per 106
km2)
N(5)(no. per 106
km2)
4Superposition relations
5Model absolute age
Residual ice (mapped as stipple pattern) --- LA 760 760 --- --- <all other units
Crater material AHc A 76 --- --- --- <HBs, HBvi, HBbr ---
Planum Boreum 3 unit ABb3 LA 943 941 --- --- <ABu, ABbc,1,2, HBbr, HBvi, AHc <20 ka6
Undae unit ABu LA 315 317 --- --- <ABbc,1,2, HBs, HBvi, HBbr, AHc; >ABb3
Planum Boreum 2 unit ABb2 LA 61 61 --- --- <ABbc,1, HBs, HBvi, HBbr, AHc; >ABu, ABb3
Planum Boreum 1 unit ABb1 MA-LA 110 110 --- --- <ABbc,1, HBvi, HBbr; >ABb2,3, ABu 3.6 ± 2.5 Ma7
Planum Boreum cavi unit ABbc MA-LA 1.8 1.8 --- ~30±207 <HBvi, HBbr; >ABb1,2,3, ABu
Scandia region unit HBs EH-LH 114 131 336±51 122±31 <HBvi; >ABb2, ABu, AHc 3.59 + 0.04–0.07 Ga
Planum Boreum rupēs unit HBbr EH-LH 39 42 476±107 148±58 <HBvi; >ABbc,1,2,3, ABu 3.62 + 0.06–0.10
Vastitas Borealis interior unit Hbvi EH-LH 822 877 295±18 87±10 >ABb1,2,3, HBs, HBbr, ABu, AHc 3.45 + 0.03–0.04
1Relative age determined by superposition relations and crater density analysis; A, Amazonian; H, Hesperian; E, Early; M, Middle; L, Late (after Tanaka, 1986).2Includes unit and unit AHc outcrops superposed on unit.3N(x) = no. of total craters > x km in diameter per 106 km2; no data shown in some cases where <4 craters counted and for crater units. Crater locations and sizes adapted from database provided by Robbins and Hynek (2009).
4<, younger than; >, older than.5Based on fits to crater chronology and production functions of Hartmann and Neukum (2001) and Ivanov (2001), as applied in the software tool of Michael and Neukum (2007).6From Banks and others (2010)7From Tanaka and others (2008)
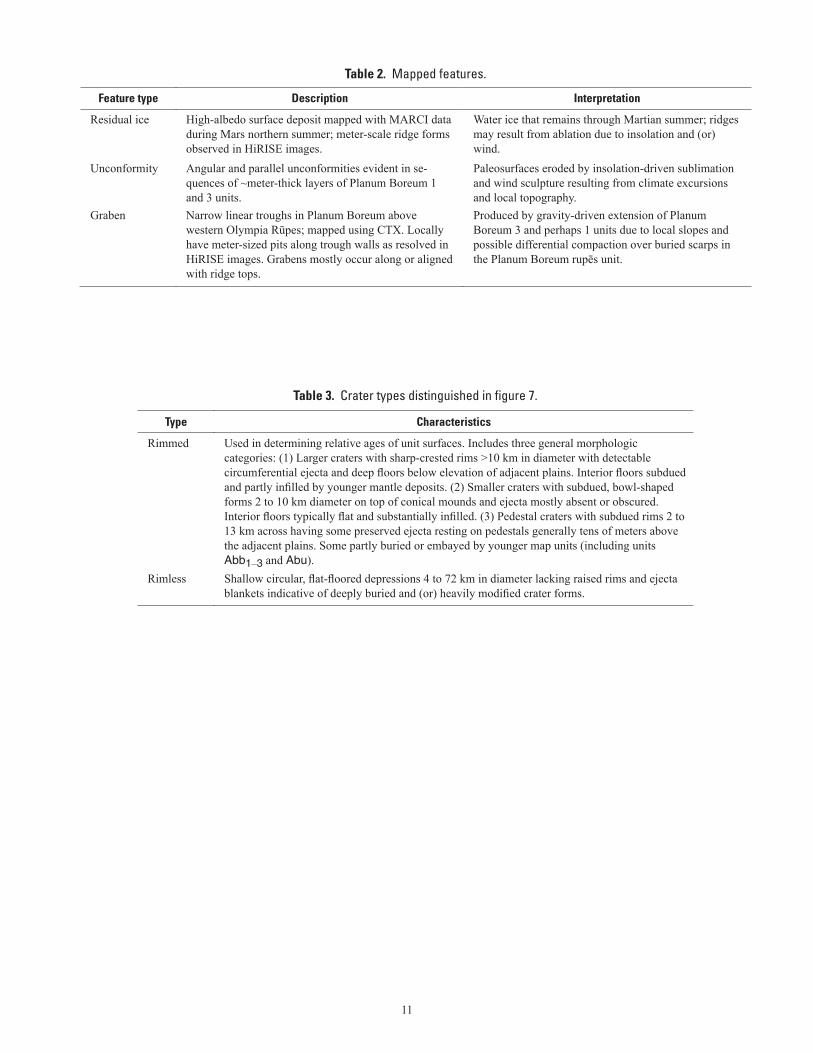
11
Table 2. Mapped features.
Feature type Description Interpretation
Residual ice High-albedo surface deposit mapped with MARCI data during Mars northern summer; meter-scale ridge forms observed in HiRISE images.
Water ice that remains through Martian summer; ridges may result from ablation due to insolation and (or) wind.
Unconformity Angular and parallel unconformities evident in se-quences of ~meter-thick layers of Planum Boreum 1 and 3 units.
Paleosurfaces eroded by insolation-driven sublimation and wind sculpture resulting from climate excursions and local topography.
Graben
Narrow linear troughs in Planum Boreum above western Olympia Rūpes; mapped using CTX. Locally have meter-sized pits along trough walls as resolved in HiRISE images. Grabens mostly occur along or aligned with ridge tops.
Produced by gravity-driven extension of Planum Boreum 3 and perhaps 1 units due to local slopes and possible differential compaction over buried scarps in the Planum Boreum rupēs unit.
Table 3. Crater types distinguished in figure 7.
Type Characteristics
Rimmed Used in determining relative ages of unit surfaces. Includes three general morphologic categories: (1) Larger craters with sharp-crested rims >10 km in diameter with detectable circumferential ejecta and deep floors below elevation of adjacent plains. Interior floors subdued and partly infilled by younger mantle deposits. (2) Smaller craters with subdued, bowl-shaped forms 2 to 10 km diameter on top of conical mounds and ejecta mostly absent or obscured. Interior floors typically flat and substantially infilled. (3) Pedestal craters with subdued rims 2 to 13 km across having some preserved ejecta resting on pedestals generally tens of meters above the adjacent plains. Some partly buried or embayed by younger map units (including units Abb1–3 and Abu).
Rimless
Shallow circular, flat-floored depressions 4 to 72 km in diameter lacking raised rims and ejecta blankets indicative of deeply buried and (or) heavily modified crater forms.


![Vita in Meridiani Planum,Marte [Life in Meridiani Planum, Mars]eprints.bice.rm.cnr.it/15621/1/Vita in Meridiani Planum... · Giorgio Bianciardi Università degli Studi di Siena 132](https://img.pdfslide.net/doc/110x75/5c6cf48109d3f214088b6422/vita-in-meridiani-planummarte-life-in-meridiani-planum-mars-in-meridiani-planum.jpg)