Embed Size (px)
Citation preview
Geologic Sources of Manganese in the Roanoke River Watershed
Zachary Kiracofe
Madeline Schreiber
William Henika

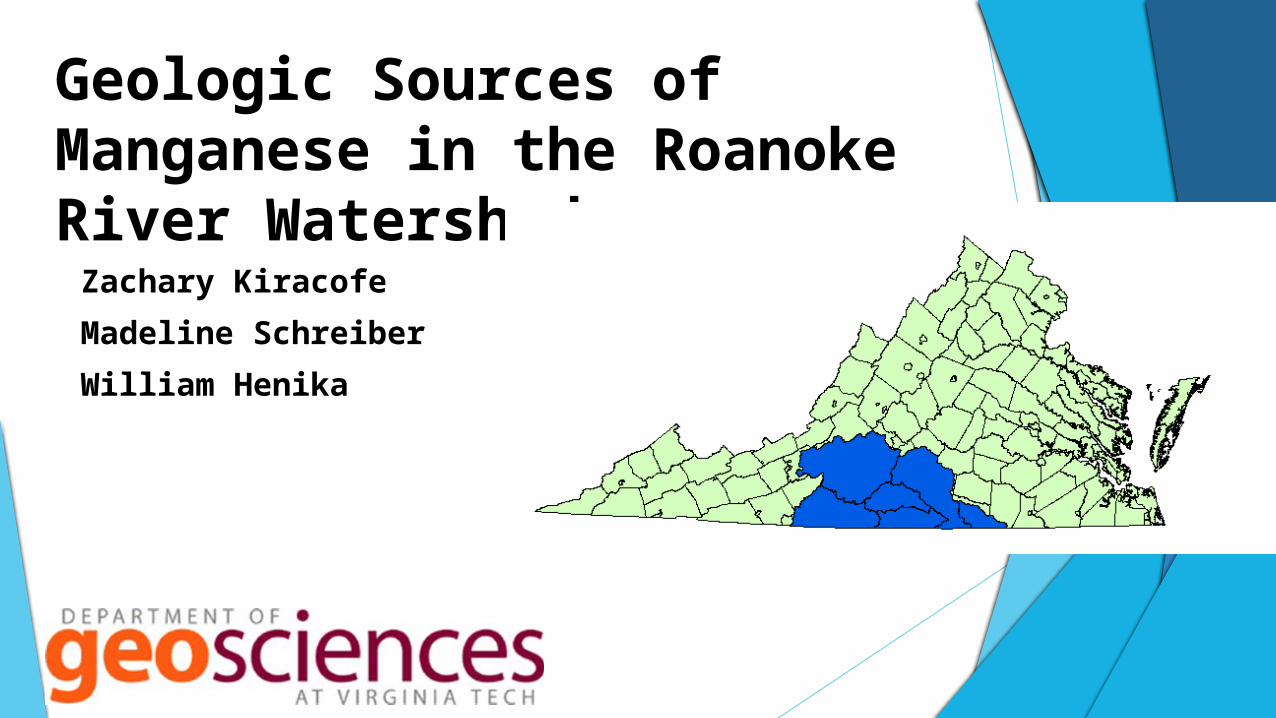
Manganese is a ubiquitous metal that can adversely affect water quality.
EPA Secondary Drinking Standard: 50 ppb
Aesthetic effects: staining clothing, taste & color
Human health benchmark: 300 ppb (EPA)
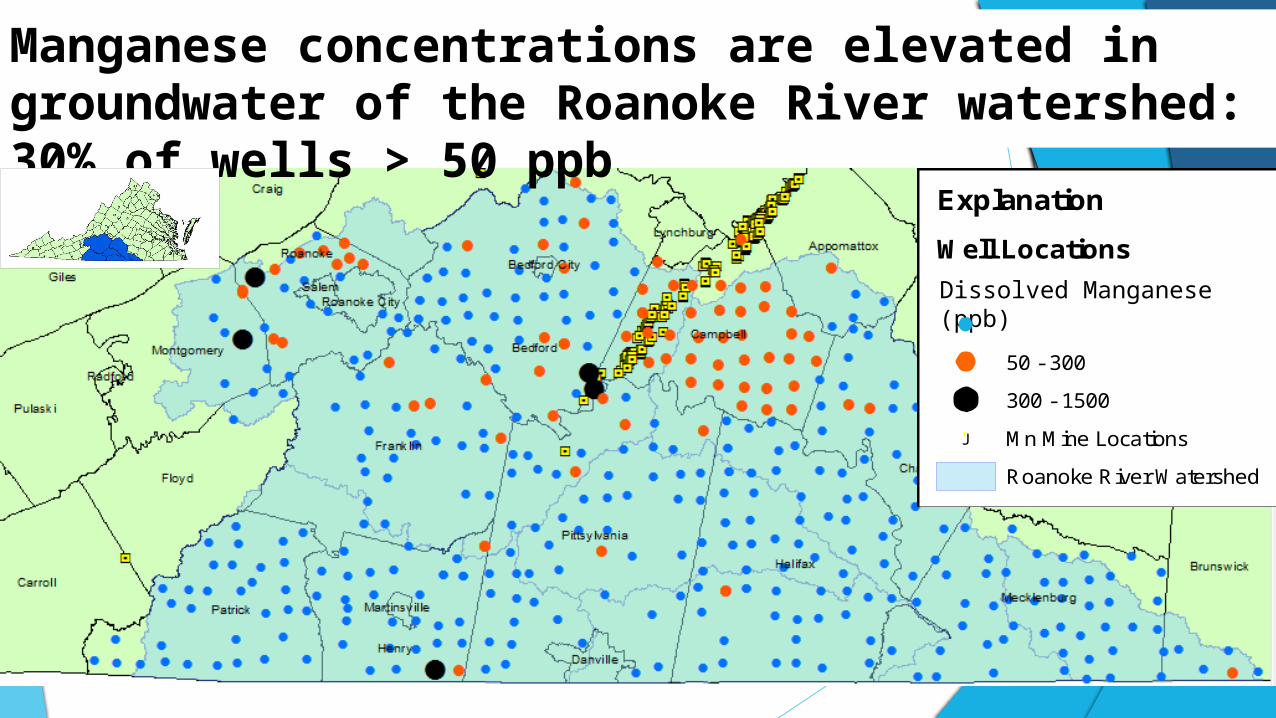
Manganese concentrations are elevated in groundwater of the Roanoke River watershed: 30% of wells > 50 ppb
Explanation
Well Locations
Mn! 0 - 50
! 50 - 300
! 300 - 1500
"J Mn Mine Locations
Roanoke River Watershed
Dissolved Manganese (ppb)
Manganese concentrations are elevated in groundwater of the Roanoke River watershed: 30% of wells > 50 ppb
HM
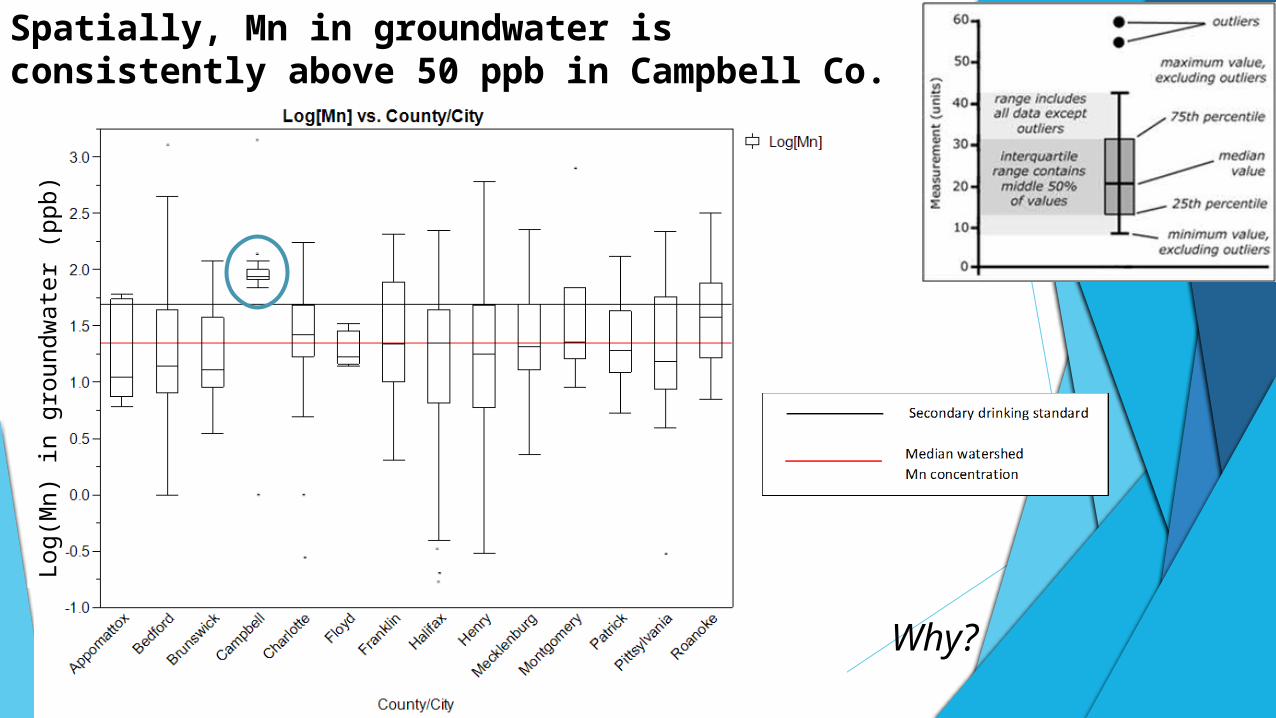
Spatially, Mn in groundwater is consistently above 50 ppb in Campbell Co.
Why?
Log
(Mn
) in
gro
undw
ate
r (p
pb)
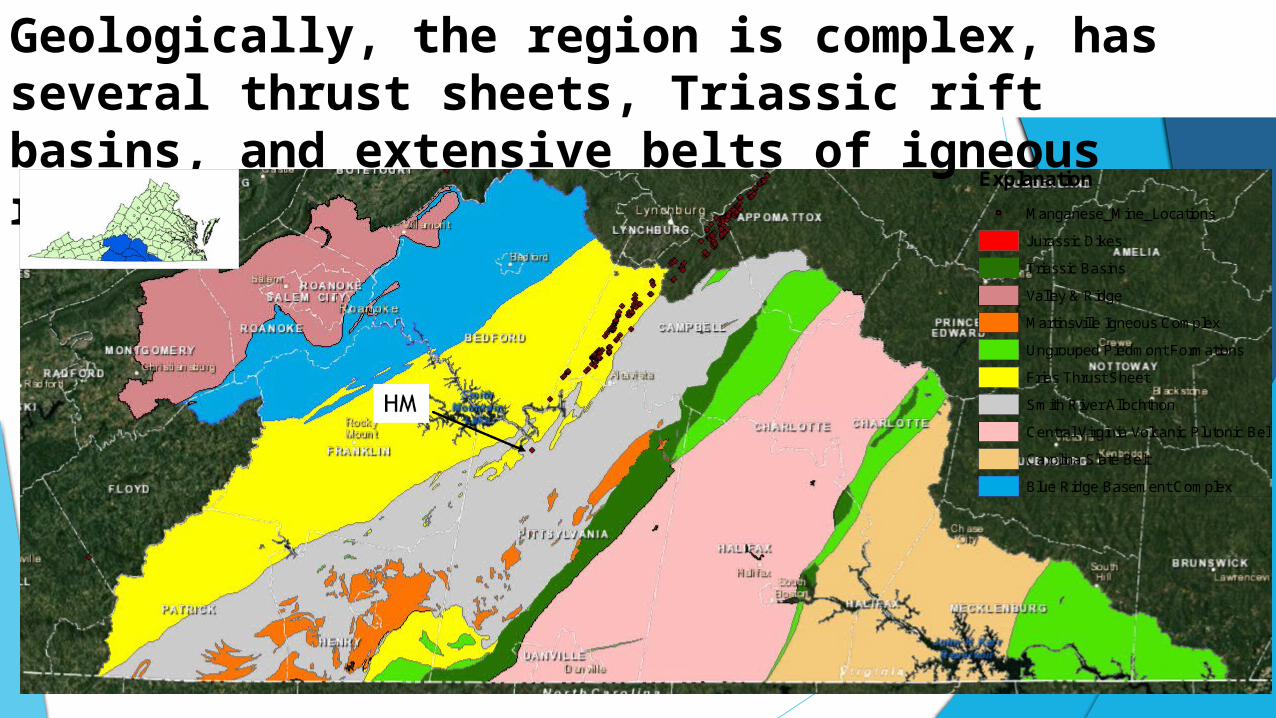
Geologically, the region is complex, has several thrust sheets, Triassic rift basins, and extensive belts of igneous rocks.
Explanation
Manganese_Mine_Locations
Jurassic Dikes
Triassic Basins
Valley & Ridge
Martinsville Igneous Complex
Ungrouped Piedmont Formations
Fries Thrust Sheet
Smith River Allochthon
Central Virginia Volcanic Plutonic Belt
Carolina Slate Belt
Blue Ridge Basement Complex
s
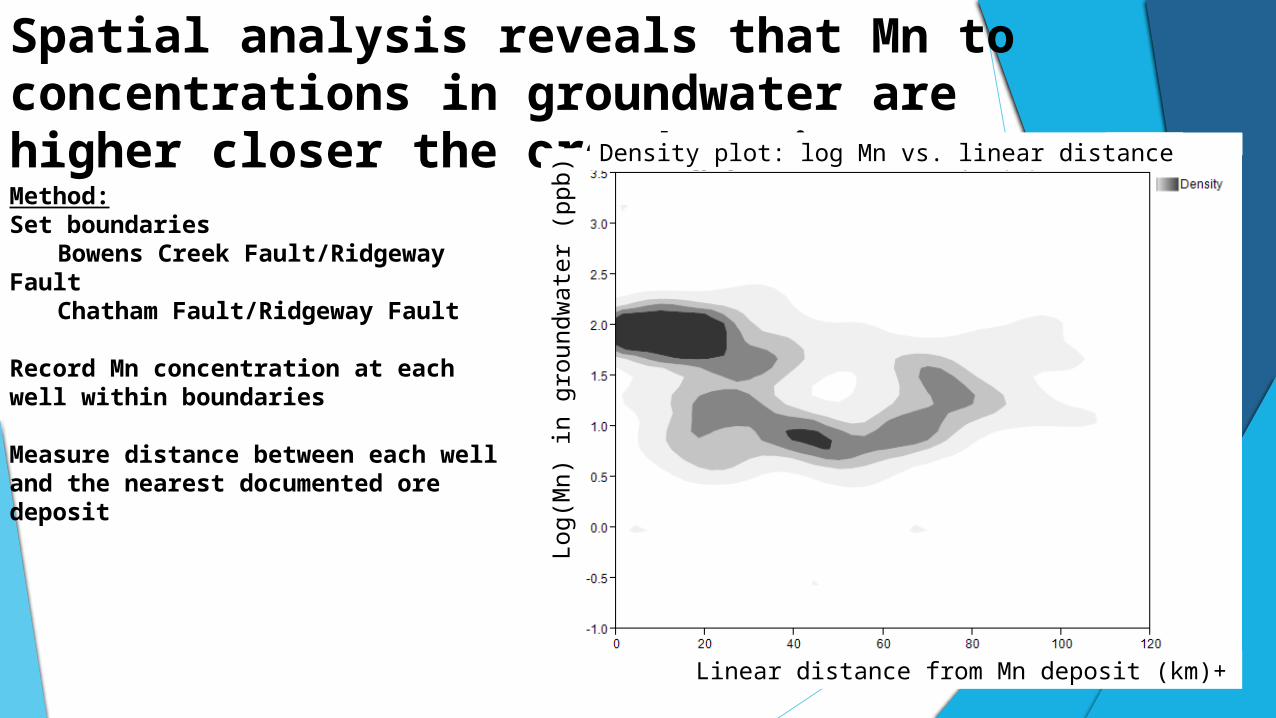
Spatial analysis reveals that Mn to concentrations in groundwater are higher closer the ore deposits
Log
(Mn
) in
gro
undw
ate
r (p
pb)
Density plot: log Mn vs. linear distance
Linear distance from Mn deposit (km)+
Method:Set boundaries
Bowens Creek Fault/Ridgeway Fault
Chatham Fault/Ridgeway Fault
Record Mn concentration at each well within boundaries
Measure distance between each well and the nearest documented ore deposit
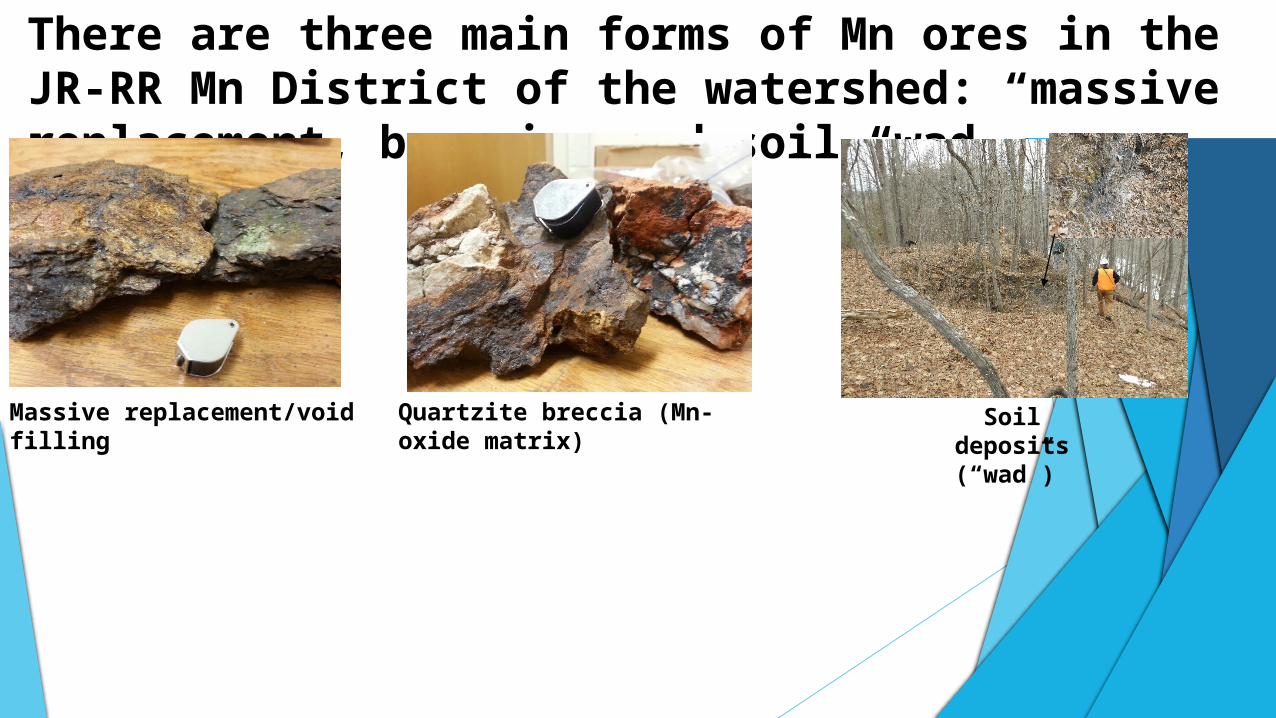
There are three main forms of Mn ores in the JR-RR Mn District of the watershed: massive replacement, breccia, and soil “wad”
Quartzite breccia (Mn-oxide matrix)Massive replacement/void filling Soil deposits (“wad”)

There are three main forms of Mn ores in the JR-RR Mn District of the watershed: massive replacement, breccia, and soil “wad”
Samples from the Hutter Mine
How were these ores formed?
Quartzite breccia (Mn-oxide matrix)Massive replacement/void filling Soil deposits (“wad”)
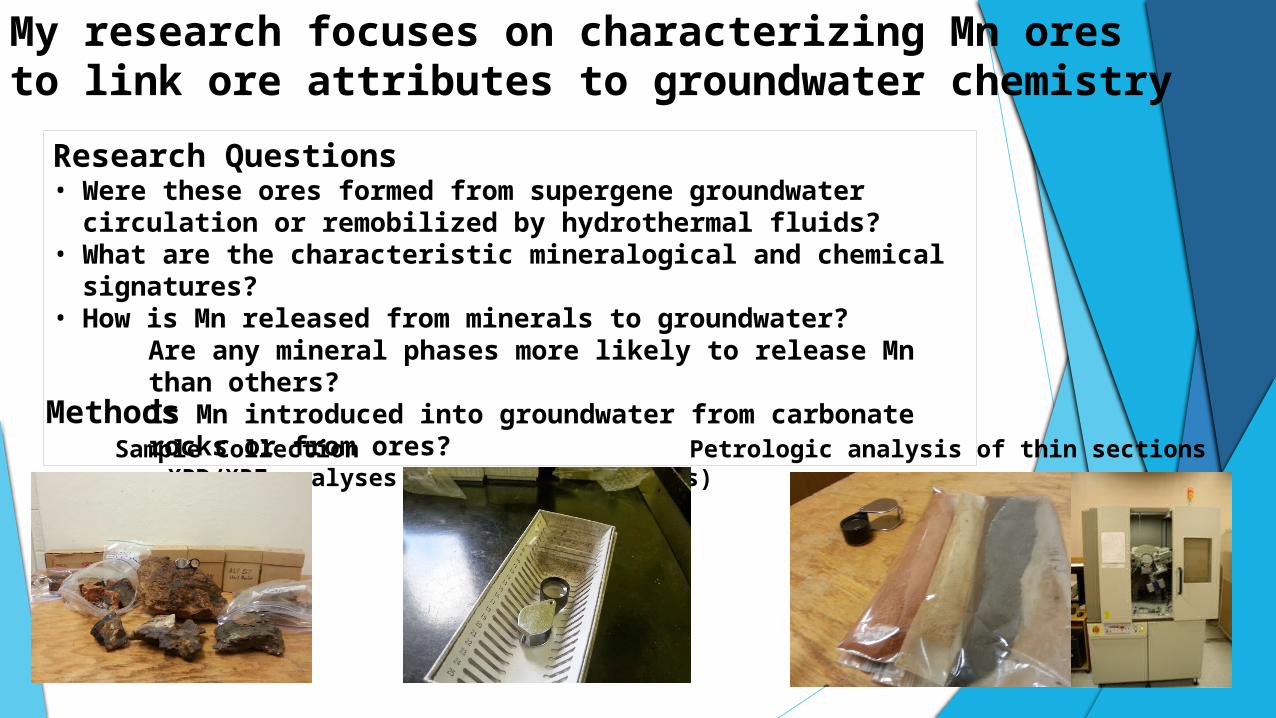
My research focuses on characterizing Mn ores to link ore attributes to groundwater chemistry
Sample Collection Petrologic analysis of thin sections XRD/XRF analyses (mineralogy/elements)
Research Questions• Were these ores formed from supergene groundwater circulation or
remobilized by hydrothermal fluids?• What are the characteristic mineralogical and chemical signatures?• How is Mn released from minerals to groundwater?
Are any mineral phases more likely to release Mn than others?Is Mn introduced into groundwater from carbonate rocks or from ores?
Methods

Preliminary results…
A sneak peak of what is to come…
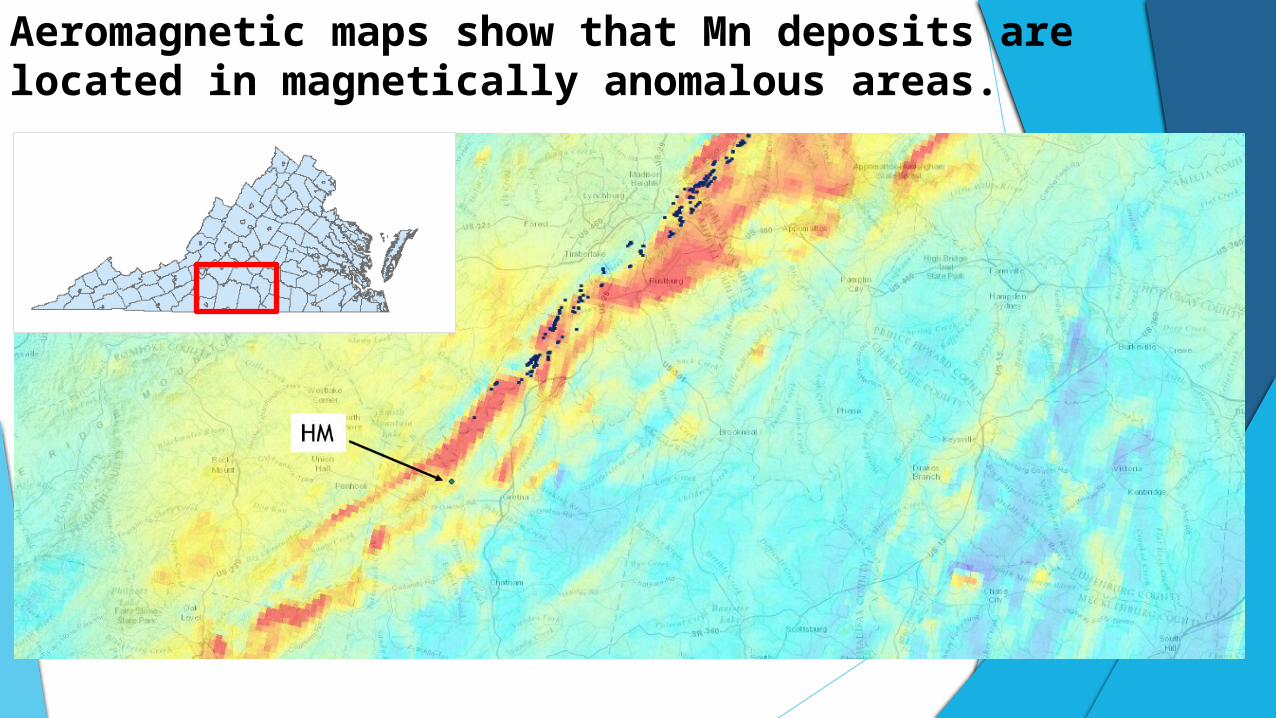
Aeromagnetic maps show that Mn deposits are located in magnetically anomalous areas.
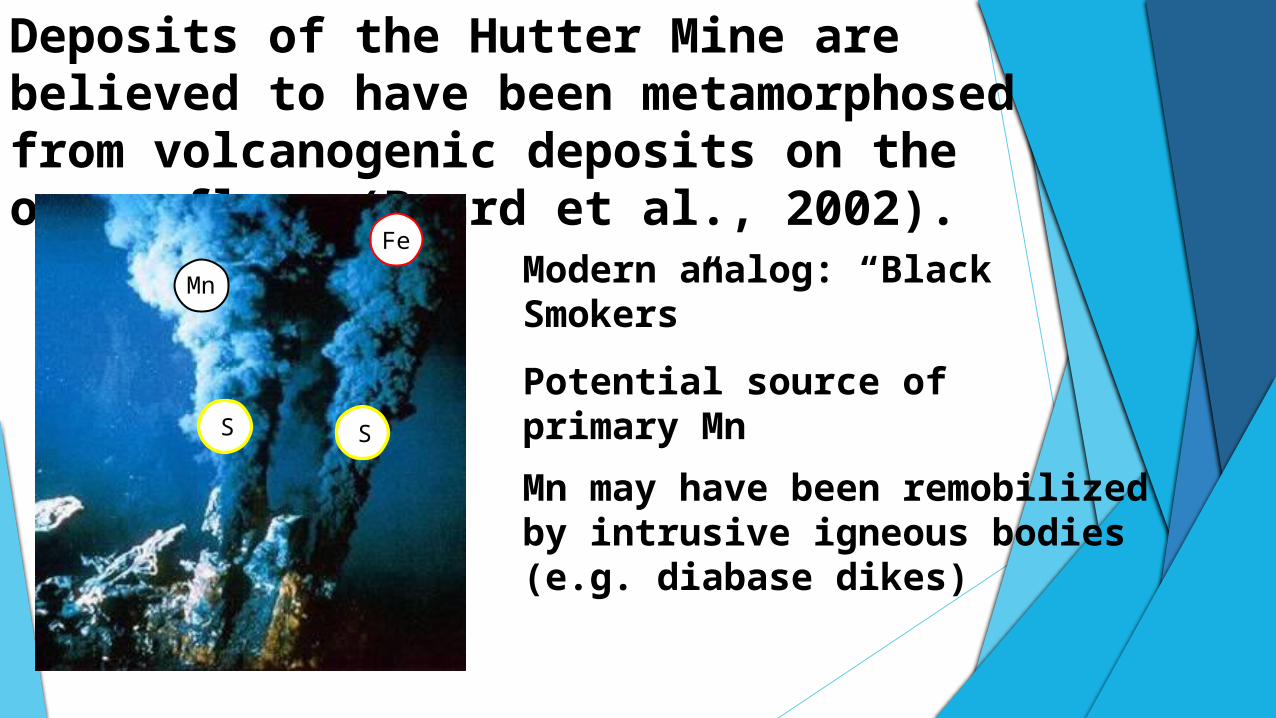
Deposits of the Hutter Mine are believed to have been metamorphosed from volcanogenic deposits on the ocean floor (Beard et al., 2002).
Modern analog: “Black Smokers”
Potential source of primary Mn
Mn may have been remobilized by intrusive igneous bodies (e.g. diabase dikes)
S S
Mn
Fe

These types of deposits may explain the presence of other “hot spots” in the study area.
Potential Mn ores?
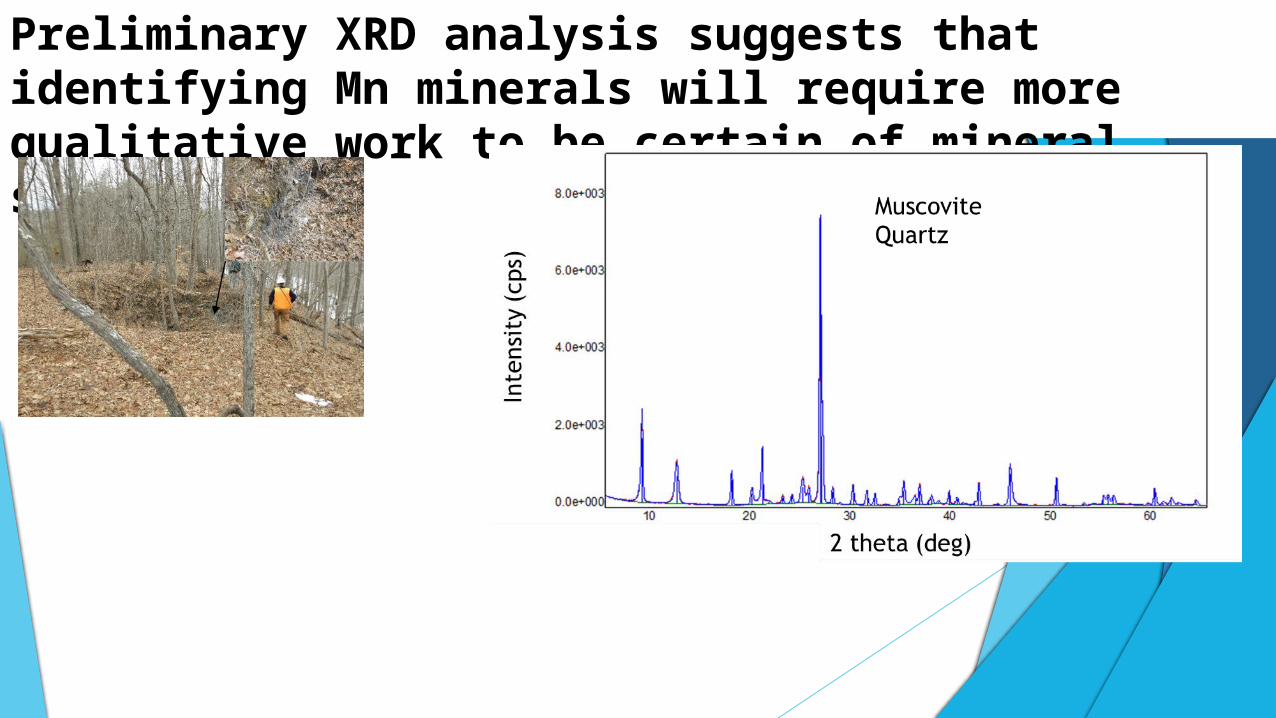
Preliminary XRD analysis suggests that identifying Mn minerals will require more qualitative work to be certain of mineral species.
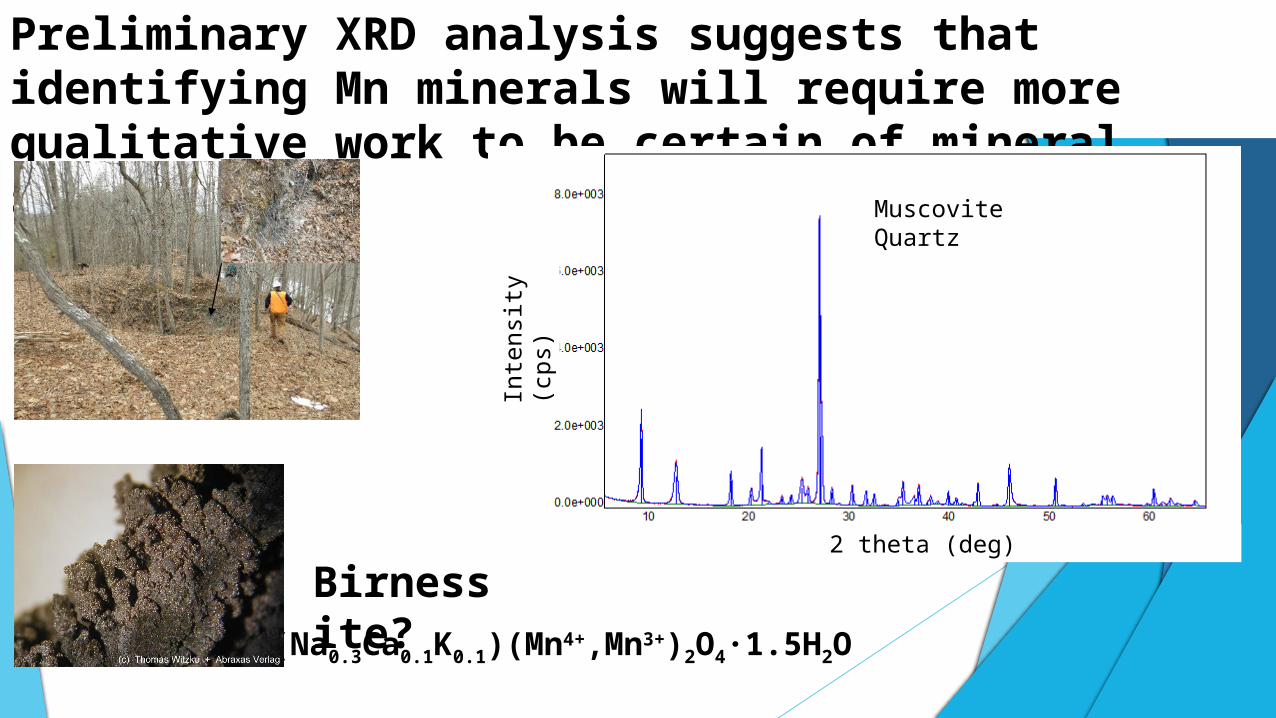
Preliminary XRD analysis suggests that identifying Mn minerals will require more qualitative work to be certain of mineral species.
Birnessite?(Na0.3Ca0.1K0.1)(Mn4+,Mn3+)2O4·1.5H2O
MuscoviteQuartz
2 theta (deg)In
tensi
ty
(cps)
MuscoviteQuartz
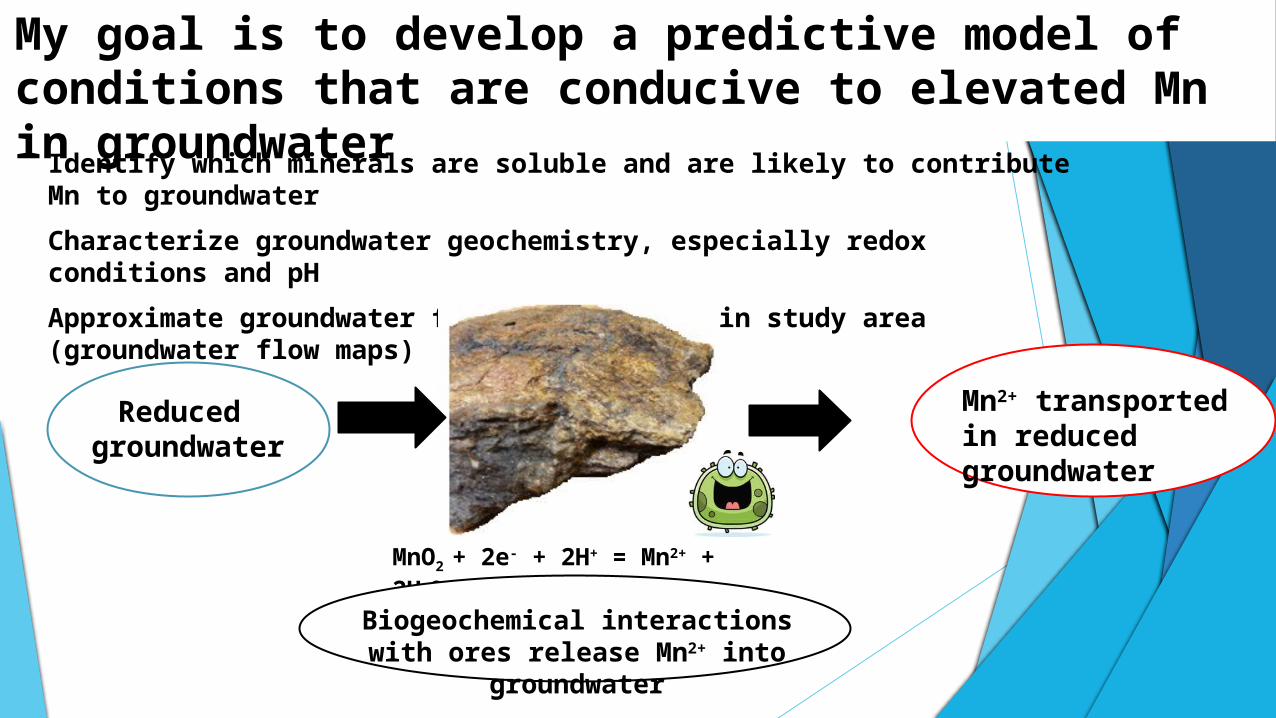
My goal is to develop a predictive model of conditions that are conducive to elevated Mn in groundwater
Identify which minerals are soluble and are likely to contribute Mn to groundwater
Characterize groundwater geochemistry, especially redox conditions and pH
Approximate groundwater flow direction(s) in study area (groundwater flow maps)
MnO2 + 2e- + 2H+ = Mn2+ + 2H2O
Mn2+ transported in reduced groundwater
Reduced groundwater
Biogeochemical interactions with ores release Mn2+ into groundwater
Acknowledgements
Committee MembersMadeline Schreiber
William Henika
J. Donald Rimstidt
Jim Beard, VMNH
I would also like to thank the following individuals for their contributions to this project.
Joshua Rubenstein, DMME
William Lassetter, DMME
Neil Johnson