Embed Size (px)
Citation preview

Resource EvaluationProgram Report
Geological & GeophysicalData Acquisition Outer Continental ShelfThrough 2006-2007-2008
MM S U.S. Department of the InteriorMinerals Management ServiceResource Evaluation Division
OCS ReportMMS 2010-013
By George Dellagiarino,and Joseph Maloney

i
OCS Report MMS 2010-013 Resource Evaluation Program Report
Geological & Geophysical Data Acquisition Outer Continental Shelf Through 2006-2007-2008 By George Dellagiarino And Joseph Maloney A work of this nature requires assistance from numerous sources. The statistics in this report are a result of an agency-wide effort by geoscientists. We would like to thank John Johnson and Harshad Patel (Gulf of Mexico/Atlantic), Susan Banet (Alaska), and Frank Victor (Pacific)
U.S. Department of the Interior Minerals Management Service Herndon, Virginia Resource Evaluation Division 2010

ii
Contents Abbreviations ............................................................................................................. iv Introduction..................................................................................................................1 Permits, Data Acquisition, and Reimbursement.......................................................4 Geophysical Data Surveys ...........................................................................................4 Common Depth Point, 3-D, 4-D, 4-C, AVO, Gravity, and Magnetic Surveys......................................................................................................4 Geological Data Collection ..........................................................................................5 Bottom Sampling and Shallow Coring .....................................................................5 Deep Stratigraphic Tests ...........................................................................................6 G&G Data Release .......................................................................................................6 Analysis of Present MMS Data Coverage on the OCS .............................................6 Mileage/Blocks ........................................................................................................6 Geological and/or Geophysical Exploration Permits...............................................7 Expenditures ............................................................................................................8 Comparisons to Industry.............................................................................................9 Tables ..........................................................................................................................10 Bibliography ...............................................................................................................17 Appendix .....................................................................................................................18 Alaska Tables for Data Acquisitions, Permits, Expenditures .................................20 Atlantic Tables for Data Acquisitions, Permits, Expenditures ...............................24 Gulf of Mexico Tables for Data Acquisitions, Permits, Expenditures ...................28 Pacific Tables for Data Acquisitions, Permits, Expenditures .................................32 Glossary ......................................................................................................................36
Figure
1. Figure 1: Lower 48 Planning Program Areas .......................................................................2 2. Figure 2: Alaska Planning Areas ……………………………………………………..3

iii
Tables 1. Summary of Estimates of CDP (2-D) Seismic Miles in the MMS Inventory Through FY 2008 by Planning Area.......................................................................10 2. Summary of 2-D Seismic Data Acquisition for FY 1968-2008 .............................11 3. Summary of 3-D Seismic Data Acquisition for FY 1968-2008 .............................11 4. Summary of Geological and Geophysical Data Acquisition by Data Type and Region, FY 1968-2008............................................................................12 5. Total Number of Permits Issued for Geological and Geophysical Exploration..............................................................................................................13 6. Summary of Total Annual Expenditures by the MMS for Geological and Geophysical Data Acquisition by Region, FY 1968-2008 .....................................14 7. Summary of Geological and Geophysical Data Acquisition Expenditures by Data Type and Region, FY 1968-2008..............................................................15 8. Summary of Average Cost Per Mile by the MMS for 2-D Seismic Data, FY 1968-2008 .........................................................................................................16

iv
Abbreviations AVO Amplitude Variation with Offset data CDP Common depth point seismic data CFR Code of Federal Regulations COST Continental Offshore Stratigraphic Test CSEM Controlled Source Electromagnetic survey DOI Department of the Interior DST Deep stratigraphic test (well) FY Fiscal Year G&G Geological and geophysical GOM Gulf of Mexico GRAV Gravity data HRD High-resolution seismic data MAG Magnetic data MMS Minerals Management Service OBS Ocean Bottom Seismometers OCS Outer Continental Shelf OCSLA Outer Continental Shelf Lands Act RE Resource Evaluation REP Resource Evaluation Program SEG Society of Exploration Geophysicists 4-C Four component seismic data 2-D Two-dimensional seismic data 3-D Three-dimensional seismic data 4-D Four-dimensional seismic data

1
Introduction This report addresses the general role of the Minerals Management Service (MMS) Resource Evaluation Program (REP) in geological and geophysical (G&G) data acquisition and permitting activities. The MMS administers the provisions of the Outer Continental Shelf Lands Act (OCSLA) through regulations found at Title 30 of the Code of Federal Regulations (CFR). The regulations govern permitting, data acquisitions and release, leasing, and postlease operations on the Outer Continental Shelf (OCS). The OCS is divided into planning areas for administrative purposes as shown in figures 1 and 2. With regard to the REP, authority has been vested in the Secretary of the Interior under 30 CFR Part 251 to regulate prelease G&G exploration for oil, gas, and sulphur resources on the OCS. Part 251 applies not only to G&G exploration but to scientific research as well. The purpose of these regulations is to prescribe (1) when a permit or the filing of a notice is required to conduct G&G activities on the OCS and (2) operating procedures for conducting exploration, as well as requirements for disclosing data and information, conditions for reimbursing permittees for certain costs, and other conditions under which exploration shall be conducted. Similar regulations addressing prelease prospecting activities for minerals other than oil, gas, or sulphur can be found in 30 CFR Part 280. In this report, the totals for permits issued, mileage acquired, and expenditures reflect the overall trends of oil and gas pricing, limitations of areas due to offshore moratoria, and the shift of industry emphasis to foreign theatres. Also reflected is the trend among the MMS regions with diminished leasing activity to obtain digital tapes of in-house analog data for data release, which has commenced with the expiration of proprietary terms beginning in 2001, as discussed by Fulton (1998).

Figure 1: Lower 48 Planning Areas
2

Figure 2: Alaska Planning Areas
3

4
Permits, Data Acquisition, and Reimbursement The permits, issued by the Resource Evaluation (RE) Regional supervisors, set forth the specific requirements for each data-gathering activity, which includes the area where the data are collected, the timing of the data-gathering activity, approved equipment and methods, and other similar detailed information relevant to each specific permit. The primary sources of the G&G data used by the REP are geophysical acquisition companies that license their acquired data to the oil and gas industry. These data are further processed by oil companies and used for exploration, development, and production activities on OCS lands. While the MMS does not perform any direct data-collection activities, it does issue permits to industry for collecting prelease G&G data. Lessees and operators are also required by regulations to provide data from their leases to the MMS. The MMS has access to the permitted data and information as a condition set forth in the permit. The MMS selectively obtains copies from these activities. Data from prelease permits constitute approximately 90 percent of the MMS database. Reimbursement for data collected by permittees and lessees in their normal conduct of business is for only the cost of data reproduction. However, if industry has collected data in areas not under the MMS jurisdiction, e.g., State waters or adjacent foreign waters, and MMS selects such data, the MMS pays the significantly higher “market price” for obtaining such data.
Geophysical Data Surveys
Common Depth Point, 3-D, 4-D, 4-C, AVO, Gravity, and Magnetic Surveys A large percentage of the geophysical data in the MMS inventory is two-dimensional (2-D) common depth point (CDP) seismic information collected along a survey line. Also known as common midpoint or common reflection point data, it is derived from a common location in the ocean subbottom where sound waves originating from various positions of the seismic (sound) source near the ocean surface are reflected back toward the surface. Estimates of the amount of these data in the MMS inventory by planning area are shown in table 1. A slightly larger and faster growing percentage of geophysical data and information in the MMS Inventory is three-dimensional (3-D) seismic information. By collecting data along parallel, closely spaced survey lines, spatial relationships are determined in three dimensions. A newer form of information processing is Amplitude Variation with Offset (AVO). This involves the variation in amplitude of a seismic reflection with the angle of incidence or source-geophone distance and is processed using the raw data gathered. It can be used as a direct hydrocarbon gas indicator. A new type of data acquisition is 2D or 3D Four component (4-C), which involves the recording of marine seismic data with ocean bottom seismometers (OBS) on the sea floor where each OBS consists of a hydrophone recording pressure changes of passing P-waves and three orthogonal geophones recording movement in three components of direction (x, y, and z axes) of passing shear waves (s-waves). Three dimensional (3-D) 4-C is a recording of multiple parallel lines of seismometers achieved by recording seismic waves from each line simultaneously or in sequence by recording a line of geophones, moving the line a short distance and parallel to the previous line, etc.

5
Magnetic surveys measure the magnetic field or a component (such as the vertical component) at a series of different locations over an area of interest usually to locate concentrations of magnetic anomalies or to determine depth to basement. Gravity surveys produce measurements of the gravitational field at a series of different locations over an area of interest. The objective in exploration work is to map density differences that may indicate different rock types. Gravity data usually are displayed as anomaly maps. Controlled Source Electromagnetic (CSEM) surveys are being now conducted in areas of the Gulf of Mexico (GOM). Although not a new technology, it is new for the deeper water provinces. It can be used with seismic data to generate direct recognition of hydrocarbon fluid resistivity in potential subsurface reservoirs. The evolution of 3-D seismic data and information in conjunction with interactive computer workstations has made it possible to more closely define and assess the potential for oil and gas occurrence on the OCS, especially with regard to subsalt prospects. The 3-D information is used to delineate, in greater detail than that of traditional 2-D information, subsurface geologic conditions associated with the occurrence of oil and gas. As 3-D seismic technology evolved, the use of 3-D reflection techniques not only portrayed subsurface structure and stratigraphy, but revealed information about fluids within the subsurface. Three dimensional seismic surveys that are shot over the same area at different times can detect, where present, changes from one fluid to another, e.g., oil to water, fluid flows, and pressure changes. Thus, time-lapse 3-D seismic surveys, known more commonly as 4-D seismic surveys, have been used to monitor fluid movement in producing reservoirs where changes in fluid content are imaged with seismic techniques over a period of time. Its chief use to date has been reservoir management, e.g., determining where and how long to drain hydrocarbon-bearing areas and to monitor gas injection or steam or water flooding during enhanced recovery operations. The proprietary term for geophysical information (i.e., seismic sections, etc.) purchased by the MMS is 25 years; for raw geophysical data it is 50 years.
Geological Data Collection
Bottom Sampling and Shallow Coring Bottom samples are obtained by dropping a weighted tube to the ocean floor and recovering it with an attached wire line. They can also be obtained from dredging. Shallow coring is performed by conventional rotary drilling equipment to obtain a near-surface sample of the rocks of the seabed. The proprietary term for these kinds of geological information is 10 years.
6
Deep Stratigraphic Tests A deep stratigraphic test, as defined in 30 CFR 251, means, “drilling that involves the penetration into the sea bottom of more than 500 feet (152 meters).” These wells are known as Continental Offshore Stratigraphic Test (COST) wells and are drilled primarily to gather geological information. Conversely, shallow test drilling, as defined in the same regulations, means, “drilling into the sea bottom to depths less than those specified in the definition of a deep stratigraphic test.” Three COST wells have encountered hydrocarbons: the COST B-3 (Atlantic), Point Conception No.1 (California), and the Norton COST No. 2 (Alaska). The proprietary term for a COST well is 25 years or, if a lease sale is held in the area, 60 days after the issuance of a lease within 50 geographic miles of the test. A discussion of the cost well program is described by Dellagiarino (1991).
G&G Data Release
Regulations, promulgated in 1976, require all prelease G&G information be held proprietary for 25 years, and then be released to the public. Hence, the first data sets were released in 2001. These data sets are in southern Alaska, Southern California through Washington/ Oregon, the North, Mid, and South Atlantic planning areas, and in Eastern, Central, and Western GOM areas. Notices on the availability of these data may be found at the Regional links to the MMS homepage at http://www.mms.gov.
Analysis of Present MMS Data Coverage on the OCS
Mileage/Blocks A leading indicator of the amount of OCS oil and gas activity is the number and associated mileage of prelease exploration permits that the MMS issues to industry each year. Between 1968 and the early 1990’s, industry has shot and recorded approximately 500,000 line miles of CDP data each year on the OCS. Of that data, the MMS has selected and acquired approximately 50,000 line miles of those CDP data each year for the REP. Since the early 1990s, the MMS, as well as industry, has increased its acquisition of 3-D seismic data in concert with the development and use of interactive workstations. Table 1 shows the CDP (2-D) seismic data coverage, by region and planning area that the MMS has in its inventory. The grid coverage is not uniform over the planning areas. Tables 2, 3, and 4 summarize the MMS data acquisitions through 2008. It should be noted that 3-D seismic information in the MMS inventory is just about equal to the 2-D holdings in that 33,000 blocks of 3-D information equates to about 1.5 million miles of conventional seismic information. The MMS has not acquired all of the permit data shot and recorded by industry because of budget restrictions on reimbursing the permittees for data reproduction and some processing; the lack of the necessary personnel to manage, interpret, and analyze this large volume of data, as well as the need for media storage capacity; and, primarily, the redundancy of data

7
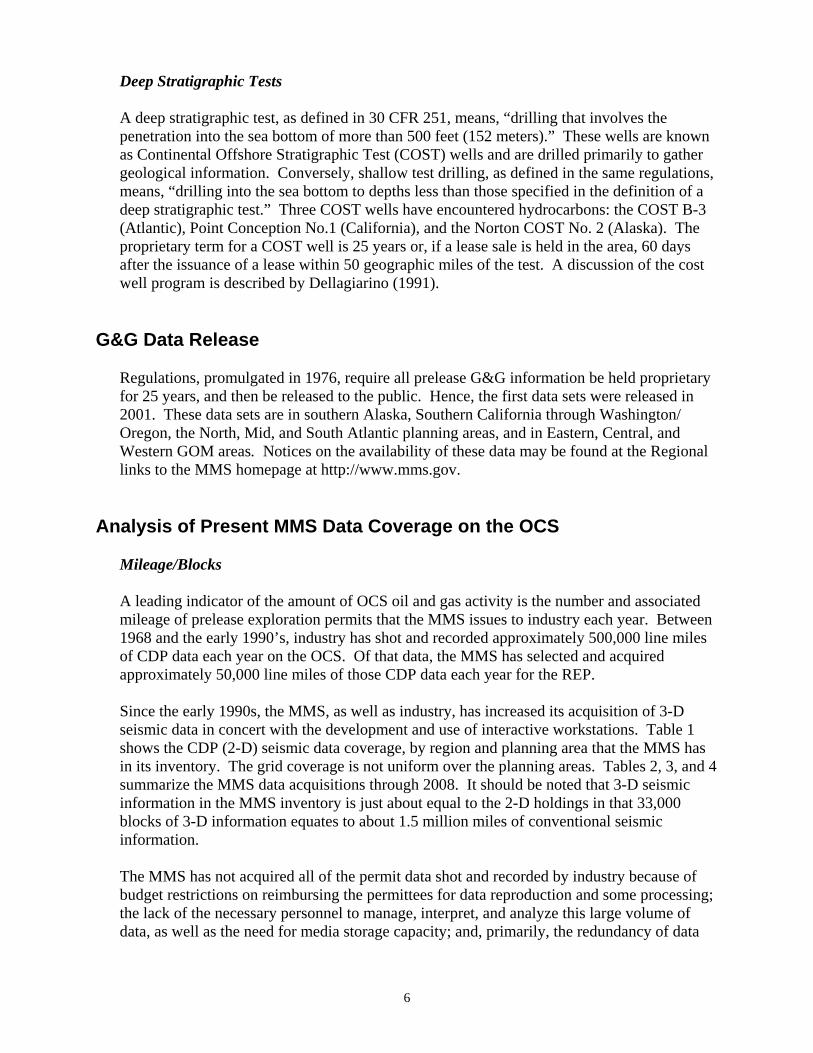
shot on the OCS by different companies. However, in some areas in which the MMS has previously obtained 2-D or 3-D seismic information, it will acquire new information that is derived from data acquired more recently with state-of-the-art equipment and methods, such as AVO, or from previously acquired data that are reprocessed using more modern techniques. The Regions formerly spent funds on prelease high-resolution data (HRD), as these data were acquired under exclusive contract rather than under permit. A change in policy in 1982 altered this situation. Under the previous program, the MMS directly acquired prelease, tract-specific, shallow hazards data. Under the area wide leasing program, the detailed shallow hazards analysis function was shifted to the post sale phase, and the responsibility for site-specific hazards data collection was placed on the lessee as a condition to obtain a drilling permit. If industry chooses to conduct prelease hazards surveys, G&G permits must be obtained from the MMS. Shallow hazards survey data and information are available to the MMS under terms of permit or lease and regulations. This practice has continued under the focused leasing approach adopted in 1984. Geological and/or Geophysical Exploration Permits As mentioned, the number of permits issued by the MMS and the areas for which the permits are issued are leading indicators of oil and gas activity on the OCS. Table 5 presents the statistics of G&G exploration permitting for the OCS since 1960, with a differentiation between geological permits and geophysical permits from 1969 to 2008. The MMS tracks G&G permits by calendar year. (Tables A-2, A-6, A-10, and A-14 show total permits per Region.) They demonstrate that most OCS oil and gas activity has been in the Gulf of Mexico. The GOM has issued 83 percent of all permits and is followed by the Alaska Region with 9 percent. The Pacific Region has issued 6 percent of the permits, followed by the now defunct Atlantic Region with about 2 percent. However, since 1994 activities in the Atlantic have been assigned to the GOM Region. With the addition of these responsibilities, the percentage of total permits for the GOM Region increases to 85 percent. These statistics correlate extremely well with the dominant position of the Central and Western GOM planning areas in OCS oil and gas activities. It should be noted that since 1969, approximately 95 percent of the permits issued were for geophysical exploration and that geological exploration permits accounted for only 5 percent. While the total number of 3-D permits compared to all permits issued is rather small (8 percent) when compared with the total geophysical permits issued, over the past 10 years, 3-D permits have averaged 49 percent of all geophysical permits. Permits for deep stratigraphic test wells or COST wells account for about 2 percent of the geological permits. The overall trends in permitting for all the Regions are similar and reflect fluctuations in the price and supply of petroleum. Some regional differences can be detected that are related to leasing moratoria, operating conditions, and hydrocarbon discoveries. Leasing moratoria and adverse weather conditions decrease exploration activity.

8
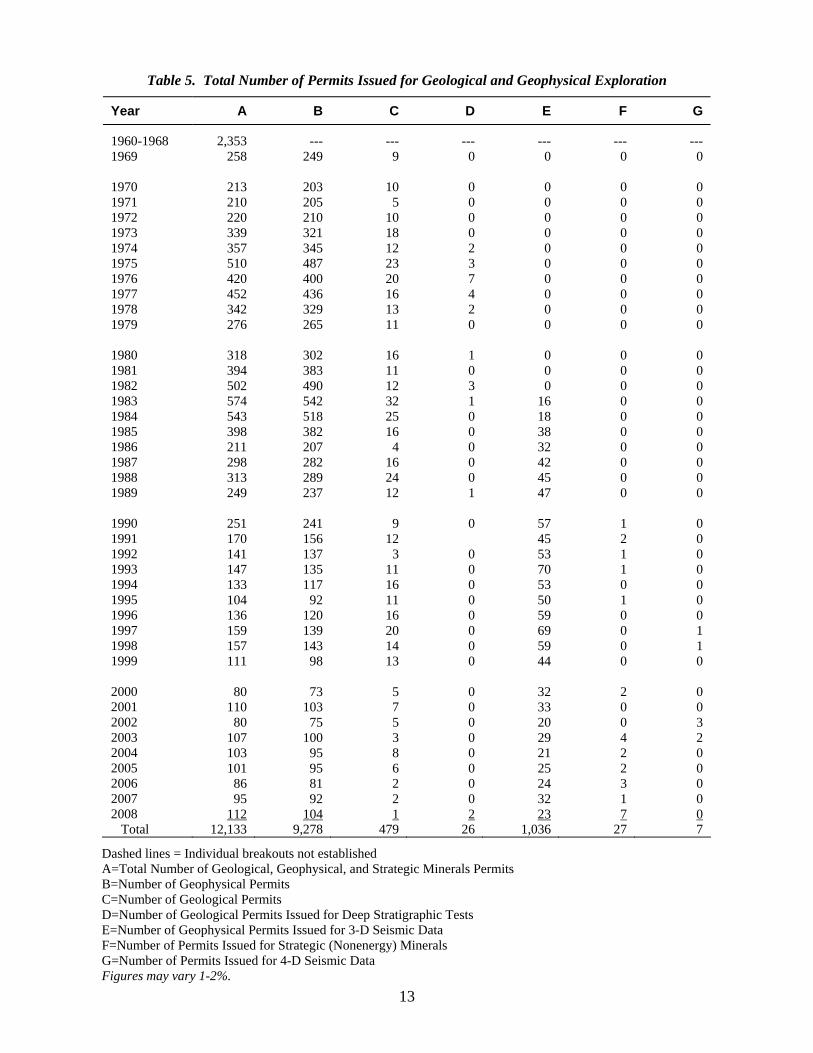
Expenditures The MMS records financial and procurement transactions by fiscal year (FY). All figures and tables involving the MMS data acquisition from permittees are based on a fiscal year that begins on October 1 and extends through the following September 30. Tables 6 and 7 show the total expenditures for G&G data since 1968 for those data presented in table 4. Tables 6 and 7 show the distribution of G&G expenditures by Region. The GOM and Alaska have the largest portion of the expenditures with 39 and 37 percent respectively. Alaska has over twice the offshore area of the other three Regions combined. On the other hand, the GOM, with over 95 percent of OCS production, possesses the largest database. The Atlantic Region (13 percent of the expenditures) and the Pacific (10 percent) are comparable. The Pacific Region has the smallest slice of the expenditures for G&G data because much of the California OCS and offshore Washington and Oregon have been under moratoria since the 1980s. Much of the Atlantic Region is also under moratoria and there is no new seismic information being collected that MMS would acquire. The main difference between the two Regions, according to table 7 is in the acquisition of high-resolution data in the Atlantic. The GOM Region’s dominant role in establishing the offshore industry is apparent by its acquisition of the majority of the data before 1976 and more so since 1990. Between 1976 and 1989, a significant portion of the MMS G&G data acquisition budget has been expended by the Alaska Region, which oversees most of the OCS lands. However, since the 1990s and up through the present, most of the MMS G&G data acquisition budget has been allocated for data in the GOM. There were large values for the average cost per mile for data in the Alaska Region from the late 1970s into the 1990s and for the Atlantic Region in the 1980s. The Alaska Region purchased a great deal of data shot in State waters, where a Federal permit is not applicable. Thus, the reimbursement did not fall under the provisions of the OCSLA, and the MMS was required to pay full market price for these data. The price varied from $1,500 to $6,000 per mile and is reflected in the unusually high average cost per mile shown in table 8. The Atlantic Region contracted for several sets of exclusive high-resolution data that were used for sales and hazards studies. The high price of exclusive high-resolution data, some well over $450 per mile, increased the average cost per mile in the Atlantic Region that year. Overall, the early to mid-1980s saw a dramatic increase in expenditures by the MMS, as more reprocessed data were acquired to address area wide leasing and a more aggressively proposed 5-year OCS leasing schedule. However, due to regulatory changes in reimburse- ment procedures in 1986, the cost per mile has dropped dramatically. With a less aggressive 5-Year Leasing Schedule and new exploration theatres worldwide, total expenditures have decreased from the 1980s to the present.

9
Comparisons to Industry Industry has tended to acquire more data than the MMS. However, of the data shot by industry in the Alaska OCS, the MMS has acquired approximately 90 percent. Alaska remains a large frontier area with limited data coverage by industry, a fact that necessitates the MMS to acquire as much of these data as feasible. In recent years, the GOM has acquired most 3-D surveys and most large 2-D surveys. However, the MMS does not acquire the volume that industry obtains to reprocess. The MMS acquired more data in the Atlantic Region than industry in 1976 and 1983. Before 1976, the MMS database was limited because industry had shown very little interest in leasing this frontier area, although industry had been acquiring geophysical data. During the period 1976 to 1984, the MMS not only acquired most of the industry data, but purchased much of the pre-1976 data. Since 1985, there has been less activity, reflecting a decrease in industry interest. Some of the reasons the MMS does not acquire all the data held by industry are as follows:
• Redundancy of data, because industry does not share it, • Difference in data quality, • Budgetary constraints, • Personnel limitations for data reduction and interpretations, and • Data storage, retrieval and display limitations.
In conclusion, totals for mileage acquired, permits issued, and expenditures reflect the overall trends of oil and gas pricing, limitations of areas due to offshore moratoria, and a shift of industry emphasis to foreign theatres.

10
Table 1. Summary of Estimates of CDP (2-D) Seismic Miles in the MMS Inventory Through FY 2008 by Planning Area
(Rounded off to Nearest 1,000 Miles)
Planning Area Estimated Mileage
Alaska
Gulf of Alaska Cook Inlet Kodiak Shumagin North Aleutian St. George Basin Aleutian Arc Bowers Basin Aleutian Basin St. Matthew-Hall Norton Basin Navarin Basin Hope Basin Chukchi Sea Beaufort Sea Total
36,000 21,000 23,000 10,000 43,000 50,000 < 500 <1,000 <1,000 10,000 25,000 55,000 9,000
111,000 77,000 472,000
Atlantic
North Atlantic Mid-Atlantic South Atlantic Straits of Florida Total
93,000 60,000 54,000 7,000 214,000
Gulf of Mexico
Eastern GOM Central GOM Western GOM Total
160,000 755,000 485,000 1,400,000
Pacific
Southern California Central California Northern California Wash./Oregon Total
85,000 21,000 19,000 8,000 133,000
Figures may vary by 1-2%.

11
Table 2. Summary of 2-D Seismic Data Acquisition for FY 1968-2008
FY Total Miles
1968-1975 1976 1977 1978 1979 1980 1981 1982 1983 1984 1985 1986 1987 1988 1989 1990 1991 1992 1993 1994 1995 1996 1997 1998 1999 2000 2001 2002 2003 2004 2005 2006 2007 2008 Total
269,814 108,922 42,808 54,426 31,489 19,400 69,904 79,961 120,743 89,853 71,521 47,287 113,680 78,920 53,494 85,280 40,513 49,191 25,482 7,138 8,930 33,296 39,682 90,981 30,135 64,710 6,668 1,506 48,154 101,282 48,829 170,379 108,080 1,984 2,215,411
Figures may vary by 1-2%.
Table 3. Summary of 3-D Seismic Data Acquisition for FY 1968-2008
FY Total Blocks
1968-1992 1993 1994 1995 1996 1997 1998 1999 2000 2001 2002 2003 2004 2005 2006 2007 2008 Total
0 1,563 1,420 1,826 1,470 3,129 3,460 3,226 6,161 3,602 7,182 6,272 6,193 4,996 6,495
11,855 22,606 91,456
Figures may vary by 1-2%.

12
Table 4. Summary of Geological and Geophysical Data Acquisition by Data Type and Region, FY 1968-2008
Data Type Region Mileage*
2-D Seismic
Alaska Atlantic
Gulf of Mexico Pacific Total
472,460 213,936 1,396,174 132,841 2,215,411
High Resolution
Alaska Atlantic
Gulf of Mexico Pacific Total
59,855 49,509 145,768 30,582 285,714
CDP Interpretations
Alaska Atlantic
Gulf of Mexico Pacific Total
84,683 44,801 139,418 42,365 311,267
Gravity and Magnetics
Alaska Atlantic
Gulf of Mexico Pacific Total
372,764 15,783 669,413 110,150 1,168,110
3-D Seismic
Alaska Atlantic
Gulf of Mexico Pacific Total
291 0 91,113 52 91,456
3-D/4-C
Alaska Atlantic
Gulf of Mexico Pacific Total
0 0 37 0 37
AVO
Alaska Atlantic
Gulf of Mexico Pacific Total
0 0 1,559
0 1,559
Deep Stratigraphic Tests
Alaska Atlantic
Gulf of Mexico Pacific Total
14 5 3 2 24
*3-D seismic, 3-D/4-C data, and AVO are measured in blocks and Deep Stratigraphic Test units are wells drilled. Figures may vary 1-2%.
13
Table 5. Total Number of Permits Issued for Geological and Geophysical Exploration
Year A B C D E F G
1960-1968 1969 1970 1971 1972 1973 1974 1975 1976 1977 1978 1979 1980 1981 1982 1983 1984 1985 1986 1987 1988 1989 1990 1991 1992 1993 1994 1995 1996 1997 1998 1999 2000 2001 2002 2003 2004 2005 2006 2007 2008 Total
2,353 258
213 210 220 339 357 510 420 452 342 276
318 394 502 574 543 398 211 298 313 249
251 170 141 147 133 104 136 159 157 111
80
110 80
107 103
101 86 95
112 12,133
--- 249
203 205 210 321 345 487 400 436 329 265
302 383 490 542 518 382 207 282 289 237
241 156 137 135 117 92
120 139 143 98
73
103 75
100 95
95 81 92
104 9,278
--- 9
10
5 10 18 12 23 20 16 13 11
16 11 12 32 25 16
4 16 24 12
9
12 3
11 16 11 16 20 14 13
5 7 5 3 8
6 2 2 1
479
--- 0
0 0 0 0 2 3 7 4 2 0
1 0 3 1 0 0 0 0 0 1
0
0 0 0 0 0 0 0 0
0 0 0 0 0
0 0 0 2
26
--- 0
0 0 0 0 0 0 0 0 0 0
0 0 0
16 18 38 32 42 45 47
57 45 53 70 53 50 59 69 59 44
32 33 20 29 21
25 24 32 23
1,036
--- 0
0 0 0 0 0 0
0 0 0 0
0 0 0 0 0 0 0 0 0 0
1 2 1 1 0 1 0 0 0 0
2 0 0 4 2
2 3 1 7
27
--- 0
0 0 0 0 0 0 0 0 0 0
0 0 0 0 0 0 0 0 0 0
0 0 0 0 0 0 0 1 1 0
0 0 3 2 0
0 0 0 0 7
Dashed lines = Individual breakouts not established A=Total Number of Geological, Geophysical, and Strategic Minerals Permits B=Number of Geophysical Permits C=Number of Geological Permits D=Number of Geological Permits Issued for Deep Stratigraphic Tests E=Number of Geophysical Permits Issued for 3-D Seismic Data F=Number of Permits Issued for Strategic (Nonenergy) Minerals G=Number of Permits Issued for 4-D Seismic Data Figures may vary 1-2%.

Table 6. Summary of Total Annual Expenditures by the MMS for Geological and Geophysical Data Acquisition by Region, FY 1968-2008 (in dollars)
FY Alaska Atlantic Gulf of Mexico Pacific Total
1968-1975 1976 1977 1978 1979 1980 1981 1982 1983 1984 1985 1986 1987 1988 1989 1990 1991 1992 1993 1994 1995 1996 1997 1998 1999 2000 2001 2002 2003 2004 2005 2006 2007 2008 Total
3,162,548 3,496,607 450,161 3,421,269 6,240,687
6,972,885 6,842,045 1,864,661 5,673,514 4,751,354 3,676,375 2,904,246 2,579,190 1,382,560 389,960
886,402 539,986 99,797 322,410 582,132 379,395 283,764 204,655 278,606 543,775
354,448 67,324 762,911
0 0
22,000 53,826 198,555 44,645 59,432,693
361,686 2,504,710 2,287,390 906,989 232,085
4,469,762 1,530,898 1,945,270 1,738,427 1,580,008 318,261 87,307 438,792 71,510 259,629
150 2,790 1,932
0 0 0 0 0 0 0
0 0 0
1,080,000 250,000 168,000
0 0
246,500 20,482,096
9,414,042 3,281,698 3,764,678 1,842,701 1,573,094
4,388,508 1,168,618 2,943,602 3,802,409 4,246,742 2,959,989 1,834,553 1,840,609 1,078,713 913,481
865,083 1,003,066 794,104 1,014,853 760,245 628,752 1,697,494 1,180,893 1,804,694 1,400,781
2,053,285 1,283,496 944,923 445,868 739,561 507,379 310,403 584,400 935,163 63,947,880
1,443,987 581,670 1,147,968 416,463 2,272,407
1,412,062 866,656 1,996,271 1,312,596 1,286,598 861,687 363,564 939,558 114,168 96,354
0
31,000 0
26,700 11,806 21,125 40,867 19,594 10,264 13,350
7,148
0 0 0 0 0 0 0 0
15,293,863
14,891,780* 9,914,882* 7,719,974* 6,587,422 11,020,298* 17,243,217 10,408,217 8,749,804 12,526,946 11,864,702 7,816,312 5,189,670 5,798,149 2,646,951 1,659,424 1,751,635 1,576,842 1,490,798** 1,363,963 1,454,183** 1,142,817** 2,022,125 1,471,967** 2,094,400** 1,957,906 2,414,881*** 1,350,820*** 1,707,834** 1,525,868 989,561 697,379 364,229 782,955 1,226,308 161,424,220
* Included in the budget for these years were General Account funds that were transferred to the U.S. Geological Survey, Branch of Marine Geology, for G&G data acquisition. These accounts included $509,517 in the interval between FY 1968-1975, $50,197 in FY 1976, $69,777 in FY 1977, and $702,025 in FY 1979. **Included in the budget for these years were funds that were used for special projects related to G&G activities. In FY 1992, $494,965 was obligated toward the purchase of geologic interpretive workstations and $100,000 was obligated toward the initiation of the Offshore Northern Gulf of Mexico Oil and Gas Atlas Series. In FY 1994, $100,000 was again obligated toward the preparation of the Offshore Northern Gulf of Mexico Oil and Gas Atlas and in FY 1995, $100,000 was obligated toward the completion of the Atlas, and $13,545 was obligated toward finalization of a well log data conversion contract in the Gulf of Mexico. In FY 1997, $5,000 was obligated towards the curation of Atlantic well samples. In FY 1998, $836 was obligated toward updating the MMS AAPG CD-ROM investment. In FY2002, funds were obligated towards a T-3 Data Access Line, Gravity/Magnetics Interpretations; JIP hydrates participation, and the Earth Model Project. ***Includes $353,111 carried over by the Gulf of Mexico from 1999 and $228,496 carried over from 2000. Figures are rounded and may vary by 1-2%.
14

15
Table 7. Summary of Geological and Geophysical Data Acquisition Expenditures by Data Type and Region, FY 1968-2008
Data Type Region Expenditures ($)*
Alaska
2-D Seismic High Resolution CDP Interpretations Gravity and Magnetics 3-D Seismic 3-D/4-C AVO Total
40,946,587 11,125,798 439,793 1,027,108 1,507,766 0 0 55,047,052
Atlantic
2-D Seismic High Resolution CDP Interpretations Gravity and Magnetics 3-D Seismic 3-D/4-C AVO Total
9,027,538 9,751,232 55,274 2,902 0 0 0 18,836,946
Gulf of Mexico
2-D Seismic High Resolution CDP Interpretations Gravity and Magnetics 3-D Seismic 3-D/4-C AVO Total
31,985,221 12,729,139 856,526 549,483
10,624,389 2,787 267,658 57,015,203
Pacific
2-D Seismic High Resolution CDP Interpretations Gravity and Magnetics 3-D Seismic 3-D/4-C AVO Total
9,553,194 3,696,394 72,175 534,363 27,925 0 0 13,884,051
*MMS has had additional expenditures through its G&G data acquisition budget for other general purchases such as field tapes, special processing, navigation tapes, interpretive hardware and software for evaluation purposes, and geological studies, scanning, and acquisition of digital tapes of in-house analog data. Figures may vary 1-2%.

16
Table 8. Summary of Average Cost Per Mile by the MMS for 2-D Seismic Data, FY 1968-2008
FY Average Cost ($/Mile)
1968-1975 1976 1977 1978 1979 1980 1981 1982 1983 1984 1985 1986 1987 1988 1989 1990 1991 1992 1993 1994 1995 1996 1997 1998 1999 2000 2001 2002 2003 2004 2005 2006 2007 2008
33.60 34.90 30.00 73.60 99.70
91.50
100.70 107.00 102.50 121.10 105.90 102.00 48.30 32.70 26.10
18.00 19.86 7.49 13.33 75.84 22.02 39.04 5.45 3.18 1.40
1.29
68.61/1.34* 2.11*
470.81/0.99* 1.83 0.21 0.17 0.12
161.09/0.49
The $68.61 total includes the cost for data in Cuban waters at the market price. The average cost per line mile for data in Federal waters is $1.34. Likewise, $470.81 represents the market costs to acquire offshore Canadian data and the average cost per line mile for data in Federal waters is $3.79 as is the $161.09 and $0.49 . The $2.11 total includes velocity models for depth data. Figures may vary 1-2%. Note: Summaries reflect average cost per mile for all CDP Information acquired both State and Federal. Average costs reflect only those dollars assigned to the bureauwide G&G budget and do not reflect monies allocated from Regional funds.

17
Bibliography Dellagiarino, George, 1991, The Offshore Deep Stratigraphic Test Well Program, U.S. Department of the Interior, Minerals Management Service, OCS Report MMS 90-0028, 36 p. Dellagiarino, George, Meekins, Keith, and Zinzer, David, 2007, Geological and
Geophysical Data Acquisition, Outer Continental Shelf Through 2004-2005, U.S. Department of the Interior, Minerals Management Service, OCS Report MMS 2007-049, 46 p.
Dellagiarino, George, and Meekins, Keith, 1998, The Resource Evaluation Program: Structure and Mission on the Outer Continental Shelf, U.S. Department of the Interior, Minerals Management Service, OCS Report MMS 98-0028, 43 p. Fulton, Patricia, 1998, Prelease Permits for Oil, Gas, and Sulphur on the Outer Continental Shelf, U.S. Department of the Interior, Minerals Management Service, OCS Report MMS 98-0009, 119 p. Geophysics, Society of Exploration Geophysicists (SEG), Tulsa, Oklahoma. Geophysics: The Leading Edge of Exploration, Society of Exploration Geophysicists, Tulsa, Oklahoma. Robinson, E.S., and Coruh, C., 1988, Basic Exploration Geophysics, John Wiley and Sons, 562 p. Sheriff, Robert E., 2002, “Encyclopedic Dictionary of Applied Geophysics, Fourth Edition,” Society of Exploration Geophysicists, 428 p. Wood, Larry C., 1982, “Imaging the Subsurface” in Concepts and Techniques in Oil and Gas Exploration, Society of Exploration Geophysicists, Tulsa, Oklahoma, pgs. 45-90.

18
Appendix
Alaska A-1 Summary of geological and geophysical data acquisition
by FY for Alaska................................................................................................................19 A-2 Number of permits issued for geological and geophysical
exploration in Alaska .........................................................................................................20 A-3 Summary of expenditures by the MMS for geological and
geophysical data acquisition by FY for Alaska .................................................................21 A-4 Summary of average cost per mile by the MMS for 2-D seismic data by FY for Alaska ........................................................................................................22
Atlantic A-5 Summary of geological and geophysical data acquisition
by FY for the Atlantic ........................................................................................................23 A-6 Number of permits issued for geological and geophysical
exploration in the Atlantic .................................................................................................24 A-7 Summary of expenditures by the MMS for geological and
geophysical data acquisition by FY for the Atlantic..........................................................25 A-8 Summary of average cost per mile by the MMS for 2-D seismic data by FY for the Atlantic ................................................................................................26
Gulf of Mexico A-9 Summary of geological and geophysical data acquisition
by FY for the Gulf of Mexico ............................................................................................27 A-10 Number of permits issued for geological and geophysical
exploration in the Gulf of Mexico .....................................................................................28 A-11 Summary of expenditures by the MMS for geological and geophysical data acquisition by FY for the Gulf of Mexico..................................................................29 A-12 Summary of average cost per mile by the MMS for 2-D seismic data by FY for the Gulf of Mexico ............................................................................................30

19
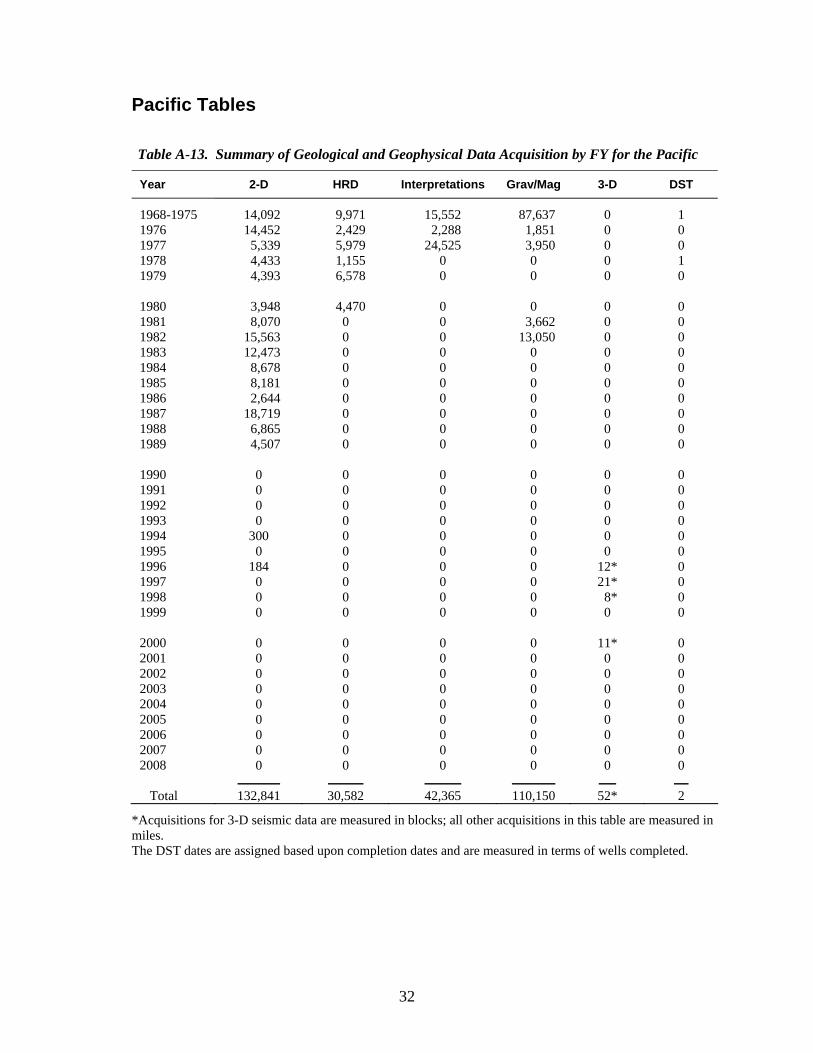
Pacific A-13 Summary of geological and geophysical data acquisition
by FY for the Pacific..........................................................................................................31 A-14 Number of permits issued for geological and geophysical
exploration in the Pacific ...................................................................................................32 A-15 Summary of expenditures by the MMS for geological and
geophysical data acquisition by FY for the Pacific (in dollars).........................................33 A-16 Summary of average cost per mile by the MMS for 2-D seismic data by FY for the Pacific (in dollars) ...............................................................................34

20
Alaska Tables
Table A-1. Summary of Geological and Geophysical Data Acquisition by FY for Alaska
Year 2-D HRD Interpretations Grav/Mag 3-D DST
1968-1975 1976 1977 1978 1979 1980 1981 1982 1983 1984 1985 1986 1987 1988 1989 1990 1991 1992 1993 1994 1995 1996 1997 1998 1999 2000 2001 2002 2003 2004 2005 2006 2007 2008 Total
70,306 37,785 11,952 28,524 8,538
10,109 35,430 16,624 51,903 30,961 30,270 21,603 49,532 14,963 3,136
8,557 3,964
0 1,893 2,422 737 315
382 273
0
0 0 0 0 0 0 0
32,281 0
472,460
5,500 19,163 5,606
0 5,412
7,703 4,590
0 0
7,904 0
1,600 470 1,741 166
0 0 0 0 0 0 0 0 0 0
0 0 0 0 0 0 0 0 0
59,855
32,819 30,164 21,700
0 0
0 0 0 0 0 0 0 0 0 0
0 0 0 0 0 0 0 0 0 0
0 0 0 0 0 0 0 0 0
84,683
55,710 0
23,470 36,625 25,465
0
14,969 0 0
5,850 0 0
80,826 0
9,543
11,046 1,500
0 0
102,845 3,000
0 0 0 0
0 0 0 0 0 0 0
1,915 0
372,764
0 0 0 0 0
0 0 0 0 0 0 0 0 0 0
0 0 0 0 0 0 0
3* 0
7*
12* 0
11* 0 0 0 0
204 54
291*
1 4 4 0 0
1 0 2 2 0 0 0 0 0 0
0 0 0 0 0 0 0 0 0 0
0 0 0 0 0 0 0 0 0
14
Acquisition for 3-D seismic data are measured in blocks; all other acquisitions in this table are measured in miles. The DST dates are assigned based upon completion dates and are measured in terms of wells completed. All other data are measured in terms of miles.

21
Table A-2. Number of Permits Issued for Geological and Geophysical Exploration in Alaska
Year A B C D E F
1960-1968 1969 1970 1971 1972 1973 1974 1975 1976 1977 1978 1979 1980 1981 1982 1983 1984 1985 1986 1987 1988 1989 1990 1991 1992 1993 1994 1995 1996 1997 1998 1999 2000 2001 2002 2003 2004 2005 2006 2007 2008 Total
75 31
40 27 17 33 47 82 69 33
9 32
41 54 85
103 70 63 18 18 13 17
19
7 7
11 3 1 6 5 2 2
1 0 1 1 1 1 4 5 4
1,058
--- 28
36 26 17 32 44 74 61 29
8 30
36 49 79 80 62 56 17 14
9 14
15
4 6
10 3 1 6 4 2 2
1 0 1 1 1 1 4 4 4
871
--- 3
4 1 0 1 3 8 8 4 1 2
5 5 6
23 8 7 1 4 4 3
3 1 0 0 0 0 0 1 0 0
0 0 0 0 0 0 0 1 0
107
--- 0
0 0 0 0 0 1 4 4 0 0
1 0 3 1 0 0 0 0 0 0
0 0 0 0 0 0 0 0 0 0
0 0 0 0 0 0 0 0 0
14
--- 0
0 0 0 0 0 0 0 0 0 0
0 0 0 0 0 0 0 0 0 0
0 0 0 2 1 1 5 0 2 2
1 0 0 0 1 1 3 3 4
26
--- 0
0 0 0 0 0 0 0 0 0 0
0 0 0 0 0 0 0 0 0 0
1 2 1 1 0 0 0 0 0 0
0 0 0 0 0 0 0 0 0
5
Dashed lines = Individual breakouts not established A=Total Number of Geological, Geophysical, and Strategic Minerals Permits B=Number of Geophysical Permits C=Number of Geological Permits D=Number of Geological Permits Issued for Deep Stratigraphic Tests E=Number of Geophysical Permits Issued for 3-D Seismic Data F=Number of Permits Issued for Strategic (Nonenergy) Minerals

22
Table A-3. Summary of Expenditures by the MMS for Geological and Geophysical Data Acquisition by FY for Alaska (in dollars)
Year 2-D HRD Interpretations Grav/Mag 3-D DST
1968-1975 1976 1977 1978 1979 1980 1981 1982 1983 1984 1985 1986 1987 1988 1989 1990 1991 1992* 1993 1994 1995 1996 1997 1998 1999 2000 2001* 2002 2003* 2004* 2005* 2006 2007 2008 Total
2,803,939 1,628,153 271,035 2,956,280 2,180,700
1,086,423 5,231,130 1,817,736 5,673,514 4,118,626 3,669,129 2,780,556 2,301,780 1,339,007 347,872
832,476 518,613
0 139,117 579,129 167,170 113,071 195,855 192,947
0
0 0 0 0 0 0 0
2,329 0
40,946,587
119,700 1,598,789 36,473
0 2,019,512
5,789,936 1,531,458
0 0
19,238 0
950 400 3,425 5,917
0 0 0 0 0 0 0 0 0 0
0 0 0 0 0 0 0 0 0
11,125,798
160,832 268,961 10,000
0 0
0 0 0 0 0 0 0 0 0 0
0 0 0 0 0 0 0 0 0 0
0 0 0 0 0 0 0 0 0
439,793
7,515 0
49,450 408,679 125,148
0
69,286 0 0
27,072 0 0
249,951 0
21,851
51,681 15,573
0 0 0
750 0 0 0 0
0 0 0 0 0 0 0
152 0
1,027,108
0 0 0 0 0
0 0 0 0 0 0 0 0 0 0
0 0 0 0 0 0 0 0 0
358,155
348,073 0
762,911 0 0 0 0
29,226 9,401
1,507,766
NA NA NA 0 0
NA 0
NA NA 0 0 0 0 0 0
0 0 0 0 0 0 0 0 0 0
0 0 0 0 0
0 0 0
0
*In FY 1992 and 2003, the Alaska Region spent funds from the G&G budget and Regional funds to acquire digital copies of data already in their inventory and did not acquire any new or additional data. In FY 2001, the Region spent funds to acquire digital copies of seismic information already in their inventory as well as a paleontological study. In FY 2003, 2004, 2005funds were also spent to scan in house data. Also, in FY 2004, funds went toward Geoframe support efforts. In FY 2005 funds also went towards a biostratigraphic data base. Note: NA represents “not applicable” as no G&G funds are used to acquire information from a DST. Where no DST was completed, a zero is entered into the expenditure column.

23
Table A-4. Summary of Average Cost Per Mile by the MMS for 2-D Seismic Data by FY for Alaska (in dollars)
Year Average Cost ($/Mile)
1968-1975 1976 1977 1978 1979 1980 1981 1982 1983 1984 1985 1986 1987 1988 1989 1990 1991 1992 1993 1994 1995 1996 1997 1998 1999 2000 2001 2002 2003 2004 2005 2006 2007 2008
39.88 43.09 22.68 103.64 255.41
107.47 147.65 109.34 109.31 133.03 121.21 128.71 46.47 89.49 110.93
97.29 130.85
0 73.48 239.18 475.85 358.96 512.71 706.77
0
0 0 0 0 0 0 0 0
0.07
Note: Summaries reflect average cost per mile for all CDP Information acquired both State and Federal. Average costs reflect only those dollars assigned to the bureauwide G&G budget and do not reflect monies allocated from Regional funds. Zero indicates G&G dollars were not spent on CDP information.

24
Atlantic Tables
Table A-5. Summary of Geological and Geophysical Data Acquisition by FY for the Atlantic
Year 2-D HRD Interpretations Grav/Mag 3-D DST
1968-1975 1976 1977 1978 1979 1980 1981 1982 1983 1984 1985 1986 1987 1988 1989 1990 1991 1992 1993 1994 1995 1996 1997 1998 1999 2000 2001 2002 2003 2004 2005 2006 2007 2008 Total
41,958 25,211 21,032 14,281 6,877
585 9,950 19,074 30,077 9,386 1,640 424 2,356 827 2,730
31 1,042 2,377
0 0 0 0 0 0 0
0 0 0
23,109 0 0 0 0
969
213,936
1,740 23,867 6,100
0 0
10,660 7,142
0 0 0 0 0 0 0 0
0 0 0 0 0 0 0 0 0 0
0 0 0 0 0 0 0 0 0
49,509
11,802 29,822 3,177
0 0
0 0 0 0 0 0 0 0 0 0
0 0 0 0 0 0 0 0 0 0
0 0 0 0 0 0 0 0 0
44,801
14,267 1,076 440
0 0
0 0 0 0 0 0 0 0 0 0
0 0 0 0 0 0 0 0 0 0
0 0 0 0 0 0 0 0 0
15,783
0 0 0 0 0
0 0 0 0 0 0 0 0 0 0
0 0 0 0 0 0 0 0 0 0
0 0 0 0 0 0 0 0 0
0
0 2 2 0 1
0 0 0 0 0 0 0 0 0 0
0 0 0 0 0 0 0 0 0 0
0 0 0 0 0 0 0 0 0
5
Note: The DST dates are assigned based upon completion dates and are measured in terms of wells completed. All other data are measured in terms of miles.

25
Table A-6. Number of Permits Issued for Geological and Geophysical Exploration in the Atlantic
Year A B C D E F
1960-1968 1969 1970 1971 1972 1973 1974 1975 1976 1977 1978 1979 1980 1981 1982 1983 1984 1985 1986 1987 1988 1989 1990 1991 1992 1993 1994 1995 1996 1997 1998 1999 2000 2001 2002 2003 2004 2005 2006 2007 2008 Total
45 7
4 4 4 4 2
29 35 20 17
9
15 17 11 10
6 2 3 2 4 0
1 0 0 0 0 1 0 2 0 0
1 0 0 0 2 2 0 1 2
262
--- 7
3 4 4 4 2
23 28 20 13
9
15 16 11 10
6 1 2 0 4 0
1 0 0 0 0 0 0 1 0 0
0 0 0 0 0 0 0 0 0
184
--- 0
1 0 0 0 0 6 7 0 4 0
0 1 0 0 0 1 1 2 0 0
0 0 0 0 0 0 0 1 0 0
0 0 0 0 0 0 0 0 0
24
--- 0
0 0 0 0 0 1 3 0 1 0
0 0 0 0 0 0 0 0 0 0
0 0 0 0 0 0 0 0 0 0
0 0 0 0 0 0 0 0 0
5
--- 0
0 0 0 0 0 0 0 0 0 0
0 0 0 0 0 0 0 0 0 0
0 0 0 0 0 0 0 0 0 0
0 0 0 0 0 0 0 0 0
0
--- 0
0 0 0 0 0 0 0 0 0 0
0 0 0 0 0 0 0 0 0 0
0 0 0 0 0 1 0 0 0 0
1 0 0 0 2 2 0 1 2
9
Dashed lines = Individual breakouts not established A=Total Number of Geological, Geophysical, and Strategic Minerals Permits B=Number of Geophysical Permits C=Number of Geological Permits D=Number of Geological Permits Issued for Deep Stratigraphic Tests E=Number of Geophysical Permits Issued for 3-D Seismic Data F=Number of Permits Issued for Strategic (Nonenergy) Minerals
26
Table A-7. Summary of Expenditures by the MMS for Geological and Geophysical Data Acquisition by FY for the Atlantic (in dollars)
Year 2-D HRD Interpretations Grav/Mag 3-D DST
1968-1975 1976 1977 1978 1979 1980 1981 1982 1983 1984 1985 1986 1987 1988 1989 1990 1991 1992 1993 1994 1995 1996 1997 1998 1999 2000 2001 2002 2003 2004* 2005 2006 2007 2008 Total
309,029 196,687 242,868 581,562 119,250
51,096 179,682 1,882,723 1,718,584 1,500,298 287,135 87,307 438,792 71,510 120,042
150 2,790 1,933
0 0 0 0 0 0 0
0 0 0
1,080,000 0 0 0 0
156,100
7,947,538
4,900 2,256,167 1,968,513
0 0
4,278,448 1,243,204
0 0 0 0 0 0 0 0
0 0 0 0 0 0 0 0 0 0
0 0 0 0 0 0 0 0 0
9,751,232
--- 45,282 9,992
0 0
0 0 0 0 0 0 0 0 0 0
0 0 0 0 0 0 0 0 0 0
0 0 0 0 0 0 0 0 0
55,274
--- 2,902
0 0 0
0 0 0 0 0 0 0 0 0 0
0 0 0 0 0 0 0 0 0 0
0 0 0 0 0 0 0 0 0
2,902
0 0 0 0 0
0 0 0 0 0 0 0 0 0 0
0 0 0 0 0 0 0 0 0 0
0 0 0 0 0 0 0 0 0
0
0 NA NA 0
NA
0 0 0 0 0 0 0 0 0 0
0 0 0 0 0 0 0 0 0 0
0 0 0 0 0 0 0 0 0
0
*In FY 2004, funds were expended to vectorize Atlantic data and a geologic report for offshore Nova Scotia was purchased Note: The abbreviation NA represents “not applicable” as no G&G funds are used to acquire information from a DST. Where no DST was completed, a zero is entered into the expenditure column. Dashed lines = No expenditures are available for CDP interpretations or gravity and magnetic data for 1968-1975.

27
Table A-8. Summary of Average Cost Per Mile by the MMS for
2-D Seismic Data by FY for the Atlantic (in dollars)
Year Average Cost ($/Mile)
1968-1975 1976 1977 1978 1979 1980 1981 1982 1983 1984 1985 1986 1987 1988 1989 1990 1991 1992 1993 1994 1995 1996 1997 1998 1999 2000 2001 2002 2003* 2004 2005 2006 2007 2008
7.37 7.80 11.55 40.72 17.34
87.34 18.06 98.70 57.14 159.85 175.08 205.91 186.24 86.47 43.97
4.84 2.68 0.81
--- --- --- --- --- ---
--- --- --- ---
470.81 --- --- --- ---
161.09
*Data acquired in offshore Canada at market prices. Dashed lines indicate no funding for that year.
Note: Summaries reflect average cost per mile for all CDP Information acquired both State and Federal. Average costs reflect only those dollars assigned to the bureauwide G&G budget and do not reflect monies allocated from Regional funds.

28
Gulf of Mexico Tables Table A-9. Summary of Geological and Geophysical Data Acquisition by FY for the Gulf of Mexico
Year 2-D HRD Interpretations Grav/Mag 3-D 3-D/4-C AVO DST 1968-1975 1976 1977 1978 1979 1980 1981 1982 1983 1984 1985 1986 1987 1988 1989 1990 1991 1992 1993 1994 1995 1996 1997 1998 1999 2000 2001 2002 2003 2004 2005 2006 2007 2008 Total
143,458 31,474 4,485 7,188 11,681
4,758 16,454 28,700 26,290 40,828 31,430 22,616 43,073 56,265 43,121
76,692 35,507 46,814 23,589 4,416 8,193 32,797 39,300 90,708 30,135
64,710 6,668 1,506 25,045 101,282 48,829 170,379 75,799 1,984
1,396,174
88,549 9,367 18,119 8,275 5,018
15,940
500 0 0 0 0 0 0 0 0
0 0 0 0 0 0 0 0 0 0
0 0 0 0 0 0 0 0 0
145,768
120,038 19,380
0 0 0
0 0 0 0 0 0 0 0 0 0
0 0 0 0 0 0 0 0 0 0
0 0 0 0 0 0 0 0 0
139,418
19,670 56,272
0 0 0
0 0 0 0 0 0 0 0 0 0
0 0 0 0 0 0 0 0
178,305 52,000
284,084
0 0 0 0 0 0 0
79,082
669,413
0 0 0 0 0
0 0 0 0 0 0 0 0 0 0
0 0 0
1,563* 1,420* 1,826* 1,458* 3,105* 3,452* 3,219*
6,138* 3,602* 7,171* 6,272* 6,193* 4,996* 6,495 11,651 22,552
91,113*
0 0 0 0 0
0 0 0 0 0 0 0 0 0 0
0 0 0 0 0 0 0 0 0 0
0 0 0 0
37* 0 0 0 0
37*
0 0 0 0 0
0 0 0 0 0 0 0 0 0 0
0 0 0 0 0 0 0 0 0 0
0 0 0
1,492* 67*
0 0 0 0
1,559*
2 0 0 0 0
0 0 0 0 0 0 0 0 0 1
0 0 0 0 0 0 0 0 0 0
0 0 0 0 0 0 0 0 0
3
Note: *Acquisitions for 3-D seismic, 3-D/4-C data, and AVO data are measured in blocks; all other acquisitions, in this table are measured in miles. The DST dates are assigned based upon completion dates and are measured in terms of wells completed. Figures may vary by 1-2%.

29
Table A-10. Number of Permits Issued for Geological and Geophysical Exploration in the Gulf of Mexico
Year A B C D E F G
1960-1968 1969 1970 1971 1972 1973 1974 1975 1976 1977 1978 1979 1980 1981 1982 1983 1984 1985 1986 1987 1988 1989 1990 1991 1992 1993 1994 1995 1996 1997 1998 1999 2000 2001 2002 2003 2004 2005 2006 2007 2008 Total
2,071 207
166 179 198 272 284 353 292 368 278 211
231 283 344 416 411 300 170 258 263 232
227 163 134 136 130 102 130 152 155 109
78
110 79
106 100 98
82 89
108
10,075
--- 204
162 175 188 264 275 348 289 361 278 204
225 280 341 416 408 295 169 252 251 223
222 152 131 125 114 91
114 134 141 96
72
103 74 99 90 92
77 88
100
7,723
--- 3
4 4
10 8 9 5 3 7
0 7
6 3 3
0 3 5 1 6
12 9
5
11 3
11 16 11 16 18 14 13
5 7 5 3
10 6
2 1 1
266
--- 0
0 0 0 0 2 0 0 0 0 0
0 0 0 0 0 0 0 0 0 1
0 0 0 0 0 0 0 0 0 0
0 0 0 0 0 0 0 0 2
5
--- 0
0 0 0 0 0 0 0 0 0 0
0 0 0
16 18 38 32 42 45 47
57 45 53 68 52 49 54 69 57 42
31 33 20 28 14 24 21 29 19
1,003
--- 0
0 0 0 0 0 0 0 0 0 0
0 0 0 0 0 0 0 0 0 0
0 0 0 0 0 0 0 0 0 0
1 0 0 4 0 0 3 0 5
13
--- 0
0 0 0 0 0 0 0 0 0 0
0 0 0 0 0 0 0 0 0 0
0 0 0 0 0 0 0 1 1 0
0 0 3 2 0 0 0 0 0
7
Dashed lines = Individual breakouts not established; A=Total Number of Geological, Geophysical, and Strategic Minerals Permits; B=Number of Geophysical Permits;C=Number of Geological Permits; D=Number of Geological Permits Issued for Deep Stratigraphic Tests; E=Number of Geophysical Permits Issued for 3-D Seismic Data; F=Number of Permits Issued for Strategic (Nonenergy) Minerals; G=Number of Permits Issued for 4-D Seismic Data Figures may vary by 1-2%.

30
Table A-11. Summary of Expenditures by the MMS for Geological and Geophysical Data
Acquisition by FY for the Gulf of Mexico (in dollars)
Year 2-D HRD Interpretations Grav/Mag 3-D DST
1968-1975 1976 1977 1978 1979 1980 1981 1982 1983 1984 1985 1986 1987 1988 1989 1990 1991 1992 1993 1994 1995 1996 1997 1998 1999* 2000 2001 2002 2003 2004 2005* 2006 2007 2008
Total
5,255,068 1,489,665 579,583 330,183 492,299
388,329 939,506 2,936,727 3,678,684 3,999,326 2,768,574 1,600,031 1,824,927 1,075,515 885,748
704,670 289,266 376,893 200,407 26,946 21,535 1,151,587 44,103 96,771 42,227
83,359 457,463 3,185 24,902 185,470 10,445 29,071 10,126
965
32,003,556
2,795,562 514,141 3,072,088 1,438,856 949,697
3,926,990 31,805
0 0 0 0 0 0 0 0
0 0 0 0 0 0 0 0 0 0
0 0 0 0 0 0 0 0 0
12,729,139
722,442 134,084
0 0 0
0 0 0 0 0 0 0 0 0 0
0 0 0 0 0 0 0 0 0 0
0 0 0 0 0 0 0 0 0
856,526
129,500 385,234
0 0 0
0 0 0 0 0 0 0 0 0 0
0 0 0 0 0 0 0 0
12,000 3,000
10,070
0 0 0 0 0 0 0
9,679
549,483
0 0 0 0 0
0 0 0 0 0 0 0 0 0 0
0 0 0
537,908 647,592 592,223 526,471 1,150,050 1,289,773 1,154,577
1,816,038 729,196 341,756 288,443 283,346 216,934 281,331 429,173 628,018
10,912,829
NA 0 0 0 0
0 0 0 0 0 0 0 0 0
NA
0 0 0 0 0 0 0 0 0 0
0 0 0 0 0 0 0 0 0
---
In FY 1999, the Gulf of Mexico Region also spent funds to acquire digital copies of data and information that were already in their inventory or purchased as two differing displays. In FY 2005, funds were allocated for scanning of in house data. Figures may vary by 1-2%. Note: The abbreviation NA represents “not applicable” as no G&G funds are used to acquire Information from a DST. Where no DST was completed, a zero is entered into the expenditure column.

31
Table A-12. Summary of Average Cost Per Mile by the MMS for 2-D Seismic Data by FY for the Gulf of Mexico (in dollars)
Year Average Cost ($/Mile)
1968-1975 1976 1977 1978 1979 1980 1981 1982 1983 1984 1985 1986 1987 1988 1989 1990 1991 1992 1993 1994 1995 1996 1997 1998 1999 2000 2001 2002 2003 2004 2005 2006 2007 2008
36.63 47.33 129.23 45.94 42.15
81.62 57.10 102.33 139.93 97.96 88.09 70.75 42.37 19.12 20.54
9.19 8.14 8.05 8.49 6.10 2.63
35.11 1.01 1.07 1.40
1.29
68.61/1.34* 2.11* 0.99 1.83 0.21 0.17 0.01 0.49
*The $68.61 total includes the cost for data in Cuban waters at the market price. The average cost per line mile for data in Federal waters is $1.34. *The $2.11 total includes velocity models for depth data. Figures may vary by 1-2-%. Note: Summaries reflect average cost per mile for all CDP Information acquired both State and Federal. Average costs reflect only those dollars assigned to the bureauwide G&G budget and do not reflect monies allocated from Regional funds.
32
Pacific Tables
Table A-13. Summary of Geological and Geophysical Data Acquisition by FY for the Pacific
Year 2-D HRD Interpretations Grav/Mag 3-D DST
1968-1975 1976 1977 1978 1979 1980 1981 1982 1983 1984 1985 1986 1987 1988 1989 1990 1991 1992 1993 1994 1995 1996 1997 1998 1999 2000 2001 2002 2003 2004 2005 2006 2007 2008 Total
14,092 14,452 5,339 4,433 4,393
3,948 8,070 15,563 12,473 8,678 8,181 2,644 18,719 6,865 4,507
0 0 0 0
300 0
184 0 0 0
0 0 0 0 0 0 0 0 0
132,841
9,971 2,429 5,979 1,155 6,578
4,470
0 0 0 0 0 0 0 0 0
0 0 0 0 0 0 0 0 0 0
0 0 0 0 0 0 0 0 0
30,582
15,552 2,288 24,525
0 0
0 0 0 0 0 0 0 0 0 0
0 0 0 0 0 0 0 0 0 0
0 0 0 0 0 0 0 0 0
42,365
87,637 1,851 3,950
0 0
0 3,662 13,050
0 0 0 0 0 0 0
0 0 0 0 0 0 0 0 0 0
0 0 0 0 0 0 0 0 0
110,150
0 0 0 0 0
0 0 0 0 0 0 0 0 0 0
0 0 0 0 0 0
12* 21* 8* 0
11* 0 0 0 0 0 0 0 0
52*
1 0 0 1 0
0 0 0 0 0 0 0 0 0 0
0 0 0 0 0 0 0 0 0 0
0 0 0 0 0 0 0 0 0
2
*Acquisitions for 3-D seismic data are measured in blocks; all other acquisitions in this table are measured in miles. The DST dates are assigned based upon completion dates and are measured in terms of wells completed.

33
Table A-14. Number of Permits Issued for Geological and Geophysical Exploration in the Pacific
Year A B C D E F
1960-1968 1969 1970 1971 1972 1973 1974 1975 1976 1977 1978 1979 1980 1981 1982 1983 1984 1985 1986 1987 1988 1989 1990 1991 1992 1993 1994 1995 1996 1997 1998 1999 2000 2001 2002 2003 2004 2005 2006 2007 2008 Total
162 13
3 0 1
30 24 46 24 31 38 24
31 40 62 45 56 33 20 20 33
0
4 0 0 0 0 0 0 0 0 0
0 0 0 0 0 0 0 0 0
740
--- 10
2 0 1
21 24 42 22 26 30 22
26 38 59 36 42 30 19 16 25
0
3 0 0 0 0 0 0 0 0 0
0 0 0 0 0 0 0 0 0
494
--- 3
1 0 0 9 0 4 2 5 8 2
5 2 3 9
14 3 1 4 8 0
1 0 0 0 0 0 0 0 0 0
0 0 0 0 0 0 0 0 0
84
--- 0
0 0 0 0 0 1 0 0 1 0
0 0 0 0 0 0 0 0 0 0
0 0 0 0 0 0 0 0 0 0
0 0 0 0 0 0 0 0 0
2
--- 0
0 0 0 0 0 0 0 0 0 0
0 0 0 0 0 0 0 0 0 0
0 0 0 0 0 0 0 0 0 0
0 0 0 0 0 0 0 0 0
0
--- 0
0 0 0 0 0 0 0 0 0 0
0 0 0 0 0 0 0 0 0 0
0 0 0 0 0 0 0 0 0 0
0 0 0 0 0 0 0 0 0
0
Dashed lines = Individual breakouts not established A=Total Number of Geological, Geophysical, and Strategic Minerals Permits B=Number of Geophysical Permits C=Number of Geological Permits D=Number of Geological Permits Issued for Deep Stratigraphic Tests E=Number of Geophysical Permits Issued for 3-D Seismic Data F=Number of Permits Issued for Strategic (Nonenergy) Minerals

34
Table A-15. Summary of Expenditures by the MMS for Geological and Geophysical Data Acquisition by FY for the Pacific (in dollars)
Year 2-D HRD Interpretations Grav/Mag 3-D DST
1968-1975 1976 1977 1978 1979 1980 1981 1982 1983 1984 1985 1986 1987 1988 1989 1990 1991 1992 1993 1994 1995 1996 1997 1998 1999* 2000 2001 2002* 2003* 2004* 2005* 2006* 2007* 2008* Total
697,733 486,139 188,930 137,754 346,612
249,048 689,372 1,918,891 1,309,608 1,262,030 848,777 356,700 921,422 93,748 44,273
0 0 0 0
443 0
1,714 0 0 0
0 0 0 0 0 0 0 0 0
9,553,194
175,000 57,660 752,400 23,685 1,588,695
1,098,954
0 0 0 0 0 0 0 0 0
0 0 0 0 0 0 0 0 0 0
0 0 0 0 0 0 0 0 0
3,696,394
49,617 20,596 1,962
0 0
0 0 0 0 0 0 0 0 0 0
0 0 0 0 0 0 0 0 0 0
0 0 0 0 0 0 0 0 0
72,175
415,913 17,275 11,796
0 0
0 20,029 69,350
0 0 0 0 0 0 0
0 0 0 0 0 0 0 0 0 0
0 0 0 0 0 0 0 0 0
534,363
0 0 0 0 0
0 0 0 0 0 0 0 0 0 0
0 0 0 0 0 0
10,452 13,479 3,344
0
650 0 0 0 0 0 0 0 0
27,925
NA 0 0
NA 0
0 0 0 0 0 0 0 0 0 0
0 0 0 0 0 0 0 0 0 0
0 0 0 0 0 0 0 0 0
0
* In FY 1999 and 2002, the Pacific Region spent funds to acquire digital copies of data already in their inventory and did not acquire any new or additional data. In FY 2003 through 2008 funds were allocated for scanning of in-house data. Note: The abbreviation NA represents “not applicable” as no G&G funds are used to acquire Information from a DST. Where no DST was completed, a zero is entered into the expenditure column.

35
Table A-16. Summary of Average Cost Per Mile by the MMS for 2-D Seismic Data by FY for the Pacific
(in dollars)
Year Average Cost ($/Mile)
1968-1975 1976 1977 1978 1979 1980 1981 1982 1983 1984 1985 1986 1987 1988 1989 1990 1991 1992 1993 1994 1995 1996 1997 1998 1999 2000 2001 2002 2003 2004 2005 2006 2007 2008
49.51 33.64 35.39 31.08 78.90
63.08 85.42 123.30 105.00 145.43 103.75 134.91 49.22 13.66 9.82
0 0
--- 0
1.48 0
9.32 0 0 0
0 --- --- --- --- --- --- --- ---
Note: Summaries reflect average cost per mile for all CDP information acquired both State and Federal. Average costs reflect only those dollars assigned to the bureauwide G&G budget and do not reflect monies allocated from Regional funds. Dashed line indicates no funding for that year. Zero indicates G&G dollars were not spent on CDP information.

36
Glossary AVO – The variation in the amplitude of a seismic reflection with the angle of incidence or source geophone distance. It depends on changes in velocity, density, and Poisson’s Ratio. Block - a geographically defined section of the Outer Continental Shelf (OCS) designated by a number on an Official Protraction Diagram or Leasing Map prepared by the Minerals Management Service (MMS). A block normally is a 9-square-mile area (3 miles x 3 miles) consisting of 5,760 acres. A single block is the smallest unit that can be leased for oil and gas exploration on the OCS. Common Depth Point - a common location in the ocean subbottom where sound waves originating from various positions of the seismic (sound) source near the ocean surface are reflected back toward the surface. The traces from different seismic profiles corresponding to the same reflection point are mathematically summed (stacked) for reflection points beneath the survey line. Also known as common midpoint or common reflection point. COST Wells - Continental Offshore Stratigraphic Test Wells - deep stratigraphic wells drilled to determine the geological character or stratigraphy of rock strata. These wells, which may be more than 20,000 feet deep, provide information that can be used by Government and industry to evaluate tracts to be offered in a lease sale. Fair Market Value - the amount in cash, or on terms reasonably equivalent to cash, for which in all probability the property would be sold by a knowledgeable purchaser who desired, but is not obligated, to buy. This market value that is sought is not merely theoretical or hypothetical, but represents, insofar as it is possible to estimate, the actual selling price. High-Resolution - a range of seismic frequencies above the normal range of frequencies used in exploration, with an improvement in resolution in the shallow portions of the subbottom but with less total penetration into the subbottom. Lease - any form of authorization that is used under section 8 or maintained under section 6 of the Outer Continental Shelf Lands Act (OCSLA) and that authorizes exploration for and development and production of minerals or the area covered by that authorization, whichever is required of the context. Lease Sale - an MMS proceeding by which leases for certain OCS tracts are offered for sale by competitive bidding and during which bids are received, publicly announced, and recorded. Outer Continental Shelf - all submerged lands lying seaward and outside of the area of lands beneath navigable waters as defined in section 2 of the Submerged Lands Act and of which the subsoil and seabed appertain to the United States and are subject to its jurisdiction and control. Outer Continental Shelf Lands Act - law passed by Congress on August 7, 1953, and amended in 1975, 1978, and 1985.

37
Permit - the contract or agreement, other than a lease, approved for a specified period of not more than 1 year under which a person acquires the right to conduct (1) geological exploration for mineral resources, (2) geophysical exploration for mineral resources, (3) geological scientific research, or (4) geophysical scientific research. Planning Area - a subdivision of an offshore area used as the initial basis for considering blocks to be offered for lease in the Department of the Interior’s (DOI) offshore oil and gas leasing program. Shallow Hazards - potential geological and manmade hazards to exploration on the OCS that are in the shallow portion of the subbottom. Examples include seismicity, active faults, shallow gas deposits, steep slopes, unstable soil conditions, pipelines, anchors, and sunken ships. Shallow hazards may occur in shallow or deep waters.

The Department of the Interior Mission As the Nation's principal conservation agency, the Department of the Interior has responsibility for most of our nationally owned public lands and natural resources. This includes fostering sound use of our land and water resources; protecting our fish, wildlife, and biological diversity; preserving the environmental and cultural values of our national parks and historical places; and providing for the enjoyment of life through outdoor recreation. The Department assesses our energy and mineral resources and works to ensure that their development is in the best interests of all our people by encouraging stewardship and citizen participation in their care. The Department also has a major responsibility for American Indian reservation communities and for people who live in island territories under U.S. administration. The Minerals Management Service Mission As a bureau of the Department of the Interior, the Minerals Management Service's (MMS) primary responsibilities are to manage the mineral resources located on the Nation's Outer Continental Shelf (OCS), collect revenue from the Federal OCS and onshore Federal and Indian lands, and distribute those revenues. Moreover, in working to meet its responsibilities, the Offshore Minerals Management Program administers the OCS competitive leasing program and oversees the safe and environmentally sound exploration and production of our Nation's offshore natural gas, oil and other mineral resources. The MMS Minerals Revenue Management meets its responsibilities by ensuring the efficient, timely and accurate collection and disbursement of revenue from mineral leasing and production due to Indian tribes and allottees, States and the U.S. Treasury. The MMS strives to fulfill its responsibilities through the general guiding principles of: (1) being responsive to the public's concerns and interests by maintaining a dialogue with all potentially affected parties and (2) carrying out its programs with an emphasis on working to enhance the quality of life for all Americans by lending MMS assistance and expertise to economic development and environmental protection.