Embed Size (px)
Citation preview

GEOLOGICAL AND GEOHYDROLOGICAL REPORT
Part of the permit application for the development
of a Regional General and Hazardous Waste Disposal Facility
on the farm Grassridge 190 Remainder near Addo, Eastern Cape
Prepared for: Bohlweki Environmental (Pty) Ltd
P O Box 11784
VORNA VALLEY
MIDRAND
1686
Prepared by: R Meyer
P.O Box 74325
Lynnwood Ridge
Pretoria
0040
Pretoria
July 2008 Report No: 015/08

i
EXECUTIVE SUMMARY
This report describes the geological and geohydrological conditions of an area some 30 km
north of Port Elizabeth that has been identified as a potential site for the development of a
new large Regional General and Hazardous Waste Disposal Facility. The study
concentrated on the farm Grassridge 190 Remainder, on which the waste site is to be
developed, and the immediately surrounding farms.
Based on the geological and geohydrological conditions of the area investigated, the
identified site is regarded as suitable for the development of a H:H class waste disposal site
for the following reasons:
• The geological conditions of the underlying formations, both in terms of lithology and
depth extent are very favourable.
• The static groundwater level in the vicinity of the site is of the order of 70 m below
surface.
• Borehole yields are generally very low as illustrated by the four recently drilled
boreholes that were all dry on completion of drilling.
• The groundwater quality in the region is generally poor to very poor and as a result
very little use is being made of groundwater for domestic, stock watering or irrigation.
The poor water quality is a direct result of the marine depositional conditions that
existed during the formation of the geological formations hosting the groundwater.
• The underlying formations, the Sundays River and Kirkwood formations, comprise of
a very thick succession (estimated to be >300 m) of predominantly siltstone and
mudstone, with minor interlayered sandstone layers. These formations have a very
low hydraulic conductivity and will prevent the migration of contaminants in the case
of liner system failure.
• The deep artesian aquifer associated with the Table Mountain Group sediments, is
well protected from any contamination by the thick succession of Uitenhage Group
sediments. That the latter sediments form an effective barrier to groundwater flow is
illustrated by the artesian nature of the deeper aquifer.
• The site is situated close to a local surface water divide and none of the drainage
lines at or upstream of the site represent perennial flow conditions.
• The WASP analysis, which takes into consideration a number of geological,
geohydrological, water use and design criteria, also indicated that the site can be
classified as “suitable”.
• No geological or geohydrological conditions within the study can be regarded as “fatal
flaws” according to the definitions described in the DWAF guideline documents
(DWAF, 1998).
Based on the above factors and provided that the site will be designed, constructed and
operated according to the DWAF Minimum Requirement Guidelines, from a geohydrological
perspective it is concluded that the identified site is suitable for the development of a new
Regional General and Hazardous Waste Disposal Facility.

ii
CONTENTS
1 BACKGROUND...................................................................................................1
2 PURPOSE OF THIS PHASE OF THE INVESTIGATION .....................................1
3 REPORT LAYOUT ..............................................................................................2
4 LOCALITY AND ACCESS...................................................................................2
5 HYDROLOGY OF THE REGION .........................................................................3
6 CLIMATE AND CLIMATIC WATER BALANCE OF THE REGION......................5
7 REGIONAL AND LOCAL GEOLOGICAL CONDITIONS ....................................5 7.1 REGIONAL GEOLOGY .......................................................................................5
7.2 LOCAL GEOLOGICAL CONDITIONS.................................................................8
8 RESULTS OF GEOPHYSICAL SURVEY ..........................................................11
9 RESULTS OF ADDITIONAL EXPLORATION DRILLING .................................12
10 HYDROCENSUS OF GRASSRIDGE 190 AND SURROUNDING FARMS........13
11 REGIONAL AND LOCAL GEOHYDROLOGICAL CONDITIONS......................21 11.1 REGIONAL GEOHYDROLOGY ........................................................................21
11.2 LOCAL GEOHYDROLOGY...............................................................................23
12 AQUIFER CLASSIFICATION AND PROTECTION ...........................................24
13 GROUNDWATER USE AND QUALITY.............................................................26
14 GROUNDWATER MONITORING ......................................................................27
15 RISK ASSESSMENT.........................................................................................28 15.1 AQUIFER MANAGEMENT CLASSIFICATION AND VULNERABILITY............28
15.2 EVALUATION OF THE SITE FOR WASTE DISPOSAL....................................29
16 IMPACT DESCRIPTION AND ASSESSMENT ..................................................30 16.1 GENERAL COMMENTS....................................................................................30
16.2 IMPACT ASSESSMENT....................................................................................30
17 RECOMMENDED MITIGATION AND MANAGEMENT ACTIONS ....................35
18 CONCLUSIONS.................................................................................................35
REFERENCES
APPENDIXES

iii
LIST OF FIGURES
Figure 1: Map of the Port Elizabeth area showing the approximate position of the proposed site. Figure 2: Area selected for the development of a waste disposal facility in relation to the three Quaternary catchments. Figure 3: Portion of the 1:50 000 Geological map 3325DA Addo showing the geology on the farms Grassridge 190, Grassridge 227 and Grassridge 228 and the approximate area identified for the development of the waste disposal facility. Figure 4: Contour map of apparent electrical conductivity around the proposed site on Grassridge 190 showing provisionally selected positions of exploration boreholes. Figure 5: Positions of all boreholes located on the farms Blaauw Baatjies Vley 189, Coega Kamma Kloof 191, Grassridge 190, Grassridge 227 and Grassridge 228. Figure 6: Boreholes located on the farms Blaauw Baatjies Vley 189 and Grassridge 190. Figure 7: Boreholes located on the farms Coega Kammas Kloof 191. Figure 8: Boreholes located on the farms Grassridge 227 and Grassridge 228. Figure 9: Boreholes in close vicinity of the area identified for the development of the proposed waste disposal site. Figure 10: Map of the study area showing the inferred static groundwater level contours based on limited water level information and the inferred groundwater flow directions.
LIST OF TABLES Table 1: Average maximum and minimum temperatures and rainfall as recorded at the Port Elizabeth, Addo and Uitenhage Weather Stations.) Table 2: Evaporation data for the region Table 3: The geological sequence in the Port Elizabeth/Uitenhage/Addo area Table 4: Geological legend for the geological map shown in Figure 3 Table 5: Geological formations present on the farm Grassridge 190 Table 6: Stratigraphic correlation between boreholes Table 7: Borehole census information of the farms Grassridge 190, 227 and 228 Table 8: Groundwater quality of selected boreholes around the proposed waste disposal facility Table 9: Ground Water Management Classification System (Parsons, 1995)
APPENDICES Appendix A: Geophysical report by EEGS
Appendix B: Geological description of newly drilled exploration boreholes.
Appendix C: WASP Index
Appendix D: Definitions and criteria used in the impact assessment tables.

1
1 BACKGROUND
The investigations for the establishment of a new regional waste disposal facility for the
Greater Port Elizabeth area commenced in 2000. During a Geographic Information System
(GIS) based study of a large area to the north of Port Elizabeth, potentially suitable farms on
which such a facility could be established were identified (Godfrey et al, 2000). These farms
were Blaauw Baatjies Vley 189, Grassridge 190, Coega Kammas Kloof 191 and
Grassridge 227. A report evaluating four potentially suitable areas on these farms, referred
to as Footprints A to D, was issued in 2004 (Meyer, 2004). During 2005 two additional
potentially suitable sites and referred to as Footprints E and F on adjacent farms,
Grassridge 190 (Remainder) and Grassridge 227 (Remainder) were investigated. In the
reports by Meyer (2004, 2005) all potential sites were evaluated and ranked in terms of their
suitability for the development of a regional hazardous waste processing facility. This was
followed by a report by Meyer in December 2006 providing more detailed geohydrological
information collected on the two farms Grassridge 190 and Grassridge 227. That report also
described the environmental impacts associated with the three sites (Footprints C, E and F)
on these two farms. The report concluded that Footprint F appeared to be the most suitable
site of the three. A decision was taken to submit a permit application for Site F on the farm
Grassridge 190 and hence some additional geohydrological and associated investigations
were required in terms of the DWAF Guidelines “Minimum Requirements for Waste Disposal
by Landfill” (DWAF, 1998).
The current report reviews the geological and geohydrological conditions around the farm
Grassridge 190 based on previously accumulated information as well as information
collected during a recent geophysical survey and exploration drilling programme on the farm.
2 PURPOSE OF THIS PHASE OF THE INVESTIGATION
The two farms Grassridge 190 Remainder and Grassridge 227 are owned by the cement
manufacturing company PPC (Pretoria Portland Cement). Their interest in the two farms
stems from the large economic deposits of calcrete used in the manufacturing of cement on
the farms and which are currently actively mined on the farm Grassridge 227. The further
geotechnical and geohydrological investigations were done with the permission of PPC.
The purpose of this phase of the evaluation of the site was to obtain the required information
for a permit application and included the following:
• Obtain information on the shallow geotechnical conditions. Geotechnical information
of those areas provisionally identified for the development of the waste disposal area,
leachate and storm water holding dams, borrow pits and other infrastructure, is to be
used in the design of foundation and lining of the facility. This investigation was
conducted by the Consulting Engineering firm Jones & Wagener during
December 2007 and reported in report No: 15/08/B494. This information will be used

2
in preliminary design for the site which will form part of the permit application
documentation.
• Perform an appropriate geophysical survey of the area to identify potential geological
structures that may influence groundwater conditions and to assist in the selection of
sites for exploration boreholes.
• Obtain site specific geohydrological information as specified in the DWAF Guideline
Document “Minimum Requirements for Waste Disposal by Landfill” (DWAF, 1998)
through the drilling of additional exploration boreholes.
• Prepare a geohydrological investigation report to serve as part of the permit
application documentation required by the DWAF Guideline document referred to
earlier.
Bohlweki Environmental (Pty) Ltd appointed R Meyer, Geohydrological Consultant, to
conduct the geohydrological investigation. He has been involved in the selection and
development of a new Regional General and Hazardous Waste Disposal Facility since the
inception of the project.
3 REPORT LAYOUT
The report describes the information required in terms of the DWAF guideline document
“Minimum Requirements for waste disposal by landfill”. As such the report contains the
following information:
• Brief description of the position and access routes to the area,
• climate of the region,
• hydrology of the region
• a description of the regional and local geological conditions and other subsurface
conditions,
• the results of a hydrocensus of the farm Grassridge 190 and surrounding farms,
• the results of a recently completed geophysical survey,
• the results of the recent exploration drilling,
• the regional and local geohydrological conditions,
• aquifer classification,
• groundwater use and quality, and
• an evaluation of geological and geohydrological conditions in terms of the suitability
of the area for the development of the proposed waste disposal facility.
4 LOCALITY AND ACCESS
The farms Grassridge 190 and 227 are located approximately 35 km directly north of Port
Elizabeth and 15 km southwest of Addo and are located within the Nelson Mandela
Metropolitan Municipality's area of jurisdiction. The main access route from Port Elizabeth is
3
along the R335 towards Addo, while from Uitenhage following the R75 towards Kirkwood,
and taking the gravel road turnoff towards Addo, provides access to the farms (Figure 1).
The farm Grassridge 190 is near the crest of a local topographically high area (~290 mamsl)
on land sloping gently to the south. The site is located in a broad valley sloping to the
southeast near the boundary between the farms Grassridge 190 Remainder and 227.
Figure 1: Map of the Port Elizabeth area showing the approximate position
of the proposed site (red circle).
5 HYDROLOGY OF THE REGION
The position of the selected site in relation to surface water catchment boundaries is shown
in Figure 2. This shows that the site is almost on the surface water divide between the
drainage areas of the Sundays and Coega Rivers. It is located within the quaternary surface
water sub-catchment M30A draining towards the Coega River in the south and close to the
junction of three Quaternary sub-catchments M30A and M30B (Coega River) and N40F.
Quaternary sub-catchment N40F is part of the larger Secondary catchment of the Sundays
River basin, while drainage from the Quaternary sub-catchments M30A and M30B is towards
the ephemeral Coega River to the south.

4
Figure 2: Approximate area selected for the development of a waste disposal facility (oval shape) in
relation to the three Quaternary catchments. The red line indicates the catchment boundaries of
Quaternary catchments N40F draining towards the Sundays River and M30A and M30B draining
into the Coega River (Map reference: 1:50 000 scale 3325DA Addo).
Because of the proximity to catchment boundaries and the local topographic conditions, no
perennial rivers or streams occur in close proximity to the site and therefore 1:50 year flood
lines are not really applicable. Nevertheless an assessment of the 1:50 year flood conditions
for the stream flowing through the broad valley in which the site is located, has been done.
Two assumed catchment areas (100 ha and 200 ha) and existing rainfall records for the area
(Rain gauge 0034762, Uitenhage district) were used in the simulation. Calculations show
that a peak 24 hour rainfall event of 149 mm would result in a 50-year peak flow of 7.7 m/s
and 11.1 m/s for a 100 ha and 200 ha catchment size respectively. This flow would result in
a water depth of 0.7 m and 0.8 m in a 30 m wide channel of concave shape for the 100 ha
and 200 ha catchment areas respectively. Should the area be approved for further
development, these calculations have to be revised once the geometry of the channel has
been established more accurately. Preliminary designs for the waste disposal site have
taken these predicted flow rates and water depths into account.
Quaternary
catchment N40F
Quaternary
catchment M30B
Quaternary
catchment M30A

5
6 CLIMATE AND CLIMATIC WATER BALANCE OF THE REGION
As detailed records of climatic conditions of the site are not available, the temperature,
rainfall and evaporation information from two recording stations in the vicinity, Port Elizabeth
and Addo are presented here (Table 1).
The evaporation data for the two stations, Port Elizabeth and Addo are listed in Table 2. The
somewhat lower evaporation in the interior compared to that at the coast is probably due to
slightly lower maximum temperatures inland and differences in the wind conditions.
As the planned facility will accommodate hazardous waste, it will be classified as a H:H type
site. No climatic water balance calculations are required for H:H type sites as provision is
made in the liner design to capture, control and treat any leachate generated on site.
7 REGIONAL AND LOCAL GEOLOGICAL CONDITIONS
7.1 Regional geology
The geological stratigraphic sequence of the larger study area (i.e. the Uitenhage - Port
Elizabeth – Addo area) is summarized in Table 3, with the youngest sequence being of
Quaternary age and the oldest being Cape Supergroup (information taken from the
1:250 000 geological map 3324 Port Elizabeth Geological Survey, 1989) and the 1:50 000
scale geological maps 3325CB Uitenhage Noord and 3325DA Addo (Council for
Geoscience, 2000).
A prominent feature of the area is a large basin structure, known as the Algoa Basin formed
during the breakup of Gondwanaland between outcrops of the older and intensely folded
Cape Supergroup rocks to the south, west and north. (Le Roux, 2000; Hattingh and
Goedhart, 1997). The Algoa Basin is bounded in the north and east by the Zuurberg fault,
while the Coega fault occurs close to the southern boundary of the basin. Younger
sediments of the Uitenhage Group fill this basin and are buckled into open SE plunging folds
along NW-SE trending axes. This structural pattern is illustrated by the anticlinal fold on the
farm Blaauw Baatjies Vley 189, also described by Winter (1973). During the late-Jurassic
period (160 to 145 Ma) pebble and boulder alluvial deposits accumulated in the basin being
washed from the surrounding mountains under a high energy environment to form the Enon
Conglomerate Formation, the basal formation of the Uitenhage Group. A thick succession of
clays was then deposited unconformably onto the Enon Formation forming the mudstones
and siltstones of the Kirkwood formation. Subsequently marine and estuarine clays were
deposited in the basin during a transgression period to form the Sundays River formation.
During the Tertiary (65 to 2 Ma) numerous transgressions periods occurred to form terraces
in the Cretaceous sediments while calcareous sandstones were deposited during these
times.

6
Table 1: Average maximum and minimum temperatures and rainfall as recorded at Port Elizabeth, Addo and Uitenhage weather stations.
Month Monthly Minimum/Maximum/Average Temperature (°C) Average Rainfall (mm)
Port Elizabeth Addo Uitenhage
Min Max Ave Min Max Ave Min Max Ave Port Elizabeth Addo Uitenhage
Jan 17.9 25.4 21.7 16.6 29.2 22.9 17.3 27.8 22.6 36 28 33
Feb 17.9 25.4 21.6 16.6 29.3 22.9 17.5 27.9 22.7 40 40 35
Mar 16.9 24.6 20.7 15.4 28.1 21.8 16.1 27.0 21.5 54 43 44
Apr 14.3 23.0 18.7 12.1 26.2 19.1 13.0 25.8 19.4 58 37 41
May 11.5 21.7 16.6 8.7 24.0 16.3 9.6 24.0 16.8 59 31 30
Jun 9.2 20.3 14.7 6.0 21.9 14.0 6.9 22.3 14.6 62 24 23
Jul 8.8 19.7 14.3 5.2 21.9 13.6 6.4 21.8 14.1 47 26 29
Aug 9.8 19.6 14.7 6.4 22.6 14.5 7.9 22.0 14.9 64 33 36
Sep 11.4 20.0 15.7 8.8 23.6 16.2 10.2 22.7 16.4 62 27 28
Oct 13.1 20.8 17.0 11.0 24.6 17.8 12.3 24.3 17.8 59 41 42
Nov 14.6 22.3 18.5 12.9 26.3 19.6 14.3 24.8 19.6 49 39 46
Dec 16.4 24.3 20.3 14.7 28.1 21.4 15.9 26.8 21.4 34 27 30
Average total annual rainfall (mm) 624 396 417
Source: SA Weather Services, Port Elizabeth
Table 2: Evaporation data for the region
Coordinates Mean Annual Evaporation Station name & number
Latitude Longitude S-pan (mm) A-Pan (mm) Recording Period
Port Elizabeth M2E001 33o 59’ 25
o 36’ 1528 1792 1957-1979
Addo N4E001 330 34’ 25
0 42’ 1401 1742 1960-1979
Source: Midgley et al (1994). Surface Water Resources of South Africa.

7
Intense east-southeast trending folding characterises the Cape Supergroup rocks to form the
Elands River Syncline towards the south and the Swartkops River anticline in the north
(Toerien and Hill, 1989). Apart from the dominant folding, the other major structural feature is
the normal tensional Coega fault traceable eastwards from the Groendal Dam to the coast.
Vertical southward displacement along this fault is substantial. Maclear (2001) cites a value
of 1 800 m, while Marais and Snyman (1965) report the average displacement to be of the
order of 550 m.
Table 3: The geological sequence in the Port Elizabeth/Uitenhage/Addo area
Period and age
range (Ma) Group
Sub-
Group Formation Lithology
Holocene Alluvium, calcrete and dune fields
Fluvial terrace gravel
Bluewater Bay Alluvial sheet gravel and sand Quaternary
(1.65-0.1 Ma) Nanaga Aeolianite
Tertiary
(67-1.65 Ma)
Algoa
Alexandria Calcareous sandstone, shelly
limestone, conglomerate
Sundays River Greenish-grey mudstone,
sandstone
Kirkwood Reddish, greenish mudstone,
sandstone
Cretaceous/
Jura
(210-67 Ma)
Uitenhage
Enon Conglomerate
Witteberg Witpoort White quartzitic sandstone
Adolphspoort Shale and siltstone with sandstone
at base. Traka
Karies Shale, discontinuous sandstone Bokkeveld
Ceres Gamka Feldspathic sandstone,
fossiliferous
Nardouw
Baviaanskloof/
Skurweberg/
Goudini
Arenite, quartz sandstone
Peninsula Quartzite, quartz sandstone
Devonian
(410-360 Ma)
Table
Mountain
Graafwater
Arenite, quartz sandstone,
quartzite
Note:
As part of an oil exploration drilling programme, deep drilling north of Addo indicated a
thickness of 1863 m for the Sundays River formation. The combined thickness of the
Sundays River and Kirkwood formations over large parts of the area, is in excess of 1000 m.
Due to intense folding and the presence of an anticlinal structure underlying the specific
farms investigated during this phase, the combined thickness of these two formations is
however significantly less in the area under investigation. No definite thickness can be given
Outcrops present near the investigated area on Grassridge 190

8
as no boreholes that penetrated the entire succession are present close to the area under
investigation. It is however estimated that the combined thickness of the Sundays River and
Kirkwood formations is at least of the order of 300 m in the vicinity of the farms
Grassridge 190 and Grassridge 227.
Apart from the anticlinal structure described above, there are no other significant structural
features mapped within the study area. The geophysical exploration programme of the late
1960s also did not reveal any deep structural features in this area (Winter, 1973).
Hattingh and Goedhart (1997) reported on structural evidence of Neogene to Quaternary
period (23 - 2 Ma) tectonic activity in the Algoa Basin. Observations of displacement in
Neogene age strata near the Coega fault in the south suggest that some older faults in the
Algoa Basin may have been rejuvenated. They also propose that the Eastern Cape area
experienced renewed tectonic activity as recent as the Holocene triggered by tectonic activity
along the offshore Agulhas Fracture Zone.
Although seismic events are recorded from time to time along the south-eastern African
continental margin, the epicentres are located far northeast of the Algoa Basin and are
according to Hartnady (1990), linked to extension of the East African Rift system. Hattingh
and Goedhart (1997) report that no modern seismic activity has been recorded in the
southern part of the Eastern Cape by either of the two seismic stations located at
Grahamstown and Port Elizabeth.
7.2 Local geological conditions
The geological conditions underlying the present study area comprising of the farms
Grassridge 190 Remainder and Grassridge 227 is discussed in this section. A portion of the
1:50 000 scale geological map 3325DA Addo (CGS, 2000) showing the surface geological
conditions in the study area is presented as Figure 3. The legend for the map is presented in
Table 4.
Table 4: Geological legend for the geological map shown in Figure 3
Symbol Colour Formation name Lithology
T-Qn Brown Nanaga Aeolianite/Calcareous sandstone/sand
Ta Pink Alexandria Calcareous marine/ estuarine/lagoonal sandstone, conglomerate, coquinite
Ks Red Sundays River Grey mudstone, siltstone, sandstone
J-Kk Yellow Kirkwood Reddish and greenish mudstone, sandstone and conglomerate

9
Figure 3: Portion of the 1:50 000 Geological map 3325DA Addo showing the geology on the farms
Grassridge 190. Grassridge 227 and Grassridge 228 and the approximate area identified for
the development of the waste disposal facility.
Proposed Site

10
A prominent E-SE plunging anticlinal structure (generally referred to as the Addo Ridge) is
shown on isopach maps of the Sundays River and Kirkwood formations prepared by Winter
(1973). The associated synclinal structure to the south is referred to as the Coega
Embayment by Winter (1973). The farms Grassridge 190 and 227 are located along the axis
of this syncline where prominent aeolianite outcrops of the Nanaga formation, flanked by
calcareous marine and estuarine sandstones of the Alexandria formation, occur. These two
formations are underlain by thick sedimentary successions of Sundays River and Kirkwood
formations. Both these formations consist predominantly of mudstone and siltstone, with
minor sequences of sandstone and conglomerate. From a deep oil exploration borehole
(Borehole CK1/68 - approximately 4 km north of Addo), it is known that the Sundays River
formation has a thickness of 1863 m (le Roux, 2000). However, from the isopach maps
prepared by Winter (1973) the thickness of the Sundays River formation is interpolated to be
approximately 300 m on the farm Grassridge 190. At another deep oil exploration borehole
(AD1/68) some 7 km east-north-east of the farm Grassridge 190, and on the north-eastern
flank of the Addo Ridge anticline only 203m of Sundays River Formation was intersected.
Based on the isopach maps prepared by Winter (1973) and the synclinal structure (Coega
Embayment), it is concluded that the Sundays River formation should be at least 300 m thick
at these locations on the farms Grassridge 190 and 227. Isopach maps for the underlying
Kirkwood formation (Winter, 1973) indicate that this formation is at least 200m thick. It is
therefore concluded that surface calcrete and calcareous sandstones outcrops at Grassridge
190 are underlain by at least 500 m of mudstone, siltstone and minor sandstone layers of the
Sundays River and Kirkwood formations.
The Kirkwood formation is again underlain by another thick sedimentary succession of shale
and sandstone formations deposited in a moderately shallow marine environment to form
what is known as the Bokkeveld Group. From these thickness estimates it is clear that the
Table Mountain Group rocks hosting the strategically important artesian aquifer, and
occurring stratigraphically below the Bokkeveld Group, is overlain by at least 1 000 m of low
permeability sedimentary rocks largely deposited in a marine environment.
Within the boundaries of the preferred site located on Grassridge 190 Remainder, outcrops
of three geological formations are present (Figure 3). These formations, with a short
description of the lithology, are listed in the table below, in order of increasing age (Table 5).
Based on the 1:50 000 geological map of the area it appears that the Sundays River
formation is often exposed in the topographically lower lying areas where the overlying
Nanaga and Alexandria formation have been removed by erosion. Outcrops of Alexandria
formation are found along the valley slopes, while the Nanaga formation often occupies the
local higher topographic features. No linear structural features have been mapped in the
area. It also appears that the densely vegetated areas are mostly associated with outcrops of
the Sundays River formation, while the open grasslands developed on outcrop areas of the
Nanaga formation.

11
Table 5: Geological formations present on the farm Grassridge 190
Age period Formation Lithology Estimated
thickness (m)
Pliocene to Early Pleistocene (~ 5 to
~1 Ma)
Nanaga Formation
Calcareous sandstone/sandy limestone, aeolianite,
<25
Miocene to Pliocene (~22 to ~2 Ma)
Alexandria Formation
Calcareous marine/estuarine/ lagoonal sandstone, conglomerate, coquinite
<20
Late Cretaceous (~145 to ~110 Ma)
Sundays River Formation
Grey mudstone, siltstone, sandstone >300
8 RESULTS OF GEOPHYSICAL SURVEY
According to the DWAF Minimum Requirements for Site Investigations (DWAF, 1998) of a
H:H type landfill it is a requirement to drill a minimum of three exploration boreholes as part
of the site investigation. It is a further requirement that an appropriate geophysical survey be
conducted to determine whether geological structures that may influence geohydrological
conditions are present and to guide the selection of drilling sites. Accordingly a geophysical
services company, Engineering and Exploration Geophysical Services cc (E&EGS), was
appointed to conduct a ground magnetic and electromagnetic survey of the proposed site.
Ground magnetic surveying was used to determine whether magnetic geological structural
features such as dykes traverse the area, while the electromagnetic method is sensitive to
changes in weathering depth, conductive strata, faults and lithological contacts. These
techniques were considered the most appropriate given the local geological conditions. The
geophysical report is attached as Appendix A.
The magnetic and EM measurements were done at station spacing of 20 m along profile
lines covering the area selected for the development of the facility. The magnetic profiling
revealed a very constant magnetic field across the entire area with no anomalous regions
that could be associated with linear structures. This was in agreement with expectations.
The electromagnetic profiling showed large variations in electrical conductivity of the subsoil,
from ~30 mS/m to 120 mS/m (Figure 5). Interpretation of these results suggested the
following correlation between electrical conductivity and surface mapped geology:
High conductivity Sundays River formation
Intermediate conductivity Alexandra formation
Low conductivity Nanaga formation
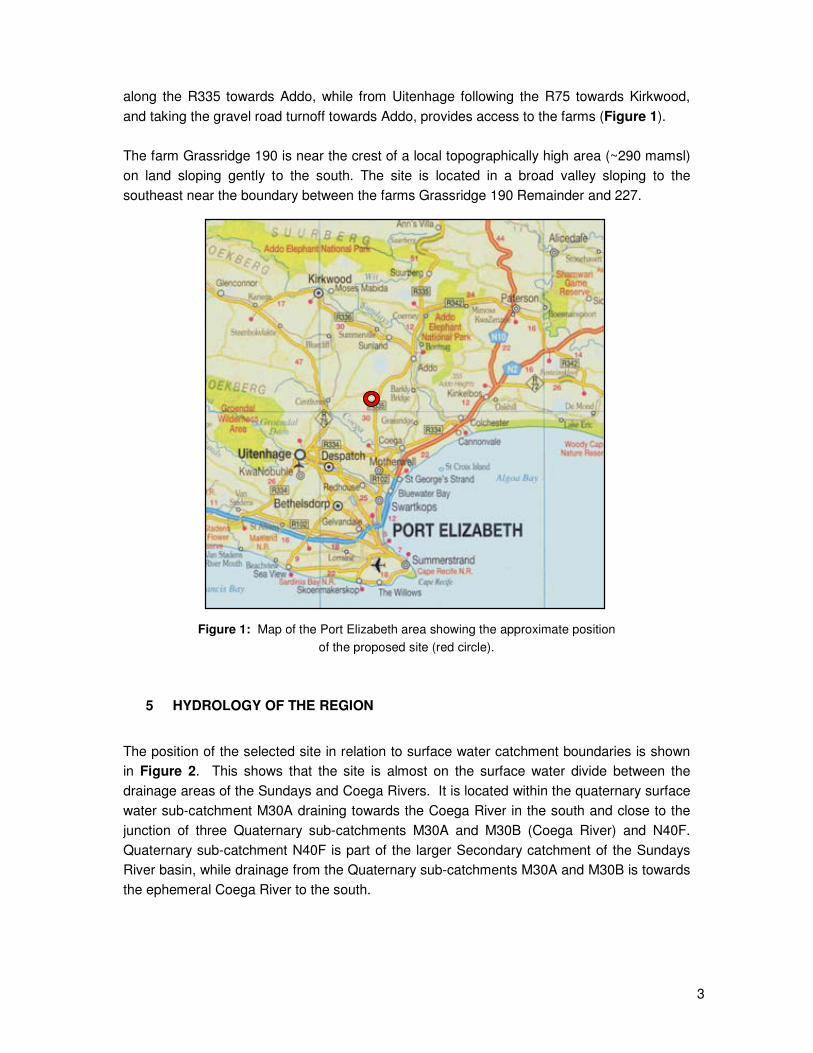
A prominent feature on the conductivity contour plan (Figure 4) is the low conductivity zone
extending across the site towards the south-eastern corner of the survey area flanked by
ridges of very high conductivity. Based on the initial interpretation of the geophysical survey
results, and taking cognisance of the local geological conditions and the preliminary design
of the disposal cells (Jones & Wagener, 2008), four drilling targets were identified for the
drilling of the exploration boreholes. These positions are marked on Figure 4.
12
Figure 4: Contour map of apparent electrical conductivity around the proposed site on Grassridge
190 (from E&EGS, 2008) showing provisionally selected positions of exploration boreholes.
9 RESULTS OF ADDITIONAL EXPLORATION DRILLING
Boreholes were drilled during the period 14-19 May 2008 close to the four selected positions
based on the geophysical survey results to depths ranging between 69 m and 93 m. The
geological descriptions of these boreholes are presented in Appendix B and boreholes were
allocated the reference numbers GR190/6 to GR190/9. It is important to note that in none of
these boreholes water was encountered during drilling, although some water did accumulate
in three of the boreholes and water levels could be measured in these a few days after
completion of the drilling.
The dominant lithology in all boreholes was mudstone with interlayered thinner sandstone
layers. The upper sections (0-15 m) are often calcareous. The maximum thickness of
sandstone layers observed within the Sundays River formation was about 20 m and occurred
in boreholes GR190/7, GR190/8 and GR190/9. A provisional stratigraphic interpretation of
the geological succession in each borehole is given in Table 6.
Although the 1:50 000 geological map indicates outcrops of the Nanaga Formation at
borehole GR190/6, it is proposed that the surface calcrete layer is directly underlain by the
older Alexandra Formation. Similarly, at borehole GR190/8 where according to the map,
Alexandria Formation rocks should outcrop, the 20 m thick sandstone layer underlying the

13
3 m thick clay layer, is interpreted to be part of the upper Sundays River formation and not
the Alexandria formation. Borehole GR190/9 in the south and in the valley floor only
intersected the Sundays River formation. The calcareous nature of the upper 14 m may
suggest that this material has been transported and deposited into lower lying areas of a
deeply eroded palaeo-topography.
Table 6: Stratigraphic correlation between boreholes
GR190/6 GR190/7 GR190/8 GR190/9 Bh #
Depth interval
Formation Depth
interval Formation
Depth interval
Formation Depth
interval Formation
0-3 m Surface calcrete
0-5 m Surface calcrete
0-5 m
Weathered Sundays
River formation
0-3 m Soil
3-13 m Alexandria formation
5-75 m Sundays
River formation
5-75 m Sundays
River formation
3-14 m
Transported (valley fill?) material or weathered
Sundays River formation S
tra
tig
rap
hic
S
eq
ue
nce
13-69 m Sundays
River formation
14-93m Sundays River
formation
Slightly moist conditions were encountered in boreholes GR190/6, GR190/7 and GR190/9,
while much dryer conditions were observed, especially in the upper sections, during the
drilling of GR190/8. This is believed to be a contributing reason for the low electrical
conductivity reflected in the geophysical results.
Despite drilling the new boreholes to depths between 69 m and 93 m, all were dry on
completion, the slight moist conditions encountered during drilling is believed to have been
responsible for some water seepage into the borehole to eventually establish a water level a
few metres above the base of the borehole. It is suspected that the slight seepage originates
mainly from the thinner sandstone horizons and not the mudstone. Except in the case of
borehole GR190/6, which remained completely dry four days after drilling was completed,
seepage along the borehole sides resulted in the formation of a tight clay making it very
difficult to lower any probes into the boreholes for the measurement of water levels or to
collect water samples. This is an indication that the monitoring boreholes to be installed
should the permit application be successful and the site be developed into an operating
waste disposal facility, will have to be constructed very carefully to prevent formation
collapse and clogging of screened sections. This will probably involve the drilling of a larger
diameter borehole (208 to 260 mm) to accommodate the installation of a suitable gravel pack
and uPVC screened sections.
10 HYDROCENSUS OF GRASSRIDGE 190 AND SURROUNDING FARMS
A borehole census of the farms Grassridge 190 (including Grassridge 190 Portion 3),
Grassridge 227, Grassridge 228, Coega Kammas Kloof 191 and a part of Blaauw Baatjies
Vley 189, with a minimum radius of 3 km around the proposed site, was done during the
different stages leading up to the permit application. All this information is captured in Table
7 including information on the four new drilled boreholes (highlighted in yellow).

14
Table 7: Borehole census information of the farms Grassridge 190, 227 and 228
Coordinates
GPS (WGS84 datum)
Latitude Longitude Farm name
Bh
number
D m s D m S
Approx.
Elevation
(mamsl)
Depth
(m) and
date
drilled
Static wl
(mbc) and
elevation
(mamsl)
Yield (l/s)
and use Equipped
Water
quality
available
Additional comments
BBV189/2/1 33 37 16.0 25 31 45.1 202 na ~1974
n.a. 0.2 l/s; Domestic (Suttonvale)
Solar powered pump
Table No access possible Blaauw Baatjies Vley 189 Portion 2 BBV189/2/2 33 37 16.7 25 31 49.1 197 na No access
Yield n.a.; not used.
No No No access possible
BBV189/3/1 33 36 28.8 25 31 10.7 299 na No access Yield n.a.; Stock watering
Solar powered pump
Table Blaauw Baatjies Vley 189 Portion 3 BBV189/3/2 33 36 33.5 25 31 28.6 257 >50 m
Yield n.a.; stock watering
Solar powered pump
Table
GR190/3/1 33 37 17.4 25 31 44.8 203 n.a. ~30 (pumping); 173
Low yield; not used
Wind pump Table Domestic and stock watering on farm Blauw Baatjies Vley 189/2
GR190/3/2 33 31 45.5 25 31 45.5 203 103 >50; <153
Very low yield; not used
No No Drilled in 2003 Grassridge
190 Portion 3
GR190/3/3 33 37 17.4 25 31 45.1 202 36.3; 166
Yield n.a.; not used
Previously engine and Mono pump
No Due to low yield equipment removed; now abandoned.
GR190/1 33 38 33.1 25 32 44.8 255 120 m Dry <135
Was ~0.5 l/s (J Erasmus), now dry.
Previously submersible pump installed
No
According to J Erasmus of PPC, wl previously at ~60m; PPC intention was to use as emergency supply. Drilled 11/08/1976?
GR190/2 33 38 45.0 25 32 43.7 245 125 m 75.45; 169
~0.8 l/s (J Erasmus), not used
Submersible pump installed, but not currently operational
No
Drilled 31/10/1976 by C Potgieter; not possible to sample due to pumping equipment in bh.
GR190/3 33 38 32.4 25 32 03.8 268 n.a. Blocked at 3m Yield n.a.; not used.
Not equipped No Next to reservoir.
GR190/4 33 38 20.8 25 30 21.3 203 m n.a. Blocked at 1 m Yield n.a.; not used.
Not equipped No According to J Erasmus, PPC, bh backfilled and dry.
GR190/5 33 38 29.3 25 33 22.3 220 m 300 ft? 80.45; 139 Yield n.a.; not used.
Not equipped Table Drilled 1954?
GR190/6 33 38 03.3 25 32 53.3 251 69 Dry; <182 Dry Exploration bh No Drilled May 2008
GR190/7 33 38 28.8 25 33 21.7 215 75 73; 142 <0.1 Exploration bh Table Drilled May 2008
GR190/8 33 38 33.0 25 33 10.7 238 93 72; 166 <0.1 Exploration bh Table Drilled May 2008
Grassridge 190
Remainder
GR190/9 33 38 40.2 25 33 27.4 204 75 69; 135 <0.1 Exploration bh Table Drilled May 2008

15
Table 7 (cont.): Borehole census information of the farms Grassridge 190, 227 and 228
Coordinates
GPS (WGS84 datum)
Latitude Longitude Farm name
Bh
number
D m s D m S
Approx.
Elevation
(mamsl)
Depth
(m) and
date
drilled
Static wl
(mbc) and
elevation
(mamsl)
Yield (l/s)
and use Equipped
Water
quality
available
Additional comments
CKK191/1 33 36 50.5 25 35 46.6 75 n.a. No access Yield n.a.; not used.
Wind pump Table 8 Unknown
CKK191/2 33 37 04.5 25 35 36.5 97 n.a Blocked Yield n.a.; not used.
Wind pump but broken
No Borehole abandoned
CKK191/3 33 36 10.5 25 34 42.0 96 n.a No access Na Wind pump Table 8
CKK191/4 33 36 06.0 25 34 27.2 91 n.a Blocked Yield n.a.; not used.
Not equipped Borehole abandoned
CKK191/5 33 35 59.3 25 33 52.3 134 n.a Blocked at 26 m depth
Yield n.a.; not used.
Previously equipped with wind pump
CKK191/6 33 36 14.6 25 34 21.5 90 n.a 17.6 Yield n.a.; not used.
Not equipped Table 8
CKK191/7 33 36 38.7 25 34 19.4 106 n.a No access Yield n.a.; not used.
Wind pump Wind pump, not operational
CKK191/8 33 36 45.1 25 35 29.8 80 n.a ~3.5 m Yield n.a.; not used.
Wind pump Table 8 Wind pump not operational
CKK191/9 33 36 42.0 25 36 31.4 70 n.a 5 Yield n.a.; not used.
Not equipped Table 8
CKK191/10 33 36 41.3 25 35 32.2 72 n.a 4 Yield n.a.; not used.
Not equipped Table 8
CKK191/11 33 36 53.4 25 35 38.7 75 n.a Blocked Yield n.a.; not used.
Not equipped
CKK191/12 33 36 53.7 25 35 41.3 82 n.a. Blocked Yield n.a.; not used.
Not equipped
CKK191/13 33 36 52.0 25 33 41.4 162 n.a. Yield n.a.; not used.
Not equipped Dry Very brackish water
CKK119/14 33 36 55.2 25 34 59.8 98 n.a. n.a. Yield n.a.; not used.
Wind pump
CKK119/15 33 36 53.7 25 35 7.6 101 n.a n.a. Yield n.a.; not used.
Not equipped Dry
CKK119/16 33 36 39.6 25 35 07.1 83 n.a. Blocked Yield n.a.; not used.
Not equipped Dry
CKK119/17 33 36 38.3 25 35 12.1 91 Blocked Yield n.a.; not used.
Not equipped Dry
Coega Kammas Kloof 191 Portions 2, 3, 4, 5
and 6
CKK119/18 33 36 46.8 25 35 57.2 75 n.a. Yield n.a.; not used.
Not equipped No Very brackish water

16
Table 7(cont.): Borehole census information of the farms Grassridge 190, 227 and 228
Coordinates
GPS (WGS84 datum)
Latitude Longitude Farm name
Bh
number
D m s D m S
Approx.
Elevation
(mamsl)
Depth
(m) and
date
drilled
Static wl
(mbc) and
elevation
(mamsl)
Yield (l/s)
and use Equipped
Water
quality
available
Additional comments
GR227/1 33 39 14.9 25 36 38.4 208 80 Bh blocked Yield n.a.; not used.
Previously w/pump, now destroyed
No
Borehole collapsed between 40-50 m and is now blocked at ~1 m depth. Previously equipped with wind pump.
GR227/2 33 38 47.3 25 34 18.9 218 135 74.22 143
~2 l/s; not used
Equipped with 100 mm sub-mersible pump
No
Drilled in 1998 by PPC, but not used for the last 3 years. Water struck at 75m. Intended as standby bh. Electricity supply to pump currently faulty and bh could not be sampled.
GR227/3 33 38 38.0 25 34 38.7 233 135 34.53 198
Dry when drilled; not used
Not equipped Table 8 Drilled in 1998 by PPC, dry when drilled. Bh closed and not used.
Grassridge 227
GR227/4 33 38 31.2 25 34 28.8 235 Dry, >100m
>100m; <135
Yield n.a.; Never used by PPC
Not equipped No Apparently had some water, but was never used by PPC
GR228/1 33 42 29.6 25 33 20.9 92 130 4.12;(Nov’07); 88
6.7 l/s, not used
Not equipped Table 8 Locally known as “Sout gat”, not used due to poor quality.
GR228/2 33 40 44.6 25 34 55.2 152 n.a. 22.92; (Nov’07); 129
Yield n.a.; not used.
Previously w/pump, destroyed
Table 8
GR228/3 33 41 22.9 25 35 33 184 n.a. n.a. Yield n.a.; not used.
Destroyed No Bh destroyed, coordinates approximate only.
Grassridge 228
GR228/4 33 41 11.4 25 35 34.4 190 n.a. n.a. Yield n.a.; not used.
Destroyed No Bh destroyed, coordinates approximate only
Notes:
Exploration boreholes drill during May 2008

17
Table 8: Groundwater quality of selected boreholes around the proposed waste disposal facility
Farm or Standard Bh no. or Reference Standard
pH Elect
cond.
Approx. TDS
(Calc) Alk NH4 Ca Cl F Fe Mg
Mn
NO3 +
NO2 (N)
PO4
K Si
Na
SO4 Zn
Units mS/m mg/L mg/L mg/L mg/L mg/L mg/L mg/L mg/L mg/L mg/L mg/L mg/L mg/L mg/L mg/L mg/L
Class I 5-9.5
<150 <1000 <1 <150 <200 <1 <70 <10 <50 <200 <400 <5
Class II 4-10 150-370
1000-2400
1-2 150-300
200-600
1.0-1.5
70-100
10-20
50-100
200-400
400-600
5-10 SABS 241:2006
Edition 6.1 Class II max. water
consumption period
No limit
7 yrs 7 yrs No limit
7 yrs 7 yrs 1 yr 7 yrs 7 yrs 7 yrs 7 yrs 7 yrs 1 yr
Sundays
River Pipeline
8.1 74.8 486 151 <0.1 32 79 19 0.2 <0.2 3 1.7 93 52
Grassridge 190 Portion 3
GR190/3/1 8.3 576 3744
GR190/5 7.5 273 1775 429 2.5 38 835 42 6.1 <0.2 17 <0.6 432 3
GR190/7 8.0 308 2002 234 <0.1 74 693 0.49 7.9 64 0.08 <0.2 <0.2 32 5 444 118 <0.06
GR190/8 8.1 176 1144 252 <0.1 47 302 0.57 28 39 0.09 0.78 0.93 32 10 274 63 <0.06 Grassridge 190
GR190/9 8.0 197 1281 266 <0.1 75 670 0.51 9.2 66 0.09 <0.2 <0.2 30 5.9 441 107 0.18 Grassridge 227 GR227/3 7.4 99.1 644 208 0.12 115 259 15 0.85 <0..2 4 6.1 55 22
GR228/1 7.2 523 3400 212 2 58 1640 81 <0.2 0.93 14 1.2 871 261 Grassridge 228
GR228/2 7.2 804 5226 116 <0.1 259 2710 200 3.9 <0.2 19 12 1070 302 Blaauw Baatjies
Vley 189 Portion 2 BBV189/2/1 7.9 325 2113
BBV189/3/1 8.6 272 1768 Blaauw Baatjies Vley 189 Portion 3 BBV189/3/2 8.1 471 3062
CKK/191/1 7.9 719 4674
CKK/191/3 7.8 502 3263
CKK/191/6 8.1 78.1 508
CKK/191/9 7.7 843 5480
CKK/191/10 9.8 994 6461
Coegakammaskloof 191
CKK/191/11 9.1 671 4362
Notes Concentration exceeds SABS 241:2006 Class I water guideline
Concentration exceeds SABS 241:2006 Class II water guidelines

Water quality information is captured separately in Table 8. The positions of all boreholes
are marked on Figures 5 to 9.
Figure 5: Positions of all boreholes located on the farms Blaauw Baatjies Vley 189, Coega Kammas
Kloof 191, Grassridge 190, Grassridge 227 and Grassridge 228. Study area is marked by the blue
oval shape area. The new exploration boreholes on Grassridge 190 Remainder are marked in yellow.

Figure 6: Boreholes located on the farms Blaauw Baatjies Vley 189 and Grassridge 190.
Figure 7: Boreholes located on the farms Coega Kammas Kloof 191.

Figure 8: Boreholes located on the farms Grassridge 227 and Grassridge 228.

Figure 9: Boreholes in close vicinity of the area identified for the development of the
proposed waste disposal site. Boreholes GR190/6 to GR190/9 are the exploration boreholes
drilled during this phase of the investigation.
11 REGIONAL AND LOCAL GEOHYDROLOGICAL CONDITIONS
11.1 Regional geohydrology
The coastal sands, alluvial and aeolianite deposits and selected formations in the Table
Mountain Group host the more important aquifers in the larger area around Port Elizabeth.
The most prominent aquifer in the area is the Uitenhage Artesian Basin Aquifer (UAB) with
an estimated total sustainable yield of 80 l/s (Venables, 1985). Yields from individual
boreholes are generally in excess of 5 l/s. The natural boundaries of the UAB are formed by
the Indian Ocean to the southeast, the Table Mountain Group-Bokkeveld Group contact in
the vicinity of the Coega River to the north, the Great Winterhoek Mountains to the west and
the St Albans Flats in the south. According to Maclear (2001) the Coega fault (see
Section 7.1 of this report) divided the UAB into two main aquifers: the Coega Ridge Aquifer
(to the north of the fault) and the deeper Swartkops Aquifer to the south. He suggests a

further subdivision of the Swartkops aquifer into two units, the Kruisrivier and the Bethelsdorp
Units. The Coega Ridge, Kruisrivier and Bethelsdorp aquifers are artesian to sub-artesian,
intensely fractured secondary aquifers in the quartzites of the Table Mountain Group.
Groundwater quality of the artesian aquifer is excellent, with electrical conductivity generally
less than 15 mS/m (Maclear, 2001). The work by Maclear (2001) confirms the earlier
statement that the combined thickness of the Uitenhage Group formations, that act as
confining layers, exceeds 500 m at Grassridge 190. The UAB aquifer provides through, for
example the Uitenhage spring, significant baseflow in places to the surface water drainage
systems. Groundwater is also used to a limited extent within the larger area to support basic
human needs, stock watering and agriculture.
As a result of over–exploitation of the artesian aquifer, a portion of the UAB covering an area
of 1 125 km2, was declared a Subterranean Government Water Control Area (SGWCA) in
1957. This controlled area has been described in more detail in earlier reports (Godfrey et al,
2000; Bohlweki Environmental, 2003). The farms currently under investigation are located
outside the boundaries of the Control Area (Bohlweki Environmental, 2003) as the southern
boundary of the farms Grassridge 190 and 227 form the part of the northern edge of the old
Uitenhage SGWCA (Maclear, 2001). Under the old Water Act (Act 54 of 1956) Government
Water Control Areas (GWCA) were proclaimed, two of these within the broader study area,
namely:
• The Sundays River GWCA (surface water); and
• The Uitenhage Subterranean GWCA
These GWCA’s were established to control and manage the abstraction of water for,
amongst others, irrigation purposes. Under the current National Water Act (Act 36 of 1998)
where both surface and ground water are now regarded as public water, GWCAs effectively
have been extended to include the entire country. The GWCAs declared under the previous
Water Act (1956) have therefore been dissolved. However, a number of so called 'water-
stressed' areas or catchments have since been identified and relate closely to the previous
GWCAs. The use of water within these stressed areas is closely regulated and excluded
from the General Authorisations issued by DWAF. The Sunday's River downstream of the
Darlington Dam is seen as a water-stressed area and is excluded from the General
Authorisations for surface water abstraction. As such any water use within this area, as
defined by the National Water Act (1998), will require a water use licence, which in turn will
require that a Reserve Determination be undertaken for the area.
As the area under investigation is directly underlain by rocks of the Uitenhage Group, the
geohydrological characteristics of the rocks forming part of this Group, are of particular
interest. Meyer (1998) reports that close to 40% of the boreholes on record drilled into these
formations, have a groundwater yield of less than 0.5 l/s. The percentage of low yielding
boreholes is expected to be even higher, as it is known that numerous unsuccessful
boreholes have been drilled in the area, but no records of these exist. In addition, the
electrical conductivity (EC) of the water from these formations is generally in excess of
300 mS/m, with sodium, calcium, magnesium, chloride and, occasionally sulphate often

exceeding the maximum allowable drinking water limits (SABS 241, 2006; Meyer, 1998).
The high salt content is a reflection of the marine conditions under which these formations
were deposited.
Generally high yields (up to 15 l/s) can be obtained from the coastal sand and alluvial
aquifers associated with the flood plains of the major rivers draining the area. Water quality
is variable, but mostly below 300 mS/m (Meyer, 1998).
11.2 Local geohydrology
Over large portions of the farms Grassridge 190, 227 and 228 outcrops of the Alexandria and
Nanaga Formations are present. These are only a few metres thick and are extensively
mined on the farm Grassridge 227. While closer to the coast the Alexandria formation is
often regarded as a separate aquifer unit, in the present study area it appears to be mostly
developed above the regional static water level and is therefore not regarded as a separate
aquifer unit.
As described in the previous section, the study area is underlain by a thick succession of
argillaceous rocks, predominantly mudstones and siltstones of the Sundays River and
Kirkwood Formations. The fine grained sedimentary rocks of the Cretaceous Sundays River
formation were shown by Bush (1985) and Venables (1985) to be the confining layer in the
Uitenhage artesian aquifer system. This is also an indication of the low hydraulic conductivity
(or permeability) of the succession. A further indication of its low permeability is shown by the
use of the term “Uitenhage Aquiclude” for the combination of these two formations (Parsons,
1994; Maclear, 2001). In addition, the underlying sediments of the Bokkeveld Group are
hydrogeologically described by Maclear (2001) as an “aquitard”. Wiid (1990) reports on
laboratory permeability tests on shale from the Sundays River Formation near Aloes which
indicated permeability values around 1 x 10⁻⁹ cm/sec or ~8.6 x 10⁻⁷ m/d. To put this value in
perspective, the liner requirements at waste disposal sites specified in the DWAF Minimum
Requirements for Waste Disposal by Landfill (1998), should have a permeability of the order
of 1 x 10⁻⁷ cm/sec (8.6 x 10⁻⁵ m/d). The dominant clay mineral group in these argillaceous
rocks is montmorilionite, a clay mineral that is characterized by its swelling in water. From
these descriptions it is clear that the geological formations underlying the proposed site all
have a very low hydraulic conductivity. The outcrops of limestone and calcareous sandstone
of the Nanaga Formation form a relatively thin cover and are in turn underlain by thin marine
deposits of calcareous sandstone of the Alexandria Formation. Both of these formations are
not regarded as aquifers in the study area.
From the information supplied Mr Jakkie Erasmus, Farm Manager of the PPC farms, the
maximum yield of the boreholes drilled on the farms Grassridge 190 and 227 is
approximately 2 l/s, but this would however, be an exception rather than the rule. Many
boreholes in the area are only equipped with wind pumps, which often is a reflection of low
yield conditions. The observed low borehole yields are typical of the type of basement
geology (‘tight’ or massive mudstone and siltstone). Parsons (1983) found the borehole yield
in the Kirkwood and Sundays River formations to range between 0.1 and 1.5 l/s with 0.5 l/s
being the average. Meyer (1998) reports that close to 40% of the boreholes drilled into
formations of the Uitenhage Group have a groundwater yield of less than 0.5 l/s. Low
yielding or “dry” boreholes in these formations is further confirmed by the recent drilling of
four exploration boreholes at the site under investigation. All four boreholes were dry at
completion (see Section 9 of this report). It must also be emphasised that no groundwater is
currently used, whether for domestic, stock watering or irrigation purposes, within a radius of
2-3 km around the site.
Depth to static water level as measured in 20 boreholes on surrounding farms, ranges
between 4 m and >120 m below ground level. The shallower water levels are mostly
confined to topographically lower areas such as in valleys or near drainage courses. The
distribution of water level information was used to construct a ground water level map shown
in Figure 10. This map clearly shows a ground water divide near the surface water divide
and that groundwater flow is in a north-easterly and south-easterly direction. Several of the
boreholes are situated on a plateau area close to the watershed between Quaternary
catchments N40F (Sundays River), and M30A and M30B (Coega River) where static
groundwater levels are generally deeper than 75 m below surface. Static groundwater levels
around the proposed site are between 69 m and 73 m below surface.
12 AQUIFER CLASSIFICATION AND PROTECTION
From the above descriptions it is clear that two hydrogeological units or aquifers are present
in the area. These are an upper aquifer associated with the Sundays River and Kirkwood
Formations, and a deeper aquifer (>200 m below surface) associated with the Table
Mountain Group formations. According to the Aquifer System Management Classification
developed by Parsons (1995) the aquifer associated with the Uitenhage Group (Sundays
River and Kirkwood Formations) would be classified as a Non-Aquifer System, while the
aquifers associated with the Table Mountain Group could be classified as a Major Aquifer
System. Non-aquifer systems are defined as formations or potentially fractured rocks which
do not have a high primary permeability, or other formations of variable permeability. Aquifer
extent may be variable and water quality variable. Major aquifer Systems on the other hand,
are defined as highly permeable formations, usually with a known or probable presence of
significant fracturing. They may be highly productive and able to support large abstractions
for public supply and other purposes (Parsons, 1995). The Uitenhage Artesian Basin is part
of the Table Mountain Group Aquifer System, and although it is situated to the south of the
study area, could be classified as a Special Aquifer System, because it has previously been
classified as an Underground Water Control Area. The deeper Table Mountain Group aquifer
is artesian where overlain by the Uitenhage Group due to the argilaceous nature of the
overlying succession. This geological composition and the associated very low hydraulic

conductivity create a very thick natural protection layer that will ensure that no potential
contamination originating at the proposed waste disposal site will reach the artesian aquifer.
Figure 10: Map of the study area showing the inferred static groundwater level contours (mamsl)
based on limited water level information and the inferred groundwater flow directions.
120m
100m
140m
160m
180m
170m
100m
70m

13 GROUNDWATER USE AND QUALITY
Of the 43 existing boreholes on the farm Grassridge 190 and surrounding farms, only two
were found to be used currently for domestic or stock watering purposes. Both of these are
on the farm Grassridge 190 Portion 3; a distance of approximately 4 km from the proposed
waste disposal site. The main reasons for the very limited use of groundwater in the area
are threefold:
• The general very poor quality of the groundwater
• The low yield of boreholes, and
• The reliable and easy access farmers have to very good quality water at affordable
cost from the Sundays River/ Port Elizabeth pipeline that traverses the area.
Water samples could be obtained from 17 of the boreholes on the surveyed farms, including
three from the recently drilled boreholes. With the exception of one borehole (GR190/3/1),
none of the boreholes are equipped with pumps that are still in operation, and therefore all
samples could only be obtained from those open boreholes accessible with a bailer. Water
quality information is captured in Table 8. For reference purposes the SABS 241 (2006)
Drinking Water Standard for Class I (Ideal condition) and Class II (Maximum allowable), as
well as the analysis of a water sample taken from the reservoir supplied from the Sundays
River pipeline on the farm Grassridge 227, are listed in Table 8.
The sediments of the Sundays River Formation were deposited under marine conditions.
Sea water and salts trapped during the depositional process, explain the general poor quality
of the groundwater in the area. This has been recognised in reports by Maclear (1994), Bush
(1985), Venables (1985) and Parsons (1983). Maclear (1994) compiled a map showing the
electrical conductivity (EC) distribution of groundwater between Uitenhage and Addo.
According to this map EC values of >500 mS/m are the dominant feature. In the present
study area, his map shows values in the range of 70 to 1500 mS/m. EC measurements on
samples collected during the recent borehole census are shown in Table 8 and range
between 99 and 804 mS/m. This confirms the observations by Maclear (1994). From the
above it is clear that the Sundays River and Kirkwood geohydrologoical units in terms of the
groundwater quality, have no strategic potential or value as a water resource.
As referred to earlier, the most prominent regional aquifer of strategic importance in the area
is the Uitenhage Artesian Basin Aquifer (UAB) with an estimated total sustainable yield of 80
l/s (Venables, 1985) and yields from individual boreholes often in excess of 5 l/s. The
artesian nature of this aquifer is mainly due to two factors: (i) the natural recharge area is the
high great Winterhoek Mountains to the north, and (ii) the Sundays River and Kirkwood
formations overlying this aquifer and forming the confining layer. At the site under
investigation and in the immediate surrounding area, the deeper Table Mountain sandstone
aquifer is however not exploited for its groundwater potential due to the excessive depth
(estimated to be in the order of 300 m to 500 m below surface).

14 GROUNDWATER MONITORING
In the documents Minimum Requirements for Waste Disposal by Landfill (DWAF, 2nd edition,
1998 and draft 3rd edition, 2005a) and the Minimum Requirements for Water Monitoring at
Waste Management Facilities (DWAF, 2005b, 3rd edition) issued by the Department of Water
Affairs and Forestry, specifications for the monitoring of groundwater at waste disposal
facilities are discussed. Groundwater monitoring can be described as the repetitive and
continued observation, measurement and evaluation of geohydrological information such as
water level and groundwater quality to follow changes over a period of time to assess the
efficiency of control measures. In essence, monitoring serves as an early warning system so
that any corrective actions required can be taken promptly. A detailed account of the
proposed monitoring specifications, including that for groundwater, is contained in the report
entitled “Draft Operating Manual for the proposed Hazardous Waste Disposal Facility”
prepared by Jones & Wagener (2008b) for the Coega Development Corporation.
Should the site receive a permit, it is recommended that the newly drilled boreholes GR190/6
to GR190/9 as well as the existing borehole GR190/5 be used as monitoring boreholes.
Apart from obtaining geological and geohydrological information, it was also the intension to
use borehole GR190/6 as a background monitoring borehole. However, no water was
encountered in the borehole during drilling and even a few days after completion it was still
dry. Should this borehole remain dry, and depending on the final approved design of the
site, a position for a new background monitoring borehole may have to be selected.
According to the 3rd edition draft of the Minimum Requirements for Water Monitoring at
Waste Management Facilities (2005), between five and ten boreholes would typically be
required for a hazardous waste disposal site. It is therefore possible that additional boreholes
will be required for monitoring. The existing exploration boreholes have also not been
equipped to serve as monitoring boreholes. Therefore, in the event of the proposed site
being approved for further development, the design of the groundwater monitoring network
will have to be revised. Some of the existing boreholes may be included in this design
provided they suitable uPVC casing can still be installed. Because of unstable formation
conditions, some minor water seepage into the boreholes shortly after drilling and the fact
that the boreholes were not cased, some collapse of the boreholes was already recognised
shortly after completion. It is therefore recommended that the groundwater monitoring
network be reviewed should a permit be issued for the site be issued. This may include the
re-drilling of some of the existing boreholes due to either collapse of the existing boreholes,
or if the final design and layout of the different components of the facility necessitate that
boreholes be moved.
In the draft operating manual prepared by Jones & Wagener (2008b) a detailed account of
the proposed monitoring specifications, including that for groundwater, can be found. In this
preliminary specification it is recommended that ground water monitoring and sampling
should be done on a quarterly basis (January, April, July and October), with detailed

analyses to be undertaken once a year (July). In their report (Jones & Wagener (2008b) only
pH, electrical conductivity and chemical oxygen are required during the other three sampling
exercises. Field measurements for all sample runs must include temperature, pH and
electrical conductivity, and must be recorded on a log sheet while on site. Post-closure
monitoring is to continue for 30 years following closure of the site, unless otherwise
motivated, and authorised by the authorities.
A list of constituents to be analysed during the July sampling is also included in the Jones
and Wagener (2008) draft operating manual. This list is based on sampling for Holfontein
Hazardous Waste Disposal Facility in Gauteng. Although this list can be used as a guideline,
the final list of constituents to be analysed for at the Grassridge site, will however depend on
the type of waste accepted for disposal at this site and when the site-specific authorizations
are issued.
15 RISK ASSESSMENT
15.1 Aquifer management classification and vulnerability
Parsons (1995) developed a South African aquifer system management classification
consisting of two parts: (i) a weighted aquifer class classification and (ii) a groundwater
quality management index, that when combined, provides a decision support tool to define
the required level of protection of the aquifer. The Ground Water Management Classification
System ratings are given in Table 9.In Section 12 above the two hydrogeological units or
aquifers present in the area, the upper aquifer associated with the Sundays River and
Kirkwood Formations, and a deeper aquifer (>200 m below surface) associated with the
Table Mountain Group formations, have already been classified as a Non-Aquifer System
and a Major Aquifer System respectively, while the Uitenhage Artesian Basin (which is
regarded as part of the Table Mountain Aquifer System) would be classified as a Special
Aquifer System.
The deeper Table Mountain Group aquifer is artesian where overlain by the Uitenhage Group
due to the argilaceous nature of the overlying succession. This geological composition and
the associated very low hydraulic conductivity create a very thick natural protection layer that
will ensure that no potential contamination originating at the proposed waste disposal site will
reach the artesian aquifer.
According to this classification system the aquifers underlying the proposed site on the farm
Grassridge 190 can be described as a ‘Non-Aquifer System’ (score = 0) with a ‘Low Aquifer
Vulnerability’ (score = 1), and requiring only a limited degree of protection (score = 0).

Table 9: Ground Water Management Classification System (Parsons, 1995)
AQUIFER SYSTEM
MANAGEMENT CLASSIFICATION
AQUIFER
VULNERABILITY
CLASSIFICATION
Class Points Class Points
GROUNDWATER
QUALITY
MANAGEMENT
INDEX
LEVEL OF
PROTECTION
Sole Source Aquifer System
Major Aquifer System
Minor Aquifer System
Non-aquifer System
Special Aquifer System
6
4
2
0
0-6
High
Medium
Low
3
2
1
<1
1 – 3
3 – 6
6 – 10
>10
Limited protection
Low level protection
Medium level protection
High level protection
Strictly non-degradation
On the adjacent farm (Grassridge 227) and approximately one kilometre east of the
proposed waste disposal facility PPC is mining surface calcrete. The mining operation
covers an area of approximately 1.5 km x 1.5 km, while the thickness of the deposite a on
average about 3 m. The calcrete layer is broken into smaller blocks with large mechanical
excavators and then taken to a crushing plant. Occasionally hard calcrete layers are
encountered at a depth of approximately 1.5 m that cannot be broken up by the normal
mining technique. According to Mr Erasmus of PPC blasting using 3 m deep drill holes, is
occasionally used (approximately once every two years) to mine these layers. These hard
calcrete deposits sometimes have to be mined to ensure the availability of a continuous
supply of ore to the crushing plant at times when mechanical failure of excavating equipment
is encountered. The mining techniques applied in this mining operation, are totally different
to deep level underground and some open cast mining operations, and therefore mining
induced seismicity and earth tremors as a risk to the stability of the waste disposal cells, can
be ruled out.
Hattingh and Goedhart (1997) report that no modern seismic activity has been recorded in
the southern part of the Eastern Cape by either of the two seismic stations located at
Grahamstown and Port Elizabeth.
15.2 Evaluation of the site for waste disposal
The results of the geological and geohydrological investigation were used in assessing the
Waste-Aquifer Separation Principle (WASP) index of the proposed site, i.e. a risk
assessment of the proposed landfill site with respect to the groundwater environment
(Parsons and Jolly, 1994). The WASP index is an indication of the suitability of a site for
waste disposal, which takes into account:
• The threat factor, i.e. the threat of the size and type of waste facility to the ground
water;
• The barrier factor, i.e. the potential for pollutant attenuation in the upper unsaturated
zone and the resultant potential for ground water pollution; and
• The resource factor, i.e. the significance of the aquifer for local and/or regional water
supply.
Threat Factor

The size of the landfill (final landfill footprint) is estimated to be approximately 25 ha and will
be classified as a H:H site. According to DWAF Minimum Requirements (DWAF, 1998) such
a landfill should be designed, engineered and operated to the most stringent standards and
must be a containment landfill with a liner and leachate detection and collection system.
Barrier Factor
The underlying siltstone and the significant depth to groundwater, is shown to have a good
barrier effect against the vertical movement of possible ground water pollutants. Estimated
travel time, based on hydraulic parameters and water level typical for the area, from on-
surface to the aquifer are calculated to be ~566 days. Due to the lack of water in the newly
drilled boreholes, no pumping tests could be done and travel times were calculated using the
estimated permeability of the underlying geological formations and depth to water level.
Resource Factor
The site overlies a non-aquifer system containing very poor quality water and with a low
potential for use. Groundwater is currently not used in the immediate vicinity of the site.
Summary
The results of the WASP assessment is given in Appendix C and shows the site to be
‘suitable’ for the development of a landfill site, in terms of the geology and geohydrology of
the area.
16 IMPACT DESCRIPTION AND ASSESSMENT
16.1 General comments
It is clear from the above discussion that there is no significant difference in the
geohydrological and hydrological conditions at the site. The aquifers present in the area can
be described as being of low significance, deep, and with an extremely poor water quality
and generally low yield, except for in the low lying areas along drainage lines, for example
boreholes GR227/2 and GR228/1. There are no known perched aquifers of any significance.
Hydrologically, there are no perennial drainage systems at or in the immediate vicinity of the
site.
16.2 Impact assessment
Potential impacts on the ground and surface water environment are described under three
headings:
Site construction phase
Operational phase, and

Decommissioning phase
Notes:
1. The impacts described only pertain to operations on the waste site itself and in the
immediate vicinity, but does not include for example impacts on ground and
surface water along the access routes to the site.
2. On the impact assessment tables (Tables 10-12) an indication is given of the
severity of the impacts before and after mitigation. Mitigation measures are
addressed in Table 13.
3. Terms used in the assessment are defined and listed in Appendix D.

32
Design and construction phase
Table 10: Impact assessment during design and construction phase
Severity / Beneficial scale (see note) Activity /
Aspect Potential Impact Nature Status Extent Duration Probability
Before mitigation
After mitigation
Signifi-cance
Excavation and site preparation
Disruption of natural runoff conditions
Excavations may cause interception and/or disruption of natural runoff resulting in less surface water entering natural drainage lines
Negative Local Short term Improbable Slight No mitigation Low
Existing boreholes
Groundwater contamination
Development of a site over an existing open borehole
Negative Local Long term Probable Severe
No effect
Medium
Storage and stockpiling areas for construction material
Soil and groundwater contamination
Uncontrolled storage of harmful products used during construction resulting in possible soil and groundwater contamination
Negative Local Short term Probable Slight
Slight
Low
Construction camp and temporary infrastructure such as workshops, wash bays. etc.
Soil, surface water and groundwater contamination
Disposal of domestic and construction process waste water and effluent affecting surface water quality
Negative Local Short term Probable Slight No effect Low
Domestic sewage
Soil, surface and groundwater contamination
Irresponsible disposal of domestic sewage eventually affecting soil, surface and groundwater quality
Negative Local Long term Probable Slight No effect Low
Storm water on and around site
Natural surface water flow in drainage lines
Natural storm water runoff pattern disrupted and end destination affected through excavations and stockpiling areas
Negative Local Permanent Probable Slight Slight Low
Groundwater recharge
Improving groundwater recharge
Excavations for construction and liner material may leave open pits that can enhance infiltration of rainfall
Positive Local Long term Probable Slight Slight Low
Fuel storage and distribution point
Soil and groundwater contamination
Irresponsible housekeeping around fuel depot and distribution point can contaminate shallow soil profile through spillages
Negative Local Long term Probable Slight No effect Low
Note: Proposed mitigation measures are listed in Table 11.

33
Operational phase
Table 11: Impact assessment during operational phase
Severity / Beneficial scale (see note) Activity /
Aspect Potential Impact Nature Status Extent Duration Probability
Before mitigation
After mitigation
Signifi-cance
Waste disposal Soil, Surface and groundwater contamination
Poor liner design/construction and ineffective leachate collection system causing leakage through liner resulting in leachate infiltration into ground. Too high volumes of leachate generated in cells resulting in high leachate levels in waste pile and eventual seepage from waste pile
Negative Local Long term Probable Moderately severe
Moderately severe
Medium
Leachate holding dams
Surface and groundwater contamination
Poor design/construction or insufficient capacity causing leakage resulting in leachate infiltration into ground, storm water or natural drainage systems
Negative Local Long term Probable Moderately severe
Slight Medium
Leachate treatment facilities
Soil and surface water and eventually groundwater contamination
Spillages affecting soil conditions Negative Local Medium term
Probable Slight
No effect Low
Waste storage areas (temporary storage, recycling facilities, , etc.
Soil, surface and groundwater contamination
Inappropriate storage facilities resulting in leaching of contaminated effluent into ground and storm water system
Negative Local Medium term
Probable Slight No effect Low
Sewage disposal (septic tank systems)
Surface and groundwater contamination
Inappropriately designed/constructed sewage disposal systems and bad maintenance resulting in groundwater contamination
Negative Local
Long term Low Slight
No effect Low
Runoff and storm water management on and around site
Surface and groundwater contamination
Insufficient storage capacity causing overflow of storm water holding facilities and impacting negatively on stream water quality and eventually groundwater
Negative Local Medium term
Low Slight
No effect Low
Washing areas (Vehicles, re-useable containers, etc)
Surface and groundwater contamination
Inappropriate design/construction of wash bays, bunding areas and effluent control resulting in soil contamination
Negative Local Medium term
Probable Slight
No effect Low
Workshops Surface and groundwater contamination
Bad housekeeping and irresponsible disposal of workshop waste products (oil, cleaning agents, etc.) resulting in soil contamination through leaching.
Negative Local Long term Probable Slight No effect Low
Note: Proposed mitigation measures are listed in Table 11.

34
Decommissioning phase
Table 12: Impact assessment during decommissioning phase.
Severity / Beneficial scale Activity / Aspect Potential Impact Nature Status Extent Duration Probability Before
mitigation After
mitigation
Signifi-cance
Closure/ capping of individual waste disposal cells
Uncontrolled leachate generation and build-up of leachate level
Insufficient/inappropriate cover construction resulting in rainwater infiltration, leachate generation and eventually leachate seepage from disposal cells
Negative Local Medium term
Probable Moderately severe
No effect Medium
Treating/dis-posal of surplus leachate and storm water in holding dams at final closure
Contamination of ground and surface water resources
Poor leachate management resulting in surplus at closure
Negative Local Medium Probable Moderately severe
Slight Medium
Maintenance of storm water control systems
“Soil” erosion at closed disposal cells
Erosion of cells resulting in collapse and exposure of waste material
Negative Local Medium Probable Moderately
severe
No effect Medium
Maintenance of capping
Uncontrolled leachate generation
Capping losing its low permeability character resulting in rainwater infiltration and leachate generation
Negative Local Medium Probable Moderately severe
No effect Medium
Maintenance of water monitoring systems (boreholes and surface water) and maintaining a sampling and analysis programme after closure according to permit conditions
Quality deterioration of water resources
Poor maintenance and control of groundwater and surface water monitoring points and boreholes, as well as neglecting regular sampling and analyses as stipulated in permit conditions..
Negative Local Long term Probable Moderately severe
Slight High
17 RECOMMENDED MITIGATION AND MANAGEMENT ACTIONS
From the tables below it will be noticed that the impact related to ground and surface water
are in most cases rated as low. This rating is applicable in the case of the extent of the
impact, the duration, the probability, the severity and the significance. Definitions of terms
used in the assessment are listed in Appendix B. The reason for the expected low impact on
the groundwater environment is due to the favourable geological and geohydrological
conditions. Similarly, the impact on surface water is also expected to be low, as the
proposed sites are all located outside important and high yielding surface water catchment
areas. Nevertheless, this should not lead to compromises on mitigation and management
actions during the design, construction, operation and closure phases of the project. The
recommended mitigation and management actions for the different phases of the project are
listed in Table 13.
18 CONCLUSIONS
Based on the available geological and geohydrological information for the proposed site and
the immediate surrounding farms, the identified site on the farm Grassridge 190 Remainder
is considered suitable for the development of a large H:H type waste disposal facility
provided the design, construction and operational requirements as specified in the DWAF
guideline document are adhered to. The main reasons for the site being regarded a suitable
area, are the following:
• The geological conditions of the underlying formations, both in terms of lithology and
depth extent are very favourable.
• The static groundwater level in the vicinity of the site is of the order of 70 m below
surface.
• Borehole yields are generally very low as illustrated by the four recently drilled
boreholes that were all dry on completion of drilling.
• The groundwater quality in the region is generally poor to very poor and as a result
very little use is being made of groundwater for domestic, stock watering or irrigation.
The poor water quality is a direct result of the marine depositional conditions that
existed during the formation of the geological formations hosting the groundwater.
• The underlying formations, the Sundays River and Kirkwood formations, comprise of
a very thick succession (estimated to be >300 m) of predominantly siltstone and
mudstone, with minor interlayered sandstone layers. These formations have a very
low hydraulic conductivity and will prevent the migration of contaminants in the case
of liner system failure.

36
Table 13: Proposed mitigation actions during the different phases of the hazardous waste disposal facility
Phase Activity Impact description Proposed mitigation
Installation of required infrastructure for water quality (surface and groundwater) monitoring and design of monitoring programme
Approval of water quality monitoring systems by the relevant government authorities
Design of site including an approved sewage disposal system suitable for the local soil conditions
Ground and surface water contamination
Design to be done according to the latest Minimum Requirement documents and specifications of the Departments of Water Affairs and Forestry (DWAF) and Environment and Tourism (DEAT). Approval of all designs to be obtained from the relevant National and Regional/Provincial regulatory authorities.
Closure of boreholes Groundwater contamination Sealing of all boreholes with cement and final bentonite at the top. Sanitary seal consisting of a bentonite and sand mixture around the upper 4 m of the borehole.
Excavation and site preparation, Storm water control on and around site
Disruption of natural runoff conditions
Proper storm water control measures to be implemented to minimize storm water collection within the excavated areas and to reduce erosion
Construction and installation of liners and leachate collection and drainage systems.
Groundwater contamination Selection of good quality natural clay for liner construction, alternatively addition of bentonite to liner material to attain the prescribed permeability for liners. Regular inspection of construction and testing of liner permeability and compaction characteristics during construction. Proper control and supervision during the placement of synthetic liners, and testing after completion.
Design and construction phase
Construction camp and temporary infrastructure such as workshops, wash bays. fuel storage and distribution point etc.
Soil, groundwater and surface water contamination
Proper management of all construction material storage area and bunding of facilities where required.
Leachate generation control and management
Soil, Surface and groundwater contamination
Minimize leachate generation through proper landfill management and control of ratio between liquid and solid waste disposed in each cell. Proper control of leachate seepage and collection thereof and diverting to properly designed holding and/or treatment facility.
Leachate holding dams Surface and groundwater contamination
Approved designed and constructed leachate holding dams.
Waste storage areas (temporary storage, recycling facilities, storage for incineration, etc.
Soil, Surface and groundwater contamination
Bunding of all storage facilities and disposal of all effluent collected in bunded area to leachate or storm water holding dams.
Approved sewage disposal system suitable for the local soil conditions
Surface and groundwater contamination
Properly designed and constructed according to building regulations of all sewage disposal systems on site and regular removal of sewage from tank to prevent overflow..
Runoff and storm water management on and around site
Surface and groundwater contamination
Proper storm water control and drainage canals around disposal area, together with storm water control dams with sufficient capacity to support a 1:50 year rainfall event. Monitoring programme for storm water quality and disposal of storm water to be in place.
Washing areas (Vehicles, re-useable containers, etc)
Surface and groundwater contamination
Approved design and constructed wash bays and effluent collection and disposal systems.
Operational phase
Workshops Surface and groundwater contamination
All workshop waste to be disposed of in accordance to regulations.

37
Closure/capping of individual waste disposal cells
Uncontrolled leachate generation and seepage, build-up of leachate level
Proper capping of each cell and regular maintenance of capping according to permit conditions to avoid infiltration of rainwater and thus leachate generation within the waste pile. Installation of leachate level monitoring facility for each cellmonitoring point
Treating/disposal of surplus leachate and storm water in holding dams at final closure
Contamination of ground and surface water resources
Treating and/or proper disposal of final leachate volumes and draining of holding dams.
Maintenance of storm water control systems
“Soil” and waste pile erosion after closure
Development and implementation of a storm water management plan as well as the proper maintenance of storm water control systems on site after closure according to permits and regulations issued from time to time by relevant authorities. Regular inspections by authorities.
Decommissioning phase
Maintenance of water monitoring systems (boreholes and surface water) and programme
Quality deterioration of water resources
Regular water quality monitoring according to permit conditions and in compliance to Minimum Requirement documents of DWAF. Reporting of results to the authorities on a six monthly basis.

38
• The deep artesian aquifer associated with the Table Mountain Group sediments, is
well protected from any contamination by the thick succession of Uitenhage Group
sediments. That the latter sediments form an effective barrier to groundwater flow is
illustrated by the artesian nature of the deeper aquifer.
• The site is situated close to a local surface water divide and none of the drainage
lines at or upstream of the site represent perennial flow conditions.
• The WASP analysis, which takes into consideration a number of geological,
geohydrological, water use and design criteria, also indicated that the site can be
classified as “suitable”
• No geological or geohydrological conditions within the study can be regarded as “fatal
flaws” according to the definitions described in the DWAF guideline documents.

39
REFERENCES
BOHLWEKI ENVIRONMENTAL SERVICES (PTY) LTD. (2003). Footprint Ranking Report for
the Proposed Regional Hazardous Waste Processing Facility in the Eastern Cape.
Bohlweki Environmental Services (Pty) Ltd., Midrand.
BUSH, R A (1985). A geohydrological assessment of the Kruisrivier / Bethelsdorp Systems,
Uitenhage. Technical Report Gh 3458, Directorate of Geohydrology, Dept. of Water
Affairs, Pretoria.
COUNCIL FOR GEOSCIENCE, SOUTH AFRICA (2000). Geological Map Sheets 3325DC
and DD, Port Elizabeth, 3325 CD and 3425 AB Uitenhage, 3325 CB Uitenhage North
and 3325 DA Addo (Scale 1:50 000). Council for Geoscience, Pretoria.
DEPARTMENT OF WATER AFFAIRS AND FORESTRY (1998). Waste Management
Series. Minimum Requirements for Waste Disposal by Landfill. Second edition,
DWAF, Pretoria.
DEPARTMENT OF WATER AFFAIRS AND FORESTRY (2005a). Waste Management
Series. Minimum Requirements for Waste Disposal by Landfill. Draft Third edition,
DWAF, Pretoria.
DEPARTMENT OF WATER AFFAIRS AND FORESTRY (2005b). Waste Management
Series. Minimum Requirements for Water Monitoring at Waste Management
Facilities. 3rd edition, DWAF, Pretoria.
DEPARTMENT OF WATER AFFAIRS AND FORESTRY (1956). Water Act , Act 54 of 1956.
DWAF, Pretoria.
DEPARTMENT OF WATER AFFAIRS AND FORESTRY (1998). National Water Act No 36
of 1998. DWAF, Pretoria.
GEOLOGICAL SURVEY, SOUTH AFRICA (1989). Geological Map Sheet 3324 Port
Elizabeth (1:250 000). Geol. Surv., Pretoria.
GODFREY, L., MEYER, R., CONRAD, J., SILINGA, A AND HUGHES, S. (2000). Report on
the Identification of potentially suitable areas for the development of the proposed
regional, general and hazardous waste processing facility within the Eastern Cape. A
GIS Approach. Division of Water, Environment and Forestry Technology, CSIR,
Confidential Report No. ENV-P-C 2000-024, March 2000.
GODFREY, L., AND MEYER, R. (2000A). Report on the preliminary identification of farms
for the development of a regional, general and hazardous waste processing facility
within the Eastern Cape. Division of Water, Environment and Forestry Technology,
CSIR, Confidential Report no: ENV-P-C 2000-051, May 2000.
40
GODFREY, L., AND MEYER, R. (2000B). Report on the selection of the most suitable farms
for the development of a regional, general and hazardous waste processing facility
within the Eastern Cape. Based on a pre-feasibility assessment of geohydrological
and geological criteria, transport logistics and fauna and flora. Preliminary
identification of farms for the development of a regional, general and hazardous
waste processing facility within the Eastern Cape. Division of Water, Environment
and Forestry Technology, CSIR, Confidential Report no: ENV-P-C 2000-059, August
2000.
HARTNADY, C H J (1990). Seismicity and plate boundary evolution in south-eastern Africa.
South African Journal of Geology, 93, pp. 473-484.
HATTINGH, J AND GOEDHART, M L (1997). Neotectonic control on drainage evolution in
the Algoa Basin, South-eastern Cape Province, South African Journal of Geology,
100, pp. 43-52.
JONES AND WAGENER (2008a). Geotechnical site investigation. Detailed geotechnical
investigation of the Grassridge site. Report No. 15/08/B494. Jones & Wagener,
Rivonia.
JONES & WAGENER (2008b). Draft Operating Manual for the proposed Hazardous Waste
Disposal Facility”. Report No. JW50/08/B494 prepared by for the Coega Development
Corporation.
LE ROUX, F G (2000). The geology of the Port Elizabeth-Uitenhage area. Explanation of
Sheets 3325DC and DD, Port Elizabeth, 3325 CD and 3425 AB Uitenhage, 3325 CB
Uitenhage North and 3325 DA Addo. Council for Geoscience, Pretoria.
MACLEAR, L G A (1994). A groundwater hydrocensus and water quality investigation of the
Swartkops River basin – Uitenhage. Technical Report Gh 3817, Directorate of
Geohydrology, Department of Water Affairs and Forestry, Pretoria.
MACLEAR, L G A (2001). The hydrogeology of the Uitenhage Artesian Basin with reference
to the Table Mountain Group Aquifer. Water SA, 27(4), 499-506.
MARAIS, A J AND SNYMAN, C H (1965). ‘n Geologies-Geofisiese ondersoek van die
Uitenhage Artesiese Kom. Department of Water Affairs and Forestry, Technical
Report G1516, Pretoria.
MEYER, P S (1998). An explanation of the 1:500 000 General Hydrogeological Map Port
Elizabeth 3324. Department of Water Affairs and Forestry, Pretoria.
MEYER, R (2004). Report on proposed new regional hazardous waste site for Coega and
the Eastern Cape. – EIA Phase 1. The identification and evaluation of four proposed
and potentially suitable areas for the development of a new waste site.

41
Geohydrological Specialist report. Confidential CSIR report Number ENV-P-C
2004/021.
MEYER, R (2007). The identification and evaluation of three potentially suitable areas for
the development of a new waste disposal facility north of Port Elizabeth. Confidential
CSIR Report Number CSIR/NRE/WR/ER/2007/0073/C.
MIDGLEY, D C, PITMAN, W V AND MIDDLETON, B J (1994). Surface water resources of
South Africa 1990. Volume V, Book of Maps. Water Research Commission Report
No. 298/5.1/94.
MIDGLEY, D C, PITMAN, W V AND MIDDLETON, B J (1994). Surface water resources of
South Africa 1990. Volume V, Appendices. Water Research Commission Report No.
298/5.2/94.
PARSONS, R (1983). A Geohydrological Investigation of the Coegakop Area of the
Uitenhage Artesian Area. Unpublished BSc (Hons.) Thesis, Dept. of Geography,
Rhodes University, Grahamstown.
PARSONS, R (1995). A South African Aquifer System Management Classification. Water
Research Commission Report No KV77/95, Water Research Commission, Pretoria.
PARSONS, R AND JOLLY, J (1994). A systematic method for evaluating site suitability for
waste disposal based on geohydrological criteria. Water Research Commission
Report No. TT67/94, Water Research Commission, Pretoria.
SABS (2006). South African Standard: Drinking Water. SABS 241-2006, Edition 6.1.
Standards South Africa, South African Bureau of Standards, Pretoria.
TOERIEN, D K AND HILL, R S (1989). The geology of the Port Elizabeth area. Explanation:
Sheet 3324 (1:250 000). Geological Survey of South Africa, Pretoria.
VENABLES, A G (1985). The geology, geohydrology and hydrochemistry of the Uitenhage-
Coega Artesian System. Department of Water Affairs and Forestry Technical Report
Gh3437, Pretoria.
WEATHER BUREAU (1984). Climate of South Africa. Climate Statistics up to 1984. Report
WB 40, Weather Bureau, Pretoria.
WIID, B L (1991). Report on the Ground and Geohydrological Conditions with Specific
Reference to the Extended Monitoring System at the Wells Estate (Aloes and
Martins) Disposal Sites, Port Elizabeth. Confidential and Unpublished Report, B L
Wiid, Consulting Engineering Geologist, Pretoria.
WINTER, H DE LA R (1973). Geology of the Algoa Basin South Africa. In Sedimentary
Basins of the African coasts, 2nd Part, South and East Coast, (G Blant, ed.), Assoc.
Afr. geol. Survs., Paris, p. 17-48.

42
APPENDIX A
GEOPHYSICAL REPORT BY EEGS

43

44

45

46

47
APPENDIX B
GEOLOGICAL DESCRIPTIONS OF NEW BOREHOLES
(GR190/6 to GR190/9)

48

49

50

51

52

53

54

55
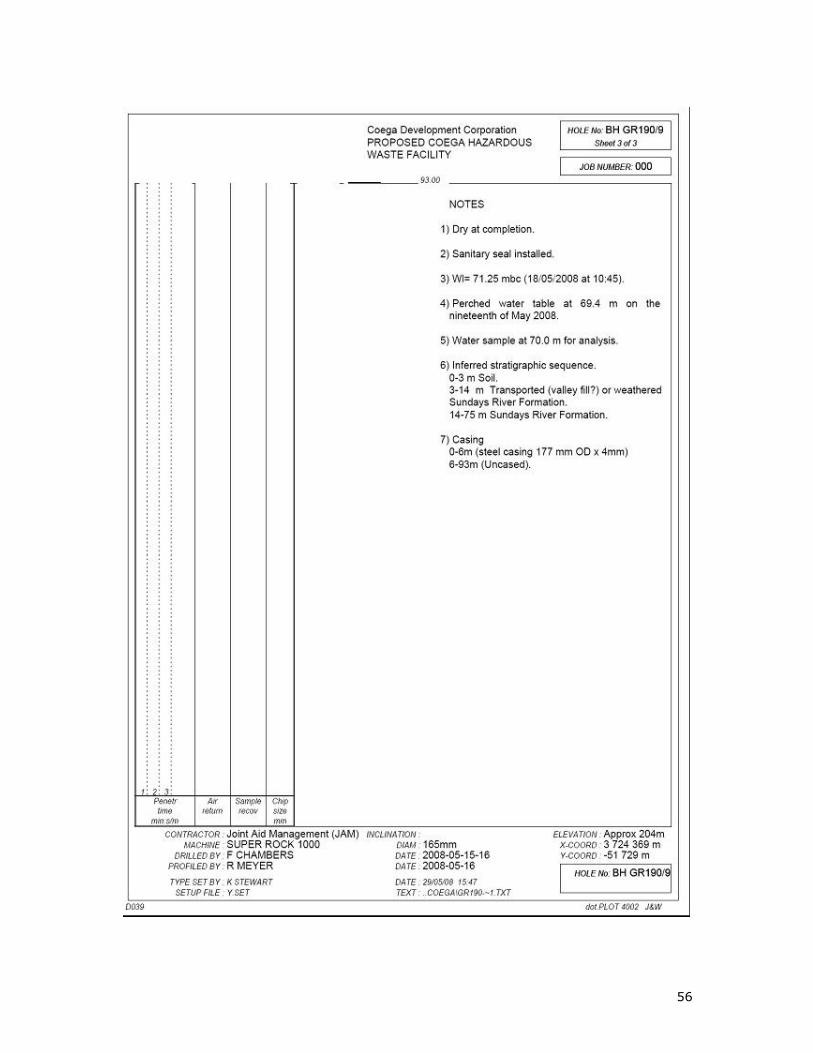
56

57
APPENDIX C
WASP INDEX

58
WASP DATA SHEET
NAME OF SITE : Grassridge 190, Coega OWNER: PPC : Local Authority
TOWN : Port Elizabeth
SPECIAL FEATURES
COMMENTS
NAME OF ASSESSOR
:
:
:
:
: R Meyer
DATE
: May 2008
THREAT FACTOR
Designed Final Area (ha)
Type of Waste
THREAT FACTOR SCORE:
: 25 (Phase 1)
: Hazardous
: 10
Data Reliability Rating
Data Reliability Rating
DATA RELIABILITY RATING:
: Level 1
: Level 1
: 2
BARRIER FACTORS
Layer Thickness (m) Hydraulic Conductivity
(m per day)
Porosity
(%)
Travel time
(days)
1 (dry &
slightly moist
mudstone and
siltstones)
65 (to SWL) 10-5
40 >100 000
Total >100 000 days
BARRIER FACTOR SCORE : 1.5 DATA RELIABILITY RATING : 2.0
RESOURCE FACTOR
Groundwater Usage Component Score
Groundwater Potential Component Score
Combined Groundwater Score
RESOURCE FACTOR SCORE
: 1
: 2
: 3
: 2
Data Reliability Rating
Data Reliability Rating
DATA RELIABILITY RATING
: 1.5
: 1.4
: 1
WASP INDEX
Wasp Index
Site Suitability Interpretation
: 4.5
: Suitable
Data Reliability Index:
1.3

59
APPENDIX D
CRITERIA AND DEFINITIONS USED
IN IMPACT ASSESSMENT TABLES

60
Impact Assessment Criteria and Definitions
In order to evaluate the significance of potential impacts, the following criteria and
terminology is used to identify and describe the characteristics of each potential impact:
• the nature, which shall include a description of what causes the effect, what will be
affected and how it will be affected;
• the status, which will be described as either a positive impact or a negative impact.
• the extent, wherein it will be indicated whether the impact will be local (limited to the
immediate area or site of development) or regional;
• the duration, wherein it will be indicated whether the lifetime of the impact will be of a
short duration (0–5 years), medium-term (5–15 years), long term (> 15 years) or
permanent;
• the probability, which shall describe the likelihood of the impact actually occurring,
indicated as improbable (low likelihood), probable (distinct possibility), highly probable
(most likely), or definite (impact will occur regardless of any preventative measures);
• the severity/beneficial scale: indicating whether the impact will be very
severe/beneficial (a permanent change which cannot be mitigated/permanent and
significant benefit, with no real alternative to achieving this benefit), severe/beneficial
(long-term impact that could be mitigated/long-term benefit), moderately
severe/beneficial (medium- to long-term impact that could be mitigated/ medium- to long-
term benefit), slight or have no effect; and
• the significance, which shall be determined through a synthesis of the characteristics
described above and can be assessed as low, medium or high.