Embed Size (px)
Citation preview
GEOLOGICAL ASSESSMENT OF PETROLEUM RESOURCES IN EASTERN PARTS OF BARENTS SEA NORTH 2017
2
GEOLOGICAL ASSESSMENT OF PETROLEUM RESOURCES IN EASTERN PARTS OF BARENTS SEA NORTH 2017
CONTENTS
Foreword 3Introduction and summary 4Petroleum activity in the Norwegian sector of the Barents Sea 7The data basis 9Structural and stratigraphic overview of Barents Sea North 11 Stratigraphic description 15Petroleum geology 24Plays 28 Play analysis – method for calculating possible petroleum resources 28 Early Carboniferous (Tournaisian, Visean and Serpukhovian) play 30 Late Carboniferous-Permian (Bashkirian-Guadalupian) play 31 Early Triassic (Induan) play 32 Early-Middle Triassic (Olenekian, Anisian and Ladinian) play 33 Late Triassic (Carnian-Norian) play 34 Early-Middle Jurassic play 35Resource evaluation 36Summary and conclusion 39
GEOLOGICAL ASSESSMENT OF PETROLEUM RESOURCES IN EASTERN PARTS OF BARENTS SEA NORTH 2017

3
GEOLOGICAL ASSESSMENT OF PETROLEUM RESOURCES IN EASTERN PARTS OF BARENTS SEA NORTH 2017
Foreword
Maintaining an overview of petroleum resources across the whole Nor-wegian continental shelf (NCS) is one of the duties of the Norwegian Petro-leum Directorate (NPD).
The NPD therefore works to map possible petroleum resources in both opened and unopened areas of the NCS in order to secure a good factual basis for future decisions. This work is entrenched in the letter of allocation to the NPD – the section dealing with working for long-term resource availability – and the directorate’s strategic plan for 2016-20 on mapping and promoting the resources.
Attention in recent years has concentrated primar-ily on acquiring data from Barents Sea North and Barents Sea North-East, along the boundary with the Russian sector. Activities in the summer of 2015 in-cluded shallow drilling east and north of Kvitøya. Re-sults from this work will be important for understand-ing the geology and resource potential in Barents Sea North, including the area along the boundary with Russia.
Based on new and existing data, the NPD has mapped the area in eastern parts of Barents Sea North and estimated its resource potential. A number of analyses of the shallow drilling results remain to be completed, and work is continuing to achieve an even better understanding of the geology in Barents Sea North. Although seismic surveys have been ac-quired during several seasons, the seismic data base still remains limited.
Given current knowledge, the main conclusions are that the area has a substantial upside in terms of re-sources and value. The evaluation shows interesting structures and possible petroleum accumulations of considerable size, which mean that the NPD wants to continue mapping the area and increasing its knowl-edge.
Future petroleum activity in Barents Sea North will naturally be pursued in accordance with the Petro-leum Act and within the parameters specified by the management plan for the Barents Sea.
It is important to emphasise that no exploration wells have been drilled in Barents Sea North. Such drilling will be needed to prove possible petroleum resourc-es.
This document is not a scientific report, but a presen-tation of the geological assessments which form the basis for the resource evaluation. The main features of the geology and the NPD’s resource estimates, which reflect the level of uncertainty, are described.
Sissel EriksenDirector of exploration
4
GEOLOGICAL ASSESSMENT OF PETROLEUM RESOURCES IN EASTERN PARTS OF BARENTS SEA NORTH 2017
* By comparison, the Norwegian sector of the North Sea covers about 160 000 square kilometres.
INTRODUCTION AND SUMMARY
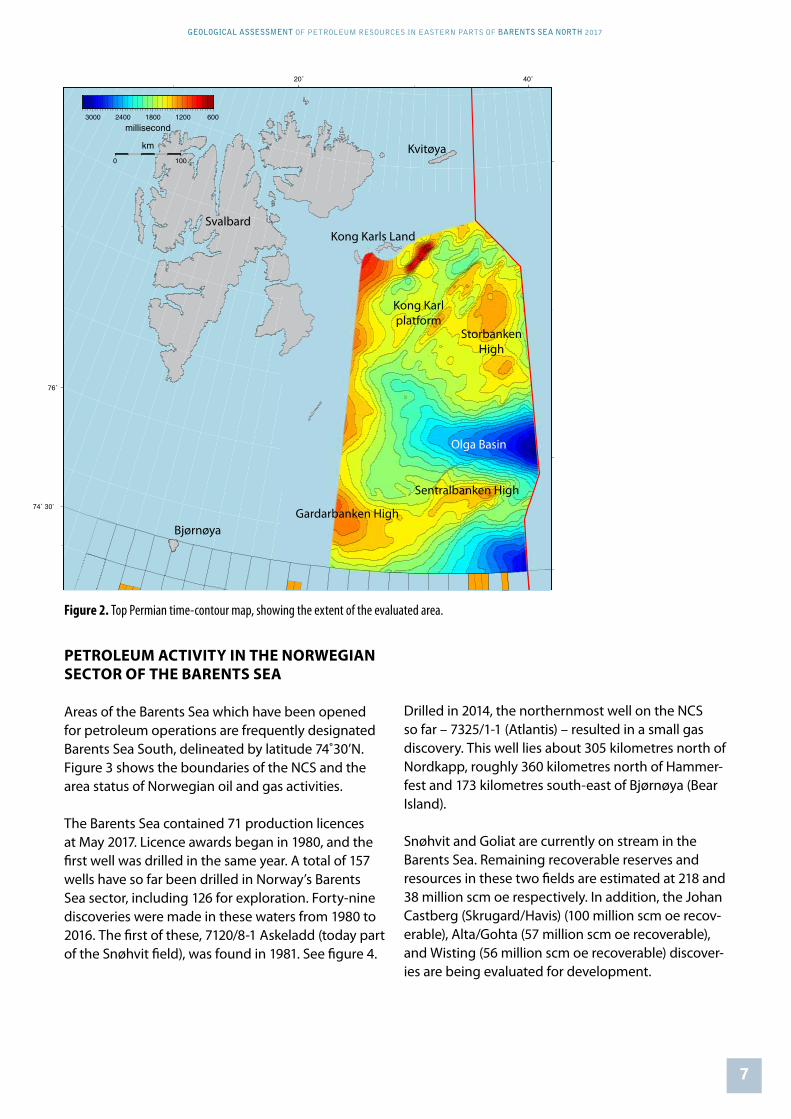
The NPD has worked since 2012 on mapping Nor-way’s continental shelf in the eastern part of Barents Sea North. See figures 1 and 2. This area has not been opened for petroleum activities, and is defined by the boundary line to the east, 74°30’N to the south, 25°E to the west, and Edgeøya and Kong Karls Land to the north-west and north respectively – an area of about 170 000 square kilometres.*
New two-dimensional seismic data acquired in the 2012-14 seasons and 2D seismic lines shot between 1973 and 1996 have been used in the mapping work. Use has also been made of geological information acquired from shallow drilling in the area, and of data from several seasons of fieldwork in Svalbard.
The resource potential of the evaluated area has been assessed on the basis of critical sub-surface factors. An estimate has been produced for undiscov-ered resources in plays which represent the various identified reservoir levels. These plays have been as-sessed on the basis of geological risk and uncertainty considerations for parameters of risk and volume/fluids respectively.
A number of the plays in the eastern part of Barents Sea North have also been mapped in Barents Sea South. Clear differences nevertheless exist, related particularly to the assessment of the hydrocarbon phase. Potential oil generation from Triassic source rocks (the Steinkobbe/Botneheia Formation) could in-crease the probability of oil compared with analogue plays in Barents Sea South. Mapping shows that the potential exists for a number of very large geological structures which are prominent at several geological levels, principally on the Storbanken high, the Sentr-
albanken high and the Kong Karl platform. In addition to the largest structures identified, a potential exists for many more – both large and small – at the various geological levels.
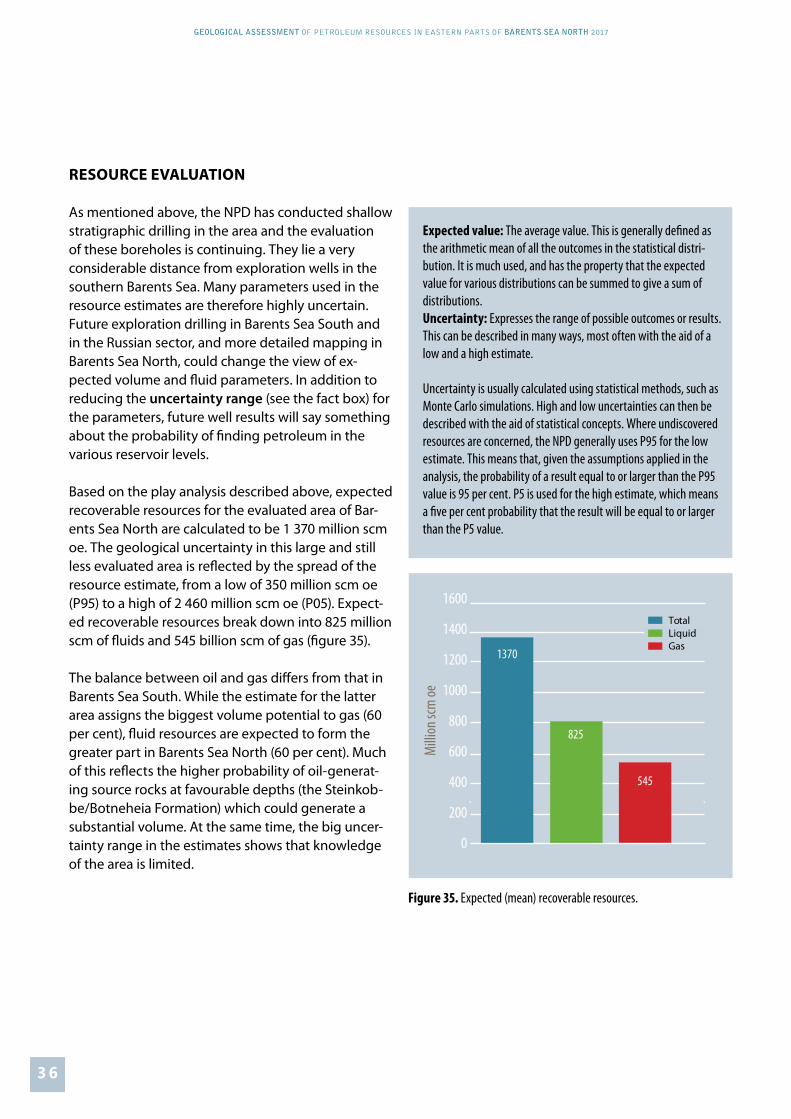
Plays have been aggregated to obtain an estimate of total undiscovered resources in the area. Expected recoverable resources for the eastern part of Barents Sea North are estimated at 1 370 million standard cubic metres of oil equivalent (scm oe), with a downside of 350 million scm oe (P95) and an upside of 2 460 million scm oe (P05). The expected recoverable resources break down between 825 million scm oe of fluids and 545 billion scm oe of gas.
The geological and geophysical database for the large area evaluated here does not have the same scope and quality as for Barents Sea South and other parts of the NCS. Great uncertainty therefore attaches to the NPD’s calculations of the undiscovered resources. This is reflected in the difference between the high (P05) and low (P95) resource estimates. Based on experience from other petroleum provinces, the view of prospectivity could change considerably with increased data avail-ability, and the range – or uncertainty – in the resource and value calculations will be reduced by additional information. Drilling wells remains the only way to confirm the plays which form the basis for the resource estimates.
This report presents the geological assessments on which the resource evaluation builds. That will docu-ment the factual basis for decisions to be taken, while ensuring that specialists are familiar with the methods used as well as the interpretations and assumptions made.
5
GEOLOGICAL ASSESSMENT OF PETROLEUM RESOURCES IN EASTERN PARTS OF BARENTS SEA NORTH 2017

6
GEOLOGICAL ASSESSMENT OF PETROLEUM RESOURCES IN EASTERN PARTS OF BARENTS SEA NORTH 2017
Barents Sea
Norwegian Sea
North Sea
Arctic Ocean
Open for petroleum activity
Assumed maximum extent of sedimentaryrocks which may contain petroleum
Boundary NCS
˚06˚04˚02˚0˚02−˚04−
52˚
56˚
60˚
64˚
Evaluated area
Figure 1. Overview of the NCS, which areas have been opened for petroleum activities and the area evaluated.
7
GEOLOGICAL ASSESSMENT OF PETROLEUM RESOURCES IN EASTERN PARTS OF BARENTS SEA NORTH 2017
PETROLEUM ACTIVITY IN THE NORWEGIAN SECTOR OF THE BARENTS SEA
Areas of the Barents Sea which have been opened for petroleum operations are frequently designated Barents Sea South, delineated by latitude 74˚30’N. Figure 3 shows the boundaries of the NCS and the area status of Norwegian oil and gas activities.
The Barents Sea contained 71 production licences at May 2017. Licence awards began in 1980, and the first well was drilled in the same year. A total of 157 wells have so far been drilled in Norway’s Barents Sea sector, including 126 for exploration. Forty-nine discoveries were made in these waters from 1980 to 2016. The first of these, 7120/8-1 Askeladd (today part of the Snøhvit field), was found in 1981. See figure 4.
Drilled in 2014, the northernmost well on the NCS so far – 7325/1-1 (Atlantis) – resulted in a small gas discovery. This well lies about 305 kilometres north of Nordkapp, roughly 360 kilometres north of Hammer-fest and 173 kilometres south-east of Bjørnøya (Bear Island).
Snøhvit and Goliat are currently on stream in the Barents Sea. Remaining recoverable reserves and resources in these two fields are estimated at 218 and 38 million scm oe respectively. In addition, the Johan Castberg (Skrugard/Havis) (100 million scm oe recov-erable), Alta/Gohta (57 million scm oe recoverable), and Wisting (56 million scm oe recoverable) discover-ies are being evaluated for development.
6001200180024003000
millisecond
0 100
km
20˚ 40˚
76˚
Svalbard
Bjørnøya
Kvitøya
StorbankenHigh
Kong Karlplatform
Kong Karls Land
Gardarbanken High
Sentralbanken High
Olga Basin
Figure 2. Top Permian time-contour map, showing the extent of the evaluated area.

8
GEOLOGICAL ASSESSMENT OF PETROLEUM RESOURCES IN EASTERN PARTS OF BARENTS SEA NORTH 2017
Figure 3. Area status at May 2017.
Figure 4. Areas of Barents Sea South opened for petroleum activities, fields on stream (Snøhvit and Goliat), discoveries in the evaluation phase, and the northernmost exploration wells.
0˚ ˚04˚02 60˚
68˚
72˚
76˚
TromsøVadsø
0˚ ˚04˚02 60˚
68˚
72˚
76˚
Melkøya
Production licence current
Boundary NCS
Discoveries and �elds
0 75
km
Bjørnøya
7220/8-1 & 7220/7-1 Johan Castberg
7324/8-1 Wisting
7325/1-1 Atlantis
7220/11-1 Alta
7120/1-3 Gohta
Snøhvit
Goliat
0˚ ˚04˚02 60˚
68˚
72˚
76˚
TromsøVadsø
0˚ ˚04˚02 60˚
68˚
72˚
76˚
Melkøya
Aktive utvinningstillatelser
Grense, norsk sokkel
Funn og felt
0 75
km
Bjørnøya
7220/8-1 & 7220/7-1 Johan Castberg
7324/8-1 Wisting
7325/1-1 Atlantis
7220/11-1 Alta
7120/1-3 Gohta
Snøhvit
Goliat
0˚ ˚04˚02 60˚
68˚
72˚
76˚
TromsøVadsø
0˚ ˚04˚02 60˚
68˚
72˚
76˚
Melkøya
Aktive utvinningstillatelser
Grense, norsk sokkel
Funn og felt
0 75
km
Bjørnøya
7220/8-1 & 7220/7-1 Johan Castberg
7324/8-1 Wisting
7325/1-1 Atlantis
7220/11-1 Alta
7120/1-3 Gohta
Snøhvit
Goliat
70°60°50°40°
30°
30°
20°
20°
10°
10°
0°
0°-10°-20°-30°-40°-50°
80°
75°
70°
70°65°
65°
60°
60°
55°
npd1255
Greenland
RussiaSweden
Norway
Iceland
Denmark
Faeroe Islands
Svalbard
Jan Mayen
Finland
NORTH SEA
BARENTS SEA
ARCTIC OCEAN
NORWEGIAN SEA
Open for petroleum activity
Open, special schemes, see WP no 28 (2010-11)
Awards in predefined areas (APA) - 2017
Assumed maximum extent of sedimentary
rocks which may contain petroleum
Limits of the NCS according to the
the UN Convention on the Law of the Sea

9
GEOLOGICAL ASSESSMENT OF PETROLEUM RESOURCES IN EASTERN PARTS OF BARENTS SEA NORTH 2017
DATABASE
SEISMIC DATAThe NPD has used both new and older data sets in mapping eastern parts of Barents Sea North. It ac-quired some 70 000 kilometres of 2D seismic lines in Barents Sea North during 1973-96. While the quality of many older data sets is poor, they can provide useful and complementary information when com-bined with new surveys. The NPD acquired 32 600 kilometres of new 2D seismic data in the area during 2012, 2013 and 2014, primarily in the eastern part (figure 5). It also acquired some 6 000 kilometres of 2D seismic in 2016. Processing of these data had not been completed at the time of writing, but they will be incorporated in the continued evaluation.
While the quality of the new data sets is considerably better than the previously, limitations remain with the seismic resolution in the deeper parts of the sed-imentary basins. Seismic multiples from the seabed and other noticeably hard reflectors in the sedimen-tary succession also present mapping challenges. Data quality is generally poorer towards the west, often related to water depth and to which geological strata outcrop at the seabed. The mapped area in re-lation to data coverage is shown in figure 5. The area is bounded towards the west by poorer data quality, and towards the north where the sedimentary basins thin out.
The line coverage of the new data sets varies, but generally decreases towards the west.
Coverage is about 4 by 10 kilometres east of the 32nd meridian, and averages roughly 15 by 20 kilometres in the remainder of the mapped area after the 2016 survey. In the western parts of Barents Sea North, currently excluded from the resource calculation, line coverage of the new seismic data is roughly 45 by 45 kilometres.
Uncertainty exists over the dating of the various seis-mic reflectors. Many geological strata are significantly eroded, and wells in Barents Sea South are a consid-
erable distance away. The nearest is 7325/1 (Atlantis). The age of the interpreted reflectors largely builds on cores obtained by shallow stratigraphic drilling (see the fact box) in Barents Sea North (during certain seasons from 1990 to 2015). Coring is conducted where seismic reflectors crop out at the seabed. Shallow cores have been acquired from large parts of the succession from the Middle Triassic to the Lower Cretaceous in Barents Sea North. These have been used to correlate with Mesozoic deposits in other parts of the Arctic, and have contributed to increased understanding of regional geological development. Accurate dating of the cores provides significantly more control for dating the various seismic reflectors than before.
SHALLOW STRATIGRAPHIC DRILLINGShallow drilling is used to acquire data on the sedi-mentary strata. Measuring five to seven centimetres in diameter, cores provide information on rock type and sedimentary structures. They can also provide a basis for indicating the potential of the strata to work as source, reservoir or cap rocks. The cores provide a good basis for regional correlation and increased un-derstanding of geological developments. The length of this type of well is limited to 200 metres beneath the seabed.
Year acquired Total km
2012 (NPD1204) 13 805
2013 (NPD1301) 13 280
2014 (NPD14001) 5710
2016 (NPD16001) 5820
Total 38 610
Table 1. Overview of more recent seismic surveying in the area.

1 0
GEOLOGICAL ASSESSMENT OF PETROLEUM RESOURCES IN EASTERN PARTS OF BARENTS SEA NORTH 2017
SHALLOW WELLSShallow boreholes are defined in Section 2 of the Resource Man-agement Regulations: Holes drilled in order to acquire informa-tion on the properties of the rock and/or to conduct geotechnical surveysto determine the location of facilities, and which are not drilled to prove or delimit a petroleum deposit or to produce or inject petroleum, water or other medium.
In reality, the definition includes two types of boreholes that are regulated by different provisions:
1. For route surveys and other soil surveys, boreholes can be drilled to study the subsurface before a facility is placed. These boreholes cannot be drilled deeper than 200 metres below the seabed, cf. Section 30 of the Petroleum Regulations.
2. When exploring for petroleum, “shallow drillings” can be carried out, cf. Section 4 of the Petroleum Regulations. These are boreholes that are drilled to acquire data on geologi-cal development of the rocks to explore for petroleum. In addition to the information on the geology at the drill site, the information can be linked with seismic data to calibrate seismic reflectors against geological units and to depth-con-vert seismic data. These boreholes previously had a depth restriction of 200 metres, but the Norwegian Petroleum Directorate (NPD) can now stipulate the depth. For drilling deeper than 200 metres below the seabed, an application for consent must be submitted to the Petroleum Safety Authority Norway, in addition to registration of the borehole with the NPD, cf. Section 25 of the Management Regulations.
Figure 5. Data coverage in Barents Sea North. The white polygon delineates the mapped area. Shallow boreholes are marked.
20˚ 40˚
76˚
0 100
km
Stratigraphic wellbores
Boundary NCS
NPD16001
NPD14001
NPD1301
NPD1204
NPD−BA−11 & NPD1201
Acq. before 2011

1 1
GEOLOGICAL ASSESSMENT OF PETROLEUM RESOURCES IN EASTERN PARTS OF BARENTS SEA NORTH 2017
STRUCTURAL AND STRATIGRAPHIC OVER-VIEW OF BARENTS SEA NORTH
The Barents Sea is divided into geological basins, platforms and highs, collectively designated struc-tural elements (figure 6). This region contains a more or less continuous succession from the Upper Palae-ozoic to the Eocene. In the mapped eastern part of Barents Sea North, the succession has been eroded from the Upper Cretaceous, and the Quaternary sed-imentary package is very thin. Triassic strata outcrop on the largest highs.
MAIN STRUCTURAL ELEMENTSThe north-easterly orientation of the basins and highs in Barents Sea South, the anticlines on the Kong Karl platform and the Storbanken high, and much of the Sentralbanken high are assumed to be controlled pri-marily by the reactivation of older zones of weakness. Important tectonic events which affected the eastern parts of Barents Sea North are summarised in figure 13. During the Late Palaeozoic and Mesozoic, this part
Figure 6. Map of the main geological struc-tural elements in the Norwegian sector of the Barents Sea. It is worth noting that the structural elements in Barents Sea North have yet to be formally approved by the Norwegian Committee on Stratigraphy. Structural elements mentioned in the text are named on the map. The yellow line shows the location of the geoseismic profile presented in figure 7. The area opened for petro-leum activities in Barents Sea South is shown by quadrants.
Melkøya
Sentralbanken high
Haapet Dome
SVALBARD
Bjørnøya
Nordkapp Basin
Hopen
Finnmark Platform
Olga basin
Kong Karls Land
Spitsbergen
EdgeøyaStorbankenhigh
KvitøyaNordaust-landet
Bjarmeland Platform
Kong Karl platform
76o
74o
20o 40o
Cretaceous High
Deep Cretaceous Basin
Palaeozoic High in Platform
Platform
Pre-Jurassic Basin in Platform
Shallow Cretaceous Basin in Platform
Terraces and Intra-Basinal Elevations
Volcanics
Kritthøyde
Dypt krittbasseng
Paleozoisk høyde
Plattform
Paleozoisk basseng
Grunt krittbasseng
Terasser og intra-bassenghøyder
Vulkanitter
of the Barents Sea was a relative quiet area in tectonic terms.
1 2
GEOLOGICAL ASSESSMENT OF PETROLEUM RESOURCES IN EASTERN PARTS OF BARENTS SEA NORTH 2017
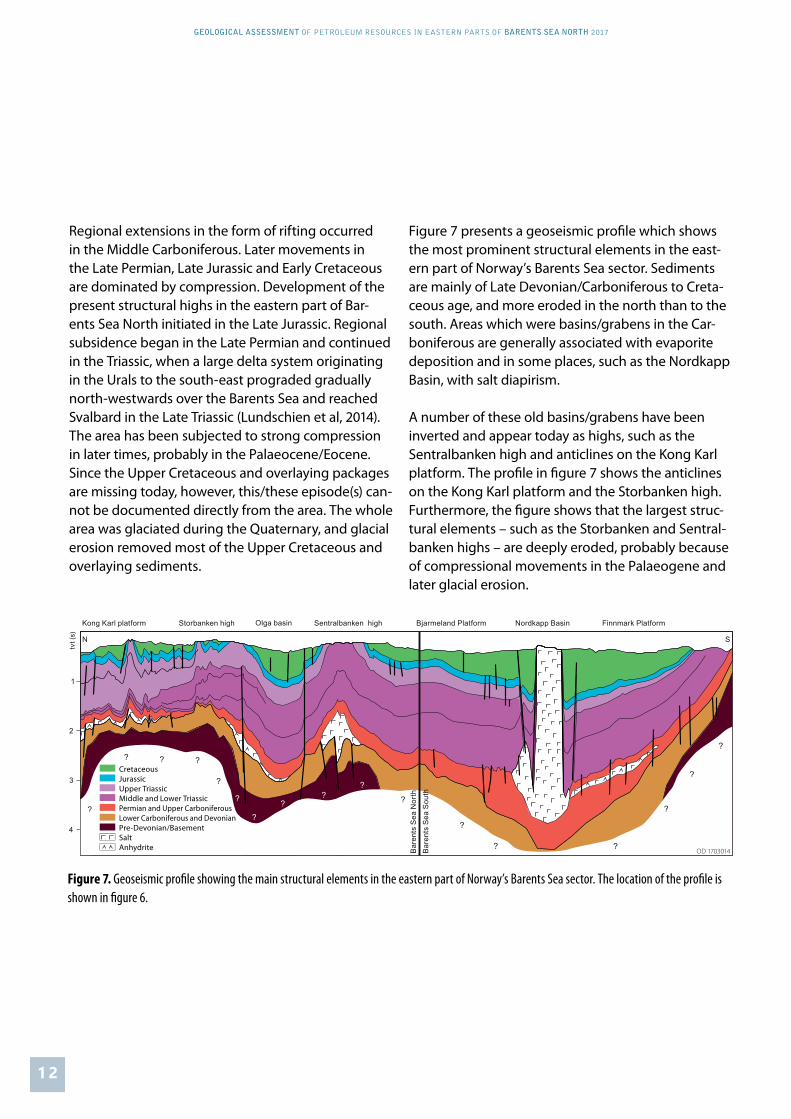
Regional extensions in the form of rifting occurred in the Middle Carboniferous. Later movements in the Late Permian, Late Jurassic and Early Cretaceous are dominated by compression. Development of the present structural highs in the eastern part of Bar-ents Sea North initiated in the Late Jurassic. Regional subsidence began in the Late Permian and continued in the Triassic, when a large delta system originating in the Urals to the south-east prograded gradually north-westwards over the Barents Sea and reached Svalbard in the Late Triassic (Lundschien et al, 2014). The area has been subjected to strong compression in later times, probably in the Palaeocene/Eocene. Since the Upper Cretaceous and overlaying packages are missing today, however, this/these episode(s) can-not be documented directly from the area. The whole area was glaciated during the Quaternary, and glacial erosion removed most of the Upper Cretaceous and overlaying sediments.
Figure 7 presents a geoseismic profile which shows the most prominent structural elements in the east-ern part of Norway’s Barents Sea sector. Sediments are mainly of Late Devonian/Carboniferous to Creta-ceous age, and more eroded in the north than to the south. Areas which were basins/grabens in the Car-boniferous are generally associated with evaporite deposition and in some places, such as the Nordkapp Basin, with salt diapirism.
A number of these old basins/grabens have been inverted and appear today as highs, such as the Sentralbanken high and anticlines on the Kong Karl platform. The profile in figure 7 shows the anticlines on the Kong Karl platform and the Storbanken high. Furthermore, the figure shows that the largest struc-tural elements – such as the Storbanken and Sentral-banken highs – are deeply eroded, probably because of compressional movements in the Palaeogene and later glacial erosion.
Figure 7. Geoseismic profile showing the main structural elements in the eastern part of Norway’s Barents Sea sector. The location of the profile is shown in figure 6.
Nordkapp Basin Finnmark PlatformBjarmeland PlatformSentralbanken highOlga basinStorbanken highKong Karl platform
tvt (
s)
1
2
3
4
N S
Bar
ents
Sea
Nor
thB
aren
ts S
ea S
outh
?
? ?
?
?
?
?
???
?
?
? ?
?
?
?CretaceousJurassicUpper TriassicMiddle and Lower TriassicPermian and Upper CarboniferousLower Carboniferous and Devonian Pre-Devonian/BasementSaltAnhydrite OD 1703014

1 3
GEOLOGICAL ASSESSMENT OF PETROLEUM RESOURCES IN EASTERN PARTS OF BARENTS SEA NORTH 2017
The main structural features are illustrated below by a number of seismic profiles whose locations are presented in figure 8.
The Storbanken high is of Palaeozoic age, with a thin sedimentary package from the Upper Carboniferous to the Permian (figure 9). In its eastern part, the Sen-tralbanken high has a Palaeozoic core with a number of horst and graben structures formed in the Middle Carboniferous but covered – unlike the Storbanken high – by a thick package from the Upper Carbonif-erous to the Permian (figure 10). Large parts of the Kong Karl platform are dominated by compression anticlines, which probably reflect a reversal of older normal faults and folding located in areas of the plat-form which also contained highs during much of the Palaeozoic (figure 11). The Olga basin subsided during the Cretaceous, but was a deep basin in the Palaeo-zoic as well (figure 12).
Figure 8. Location of seismic profiles.
Figure 9. A profile across the Storbanken high. Thin packages date from the Late Carboniferous/Permian above the high, and from the Lower and Middle Triassic in the north. Upper Triassic (Carnian) sediments dominate in the north, and the whole Jurassic package is eroded. Much of the Stor-banken high looks as if it might be a basement high. Figure 8 shows the location of the profile.
14
15
16
1718
1920
25
26
21
22
23
24
10
129
11
Olga basin
Sentralbanken high
Storbanken high
OD 1704001
Kong Karl platform
1 4
GEOLOGICAL ASSESSMENT OF PETROLEUM RESOURCES IN EASTERN PARTS OF BARENTS SEA NORTH 2017
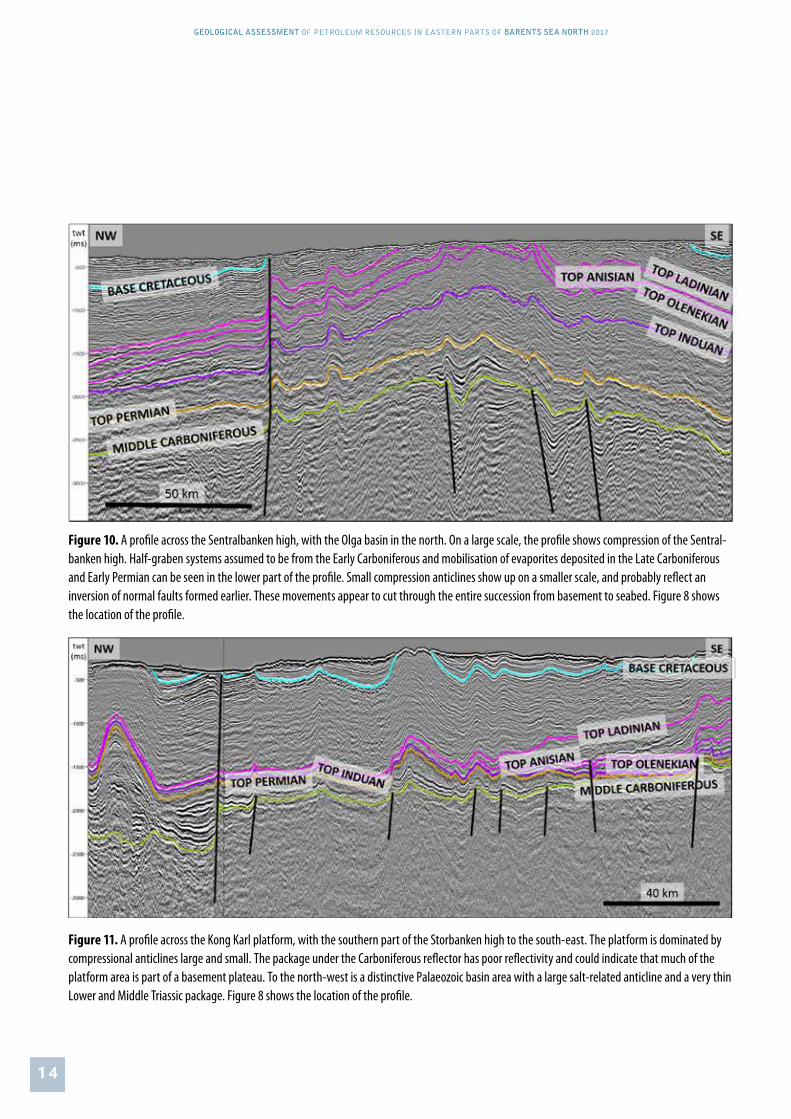
Figure 10. A profile across the Sentralbanken high, with the Olga basin in the north. On a large scale, the profile shows compression of the Sentral-banken high. Half-graben systems assumed to be from the Early Carboniferous and mobilisation of evaporites deposited in the Late Carboniferous and Early Permian can be seen in the lower part of the profile. Small compression anticlines show up on a smaller scale, and probably reflect an inversion of normal faults formed earlier. These movements appear to cut through the entire succession from basement to seabed. Figure 8 shows the location of the profile.
Figure 11. A profile across the Kong Karl platform, with the southern part of the Storbanken high to the south-east. The platform is dominated by compressional anticlines large and small. The package under the Carboniferous reflector has poor reflectivity and could indicate that much of the platform area is part of a basement plateau. To the north-west is a distinctive Palaeozoic basin area with a large salt-related anticline and a very thin Lower and Middle Triassic package. Figure 8 shows the location of the profile.

1 5
GEOLOGICAL ASSESSMENT OF PETROLEUM RESOURCES IN EASTERN PARTS OF BARENTS SEA NORTH 2017
Figure 12. A profile across the Olga basin, with the flank of the Sentralbanken high to the south and the Storbanken high to the north. The succes-sion from the upper part of the Late Jurassic and the Early Cretaceous thins out towards both highs. Clear reflectors beneath the Carboniferous show that the basin was formed in the Early Carboniferous or the Devonian. Figure 8 shows the location of the profile.
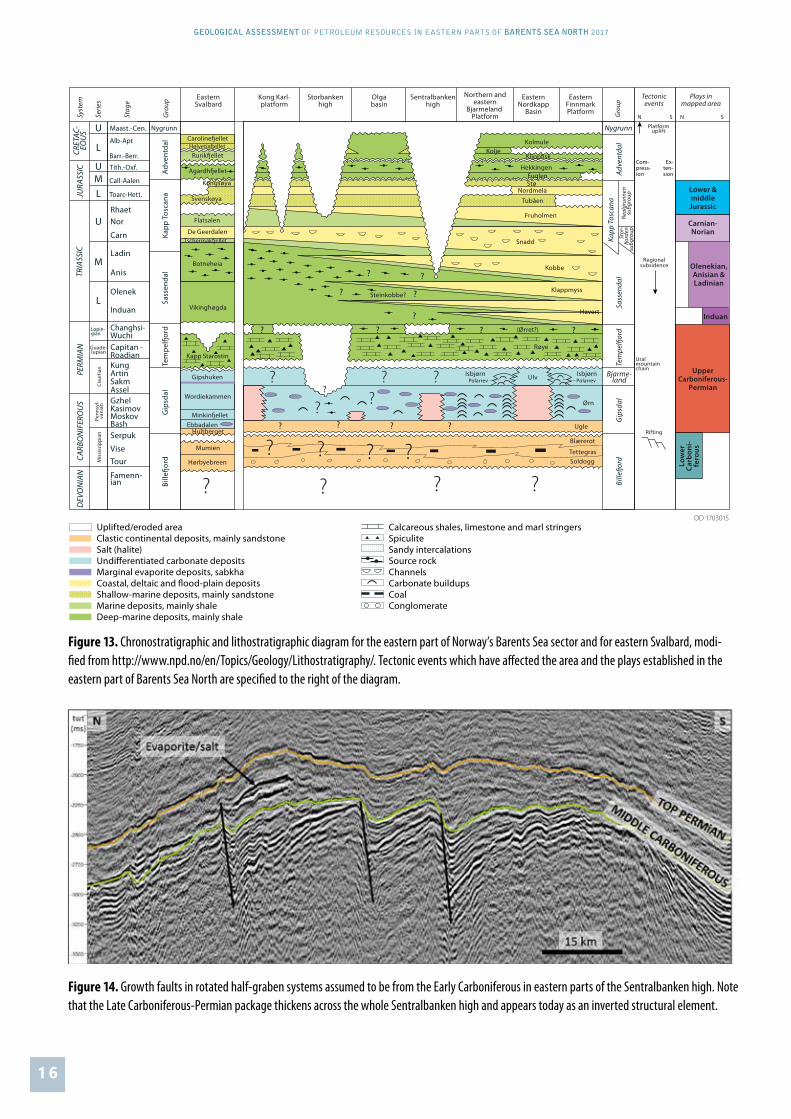
STRATIGRAPHIC DESCRIPTIONFigure 13 provides a schematic presentation of the chronostratigraphy and lithostratigraphy in the eastern part of Norway’s Barents Sea sector correlat-ed with eastern Svalbard. This correlation is based on geological information from wells in the south, shallow boreholes in the north, seismic surveying and fieldwork in Svalbard. The lithostratigraphic framework in the Barents Sea and on land in Svalbard shows great similarities, and can be divided into re-gional mappable units (groups and formations).
The sedimentary succession reflects both short-term and length variations in relative sea level and a con-stantly changing climate. Climatic variations reflect a general northwards movement for the whole area, from equatorial conditions at the Devonian-Carbon-iferous boundary to a northern temperate climate during the Palaeogene and Neogene. The sedimen-tary succession is dominated by siliciclastic rocks, but deposition of carbonate rocks dominated in the Late Carboniferous and Early Permian when the region was located in the northern dry climatic belt.
DEVONIAN AND EARLY CARBONIFEROUSDevonian rocks have not been proven by drilling in Norway’s Barents Sea sector. The development of the Devonian east of Svalbard is unknown.
During the Early Carboniferous, the Barents Sea was subject to a tectonic phase with extension and the development of rift basins. Places where growth faults associated with this rifting are clearly visible include the Sentralbanken high (figure 14).
Large thicknesses of clastic sediments, including conglomerates, have been observed in Billefjorden on Spitsbergen in a well-defined graben system from the Early Carboniferous. Coal measures have also developed here, which were exploited by the Pyra-miden mining community. Similar graben systems are found in a number of locations in Spitsbergen, where the largest are the Billefjorden, the Indre Hornsund and St Jonsfjorden troughs. Based on seismic observations from Barents Sea North, similar graben systems are also likely to be present at many places in the evaluated area (figure 15).
1 6
GEOLOGICAL ASSESSMENT OF PETROLEUM RESOURCES IN EASTERN PARTS OF BARENTS SEA NORTH 2017
OD 1703015Calcareous shales, limestone and marl stringersSpiculiteSandy intercalationsSource rockChannelsCarbonate buildupsCoalConglomerate
Uplifted/eroded areaClastic continental deposits, mainly sandstoneSalt (halite)Undi�erentiated carbonate depositsMarginal evaporite deposits, sabkha Coastal, deltaic and �ood-plain depositsShallow-marine deposits, mainly sandstoneMarine deposits, mainly shaleDeep-marine deposits, mainly shale
Kapp
Tos
cana
Sass
enda
lG
ipsd
alA
dven
tdal
Bille
�ord
Adve
ntda
lKa
pp T
osca
naSa
ssen
dal
Bille
�ord
Alb-Apt
Barr.-Berr.
Tith.-Oxf.
Nor
Carn
Ladin
Anis
Changhsi-WuchiCapitan -Roadian
GzhelKasimov
Olenek
KungArtinSakmAssel
Serpuk
Famenn-ian
ViseTour
Induan
M
M
L
L
U
U
U
CRET
AC-
EOU
SJU
RASS
ICPE
RMIA
ND
EVO
NIA
NCA
RBO
NIF
ERO
US
Rhaet
L
BashMoskov
Call-Aalen
Toarc-Hett.
Maast.-Cen.
TRIA
SSIC
Lopin-gian
Gip
sdal
Bjarme-land
Stor
-�o
rden
subg
roup
Real
grun
nen
subg
roup
? ? ?
Northern andeastern
Bjarmeland Platform
Nygrunn
EasternNordkapp
Basin
EasternFinnmarkPlatform
Sentralbankenhigh
Olgabasin
Storbankenhigh
Kong Karl-platform
EasternSvalbard
Vikinghøgda
Botneheia
Tschermak�elletDe Geerdalen
Flatsalen
Svenskøya
Kongsøya
Agardh�ellet
Rurik�ellet
Caroline�elletHelvetia�ellet
Kapp Starostin
Gipshuken
Wordiekammen
EbbadalenHultberget
Mumien
Hørbyebreen
?
Snadd
Kobbe
Havert
Klappmyss
(Ørret?)
Steinkobbe?
Røye
Isbjørn IsbjørnUlv PolarrevPolarrev
Ørn
Fruholmen
Tubåen
NordmelaStøFuglen
Hekkingen
Klipp�skKolje
Kolmule
Tem
pel�
ord
Minkin�ellet
??
?
??
??
Ugle
Blærerot
TettegrasSoldogg
Tem
pel�
ord
Nygrunn
Guade-lupian
Cisu
rlian
Penn
syl-
vani
anM
issi
ssip
pian
Gro
up
Stag
e
Serie
s
Syst
em
Gro
up
Tectonicevents
Rifting
Uralmountainchain
Regionalsubsidence
Com-press-ion
Ex-ten-sion
Platformuplift
Plays inmapped area
N SN S
Lower &middleJurassic
Carnian-Norian
Olenekian,Anisian &Ladinian
Induan
UpperCarboniferous-
Permian
Low
erCa
rbon
i-fe
rous
??
?
? ? ? ?
????
? ?
? ??
Figure 13. Chronostratigraphic and lithostratigraphic diagram for the eastern part of Norway’s Barents Sea sector and for eastern Svalbard, modi-fied from http://www.npd.no/en/Topics/Geology/Lithostratigraphy/. Tectonic events which have affected the area and the plays established in the eastern part of Barents Sea North are specified to the right of the diagram.
Figure 14. Growth faults in rotated half-graben systems assumed to be from the Early Carboniferous in eastern parts of the Sentralbanken high. Note that the Late Carboniferous-Permian package thickens across the whole Sentralbanken high and appears today as an inverted structural element.

1 7
GEOLOGICAL ASSESSMENT OF PETROLEUM RESOURCES IN EASTERN PARTS OF BARENTS SEA NORTH 2017
These sediments are likely to be similar in character to those in Spitsbergen, and could be suitable as both source and reservoir rocks where the sediments have not been too deeply buried. LATE CARBONIFEROUS-PERMIANExtension and rifting also continued during the transition from the Early to Late Carboniferous. A
dry climate combined with frequent changes in sea level led in part to the deposition of evaporites such as gypsum/anhydrites and salt in the central parts of the graben structures (figure 16). The evaluated area is dominated by a marine environment far from clastic input systems. Various types of carbonates could have been deposited laterally to the deepest evaporite basins and on platforms and highs. Magne-
Figure 15. A horst/graben system from the north-eastern Storbanken high. The horst top represents an unconformity surface and was proba-bly exposed subaerially at the Permian-Triassic transition.
Figure 16. Section from the Sentralbanken high flattened on the top Permian reflector. Evaporite deposits (strong reflectors) in the largest graben, and carbonate deposits (homogenous and low-reflective packages) on the highs and platform areas. As the graben was filled with evaporites, its area also became part of the carbonate platform. Note that the top Permian surface creates a strong multiple internally in what are assumed to be carbonate deposits.

1 8
GEOLOGICAL ASSESSMENT OF PETROLEUM RESOURCES IN EASTERN PARTS OF BARENTS SEA NORTH 2017
sium-rich dolomites dominate in the Late Carbonif-erous and Early Permian, while limestones and shales dominate in the Late Permian. Reef-building could have been an important factor for forming reservoir rocks in the Late Carboniferous and Permian. That applies particularly to the horsts and highs around the evaporite basins.
During the Late Carboniferous, the Barents Sea was located in the northern dry climatic belt but an ice age prevailed globally. Repeated global glacials and interglacials led to large global variations in sea level, which also affected the Barents Sea. These frequent changes meant that the deposited carbonates time and again experienced subaerial exposure with the possibility for karstification. Collapse breccia resulting from the leaching of evaporites may also have played a role in the formation of reservoir rocks.
Parts of Barents Sea North were during the last part of the Permian subjected to a new tectonic period,
which led in the Palaeozoic package to a general uplift of highs and subsidence of basins. Towards the end of the Permian, changes in relative sea level exposed a number of areas – including to such an extent that they experienced subaerial exposure and were subject to erosion. Land areas developed on exposed fault blocks where carbonate rocks could have been subject to further karstification as well as possible coastal processes (figure 17).
The age range – hiatus – between the Triassic and the Permian varies in magnitude. In areas where car-bonates have been subaerially exposed to possible karstification, the gap in time is greater than where carbonates have been less exposed or have possibly remained submerged throughout the Permian-Trias-sic transition (figure 15). Large parts of the Early Tri-assic are missing in Edgeøya and Wilhelmøya, which indicates that the carbonates have been exposed and eroded over a lengthy period.
Figure 17. Late Carboniferous and Permian sediments thin over the Storbanken high. This could reflect little sedimentation and/or erosion following subaerial exposure. Note the significant thinning of the Induan, Olenekian and Anisian northwards.
1 9
GEOLOGICAL ASSESSMENT OF PETROLEUM RESOURCES IN EASTERN PARTS OF BARENTS SEA NORTH 2017
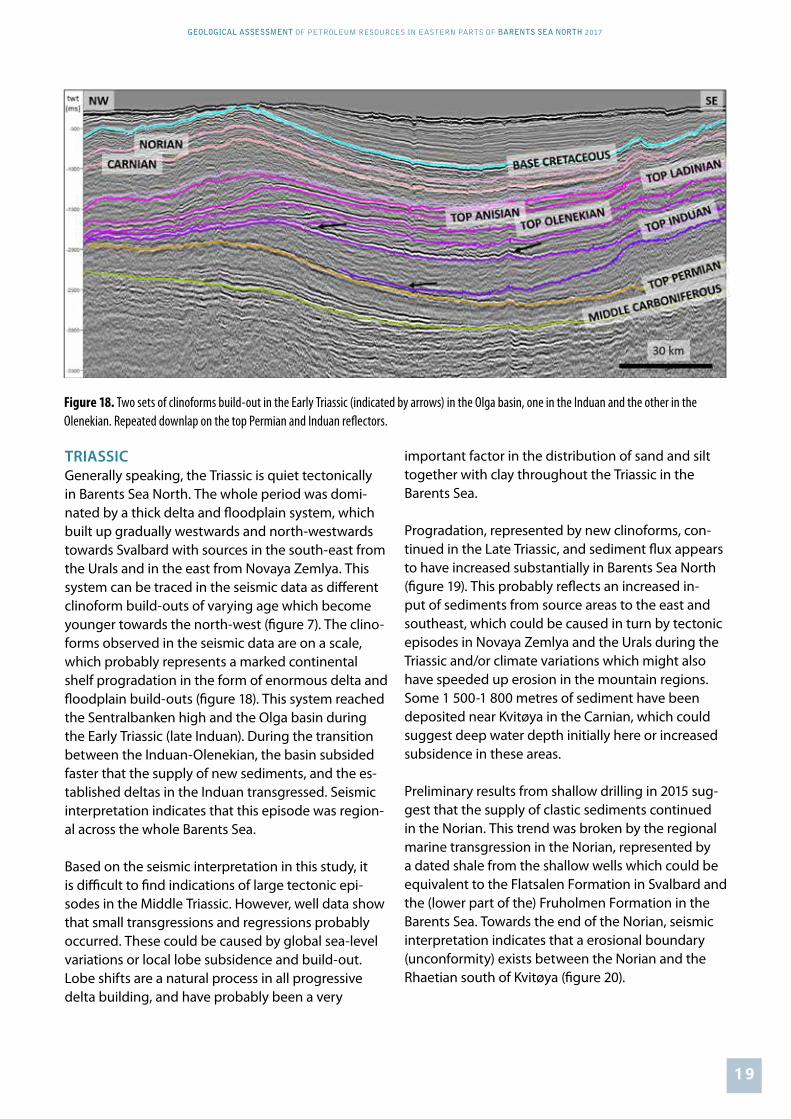
TRIASSICGenerally speaking, the Triassic is quiet tectonically in Barents Sea North. The whole period was domi-nated by a thick delta and floodplain system, which built up gradually westwards and north-westwards towards Svalbard with sources in the south-east from the Urals and in the east from Novaya Zemlya. This system can be traced in the seismic data as different clinoform build-outs of varying age which become younger towards the north-west (figure 7). The clino-forms observed in the seismic data are on a scale, which probably represents a marked continental shelf progradation in the form of enormous delta and floodplain build-outs (figure 18). This system reached the Sentralbanken high and the Olga basin during the Early Triassic (late Induan). During the transition between the Induan-Olenekian, the basin subsided faster that the supply of new sediments, and the es-tablished deltas in the Induan transgressed. Seismic interpretation indicates that this episode was region-al across the whole Barents Sea.
Based on the seismic interpretation in this study, it is difficult to find indications of large tectonic epi-sodes in the Middle Triassic. However, well data show that small transgressions and regressions probably occurred. These could be caused by global sea-level variations or local lobe subsidence and build-out. Lobe shifts are a natural process in all progressive delta building, and have probably been a very
important factor in the distribution of sand and silt together with clay throughout the Triassic in the Barents Sea.
Progradation, represented by new clinoforms, con-tinued in the Late Triassic, and sediment flux appears to have increased substantially in Barents Sea North (figure 19). This probably reflects an increased in-put of sediments from source areas to the east and southeast, which could be caused in turn by tectonic episodes in Novaya Zemlya and the Urals during the Triassic and/or climate variations which might also have speeded up erosion in the mountain regions. Some 1 500-1 800 metres of sediment have been deposited near Kvitøya in the Carnian, which could suggest deep water depth initially here or increased subsidence in these areas.
Preliminary results from shallow drilling in 2015 sug-gest that the supply of clastic sediments continued in the Norian. This trend was broken by the regional marine transgression in the Norian, represented by a dated shale from the shallow wells which could be equivalent to the Flatsalen Formation in Svalbard and the (lower part of the) Fruholmen Formation in the Barents Sea. Towards the end of the Norian, seismic interpretation indicates that a erosional boundary (unconformity) exists between the Norian and the Rhaetian south of Kvitøya (figure 20).
Figure 18. Two sets of clinoforms build-out in the Early Triassic (indicated by arrows) in the Olga basin, one in the Induan and the other in the Olenekian. Repeated downlap on the top Permian and Induan reflectors.

2 0
GEOLOGICAL ASSESSMENT OF PETROLEUM RESOURCES IN EASTERN PARTS OF BARENTS SEA NORTH 2017
JURASSIC AND UPPERMOST TRIASSIC (RHAETIAN)About 230 metres of clastic sediments are exposed on Kong Karls Land (figure 2) in the Realgrunnen subgroup (the base of the subgroup is not subaer-ial; Larsen et al, in preparation). The bulk of these sediments belong to the Svenskøya and Kongsøya Formations from the Early and Middle Triassic. A large proportion of the clastic sediments consist here of tidal deposits. Seismic interpretation in the mapped
area south of Kvitøya shows an estimated thickness of about 250 metres of sediments with the same age.
Attribute mapping of three-dimensional seismic on the Haapet Dome in Barents Sea South shows chan-nel systems in the Realgrunnen subgroup running from south-east to north-west, in line with the trend throughout the Triassic, and the geomorphological characteristics indicate that these are fluvial channels. Plans call for the Korpfjell prospect on the Haapet
Figure 19. Triassic sequences in the northernmost part of the mapped area flattened on the Induan reflector. The Triassic has an erosional contact with the Permian sediments.
Figure 20. Well 7934/8-U-1 has been drilled through Late Triassic sediments, and dating shows a Norian marine shale (Flatsalen Formation). The overlying and underlying sandstones (sst) are undated.
2 1
GEOLOGICAL ASSESSMENT OF PETROLEUM RESOURCES IN EASTERN PARTS OF BARENTS SEA NORTH 2017
Dome to be drilled in 2017 (production licence 859). The directional trend for the channel system on the Haapet Dome is a good indication that the prove-nance area lies either on Novaya Zemlya or even fur-ther south in the Ural mountain chain. Extrapolating the trend of the channel systems in the Realgrunnen subgroup on the Haapet Dome towards the north-west allows them to be correlated with delta deposi-tion and fluvial channels in the Wilhelmøya subgroup on Hopen.
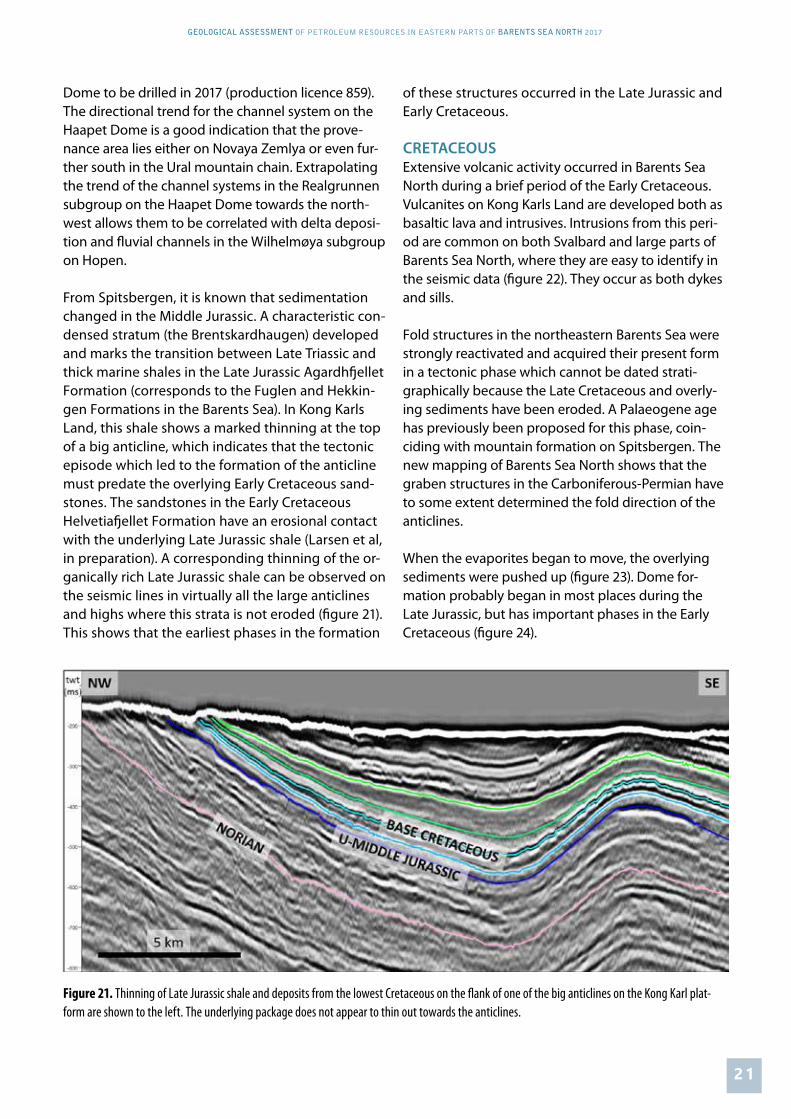
From Spitsbergen, it is known that sedimentation changed in the Middle Jurassic. A characteristic con-densed stratum (the Brentskardhaugen) developed and marks the transition between Late Triassic and thick marine shales in the Late Jurassic Agardhfjellet Formation (corresponds to the Fuglen and Hekkin-gen Formations in the Barents Sea). In Kong Karls Land, this shale shows a marked thinning at the top of a big anticline, which indicates that the tectonic episode which led to the formation of the anticline must predate the overlying Early Cretaceous sand-stones. The sandstones in the Early Cretaceous Helvetiafjellet Formation have an erosional contact with the underlying Late Jurassic shale (Larsen et al, in preparation). A corresponding thinning of the or-ganically rich Late Jurassic shale can be observed on the seismic lines in virtually all the large anticlines and highs where this strata is not eroded (figure 21). This shows that the earliest phases in the formation
of these structures occurred in the Late Jurassic and Early Cretaceous.
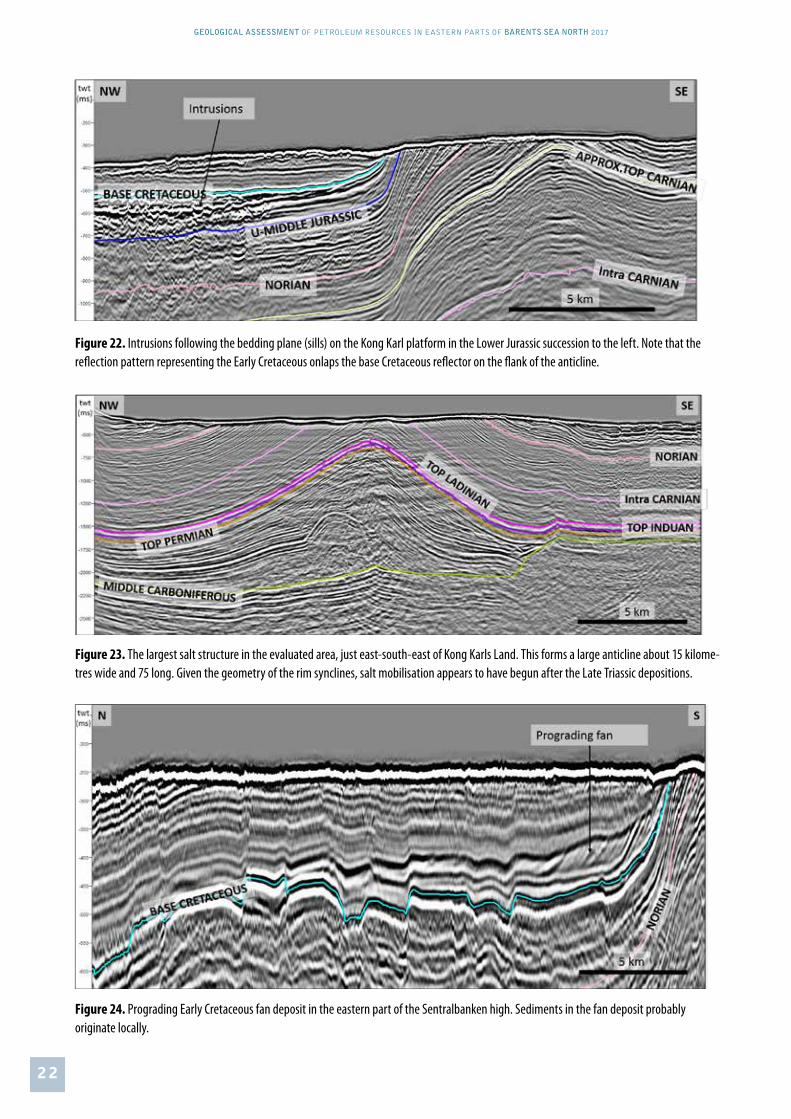
CRETACEOUSExtensive volcanic activity occurred in Barents Sea North during a brief period of the Early Cretaceous. Vulcanites on Kong Karls Land are developed both as basaltic lava and intrusives. Intrusions from this peri-od are common on both Svalbard and large parts of Barents Sea North, where they are easy to identify in the seismic data (figure 22). They occur as both dykes and sills.
Fold structures in the northeastern Barents Sea were strongly reactivated and acquired their present form in a tectonic phase which cannot be dated strati-graphically because the Late Cretaceous and overly-ing sediments have been eroded. A Palaeogene age has previously been proposed for this phase, coin-ciding with mountain formation on Spitsbergen. The new mapping of Barents Sea North shows that the graben structures in the Carboniferous-Permian have to some extent determined the fold direction of the anticlines.
When the evaporites began to move, the overlying sediments were pushed up (figure 23). Dome for-mation probably began in most places during the Late Jurassic, but has important phases in the Early Cretaceous (figure 24).
Figure 21. Thinning of Late Jurassic shale and deposits from the lowest Cretaceous on the flank of one of the big anticlines on the Kong Karl plat-form are shown to the left. The underlying package does not appear to thin out towards the anticlines.
2 2
GEOLOGICAL ASSESSMENT OF PETROLEUM RESOURCES IN EASTERN PARTS OF BARENTS SEA NORTH 2017
Figure 22. Intrusions following the bedding plane (sills) on the Kong Karl platform in the Lower Jurassic succession to the left. Note that the reflection pattern representing the Early Cretaceous onlaps the base Cretaceous reflector on the flank of the anticline.
Figure 23. The largest salt structure in the evaluated area, just east-south-east of Kong Karls Land. This forms a large anticline about 15 kilome-tres wide and 75 long. Given the geometry of the rim synclines, salt mobilisation appears to have begun after the Late Triassic depositions.
Figure 24. Prograding Early Cretaceous fan deposit in the eastern part of the Sentralbanken high. Sediments in the fan deposit probably originate locally.
2 3
GEOLOGICAL ASSESSMENT OF PETROLEUM RESOURCES IN EASTERN PARTS OF BARENTS SEA NORTH 2017
PALAEOGENEAs described above, one of the main theories on the formation of large anticlines in the northeastern part of the mapped area was that these occurred at the same time as compression on Svalbard during the Pa-laeogene. However, no Palaeogene sediments have been proven in the evaluated area which can confirm this. They are only to be found in Spitsbergen or the western part of the Barents Sea, where the fold direc-tion is different from that east of Svalbard.
At the same time, seismic interpretation indicates that tectonic forces related to regional movements in the Late Jurassic and Early Cretaceous, and doming related to evaporites, have been an important factor in the formation of the highs and anticlines in the Early Cretaceous before the final compression phase or phases occurred.
NEOGENE-QUATERNARYDuring the Pliocene-Quaternary, the mapped area has been subject to repeated glaciations. These can be divided into three main phases – the first 3.6 million years ago, followed by a growth stage and then the final period of large-scale glaciation about a million years ago (Knies et al, 2009). Erosion related to glacia-tion was extensive throughout the Barents continental shelf. Large quantities of sediment were deposited in submarine areas (depocentres) along the western and northern margins. Total erosion was greatest on northern platform areas and the areas around Svalbard. Some two-three kilometres of sediments are estimated to have been removed on Svalbard (Smelror et al, 2009). This extensive erosion was both glacial and related to the tectonic episodes in the Pa-laeogene. According to Ramberg et al (2007), most of the Palaeogene and Cretaceous strata in Barents Sea North were eroded away during the Neogene.
2 4
GEOLOGICAL ASSESSMENT OF PETROLEUM RESOURCES IN EASTERN PARTS OF BARENTS SEA NORTH 2017
PETROLEUM GEOLOGY
A series of discoveries in both Norwegian and Russian sectors of Barents Sea South show that a number of petroleum systems work in the area. Neverthe-less, uncertainty exists with a number of factors. For hydrocarbons to be formed and accumulated in an area, several geological factors (see fact box) must coincide.
Geological factors:
1. A source rock is present containing organic mate-rials which are converted to hydrocarbons under temperature and pressure.
2. A migration route allows the hydrocarbons to flow from the source rock to the reservoir rock.
3. A reservoir rock is present to provide a porous/permeable structure where hydrocarbons can be retained.
4. A cap rock has formed as an impermeable layer encasing the reservoir rock so that the hydrocar-bons are retained and accumulate in the reser-voir.
If one or more of the factors mentioned above are absent, accumulated quantities of oil and gas will not be found in the area. Uncertainty always prevails about the presence of hydrocarbons in a mapped prospect, and exploration wells must be drilled to determine the matter.
SOURCE ROCKSPetroleum systems in the Barents Sea comprise a number of possible source rocks (figure 13) (Ohm et al, 2008; Lerch et al, 2016). These source rocks are of various types and differ in their potential for forming hydrocarbons. Some will mainly generate gas, while others are more likely to form oil.
Lower Carboniferous coal and carbonaceous shale (the Billefjorden Group) are regarded as potential source rocks in the evaluated area. Geological developments in the evaluated area indicate that this source has been
deeply buried, and is very likely to be gas generating in today’s basin areas. On the highs, this source rock is rather shallower – increasing the probability that oil will be generated should it be present. Because of their depth and the lack of outcropping strata, the deep source rocks cannot be sampled with shallow drilling in and close to the evaluated area. Assumptions about this source are therefore based on information from Svalbard and from exploration wells/shallow drilling in Barents Sea South.
Upper Carboniferous and Lower Permian organic carbonate-rich mud (Gipsdalen Group) and Upper Permian marine shale (Tempelfjorden Group) may also have a source potential. Among the oldest source rocks, the organic carbonate-rich mud of the Upper Carboniferous and Lower Permian (Gipsdalen Group) is considered to have the biggest oil-gen-erating potential. Owing to erosion and/or lack of deposition, particularly over highs, the presence of the Tempelfjorden Group is uncertain in parts of the area. Furthermore, depth of burial with associated high temperatures provides a substantial probability that the source(s) are gas generating – particularly in deeper areas. Assumptions about this source rock are based on information from Svalbard and from exploration drilling/shallow boreholes in Barents Sea South.
The most important source rock in Barents Sea North is assumed to be organically rich Olenekian, Anisian and Ladinian shales (the Steinkobbe/Botneheia Formation). The Steinkobbe Formation is a proven oil-generating source in Barents Sea South (Lund-schien et al, 2014), and is assumed to be developed as a good source rock in parts of the mapped area. The Steinkobbe Formation is time transgressive and transitions into the Botneheia Formation towards the north-west. Steinkobbe/Botneheia is assumed to be present over large parts of the evaluated area. Geo-chemical analyses at Blanknuten in Edgeøya indicate that the Botneheia Formation is oil generating (Abay et al, 2014). Geological interpretation of the seismic data indicates that Steinkobbe/Botneheia has been/is buried at a favourable depth for oil generation.
2 5
GEOLOGICAL ASSESSMENT OF PETROLEUM RESOURCES IN EASTERN PARTS OF BARENTS SEA NORTH 2017
In addition to the above-mentioned source rocks, source rock potential could be present at other levels – such as in the Early and Late Triassic. Organic-rich Late Jurassic shale (the Hekkingen Formation in the Barents Sea), which usually represents the most important source interval on the NCS, is probably immature throughout the area.
Conversion of organic material in source rocks to hydrocarbons depends on its burial to a depth with a sufficiently high temperature. The latter rises as the source rocks become more deeply buried. Once deep enough, the rocks will generate oil and are de-scribed as oil-mature. Further subsidence and higher temperatures will cause the rocks to generate gas. If the temperature continues to rise, the hydrocarbon potential in the organic material disappears and the source rock becomes exhausted. Large quantities of hydrocarbons are likely to form at temperatures around 120°C, and these can leave the source rock to migrate into traps.
This process requires the presence of permeable geo-logical strata or fractures which connect the source rock with the trap. A critical factor in assessing the petroleum potential of the prospects is whether the migration process has functioned.
The temperature required to form hydrocarbons depends on the quality of the source rocks and how much time has passed. On the NCS, the temperature will typically rise about 35°C per kilometre of buried depth, but this varies somewhat from area to area. Because of the erosion mentioned in the section be-low on hydrocarbon retention, maximum burial and thereby maximum temperature has been higher than today’s depth would suggest. In other words, the potential of possible source rocks for generating oil and gas has altered between various periods because their burial depth has changed over time.
RESERVOIR ROCKSSeveral factors govern deposition and preservation of reservoir rocks. The original deposition environment is important for reservoir properties and, because the mapped area covers a large area, this will vary across it. A common denominator for all reservoirs is that burial depth is an important factor for preservation of their properties over time. If they are buried too
deep, their porosity and permeability – and thereby flow properties for hydrocarbons – will deteriorate. Ultimately, these will be so reduced that the rock can no longer be regarded as a suitable source.
A number of different reservoir rocks exist, and both sandstone and carbonate formations are relevant in the evaluated area. They are described in the section on the various plays. When estimating reservoir prop-erties, changes in these over time are particularly affected by maximum burial depth and temperature. In the mapped region, Middle and Upper Triassic as well as Jurassic sandstone reservoirs will lie at favour-able depths. This makes it likely that their properties have been preserved over large areas. Uncertainty over preserved reservoir properties is greater for deeper levels in the Lower Triassic and the Carbon-iferous-Permian. Upper Carboniferous-Permian carbonates are expected to lie at shallower depths in the north than in the south, which increases the probability that reservoir properties are preserved. Opportunities are also present for secondary porosity arising from diagenesis or fracturing after the rock was formed. Nor can fractured or deteriorated base-ment rock be excluded, but it has not been included in this study.
TRAPSA large number of structural traps have been mapped in the area. Several of these are very large, since their extent and thereby the volume of rock they contain are substantial. Nevertheless, it must be noted that the traps are not assumed to be filled to the spill point when estimating the resources, and that a maximum hydrocarbon column of 300 metres is used as the cut-off. This restriction is based on experience from Barents Sea South, where the traps often show signs of leakage and where the maximum proven hydrocarbon column is in the order of 250 metres.
Traps are structures which can contain hydrocarbons because they are bounded by tight (impermeable) rocks which prevent or restrict further hydrocarbon migration. Structural traps comprise a bounded iso-lated high, while stratigraphic traps consist of isolat-ed reservoir rocks surrounded by tight rocks.
Anticlines and fault blocks, which are both examples of the structural type, dominate among the traps. In

2 6
GEOLOGICAL ASSESSMENT OF PETROLEUM RESOURCES IN EASTERN PARTS OF BARENTS SEA NORTH 2017
addition, the possibility of stratigraphic traps cannot be excluded.
The sealing potential in the Barents Sea is often re-garded as challenging, particularly for the shallowest reservoirs. Nevertheless, structures in the Pechora Basin – where faults extend to the seabed but the trap continues to function – show that local factors and properties related to lithology could allow the seal to hold (Henriksen et al, 2013).
In addition, the Wisting discovery in 7324/8-1 (figure 4) at a depth of 662 metres shows that sealing can function even with a shallow reservoir.
RETENTION OF HYDROCARBONS IN A TRAPErosion of sedimentary successions across large parts of the Barents Sea over the past 66 million years is estimated at 1 000-1 500 metres or more, and has been up to 3 000 metres in some areas (Henriksen et al, 2013). These estimates build particularly on geochemical analyses of the conversion of organic material and on compaction and cementing of the reservoir rocks. Temperature and pressure in the petroleum systems are therefore lower today than would have been the case for maximum burial. This must be taken into account when evaluating such aspects as reservoir quality, source potential and mi-gration. The effects of uplift and erosion on prospec-tivity, and dating these processes, have been dis-cussed for many years. Indications of several different tectonic episodes are to be found in the Barents Sea area, and agreement by and large prevails that uplift in the Palaeogene and glaciation in the Neogene affected the whole region. (Riis & Fjeldskaar, 1992; Henriksen et al, 2013).
Erosion causes the temperature of the source rocks to fall, so that maturation ceases or is substantially reduced. Furthermore, the pressure reduction from the load removal will cause the gas zones to expand and allow gas to bubble out of the oil zones. Areas subject to uplift could experience substantial alter-ations in the direction of petroleum migration, and great uncertainty prevails about these changes and the directions the oil and gas will take.
During the early exploration phase in the Barents Sea, it was established that porosity values in the res-ervoirs were far lower than their present burial depth would indicate. This suggested that the sedimentary succession has been buried considerably deeper. Maximum burial depth is calculated by analysing the alteration of minerals and organic materials in the sediment. This is routinely done for all exploration wells in the Barents Sea (Ohm et al, 2008).
Such data also exist from shallow boreholes in the northern Barents Sea and from field studies in Sval-bard.
Exploration activity in Barents Sea South revealed at an early stage that proven discoveries were not filled to the spill point of the structures. Traces of oil and gas have also been found in a great many dry wells (Lerch et al, 2016), indicating that petroleum has leaked out. Erosion and faulting through and over the structures constitute a risk of increased leak rates (Henriksen et al, 2013).
Some 1-2 000 metres of the overburden on the rocks could have been eroded in the mapped area, but some uncertainty exists about these estimates. Uplift and consequent pressure reduction could lead to reactivation of faults and fracturing in the cap rock and thereby to leakage. Furthermore, temperature reductions could also cause fracturing in the cap rock, which in turn enhances the leakage risk.
Risk related to retention is one of the main challenges in the evaluated area, where faults sometimes extend all the way to the base of Quaternary strata. That ap-plies not least where the temperature of the source rock has fallen so much that it can no longer con-tribute newly formed hydrocarbons to the traps. The observations cited above demonstrate that erosion owing to uplift and glaciation has had a big effect on the petroleum system and possible petroleum deposits in the Barents Sea. Detailed evaluations of these factors should therefore be made when as-sessing prospectivity and as part of future work in Barents Sea North.

2 7
GEOLOGICAL ASSESSMENT OF PETROLEUM RESOURCES IN EASTERN PARTS OF BARENTS SEA NORTH 2017
Figure 26. The flat spot in the Wilhelmøya/Realgrunnen subgroup in the study area. Note that this spot can be followed through several fault blocks.
HYDROCARBON INDICATIONSA number of the anticlines with traps on the Kong Karl platform and the flanks of the Storbanken high (figure 2) show increased seismic amplitude (figure 25). A flat spot in Lower-Middle Jurassic rocks on the edge of the Storbanken high could indicate the pres-ence of hydrocarbons in the strata concerned (figure 26). These observations suggest an active petroleum system in the area.
Figure 25. Compression anticlines on the Kong Karl platform. A general feature of the Jurassic package in the mapped are is its shallowness. The anticline on the right represents a large Jurassic trap in the mapped area. Erosion at the top of the structure appears to be down or very close to Late Jurassic shales. Despite the erosion and little overburden, an increase in amplitude has been observed in several of the anticlines on and below the reflector interpreted as the top of the sandstone succession from the Early-Middle Jurassic.

2 8
GEOLOGICAL ASSESSMENT OF PETROLEUM RESOURCES IN EASTERN PARTS OF BARENTS SEA NORTH 2017
PLAYS
Estimating possible petroleum resources in an area builds on a good understanding of the regional geol-ogy. In an area without previous exploration activity, uncertainty will be particularly great with regard to the:
• total resources• geographical distribution of the resources• size distribution (large or small deposits) and
number • division between the oil and gas resources
Assessments of possible plays (see the fact box be-low) are based on the method used to estimate pos-sible petroleum resources. The probability that the factors described in figure 23 are present is assessed for each play. Summing probabilities for these three factors yields the play probability. This describes the level of uncertainty about whether the play functions before a discovery is made in it. At least one discov-ery is required to confirm that a play functions. This discovery does not have to be commercial.
Figure 27: The relationship between basin, play, prospect and discov-ery.
Play: a geographically delineated area where several geological factors are present so that producible petroleum could be proven.
These factors are:Reservoir rock, a porous rock where petroleum can accumulate. Reservoir rocks in a specific play will belong to a given stratigraphic level (age). Cap rock, a tight (impermeable) rock overlaying a reservoir rock, so that petroleum can migrate no further and accumulates in the reservoir. The resulting trap must have formed before petroleum ceased to migrate into the reservoir. Source rock, shale, limestone or coal containing organic materials which can be converted into petroleum. The source rock must also be mature – in other words, have a temperature and pressure such that petroleum actually forms – and the petroleum must be able to migrate from source rock to reservoir rock.
A confirmed play will mean that uncertainty no lon-ger prevails about the three geological factors. When a play has been confirmed, the resource estimate associated with it will rise because the probability of success has increased. The relationship between basin, play, prospect and discovery is illustrated in figure 27.
Several plays can be found in a single geographical area. These could, for example, vary in their geolog-ical age and thereby lie over each other at different levels in the sedimentary succession.
PLAY ANALYSIS – METHOD FOR CALCULATING POSSIBLE PETROLEUM RESOURCESSeveral methods are available for estimating how much oil and gas might have been formed and retained in an area. The choice of method depends in part on how much is known about the area. Play analysis is a stochastic calculation method used by the NPD to produce resource estimates for the NCS.
BasinPlayProspectDiscovery/�eld
2 9
GEOLOGICAL ASSESSMENT OF PETROLEUM RESOURCES IN EASTERN PARTS OF BARENTS SEA NORTH 2017
This involves systematising and grouping the geo-logical parameters which characterise the play, and which distinguish it from others.
The estimated resources are risk-weighted – in other words, the estimated volume is multiplied by the probability of success. Whether a play contains petro-leum is uncertain until a discovery has been made. If no mobile petroleum is proven in a prospect belong-ing to the play, the latter remains unconfirmed. An unconfirmed play is one where uncertainty prevails about one or more of the geological factors which must be present in order to discover petroleum.
Play analyses utilise a stochastic calculation model, where in-place and recoverable resources are calcu-lated with their associated uncertainty range. The simulations in the analyses take account of the proba-bilities of success. When aggregating these, account is taken of possible interdependencies in volume and risk parameters and Monte Carlo Simulation is used to sample stochastically in all uncertainty distribu-tions.
Even when a play is confirmed, uncertainty persist about whether the resources it contains are in large or small accumulations and whether they are mainly
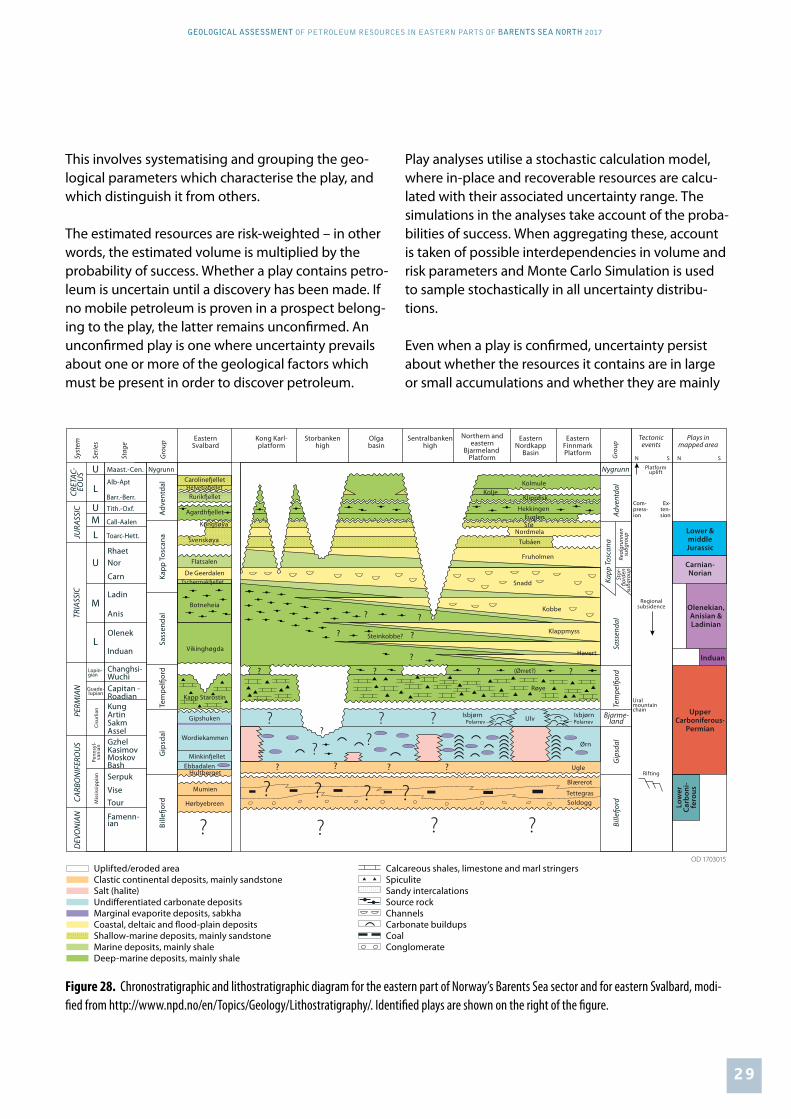
Figure 28. Chronostratigraphic and lithostratigraphic diagram for the eastern part of Norway’s Barents Sea sector and for eastern Svalbard, modi-fied from http://www.npd.no/en/Topics/Geology/Lithostratigraphy/. Identified plays are shown on the right of the figure.
OD 1703015Calcareous shales, limestone and marl stringersSpiculiteSandy intercalationsSource rockChannelsCarbonate buildupsCoalConglomerate
Uplifted/eroded areaClastic continental deposits, mainly sandstoneSalt (halite)Undi�erentiated carbonate depositsMarginal evaporite deposits, sabkha Coastal, deltaic and �ood-plain depositsShallow-marine deposits, mainly sandstoneMarine deposits, mainly shaleDeep-marine deposits, mainly shale
Kapp
Tos
cana
Sass
enda
lG
ipsd
alA
dven
tdal
Bille
�ord
Adve
ntda
lKa
pp T
osca
naSa
ssen
dal
Bille
�ord
Alb-Apt
Barr.-Berr.
Tith.-Oxf.
Nor
Carn
Ladin
Anis
Changhsi-WuchiCapitan -Roadian
GzhelKasimov
Olenek
KungArtinSakmAssel
Serpuk
Famenn-ian
ViseTour
Induan
M
M
L
L
U
U
U
CRET
AC-
EOU
SJU
RASS
ICPE
RMIA
ND
EVO
NIA
NCA
RBO
NIF
ERO
US
Rhaet
L
BashMoskov
Call-Aalen
Toarc-Hett.
Maast.-Cen.
TRIA
SSIC
Lopin-gian
Gip
sdal
Bjarme-land
Stor
-�o
rden
subg
roup
Real
grun
nen
subg
roup
? ? ?
Northern andeastern
Bjarmeland Platform
Nygrunn
EasternNordkapp
Basin
EasternFinnmarkPlatform
Sentralbankenhigh
Olgabasin
Storbankenhigh
Kong Karl-platform
EasternSvalbard
Vikinghøgda
Botneheia
Tschermak�elletDe Geerdalen
Flatsalen
Svenskøya
Kongsøya
Agardh�ellet
Rurik�ellet
Caroline�elletHelvetia�ellet
Kapp Starostin
Gipshuken
Wordiekammen
EbbadalenHultberget
Mumien
Hørbyebreen
?
Snadd
Kobbe
Havert
Klappmyss
(Ørret?)
Steinkobbe?
Røye
Isbjørn IsbjørnUlv PolarrevPolarrev
Ørn
Fruholmen
Tubåen
NordmelaStøFuglen
Hekkingen
Klipp�skKolje
Kolmule
Tem
pel�
ord
Minkin�ellet
??
?
??
??
Ugle
Blærerot
TettegrasSoldogg
Tem
pel�
ord
Nygrunn
Guade-lupian
Cisu
rlian
Penn
syl-
vani
anM
issi
ssip
pian
Gro
up
Stag
e
Serie
s
Syst
em
Gro
up
Tectonicevents
Rifting
Uralmountainchain
Regionalsubsidence
Com-press-ion
Ex-ten-sion
Platformuplift
Plays inmapped area
N SN S
Lower &middleJurassic
Carnian-Norian
Olenekian,Anisian &Ladinian
Induan
UpperCarboniferous-
Permian
Low
erCa
rbon
i-fe
rous
??
?
? ? ? ?
????
? ?
? ??

3 0
GEOLOGICAL ASSESSMENT OF PETROLEUM RESOURCES IN EASTERN PARTS OF BARENTS SEA NORTH 2017
oil or gas. For more detailed information on the vari-ables included in the play analyses, see chapter 3 of Petroleum resources on the Norwegian continental shelf 2016 at www.npd.no.
Six plays have been identified in the eastern part of Barents Sea North, and these represent various mapped reservoir levels as shown in figure 28.
A number of extremely large geological structures stand out at several geological levels. These are pri-marily identified on the Sentralbanken high, the Stor-banken high and the Kong Karl platform (figure 2). In addition comes a potential for a number of other structures, both large and small, at the various levels. Through the mapping process, the structures were matured to geological traps which were utilised in further play analysis work. The latter has been based on the geological information obtained by assessing the potential for hydrocarbons being present in the various identified traps, as well as possible prospec-tivity which could be mapped in the future with better data coverage.
Figure 29. Extent of the Early Carboniferous play in the mapped area of Barents Sea North.
EARLY CARBONIFEROUS (TOURNAISIAN, VISEAN AND SERPUKHOVIAN) PLAY
The oldest play assessed in the mapped area com-prises sandstones and conglomerates deposited as fluvial and alluvial river, delta and floodplain systems in the Early Carboniferous. This play (figure 29) is confined to where the clastic rocks are assumed to have retained their reservoir properties. That is in areas around the Storbanken high, where the maxi-mum burial is assumed to have been less than 4 500 metres.
The trap type comprises anticlines and fault blocks. In addition, stratigraphic traps could occur locally in flu-vial channel systems around the highs. The possible source rock is assumed to be Lower Carboniferous coal and carbonaceous shales (Billefjorden Group). As mentioned above, this source has been deeply bur-ied in much of the area and gas is therefore the most likely hydrocarbon phase in this play.
An analogous play is found on the Finnmark Platform in Barents Sea South.
0˚ 40˚20˚ 60˚
68˚
72˚
76˚
Tromsø
Hammerfest
Vadsø
Kirkenes
Bjørnøya
Svalbard

3 1
GEOLOGICAL ASSESSMENT OF PETROLEUM RESOURCES IN EASTERN PARTS OF BARENTS SEA NORTH 2017
LATE CARBONIFEROUS-PERMIAN (BASHKIRIAN-GUADALUPIAN) PLAY
Shown in figure 30, this play comprises possible reservoirs of limestones and dolomites in warm-wa-ter carbonates (Gipsdalen Group), calcite-dominat-ed cold-water carbonates (Bjarmeland Group), and silicified carbonates and spiculite flint (Tempelfjorden Group). The Gipsdalen Group contains thick carbon-ate accumulations (palaeoaplysina reefs) from warm, shallow marine waters with proven good reservoir properties in analogue settings (Stemmerik & Wors-ley, 2005). Large carbonate accumulations (bryozoan reefs) are also found in the Bjarmeland Group, but then from deeper marine, temperate waters. The play is extensive in the mapped area, but is not regard-ed as relevant in the deeper areas such as the Olga Basin.
Frequent and major changes in relative sea level during this period mean that karstification (seen in such places as the Loppa High) could be important for reservoir properties. One restriction on reservoir quality could be that the carbonates have earlier been too deeply buried. Low permeability in deeply buried carbonates may be compensated for in areas where possible fractured reservoirs are found. The trap type comprises anticlines and fault blocks. Strati-graphic traps could also have developed in indepen-dent carbonate accumulations throughout the area.
Relevant source rocks for the play are Lower Carbon-iferous coal and carbonaceous shale (Billefjorden Group), Upper Carboniferous and Lower Permian organic carbon-rich mud (Gipsdalen Group) and pos-sibly Upper Permian marine shales (Tempelfjorden Group). These source rocks have also been deeply buried, which increases the probability of possible gas generation.
The analogous play in Barents Sea South is found in such places as the Loppa High.
Figure 30. Extent of the Late Carboniferous-Permian play in the mapped area of Barents Sea North.
0˚ 40˚20˚ 60˚
68˚
72˚
76˚
Tromsø
Hammerfest
Vadsø
Kirkenes
Bjørnøya
Svalbard

3 2
GEOLOGICAL ASSESSMENT OF PETROLEUM RESOURCES IN EASTERN PARTS OF BARENTS SEA NORTH 2017
EARLY TRIASSIC (INDUAN) PLAY
The play comprising Early Triassic reservoir rocks (figure 31) is assumed to consist of prograding coast/delta front and possible turbidite sandstones in the slope down towards deeper marine conditions to the north-west of the mapped area. Fluvial sandstones could be relevant reservoir units in the southern part of the area. In the Hopen-2 well, the Early Triassic (Induan) has developed as dark shale without reser-voir properties. Seismic interpretation shows that the clinoform systems in the Induan flatten out before they reach Hopen-2, and that this position lies north of the Early Triassic build-out. Typically, clinoform systems in the Early Triassic are large but have low inclinations. This could suggest that the slope has a large content of silt and clay, and that possible res-ervoir facies lie in the more horizontal layers located over the tilted strata. That also defines the extent of the play.
The trap type comprises anticlines and fault blocks. Stratigraphic traps may also have developed in fluvial channel systems at the southern end of the area.
Source rocks for the play could be Early Carbonifer-ous coal measures and organically rich shales and carbonates in the Carboniferous and Permian. In addition, organically rich Early Triassic shales cannot be excluded as potential source rocks. The common denominator for these source rocks is that they lie deep over most of the area and have probably passed through the oil window, so that they will pos-sibly generate gas at today’s burial depth.
The play is analogous to that for the Havert Forma-tion in the southern part of the Barents Sea, where gas has been proven.
Figure 31. Extent of the Early Triassic play in the mapped area of Barents Sea North.
0˚ 40˚20˚ 60˚
68˚
72˚
76˚
Tromsø
Hammerfest
Vadsø
Kirkenes
Bjørnøya
Svalbard
3 3
GEOLOGICAL ASSESSMENT OF PETROLEUM RESOURCES IN EASTERN PARTS OF BARENTS SEA NORTH 2017
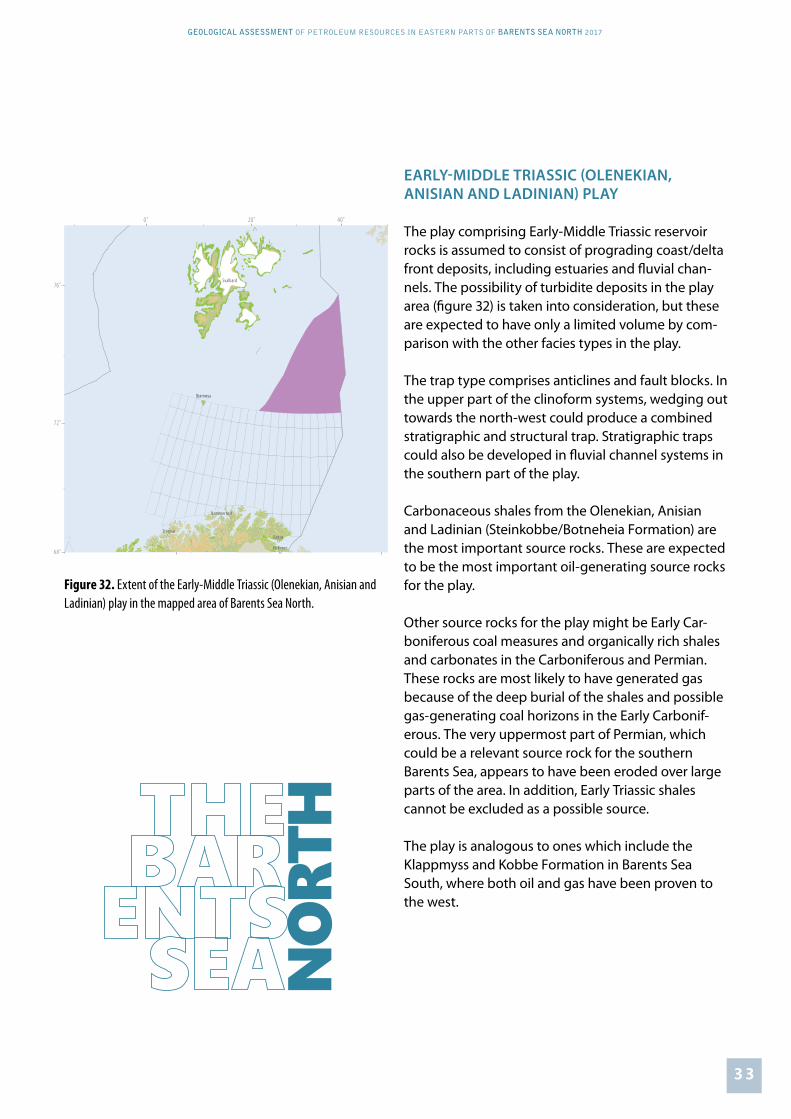
EARLY-MIDDLE TRIASSIC (OLENEKIAN, ANISIAN AND LADINIAN) PLAY
The play comprising Early-Middle Triassic reservoir rocks is assumed to consist of prograding coast/delta front deposits, including estuaries and fluvial chan-nels. The possibility of turbidite deposits in the play area (figure 32) is taken into consideration, but these are expected to have only a limited volume by com-parison with the other facies types in the play.
The trap type comprises anticlines and fault blocks. In the upper part of the clinoform systems, wedging out towards the north-west could produce a combined stratigraphic and structural trap. Stratigraphic traps could also be developed in fluvial channel systems in the southern part of the play.
Carbonaceous shales from the Olenekian, Anisian and Ladinian (Steinkobbe/Botneheia Formation) are the most important source rocks. These are expected to be the most important oil-generating source rocks for the play.
Other source rocks for the play might be Early Car-boniferous coal measures and organically rich shales and carbonates in the Carboniferous and Permian. These rocks are most likely to have generated gas because of the deep burial of the shales and possible gas-generating coal horizons in the Early Carbonif-erous. The very uppermost part of Permian, which could be a relevant source rock for the southern Barents Sea, appears to have been eroded over large parts of the area. In addition, Early Triassic shales cannot be excluded as a possible source.
The play is analogous to ones which include the Klappmyss and Kobbe Formation in Barents Sea South, where both oil and gas have been proven to the west.
Figure 32. Extent of the Early-Middle Triassic (Olenekian, Anisian and Ladinian) play in the mapped area of Barents Sea North.
0˚ 40˚20˚ 60˚
68˚
72˚
76˚
Tromsø
Hammerfest
Vadsø
Kirkenes
Bjørnøya
Svalbard
3 4
GEOLOGICAL ASSESSMENT OF PETROLEUM RESOURCES IN EASTERN PARTS OF BARENTS SEA NORTH 2017
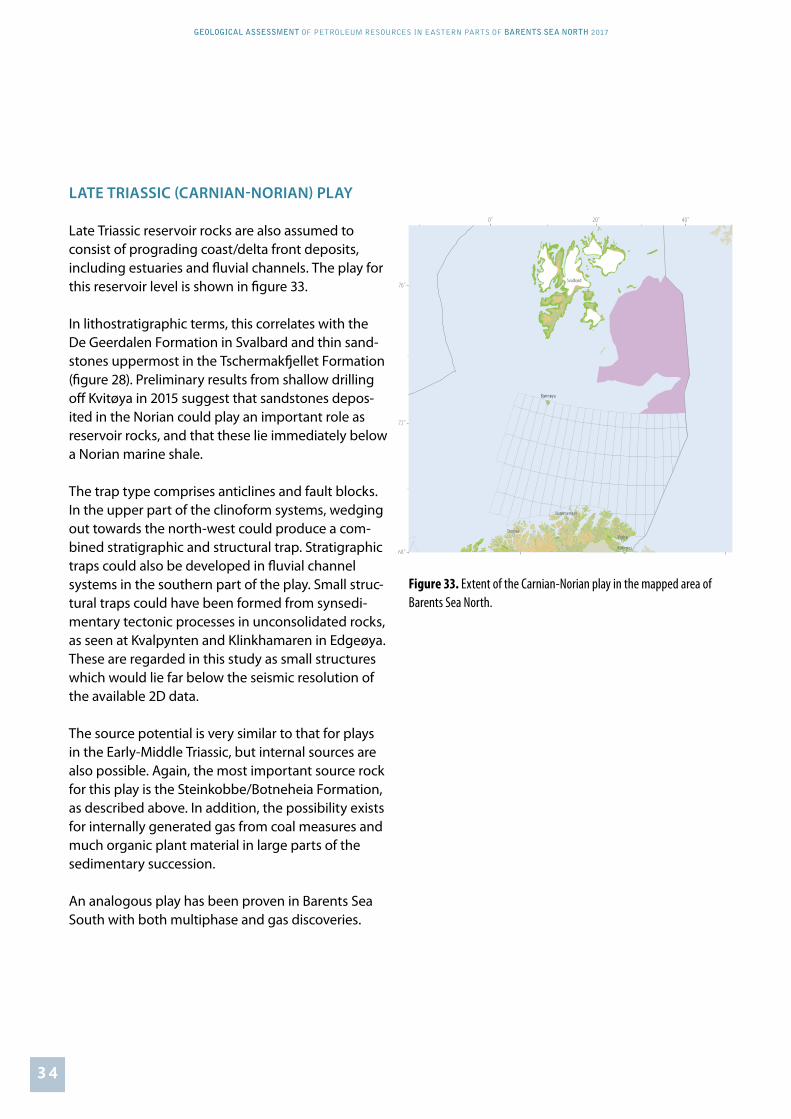
LATE TRIASSIC (CARNIAN-NORIAN) PLAY
Late Triassic reservoir rocks are also assumed to consist of prograding coast/delta front deposits, including estuaries and fluvial channels. The play for this reservoir level is shown in figure 33.
In lithostratigraphic terms, this correlates with the De Geerdalen Formation in Svalbard and thin sand-stones uppermost in the Tschermakfjellet Formation (figure 28). Preliminary results from shallow drilling off Kvitøya in 2015 suggest that sandstones depos-ited in the Norian could play an important role as reservoir rocks, and that these lie immediately below a Norian marine shale.
The trap type comprises anticlines and fault blocks. In the upper part of the clinoform systems, wedging out towards the north-west could produce a com-bined stratigraphic and structural trap. Stratigraphic traps could also be developed in fluvial channel systems in the southern part of the play. Small struc-tural traps could have been formed from synsedi-mentary tectonic processes in unconsolidated rocks, as seen at Kvalpynten and Klinkhamaren in Edgeøya. These are regarded in this study as small structures which would lie far below the seismic resolution of the available 2D data.
The source potential is very similar to that for plays in the Early-Middle Triassic, but internal sources are also possible. Again, the most important source rock for this play is the Steinkobbe/Botneheia Formation, as described above. In addition, the possibility exists for internally generated gas from coal measures and much organic plant material in large parts of the sedimentary succession.
An analogous play has been proven in Barents Sea South with both multiphase and gas discoveries.
Figure 33. Extent of the Carnian-Norian play in the mapped area of Barents Sea North.
0˚ 40˚20˚ 60˚
68˚
72˚
76˚
Tromsø
Hammerfest
Vadsø
Kirkenes
Bjørnøya
Svalbard

3 5
GEOLOGICAL ASSESSMENT OF PETROLEUM RESOURCES IN EASTERN PARTS OF BARENTS SEA NORTH 2017
EARLY-MIDDLE JURASSIC PLAY The play (figure 34) with Early-Middle Jurassic reservoir rocks is assumed to consist of prograding coast/delta front deposits, including estuaries and fluvial channels.
In lithographic terms, the play correlates in the northern Barents Sea with the Svenskøya and Kongsøya Formation (figure 28). Parallels can be drawn in the southern part of the area with the Realgrunnen subgroup. Attribute analysis of this subgroup on the Haapet Dome using 3D seismic data has shown the presence here of a well-devel-oped fluvial channel system with sediment input assumed to be clastic from the southeast. These channel systems are very likely to continue north-wards. From Kong Karls Land, the Middle Jurassic has developed with continuous unconsolidated sandstones, and the reservoir quality is thought to be very good.
The trap type comprises large anticlines and small fault blocks, which can occur in large numbers in certain areas.
Where this play is concerned, the source poten-tial will be the same as that for the Late Triassic play. The main source for oil is assumed to be the Steinkobbe/Botneheia Formation, while Palaeozo-ic source rocks and other Triassic source rocks have a greater potential for gas.
Analogous plays in Barents Sea South have been proven for both oil and gas. Discoveries in the play form part of both the Goliat and Snøhvit fields.
Figure 34. Extent of the Early-Middle Jurassic play in the mapped area of Barents Sea North.
0˚ 40˚20˚ 60˚
68˚
72˚
76˚
Tromsø
Hammerfest
Vadsø
Kirkenes
Bjørnøya
Svalbard
3 6
GEOLOGICAL ASSESSMENT OF PETROLEUM RESOURCES IN EASTERN PARTS OF BARENTS SEA NORTH 2017
RESOURCE EVALUATION
As mentioned above, the NPD has conducted shallow stratigraphic drilling in the area and the evaluation of these boreholes is continuing. They lie a very considerable distance from exploration wells in the southern Barents Sea. Many parameters used in the resource estimates are therefore highly uncertain. Future exploration drilling in Barents Sea South and in the Russian sector, and more detailed mapping in Barents Sea North, could change the view of ex-pected volume and fluid parameters. In addition to reducing the uncertainty range (see the fact box) for the parameters, future well results will say something about the probability of finding petroleum in the various reservoir levels.
Based on the play analysis described above, expected recoverable resources for the evaluated area of Bar-ents Sea North are calculated to be 1 370 million scm oe. The geological uncertainty in this large and still less evaluated area is reflected by the spread of the resource estimate, from a low of 350 million scm oe (P95) to a high of 2 460 million scm oe (P05). Expect-ed recoverable resources break down into 825 million scm of fluids and 545 billion scm of gas (figure 35).
The balance between oil and gas differs from that in Barents Sea South. While the estimate for the latter area assigns the biggest volume potential to gas (60 per cent), fluid resources are expected to form the greater part in Barents Sea North (60 per cent). Much of this reflects the higher probability of oil-generat-ing source rocks at favourable depths (the Steinkob-be/Botneheia Formation) which could generate a substantial volume. At the same time, the big uncer-tainty range in the estimates shows that knowledge of the area is limited.
Figure 35. Expected (mean) recoverable resources.
Expected value: The average value. This is generally defined as the arithmetic mean of all the outcomes in the statistical distri-bution. It is much used, and has the property that the expected value for various distributions can be summed to give a sum of distributions. Uncertainty: Expresses the range of possible outcomes or results. This can be described in many ways, most often with the aid of a low and a high estimate.
Uncertainty is usually calculated using statistical methods, such as Monte Carlo simulations. High and low uncertainties can then be described with the aid of statistical concepts. Where undiscovered resources are concerned, the NPD generally uses P95 for the low estimate. This means that, given the assumptions applied in the analysis, the probability of a result equal to or larger than the P95 value is 95 per cent. P5 is used for the high estimate, which means a five per cent probability that the result will be equal to or larger than the P5 value.
1600
1400
1200
1000
800
600
400
200
0
Milli
on sc
m oe
1370
825
545
TotalLiquidGas

3 7
GEOLOGICAL ASSESSMENT OF PETROLEUM RESOURCES IN EASTERN PARTS OF BARENTS SEA NORTH 2017
Mapping identified a number of large structural traps in all the plays. The number of these and the geolog-ical properties of the plays mean that the contribu-tion to resources differs between the various plays (figure 38).
The results show that the plays with Triassic reser-voirs make the biggest contribution to the resource potential, with no less than 56 per cent of the area’s overall recoverable resources (figure 37). This partic-ularly reflects the probability of discovering oil in the Triassic plays.
Furthermore, the estimates show that only three per cent of total recoverable resources are expected to lie in Early Carboniferous reservoirs (figure 37). This is both because the reservoir properties are expected to be challenging, and because the probability of success is low.
Jurassic reservoirs contribute 18 per cent of the total recoverable resources. While reservoir properties
here are expected to be good, great uncertainty prevails about the retention of hydrocarbons
over time because reservoirs lie at shallow depths.
Upper Carboniferous-Permian carbonates contribute 23 per cent, but reservoir quality in particular could be challenging. Neverthe-less, secondary porosity could have helped to preserve reservoir quality.
Figure 36. Uncertainty range for the estimated resources. Rear column: in place. Front column: recoverable.
Figure 37. Total recoverable resources by geological epoch.
18%
23%
30%3 %
23%
3%
Lower-Middle Jurassic Upper Triassic Lower-Middle Triassic
Lower Triassic Late Carboniferous- Permian Lower Carboniferous
1600
1400
1200
1000
800
600
400
200
0
2500
2000
1500
4000
3500
3000
1000
500
0
1600
1400
1200
1000
800
600
400
200
0
2500
2000
1500
4000
3500
5000
4500
5500
3000
1000
500
0
1370
825
545
1370
825
545
TotalLiquidGasTotal
LiquidGas
TotalLiquidGas
TotalLiquidGas
Milli
on sc
m oe
Milli
on sc
m oe
Milli
on sc
m oe
Milli
on sc
m oe

3 8
GEOLOGICAL ASSESSMENT OF PETROLEUM RESOURCES IN EASTERN PARTS OF BARENTS SEA NORTH 2017
SCENARIO XIn addition to the analyses presented above, the NPD has developed a scenario X. This reflects the great uncertainty over the resource outcome in an unopened area, and the possibility that the outcome will be at the extreme end of the NPD’s resource distribution. In this scenario, an exploration well is drilled. Its results confirm the play with the biggest resource potential (Olenekian, Anisian and Ladinian). The result also lead the expectations to increase for the rock volume in this play. Because of the depen-dence of the Carnian-Norian and Jurassic plays on this source, the play probability rises for these.
The scenario illustrates a possible outcome which should be included in the assessment of the possible consequences of opening the areas for exploration activity. As figure 40 shows, the scenario produces a big change in the resource distribution. That includes an increase in the expected value of the total estimat-ed recoverable resources from 1 370 million scm oe to 2 500 million. Corresponding rises can be seen in the changes to the fluid and gas distributions.
Figure 39 presents the changes in expected value (mean) for recover-able undiscovered resources in the Barents Sea overall – in other words, the expectation in 2016 and its size in May 2017 after including the results for eastern parts of Barents Sea North. As can be seen, includ-ing the latter area leads to a virtual doubling (up 80 per cent) in the resources.
Figure 38 presents the cumulative distribution of the recoverable resources, where the contributions from the various geological epochs/periods (the Triassic plays have been merged) emerges clearly.
2016 2017
3000
2500
2000
1500
1000
500
0
Milli
on sc
m oe
1395
2525
Figure 40. Rear columns: resource distribution based on scenario X. Front columns: the “original” distribution.
Total resources 106 Sm3 oe0 500
1
0,9
0,8
0,7
0,6
0,5
0,4
0,3
0,2
0,1
01000 1500 2000 2500 3000 3500
Recoverable JurassicRecoverable TriassicRecoverable Lower CarboniferousRecoverable Upper Carboniferous-Permian Carbonates
Total resources by play
1600
1400
1200
1000
800
600
400
200
0
2500
2000
1500
4000
3500
3000
1000
500
0
1600
1400
1200
1000
800
600
400
200
0
2500
2000
1500
4000
3500
5000
4500
5500
3000
1000
500
0
1370
825
545
1370
825
545
TotalLiquidGasTotal
LiquidGas
TotalLiquidGas
TotalLiquidGas
Milli
on sc
m oe
Milli
on sc
m oe
Milli
on sc
m oe
Milli
on sc
m oe

3 9
GEOLOGICAL ASSESSMENT OF PETROLEUM RESOURCES IN EASTERN PARTS OF BARENTS SEA NORTH 2017
SUMMARY AND CONCLUSION
Expected recoverable resources in eastern parts of Bar-ents Sea North are calculated to be 1 370 million scm oe, with a downside of 350 million scm oe (P95) and an upside of 2 460 million scm oe (P05). Possible drilling and confirmation of one or more plays will move these estimates towards the higher values. Expected recov-erable resources break down into 825 million scm of fluids and 545 billion scm of gas. The fluid/gas rela-tionship helps to distinguish the area from Barents Sea South. While gas is estimated to represent the largest proportion (60 per cent) in the south, liquids account for the biggest share (60 per cent) here.
Several possible source rocks are found in the mapped area. Their extent and generation potential, particularly for the Steinkobbe/Botneheia Forma-tion, are regarded as favourable for hydrocarbon formation. The possibility of oil is suggested by their burial depth. Six plays have been identified, several of them with very large traps and thereby a substantial potential for reservoir volume. Retention of hydrocar-bons in the traps is an important risk factor. Improved understanding of the burial history will be needed to increase knowledge of gas expansion, maturity considerations and sealing potential in the area.
Geological uncertainty in the area is relatively high, and at its highest for levels older than the Triassic. Completing the analyses of shallow boreholes could help to improve understanding of the individual reservoir levels which have been cored. In addition, more and better seismic data which permit full pros-pect analyses could improve understanding of the resource potential.
General experience with the petroleum sector shows that the total resource potential in an area will be dominated by resources in the biggest deposits. Translated to the eastern parts of Barents Sea North, this means that greater knowledge of the resource potential in the largest structures will be important for further evaluation of the total potential.
Given the present state of knowledge, the Barents Sea has the biggest undiscovered resource potential on the NCS. The area could therefore come to play an important role in maintaining profitable petroleum activities on the NCS for a long time to come.
Sourceshttp://www.npd.no/en/Publications/Resource-Reports/2016/Chapter-3/
http://www.npd.no/en/Topics/Geology/Lithostratigraphy/
Abay, T B, Karlsen, D A and Pedersen, J H, (2014): “Source Rocks at Svalbard: An Overview of
Jurassic and Triassic Formations and Comparison with Offshore Barents Sea Time Equivalent
Source Rock Formations”. Search and Discovery Article no 30372 (2014). Posted 13 October
2014.
Henriksen, E, Bjørnseth, H M, Hals, T K, Heide, T, Kiryukhina, T, Kløvjan, O S, Larssen, G B,
Ryseth, A E, Rønning, K, Sollid, K and Staupakova, A (2011): “Uplift and erosion of the greater
Barents Sea: impact on prospectivity and petroleum systems”. Geological Society, London,
Memoirs 2011, vol 35, pp 271-281.
Knies, J, Matthiessen, J, Vogt, C, Laberg, J S, Hjelstuen, B O, Smelror, M, Larsen, E, Andreassen,
K, Eidvin, T and Vorren, T O (2009): “The Plio-Pleistocene glaciation of the Barents
Sea–Svalbard region: a new model based on revised chronostratigraphy”. Elsevier. Quaternary
Science Reviews xxx (2009), pp 1–18.
Larssen, G B, Olaussen, S, Helland-Hansen, W, Johannesen, E P, Nøttvedt, A, Riis, F, Rismyhr, B,
Smelror, M and Worsley, D (in preparation): “Upper Triassic to Lower Cretaceous strata of
the Kong Karls Land archipelago, Svalbard High Arctic Norway. A key to the Mesozoic basin
evaluation and resource evaluation in the northern Barents Sea”.
Lerch, B, Karlsen, D A, Matapour, Z, Seland, R and Backer-Owe, K (2016): “Organic geochemis-
try of Barents Sea petroleum: thermal maturity and alteration and mixing processes in oils and
condensates”. Journal of Petroleum Geology. vol 39, issue 2
April 2016, pp 125–148.
Lundschien, B A, Høy, T and Mørk, A (2014): “Triassic hydrocarbon potential in the northern
Barents Sea: integrating Svalbard and stratigraphic core data”. Norwegian Petroleum
Directorate
Bulletin, 11, pp 3–20.
Ohm, S E, Karlsen, D A and Austin, J F (2008): “Geochemically driven exploration models
in uplifted areas: examples from the Norwegian Barents Sea”. AAPG Bulletin, vol 92, no 9
(September 2008), pp 1191-1223.
Ramberg, I B, Bryhni, I and Nøttvedt, A (2007): “Landet blir til”. Norsk Geologisk Foreining.
Riis, F and Fjeldskaar, W (1992): “On the magnitude of the Late Tertiary and Quaternary
erosion and its significance for the uplift of Scandinavia and the Barents Sea”. In Larsen, R M &
Larsen, B T (eds): Structural and Tectonic Modelling and its Application to Petroleum Geology.
Norwegian Petroleum Society. Graham & Trotman, London (in press).
Smelror, M, Petrov, O V, Larsen, G B and Werner, S (eds) (2009): Atlas — Geological History of
the Barents Sea, Geological Survey of Norway, Trondheim, 135 pp.
Stemmerik, L, Worsley, D, (2005): “30 years on - Arctic Upper Palaeozoic stratigraphy, deposi-
tional evolution and hydrocarbon prospectivity”. Norwegian Journal of Geology/Norsk
Geologisk Forening. 2005, vol 85, issue 1/2, pp 151-168.
Professor Olav Hanssens vei 10P O Box 600
NO-4003 StavangerTelephone: +47 51 87 60 00
E-mail: [email protected]
Published by the Norwegian Petroleum DirectoratePrinted by: Kai Hansen, StavangerISBN 978-82-7257-232-6
GEOLOGICAL ASSESSMENT OF PETROLEUM RESOURCES IN EASTERN PARTS OF BARENTS SEA NORTH 2017