Embed Size (px)
Citation preview
Geological record of climate changeGeological record of climate change
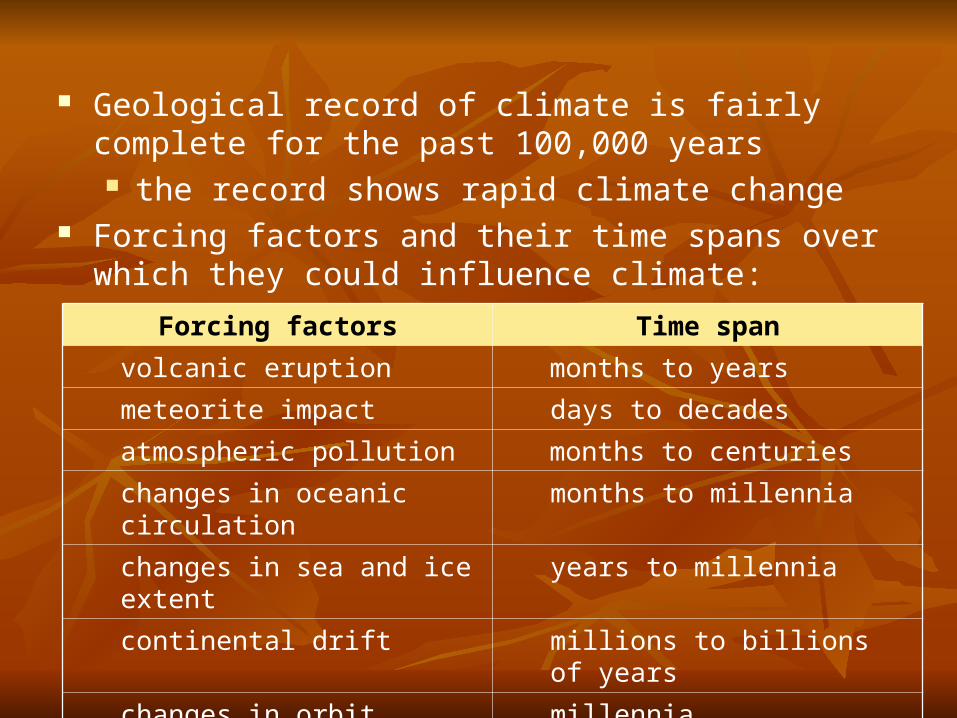
Geological record of climate is fairly complete for the past 100,000 years the record shows rapid climate change
Forcing factors and their time spans over which they could influence climate:
Forcing factors Time span
volcanic eruption months to years
meteorite impact days to decades
atmospheric pollution months to centuries
changes in oceanic circulation months to millennia
changes in sea and ice extent years to millennia
continental drift millions to billions of years
changes in orbit millennia
changes in the Sun’s energy years to billions of years
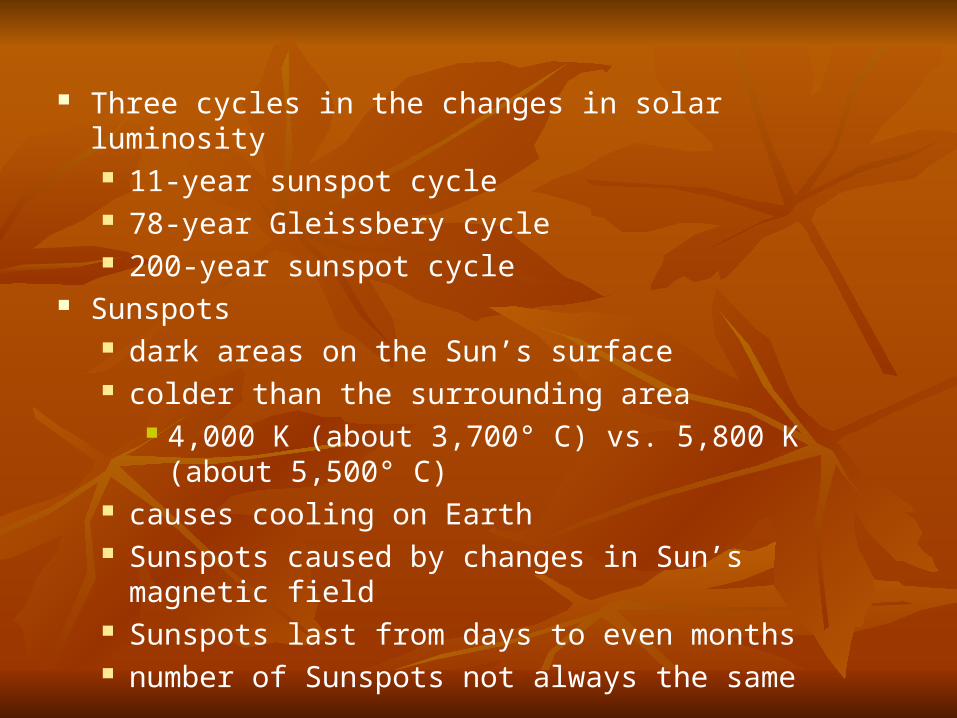
Three cycles in the changes in solar luminosity 11-year sunspot cycle 78-year Gleissbery cycle 200-year sunspot cycle
Sunspots dark areas on the Sun’s surface colder than the surrounding area
4,000 K (about 3,700° C) vs. 5,800 K (about 5,500° C)
causes cooling on Earth Sunspots caused by changes in Sun’s magnetic field Sunspots last from days to even months number of Sunspots not always the same
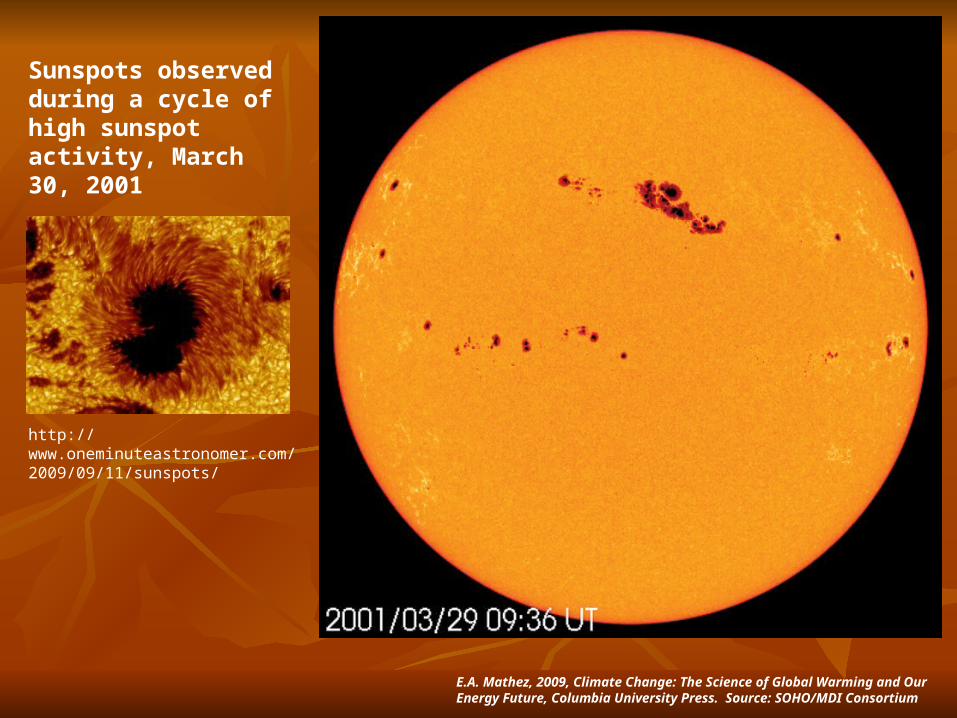
Sunspots observed during a cycle of high sunspot activity, March 30, 2001
E.A. Mathez, 2009, Climate Change: The Science of Global Warming and Our Energy Future, Columbia University Press. Source: SOHO/MDI Consortium
http://www.oneminuteastronomer.com/2009/09/11/sunspots/

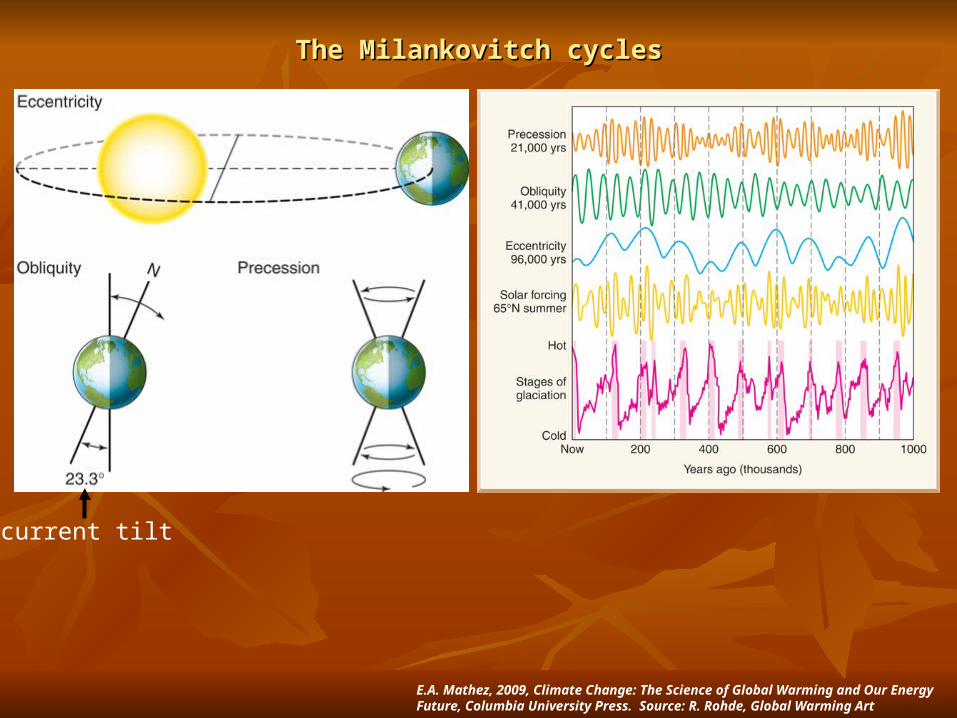
Variations in Earth’s orbit around the Sun has influence on Earth’s climate on a scale of tens of thousands to hundreds of thousands of years Obliquity (tilt), Eccentricity, and Precession (wobble)
Obliquity greater the tilt, the colder the winters and the hotter
the summer affects Northern Hemisphere much more than
Southern Hemisphere because more land mass at the former
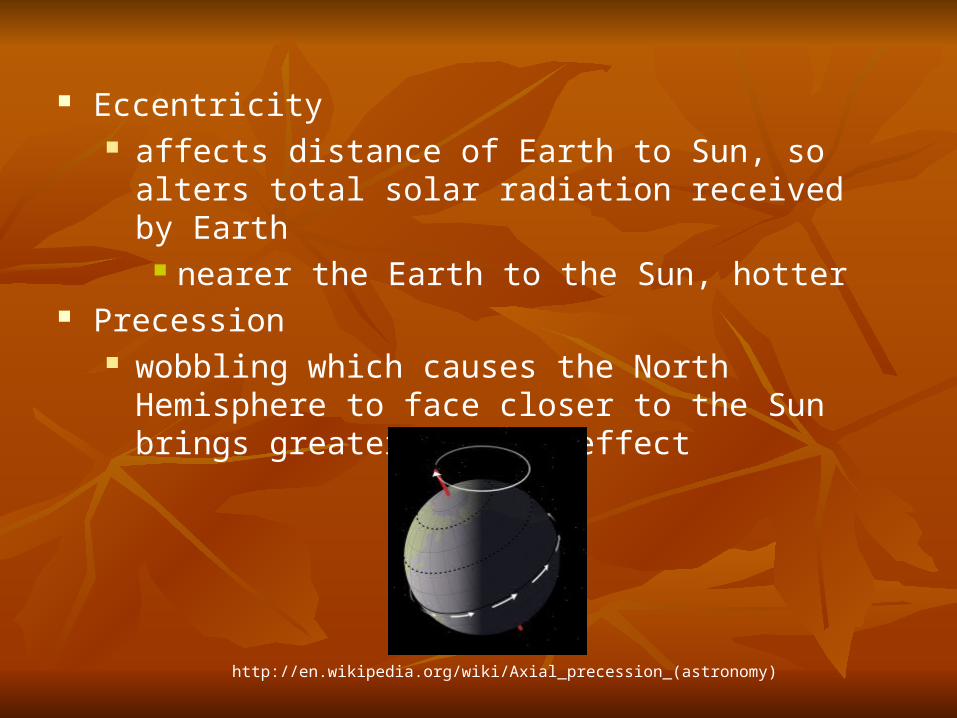
Eccentricity affects distance of Earth to Sun, so alters total solar
radiation received by Earth nearer the Earth to the Sun, hotter
Precession wobbling which causes the North Hemisphere to face
closer to the Sun brings greater warming effect
http://en.wikipedia.org/wiki/Axial_precession_(astronomy)
E.A. Mathez, 2009, Climate Change: The Science of Global Warming and Our Energy Future, Columbia University Press. Source: R. Rohde, Global Warming Art
21.5 to 24.5
current tilt
The Milankovitch cyclesThe Milankovitch cycles

Variations in Earth’s orbit has much less effect on observed warming today than anthropogenic effects without greenhouse gases, the variations in Earth’s
orbit are actually causing global cooling reducing climate forcing 0.035 Wm-2 per decade
with greenhouse gases, the climate forcing increases 0.2 Wm-2 per decade
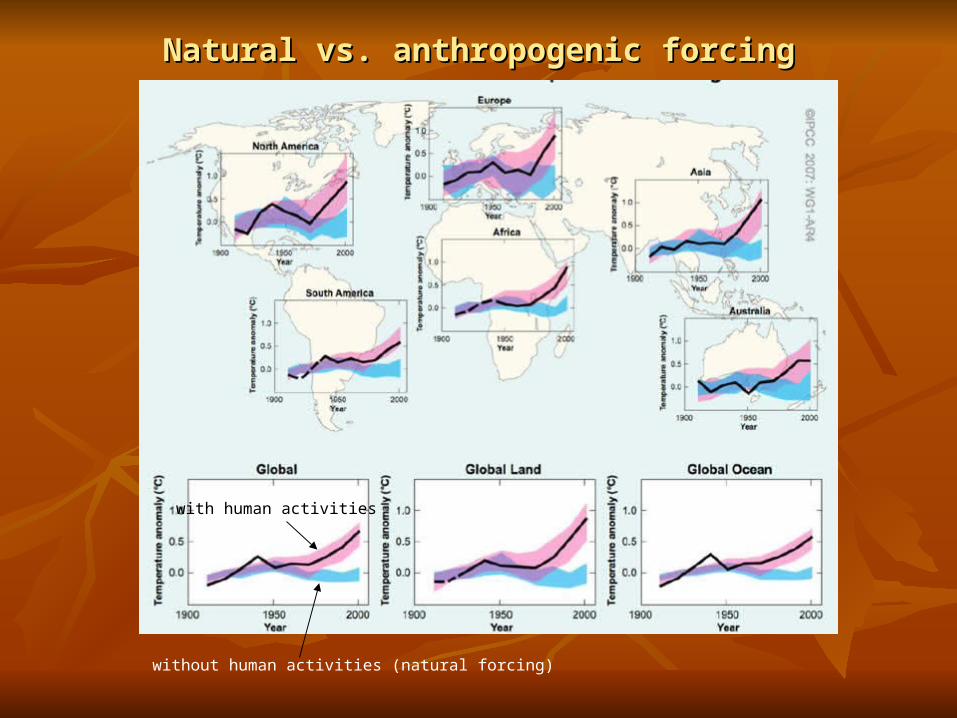
Natural vs. anthropogenic forcingNatural vs. anthropogenic forcing
with human activities
without human activities (natural forcing)
Climate record in Greenland iceClimate record in Greenland ice
In 1989, two teams, one European and one American, begin drilling for ice cores in Greenland
In 1993, they obtained two complete drill cores through the entire ice sheet American team drilled down to 3,053 meters European team drilled down to 3,029 meters
These ice cores contained the continuous geological record of climate for the past 110,000 years

The location of Greenland Ice Sheet drill sites
E.A. Mathez, 2009, Climate Change: The Science of Global Warming and Our Energy Future, Columbia University Press. Source: Geological Survey of Greenland

Greenland ice core
E.A. Mathez, 2009, Climate Change: The Science of Global Warming and Our Energy Future, Columbia University Press. Source: NOAA
Ice forms as the snow laid down each year compacts and recrystallizes into ice during their burial by younger layers of snow
Newly fallen snow is porous and mixed with air As the snow recrystallizes, some of the air is trapped to
form bubbles in the ice dust also accumulates, so the ice holds samples of
ancient atmosphere and its dust Greenland is the best place to obtain ice cores because
of higher accumulation of snowfall in Greenland 20 cm a year at Greenland 2 cm a year at Antarctica
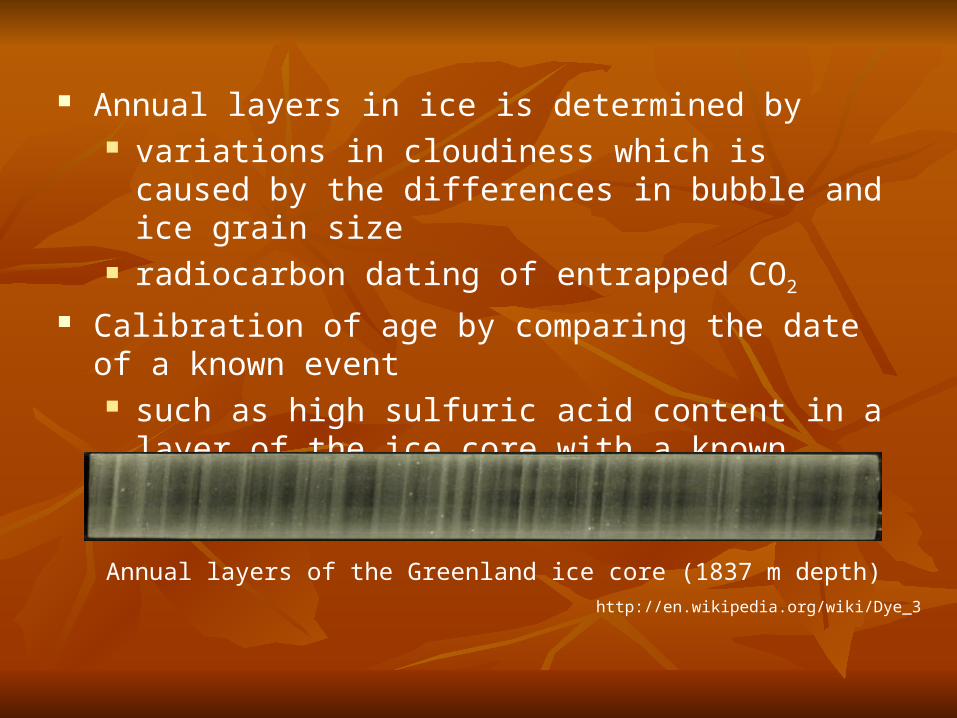
Annual layers in ice is determined by variations in cloudiness which is caused by the
differences in bubble and ice grain size radiocarbon dating of entrapped CO2
Calibration of age by comparing the date of a known event such as high sulfuric acid content in a layer of the ice
core with a known volcanic eruption date
Annual layers of the Greenland ice core (1837 m depth)http://en.wikipedia.org/wiki/Dye_3
The site at Greenland was chosen for ice core drilling because close to ice drainage divide (where ice flows in
opposite directions) less mixing of annual layers
bedrock is relatively flat important because when ice flows, it folds and
fractures, disrupting/mixing the annual layers
Ice coresIce cores
18O (heavy isotope) and 16O (light isotope) 18O is 0.2% of O2, the rest (99.8%) is 16O
When liquid water evaporates to vapour or when vapour condenses to liquid water, 18O is enriched in the liquid and 16O is enriched in the
vapour As water-laden air flows northward and cools, it loses
more and more of vapour as precipitation, so increasingly more 16O but increasingly less 18O in the air
In cool periods, ice formed in Greenland has more 16O than the ice formed during warm periods air that provides the snow to Greenland loses more of
its water before it reaches Greenland during cold periods than during warm periods
The concentration of Ca, Na, and Cl are also indicators of past climate
Ca is present mainly as carbonate and represents atmospheric dust
In cool periods, the air circulation system scours dust from a wider
land area, so more dust present in the air air is drier, leading to more drier (arid) regions and
more dust to be scoured by air Na and Cl are from the ocean as sea salt Both dust and sea salt reach Greenland in the late winter
to early spring
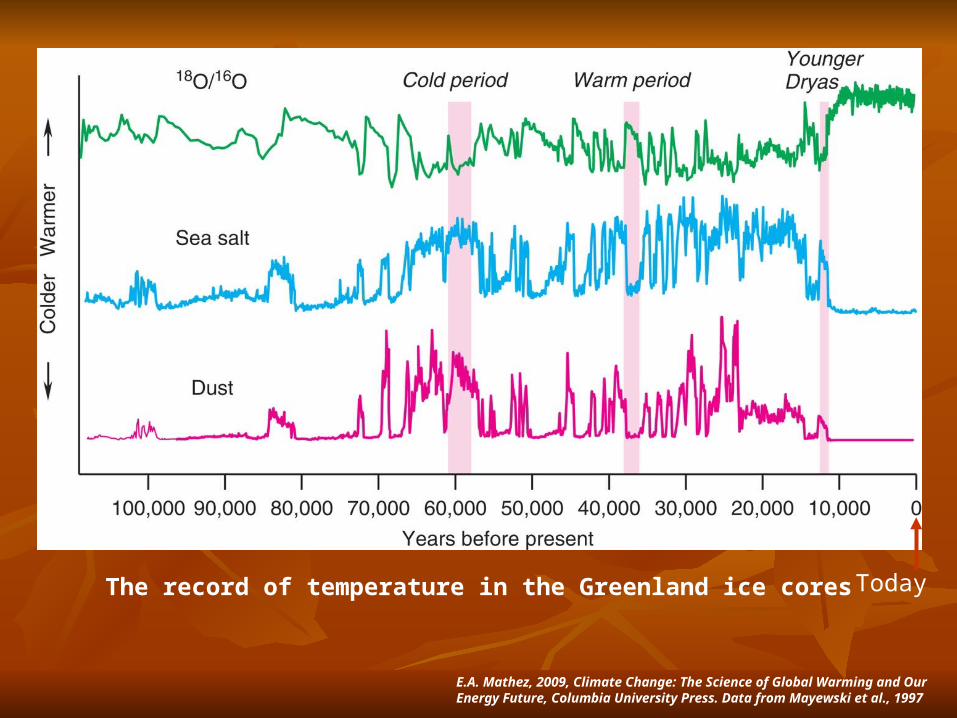
The record of temperature in the Greenland ice cores
E.A. Mathez, 2009, Climate Change: The Science of Global Warming and Our Energy Future, Columbia University Press. Data from Mayewski et al., 1997
Today
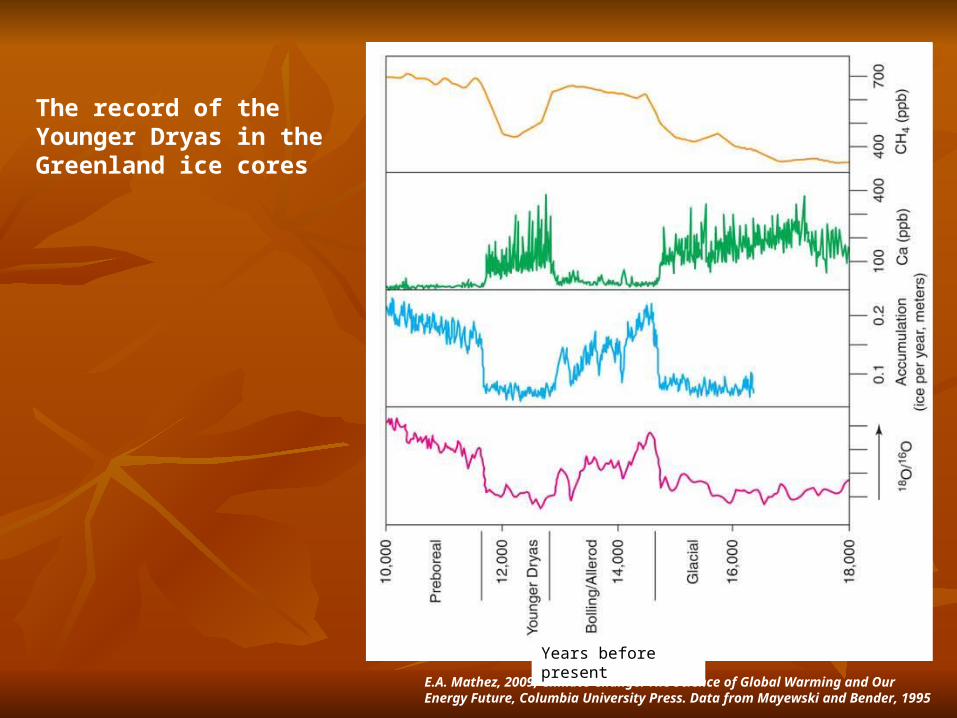
The record of the Younger Dryas in the Greenland ice cores
E.A. Mathez, 2009, Climate Change: The Science of Global Warming and Our Energy Future, Columbia University Press. Data from Mayewski and Bender, 1995
Years before present
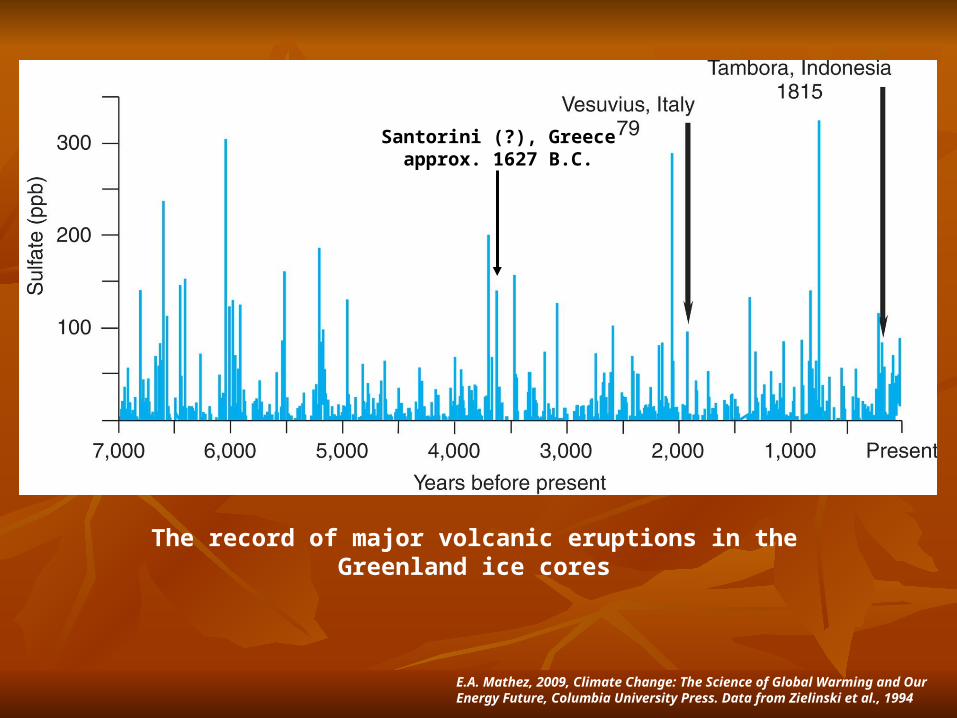
The record of major volcanic eruptions in the Greenland ice cores
E.A. Mathez, 2009, Climate Change: The Science of Global Warming and Our Energy Future, Columbia University Press. Data from Zielinski et al., 1994
Santorini (?), Greeceapprox. 1627 B.C.
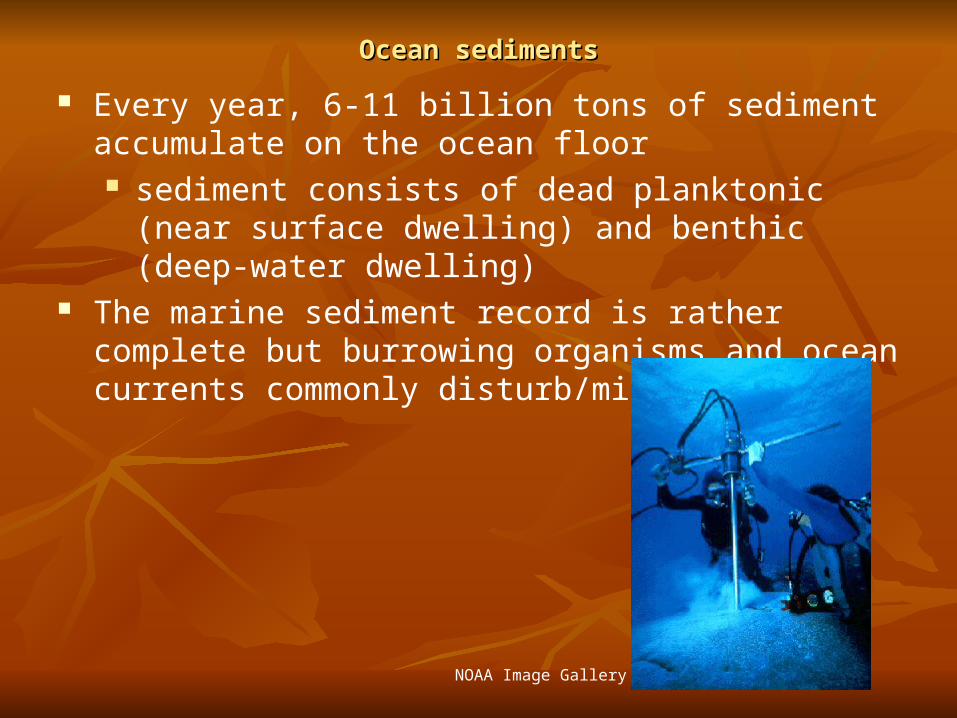
Ocean sedimentsOcean sediments
Every year, 6-11 billion tons of sediment accumulate on the ocean floor sediment consists of dead planktonic (near surface
dwelling) and benthic (deep-water dwelling) The marine sediment record is rather complete but
burrowing organisms and ocean currents commonly disturb/mix the layers
NOAA Image Gallery
Climate conditions can be deduced from the composition, abundance, and characteristics of the fossils in the sediment 18O:16O ratio in the hard shells of sea-dwelling
creatures high ratio means high evaporation rates (leaving
18O behind in the sea), thus, indicating warm period higher dust (from winds) content indicate cool periods
cool periods indicated by low humidity and stronger winds which scours more dust

Foraminifera, or forams, (protozoa) and diatoms (algae) are commonly used as microbial climate proxies
They are both planktonic (near surface-dwelling) or benthic (bottom- dwelling) creatures
Foram shells are made up of calcium carbonate (CaCO3) while diatom shells are composed of silicon dioxide (SiO2) Their shell remains are taken from sediments and
analyzed warmer water tends to evaporate off more of the
lighter isotopes (16O), so shells grown in warmer waters will be enriched in the heavier isotope (18O)
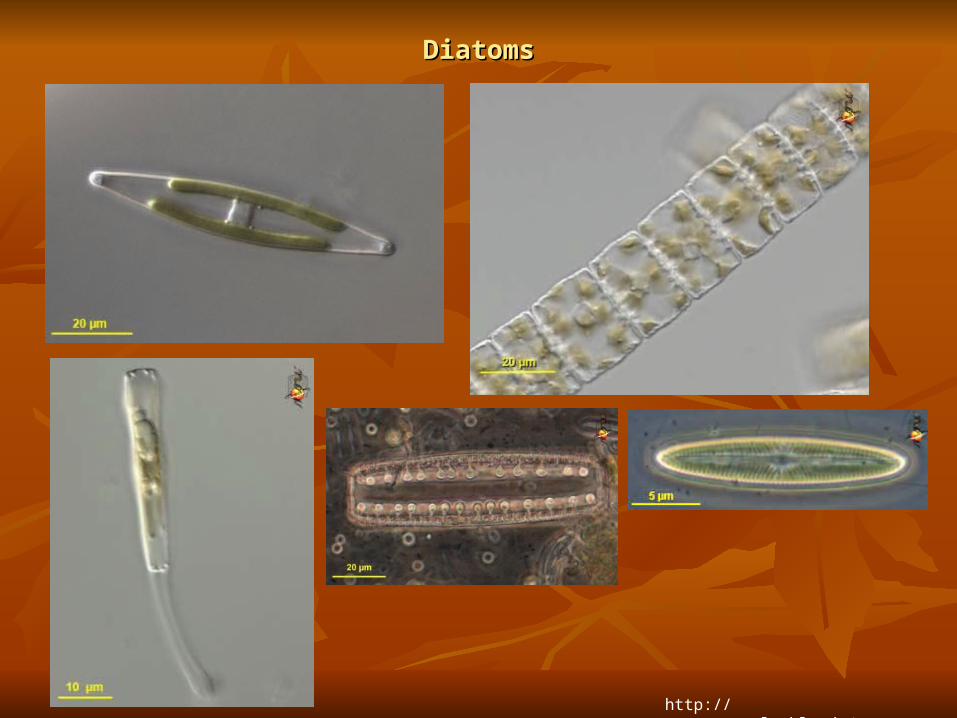
DiatomsDiatoms
http://starcentral.mbl.edu/microscope

ForamsForams
http://starcentral.mbl.edu/microscope/
The abundance of certain microorganisms is an indicator of sea surface temperature determine the foram and diatom population dynamics
Relative abundance and species composition may indicate environmental conditions
Warmer weather will usually cause organisms to proliferate (population explosion)
Each species has a particular set of ideal growing conditions, so species composition (or combination) at a particular site at a particular time may indicate past environmental conditions
Lake sedimentsLake sediments
Sediments in mid-latitudes lake high carbonate contents correlate with extensive
global ice volumes, reflecting low quantities of water entering the lake and more brackish (salty) lake water
low carbonate correlate with warm periods, when water level of lakes was high and the water fresher

Varves alternating light and dark layers in sediment in lake
valleys In winter, lake surface is frozen, so no sediments
enter water and microscopic organisms die from lack of light for photosynthesis. Fine clay still suspended in the lake will settle and accumulate at the lake bottom, producing a dark layer
In spring, sediments and nutrients (from runoff) enters the lake. The sediment settle and accumulate at the lake bottom as a light layer
Thickness of dark layers reflect summer biological activity/productivity
Thickness of light layers reflect the amount of meltwater entering the lake
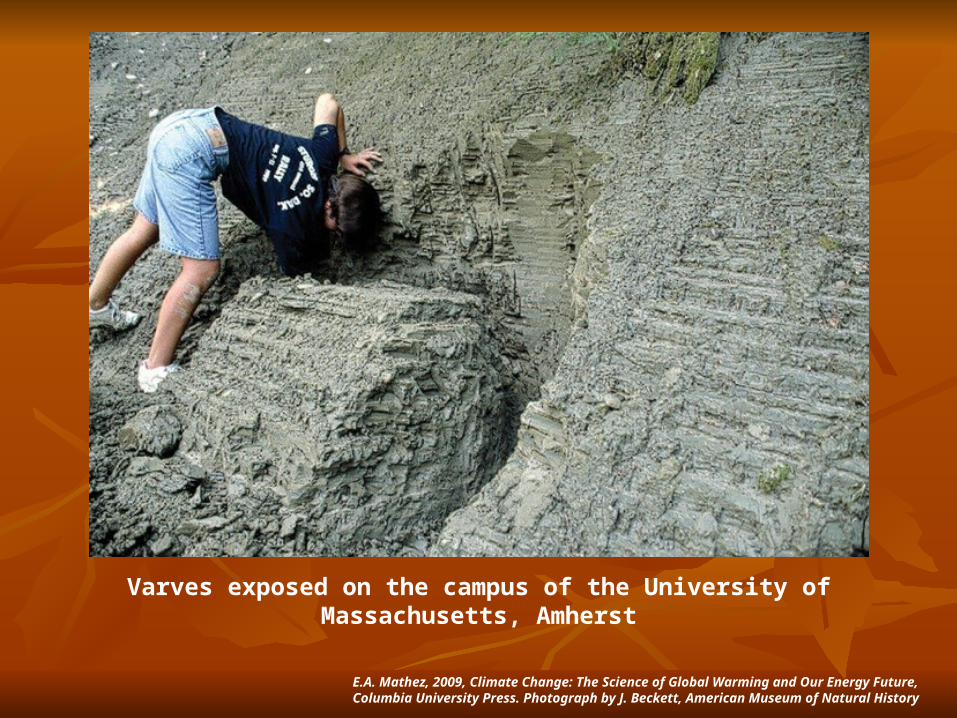
Varves exposed on the campus of the University of Massachusetts, Amherst
E.A. Mathez, 2009, Climate Change: The Science of Global Warming and Our Energy Future, Columbia University Press. Photograph by J. Beckett, American Museum of Natural History
CoralsCorals
Corals can be used to determine short term climate changes
Corals build skeletons by extracting Ca and carbonate from sea water
Corals formed during winter and summer have different densities
Ratio of 18O:16O reflect seawater temperature Concentration of trace elements (such as Cd and Ba)
can be analyzed to determine upwelling and changes in windblown sediment or river
runoff entering the ocean high Cd and Ba indicate increased upwelling of
water
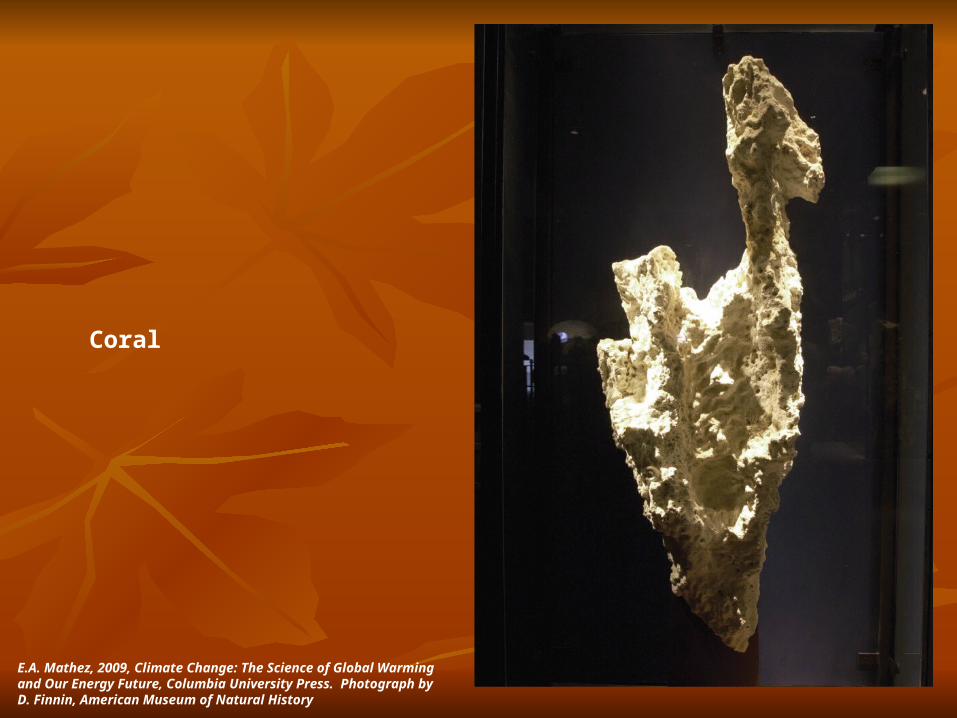
Coral
E.A. Mathez, 2009, Climate Change: The Science of Global Warming and Our Energy Future, Columbia University Press. Photograph by D. Finnin, American Museum of Natural History
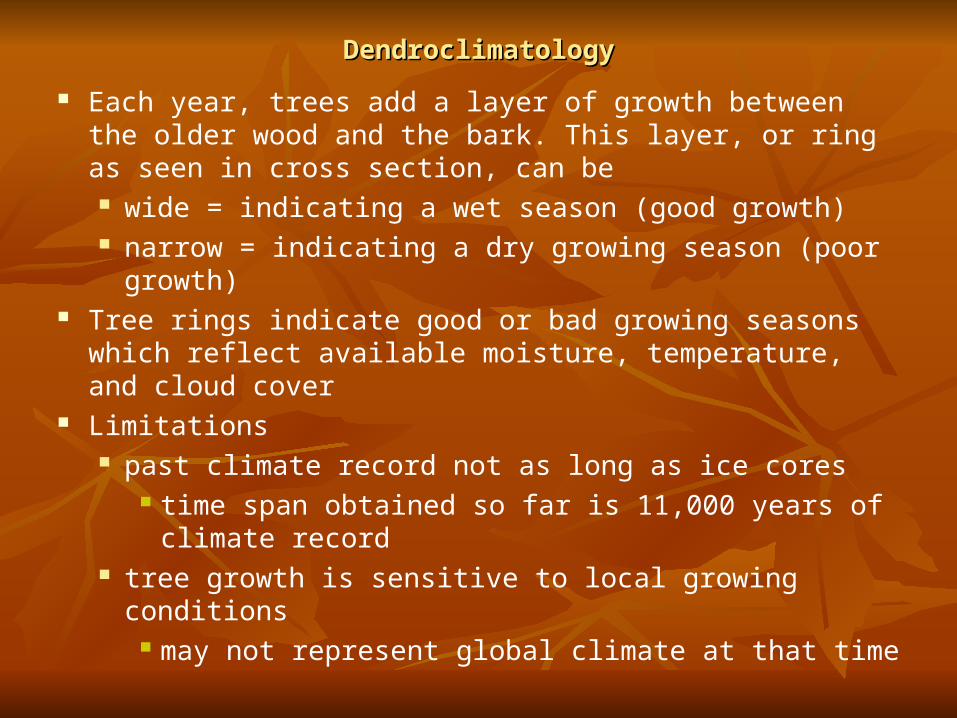
DendroclimatologyDendroclimatology
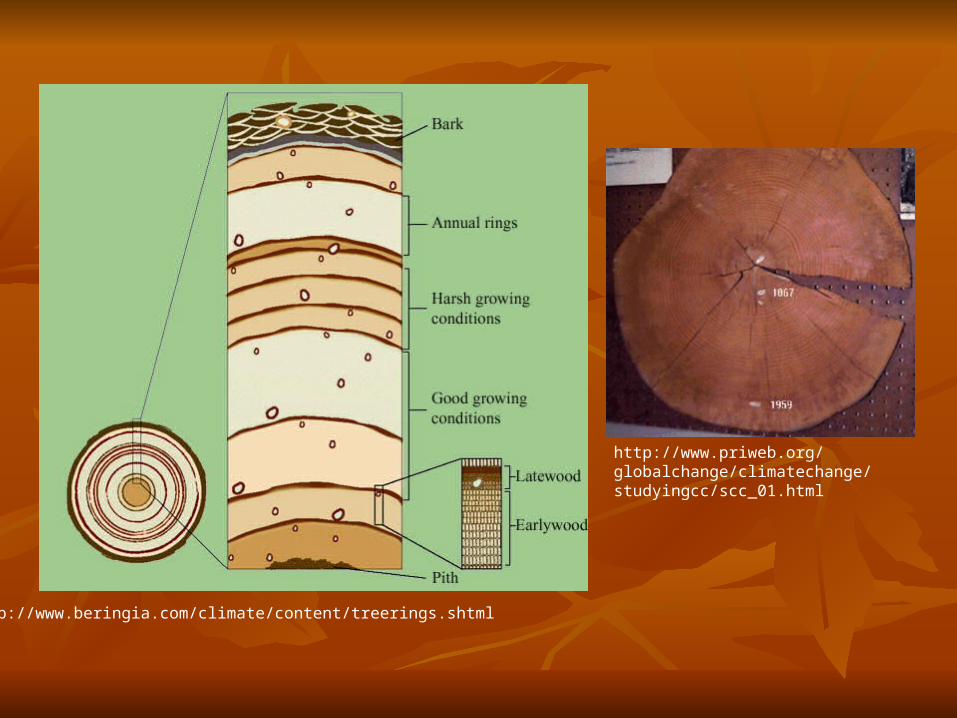
Each year, trees add a layer of growth between the older wood and the bark. This layer, or ring as seen in cross section, can be wide = indicating a wet season (good growth) narrow = indicating a dry growing season (poor
growth) Tree rings indicate good or bad growing seasons which
reflect available moisture, temperature, and cloud cover Limitations
past climate record not as long as ice cores time span obtained so far is 11,000 years of
climate record tree growth is sensitive to local growing conditions
may not represent global climate at that time
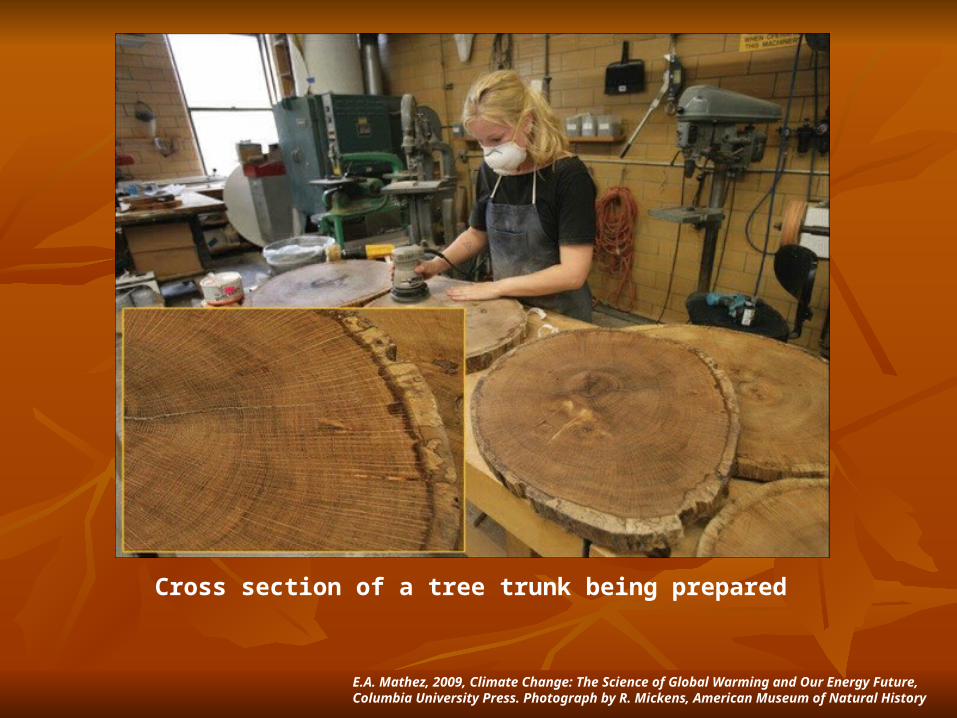
Cross section of a tree trunk being prepared
E.A. Mathez, 2009, Climate Change: The Science of Global Warming and Our Energy Future, Columbia University Press. Photograph by R. Mickens, American Museum of Natural History
http://www.priweb.org/globalchange/climatechange/studyingcc/scc_01.html
http://www.beringia.com/climate/content/treerings.shtml
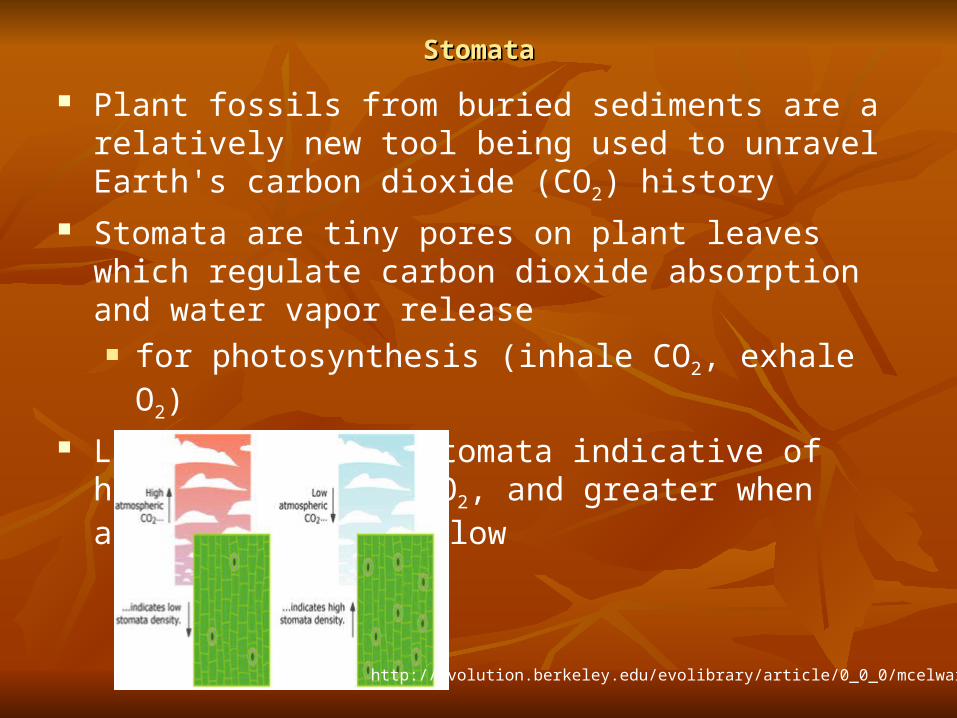
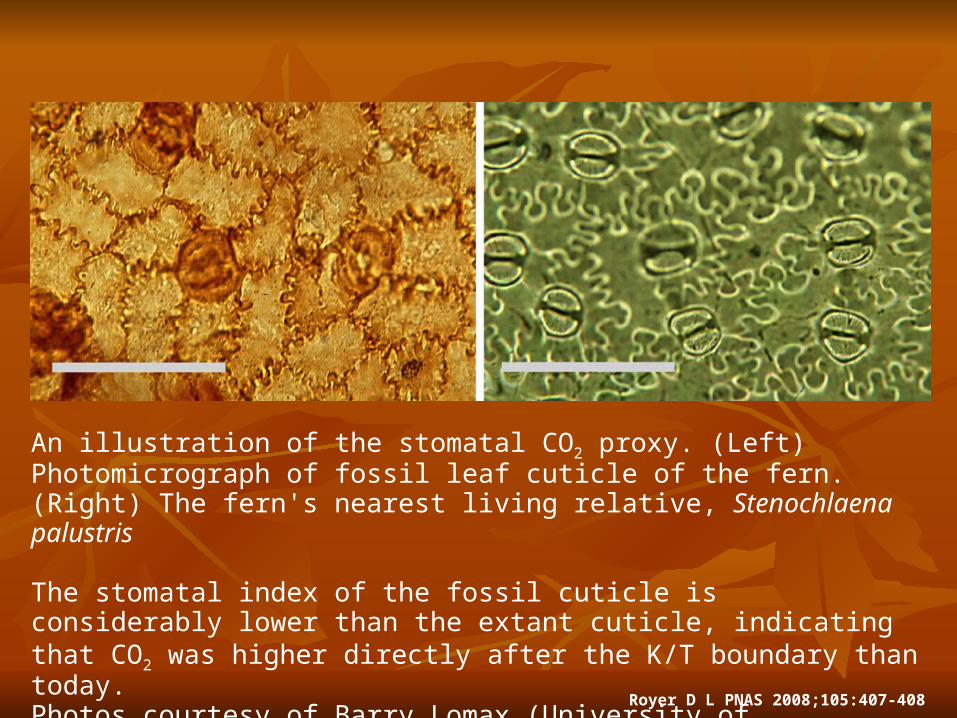
StomataStomata
Plant fossils from buried sediments are a relatively new tool being used to unravel Earth's carbon dioxide (CO2) history
Stomata are tiny pores on plant leaves which regulate carbon dioxide absorption and water vapor release for photosynthesis (inhale CO2, exhale O2)
Lesser number of stomata indicative of high atmospheric CO2, and greater when atmospheric CO2 is low
http://evolution.berkeley.edu/evolibrary/article/0_0_0/mcelwain_03
Royer D L PNAS 2008;105:407-408
An illustration of the stomatal CO2 proxy. (Left) Photomicrograph of fossil leaf cuticle of the fern. (Right) The fern's nearest living relative, Stenochlaena palustris
The stomatal index of the fossil cuticle is considerably lower than the extant cuticle, indicating that CO2 was higher directly after the K/T boundary than today.Photos courtesy of Barry Lomax (University of Sheffield, Sheffield, U.K.)(Scale bars, 10 μm)
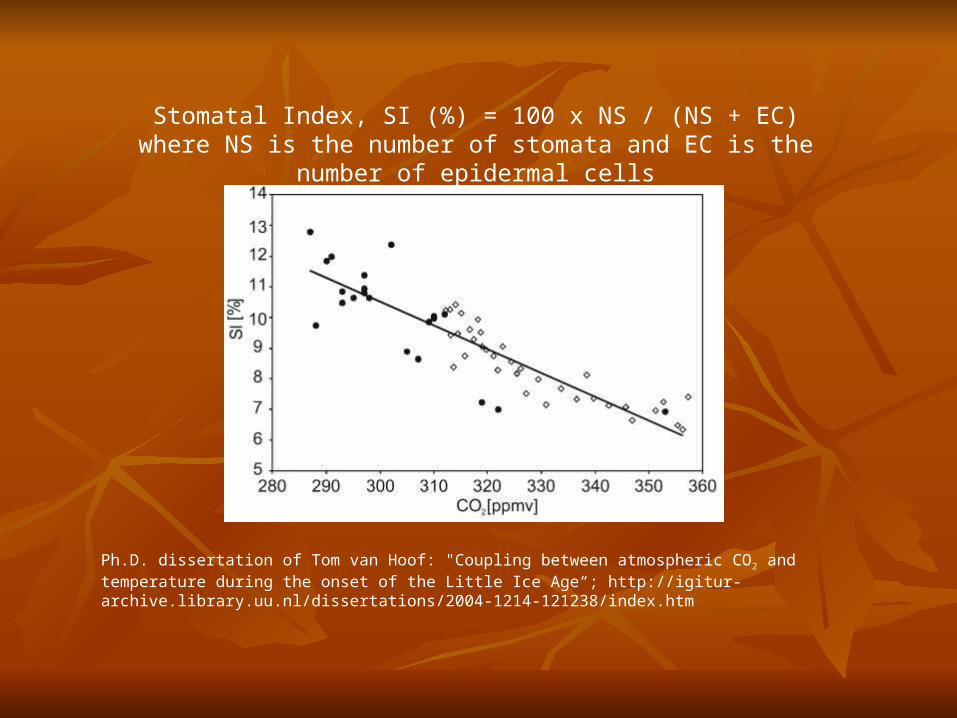
Ph.D. dissertation of Tom van Hoof: "Coupling between atmospheric CO2 and temperature during the onset of the Little Ice Age“; http://igitur-archive.library.uu.nl/dissertations/2004-1214-121238/index.htm
Stomatal Index, SI (%) = 100 x NS / (NS + EC)where NS is the number of stomata and EC is the number of epidermal cells
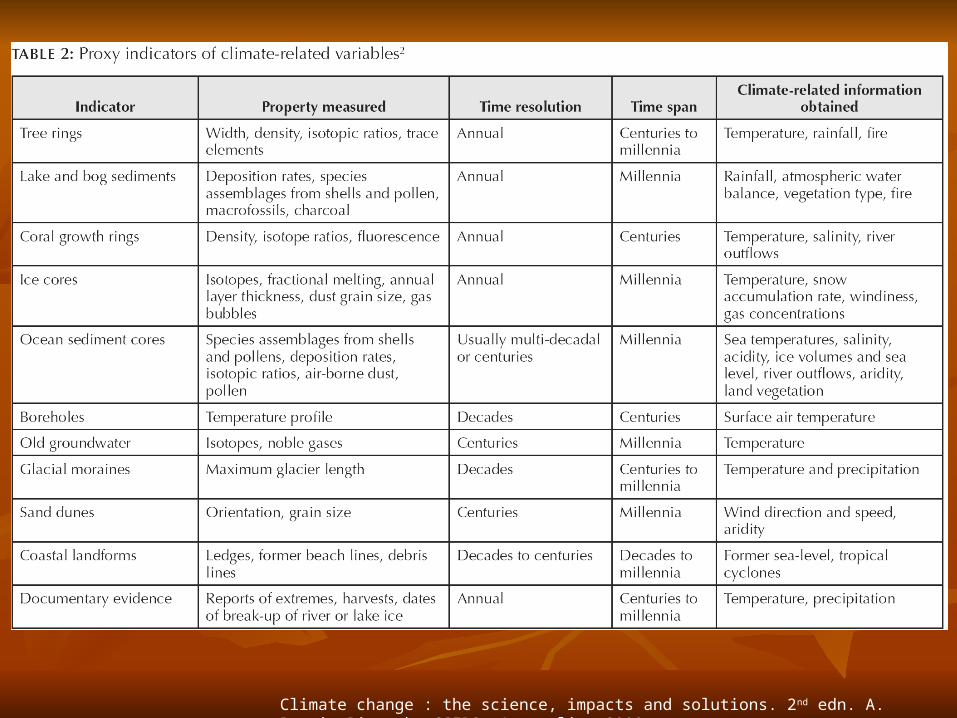
Climate change : the science, impacts and solutions. 2nd edn. A. Barrie Pittock, CSIRO, Australia, 2009
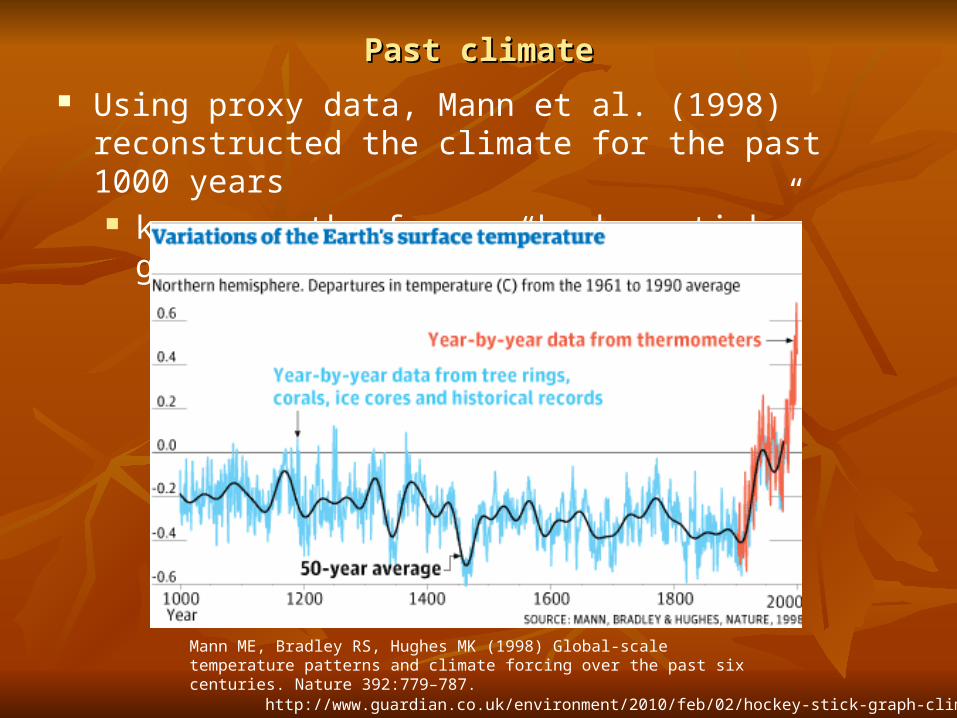
Past climatePast climate
Using proxy data, Mann et al. (1998) reconstructed the climate for the past 1000 years known as the famous “hockey stick” graph
Mann ME, Bradley RS, Hughes MK (1998) Global-scale temperature patterns and climate forcing over the past six centuries. Nature 392:779–787.
http://www.guardian.co.uk/environment/2010/feb/02/hockey-stick-graph-climate-change
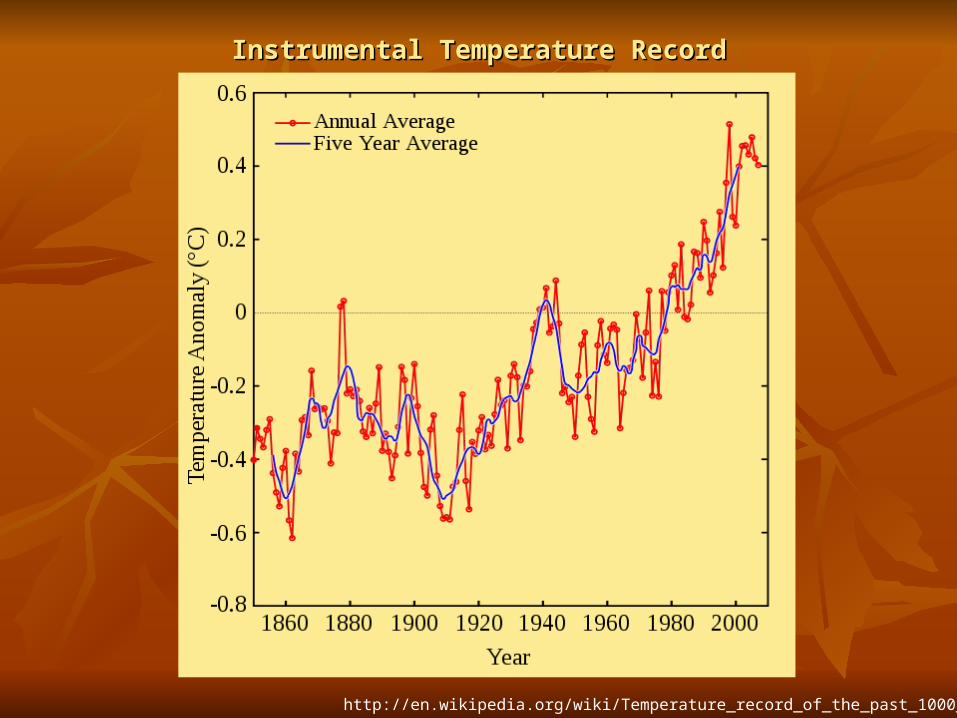
Instrumental Temperature RecordInstrumental Temperature Record
http://en.wikipedia.org/wiki/Temperature_record_of_the_past_1000_years
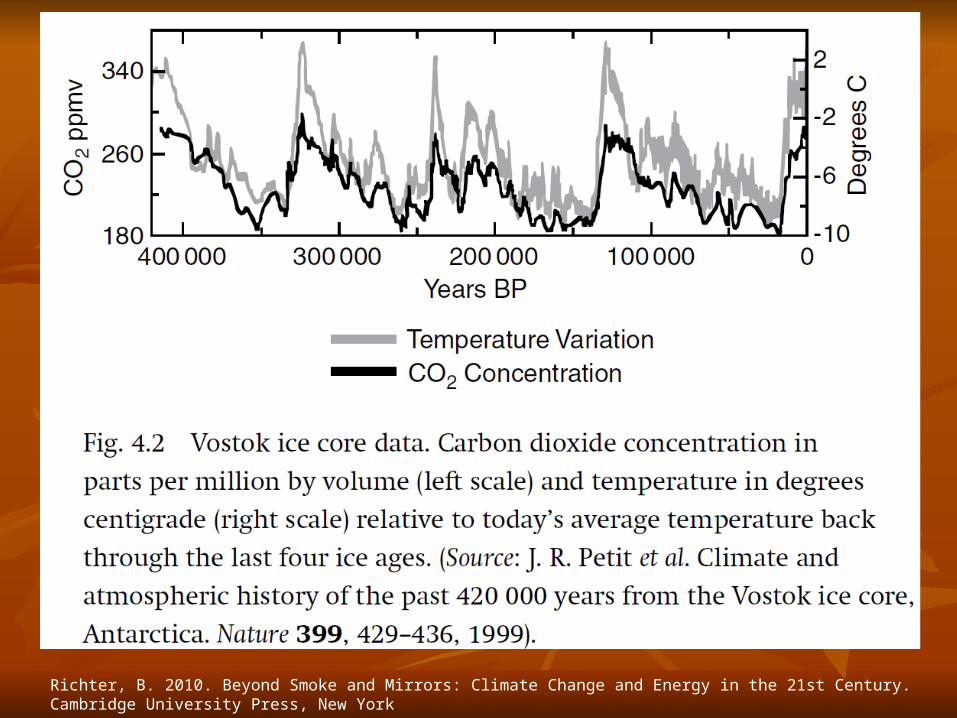
Richter, B. 2010. Beyond Smoke and Mirrors: Climate Change and Energy in the 21st Century. Cambridge University Press, New York

http://motls.blogspot.com/2006/07/carbon-dioxide-and-temperatures-ice.html
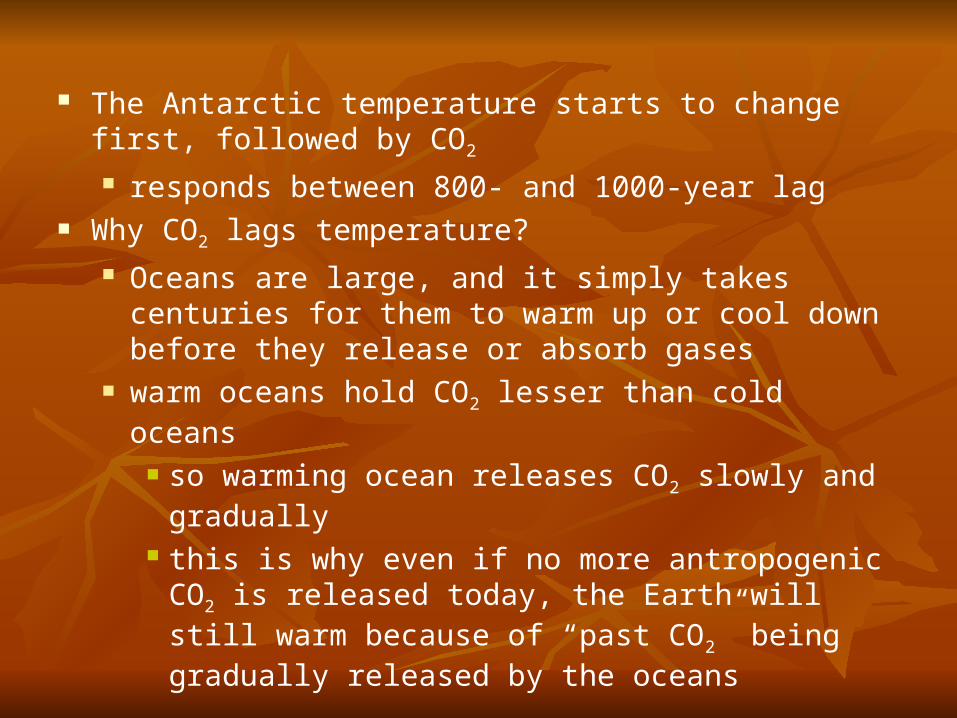
The Antarctic temperature starts to change first, followed by CO2
responds between 800- and 1000-year lag Why CO2 lags temperature?
Oceans are large, and it simply takes centuries for them to warm up or cool down before they release or absorb gases
warm oceans hold CO2 lesser than cold oceans
so warming ocean releases CO2 slowly and gradually
this is why even if no more antropogenic CO2 is released today, the Earth will still warm because of “past CO2” being gradually released by the oceans
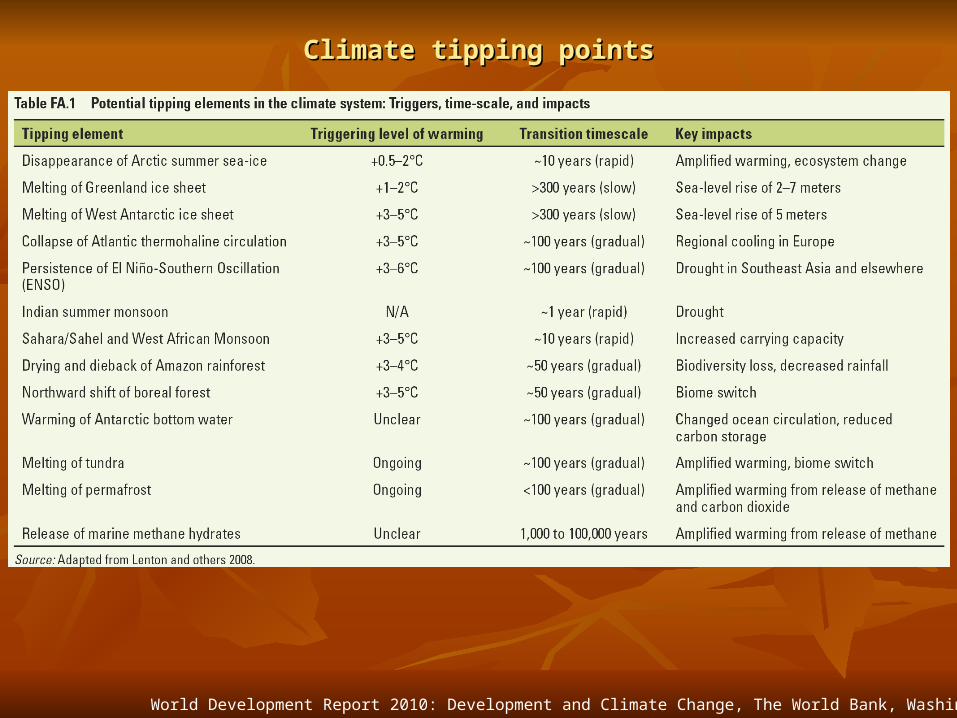
Climate tipping pointsClimate tipping points
World Development Report 2010: Development and Climate Change, The World Bank, Washington, 2010