Embed Size (px)
Citation preview
Geology 101 Name(s):
Lab 9: Streams and floods Geomorphology is the study of the way in which the environment is continually reshaping the Puget Sound (and the world's) landscape. Running water is a major shaper of the land. Water on land is divided into two components: groundwater, which is underground (and we will study at a later date) and surface water, which includes rivers and lakes. Running surface water in rivers and streams can be a depositional or erosional force (sometimes both simultaneously). The grain size terms you will use in this lab are: clay, silt, sand, gravel (which is both pebble and cobble) and boulder.
The slope of a streambed is important in determining the stream’s speed (velocity). Slope gradients can be expressed in two ways: degrees off of horizontal and percent grades. The former is used typically in research science, and the latter is used primarily by civil and environmental engineers. They are calculated in different ways:
gradient (degrees) = tan!1
elevationgain
lateral distan ce
"
# $ %
&
gradient (percent) =
elevationgain
lateral distance!100%
Note that, for any given slope, you will get two different gradients depending on which equation you use, but that the two values ought to represent the same thing! Also, note that while both slope gradients will be zero for a level surface, the maximum slope is 90° in one case and an infinite percent slope in the other. Think about what a 100% slope’s degree equivalent would be. Information about King County rivers can be found at http://www-old.golder.com/ekcrwa/Aquifer/Hydrogeology.asp The Mount Rainier National Park quadrangle (1955) Find the White River, as it emerges from Emmons Glacier, high on the north-east flank of Mt. Rainier, and heads off toward the northeast corner of the map. 1. a. Obviously, is the White River, as shown on the map, closer to its headwaters or to its delta? b. Would the White River be considered more of a braided river or a meandering river? Remember the correlation between parts a and b.
2. a. Notice that there are multiple channels (blue lines) within the riverbed area. Notice also that there is a brown dotted pattern in this area. Does this area experience a high rate of erosion or a low rate of erosion? b. From your experience of streams high up in the mountains, would the material at the bottom of this riverbed be coarse (boulder, cobble and sand) or fine (silt and clay)? 3. To calculate the stream gradient (in percent) of the White River, cut off a piece of string that represents 10,000 feet (use the scale at the bottom of the map). Lay it carefully along the path of the White River, starting at any point where the river crosses one of the brown contour lines. a. Count how many contour lines the string crosses, then use the contour interval given on the map to calculate the elevation change from the front of the string to the back of the string. b. Use the gradient (percent) formula given at the beginning of this handout to calculate the gradient in percent of the White River here. The Vicksburg, MS, quadrangle (1964) 4. a. Is the Mississippi River in this quadrangle closer to its headwaters or to its delta? How can you tell? Hint: is the river meandering or braided here? b. How often, roughly, do the channels of the Mississippi seem to change? Hint: look for pairs of red dotted “Meander lines” and along the river itself for “Cutoffs”, both of which are dated. Is this more or less often than you would expect the White River channels to change? c. From your experience of rivers of this type, would the material at the bottom of this riverbed be coarse (boulder, cobble and sand) or fine (silt and clay)?
d. Without doing any heavy calculations, what is the approximate percent stream gradient of the Mississippi River here? Hint: note how many contour lines it seems to cross. 5. a. Even in this part of the river, the processes of erosion and deposition continue. What feature in the Vicksburg area of the map shows that erosion by the river is an active force here (think back to your US history: the capture of Vicksburg by Union forces in 1863 — was this an easy battle or a difficult one? What made the battle harder for Union forces?)? b. If the side of the river where Vicksburg lies is erosional, name the corresponding area (on the map) that is depositional in nature. c. What two different structures have humans done to try and channelize the Mississippi River here? Have they been successful (before you answer look at a black dotted line structure on the former Kents Island in the southwestern corner of the map)? d. What are features such as Thompson Lake and Goose Lake in the northern part of the map? They’re called oxbow lakes, but what are they really? 6. Summary — Connect two lines through each column of terms High stream gradient Mostly depositional Coarse riverbed grains Slow stream Low stream gradient Mostly erosional Fine riverbed grains Fast stream Floods Floods occur when the stream flow exceeds the banks of the stream. Fortunately, there are many good Internet resources concerning local rivers such as http://dnr.metrokc.gov/topics/flooding/FLDtopic.htm for King County. For this part of the lab, go to the website: http://wa.water.usgs.gov/data/realtime/rt_latest_map.html, then click on the Snoqualmie drainage, then finally click on yellow triangle to the northwest of North Bend along the Snoqualmie River (this should be the river gaging station near Snoqualmie). Scroll down to the “Available Parameters” menu; next to it is a “Days” window. Below should be the “Discharge, cubic feet per second” graph. Type in an appropriate number of days such that the graph contains
information from November 6 to present. Open another window and go to the same King County map, but this time click on the next yellow triangle downstream (north) on the Snoqualmie River (this should be the station near Carnation). Again, scroll down to the “Discharge, cubic feet per second” graph and place the graphs side by side. 7. Examine the stream discharge versus date graph for both sites, especially around November 6 and 7. Which site was closer to the heavier rainfall? How does the shape of the graph tell you the proximity to a storm? 8. When (what date and time – you will have to estimate the time from the graph) was the peak discharge of the river at Snoqualmie? At Carnation? Why is there a difference in times? 9. a. Calculate the speed of the flood crest. For this you will probably need a topographic or road map of the area, and a piece of string (the river isn’t a straight line). Please show your calculation setup clearly. Recall that speed = distance/time. b. Is the speed of the flood crest the same as the speed of the river? NO. Which one is slower, and how come?
10. Go back to the Snoqualmie station and toggle back and forth between the discharge and stream gage graphs. Don’t be fooled by the logarithmic nature of the graphs – just count grid lines. a. Fill in the table below: Snoqualmie station Flood stage Maximum discharge of
November 7, 2006 Gage height (feet)
Discharge (cubic feet per second)
b. Fill in the blanks: By rising a mere _____ feet above flood stage, the Middle Fork Snoqualmie River increased its discharge by ________ times flood stage discharge. I now have much respect for the river, and its floods. Groundwater As many parts of the world are becoming increasingly aware, groundwater is an economic resource, as strategic and necessary as petroleum and hard-rock mineral deposits. In the Middle East, for example, the Israeli-occupied West Bank of the Jordan River is disputed territory in part because of the groundwater reserves there. Closer to home, the fossil Snoqualmie aquifer is being tapped heavily by the expansion of the towns of North Bend and Snoqualmie; as a fossil aquifer, it has no chance of being recharged and problems will ensue when that resource runs out. In almost all cases, groundwater does not flow as “underground rivers”. Most commonly, it flows within the pore space between sediment grains. Groundwater can flow more rapidly through fractured rock or through cave systems in carbonate (mostly limestone) rocks. The amount of pore space in a rock is called its porosity; how well these pore spaces are connected to each other is defined as permeability. 11. Compare sediment samples W8 and W9 in the drawer. a. Describe the grain size of each. b. Which sample is more porous?
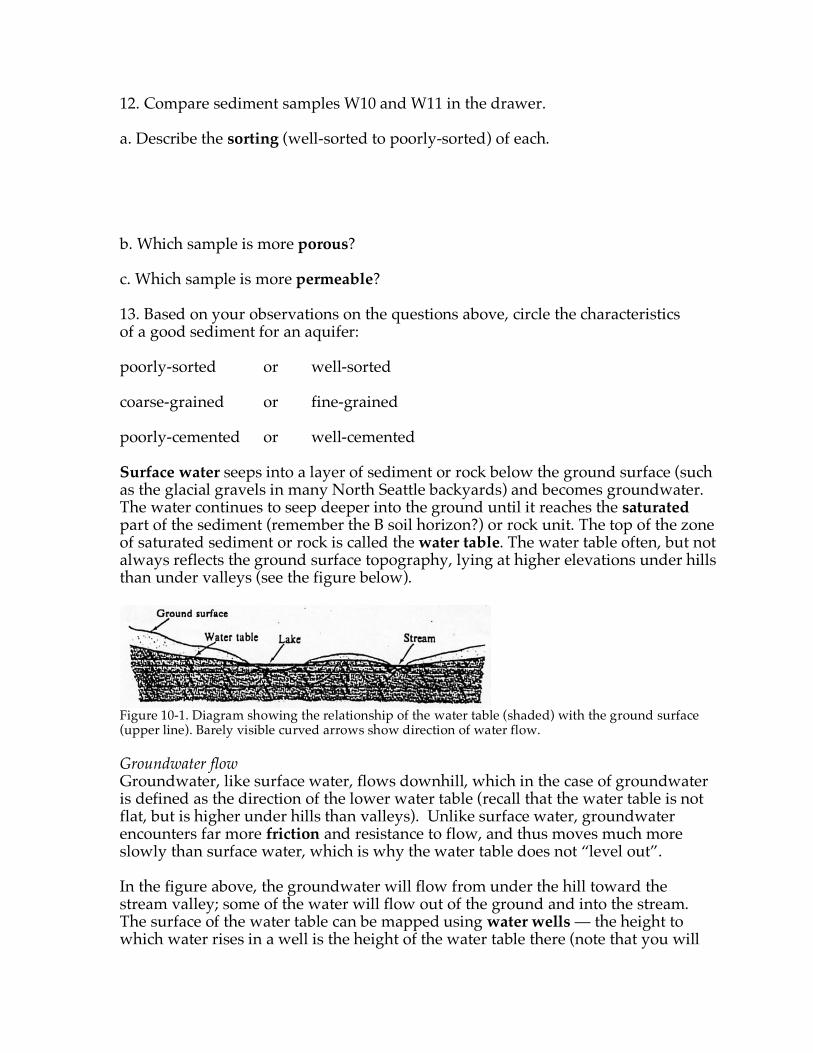
12. Compare sediment samples W10 and W11 in the drawer. a. Describe the sorting (well-sorted to poorly-sorted) of each. b. Which sample is more porous? c. Which sample is more permeable? 13. Based on your observations on the questions above, circle the characteristics of a good sediment for an aquifer: poorly-sorted or well-sorted coarse-grained or fine-grained poorly-cemented or well-cemented Surface water seeps into a layer of sediment or rock below the ground surface (such as the glacial gravels in many North Seattle backyards) and becomes groundwater. The water continues to seep deeper into the ground until it reaches the saturated part of the sediment (remember the B soil horizon?) or rock unit. The top of the zone of saturated sediment or rock is called the water table. The water table often, but not always reflects the ground surface topography, lying at higher elevations under hills than under valleys (see the figure below).
Figure 10-1. Diagram showing the relationship of the water table (shaded) with the ground surface (upper line). Barely visible curved arrows show direction of water flow. Groundwater flow Groundwater, like surface water, flows downhill, which in the case of groundwater is defined as the direction of the lower water table (recall that the water table is not flat, but is higher under hills than valleys). Unlike surface water, groundwater encounters far more friction and resistance to flow, and thus moves much more slowly than surface water, which is why the water table does not “level out”. In the figure above, the groundwater will flow from under the hill toward the stream valley; some of the water will flow out of the ground and into the stream. The surface of the water table can be mapped using water wells — the height to which water rises in a well is the height of the water table there (note that you will
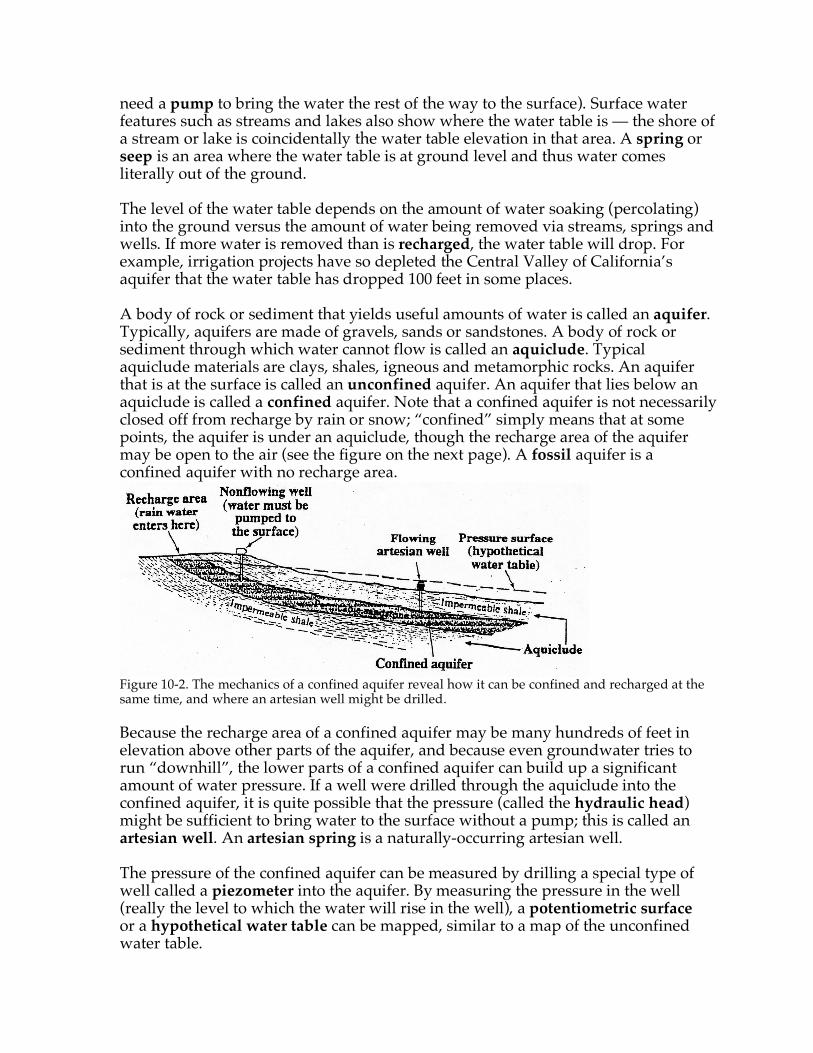
need a pump to bring the water the rest of the way to the surface). Surface water features such as streams and lakes also show where the water table is — the shore of a stream or lake is coincidentally the water table elevation in that area. A spring or seep is an area where the water table is at ground level and thus water comes literally out of the ground. The level of the water table depends on the amount of water soaking (percolating) into the ground versus the amount of water being removed via streams, springs and wells. If more water is removed than is recharged, the water table will drop. For example, irrigation projects have so depleted the Central Valley of California’s aquifer that the water table has dropped 100 feet in some places. A body of rock or sediment that yields useful amounts of water is called an aquifer. Typically, aquifers are made of gravels, sands or sandstones. A body of rock or sediment through which water cannot flow is called an aquiclude. Typical aquiclude materials are clays, shales, igneous and metamorphic rocks. An aquifer that is at the surface is called an unconfined aquifer. An aquifer that lies below an aquiclude is called a confined aquifer. Note that a confined aquifer is not necessarily closed off from recharge by rain or snow; “confined” simply means that at some points, the aquifer is under an aquiclude, though the recharge area of the aquifer may be open to the air (see the figure on the next page). A fossil aquifer is a confined aquifer with no recharge area.
Figure 10-2. The mechanics of a confined aquifer reveal how it can be confined and recharged at the same time, and where an artesian well might be drilled. Because the recharge area of a confined aquifer may be many hundreds of feet in elevation above other parts of the aquifer, and because even groundwater tries to run “downhill”, the lower parts of a confined aquifer can build up a significant amount of water pressure. If a well were drilled through the aquiclude into the confined aquifer, it is quite possible that the pressure (called the hydraulic head) might be sufficient to bring water to the surface without a pump; this is called an artesian well. An artesian spring is a naturally-occurring artesian well. The pressure of the confined aquifer can be measured by drilling a special type of well called a piezometer into the aquifer. By measuring the pressure in the well (really the level to which the water will rise in the well), a potentiometric surface or a hypothetical water table can be mapped, similar to a map of the unconfined water table.

Figure 10-3. Four wells drilled near Palm Springs, California. 14. On figure 10-3, water levels are shown in black for each of four wells in the Palm Springs, California, area. Assume the shale and granite are impermeable. a. Label the confined aquifer, the unconfined aquifer, and the aquicludes. b. Draw a solid line representing the water table of the unconfined aquifer. c. Draw a dotted line representing the "hypothetical water table" (sometimes called the "potentiometric surface") of the confined aquifer. d. In which direction is the water in the unconfined aquifer flowing? e. In which direction is the water in the confined aquifer flowing? f. In the summer, well A goes dry if it is pumped for more than a few hours. The owner of well A sues the owner of well B, who is pumping large volumes of water to irrigate her golf course, for damages. Does the suit have merit? Explain! g. What simple, if expensive, solution does well owner A have?
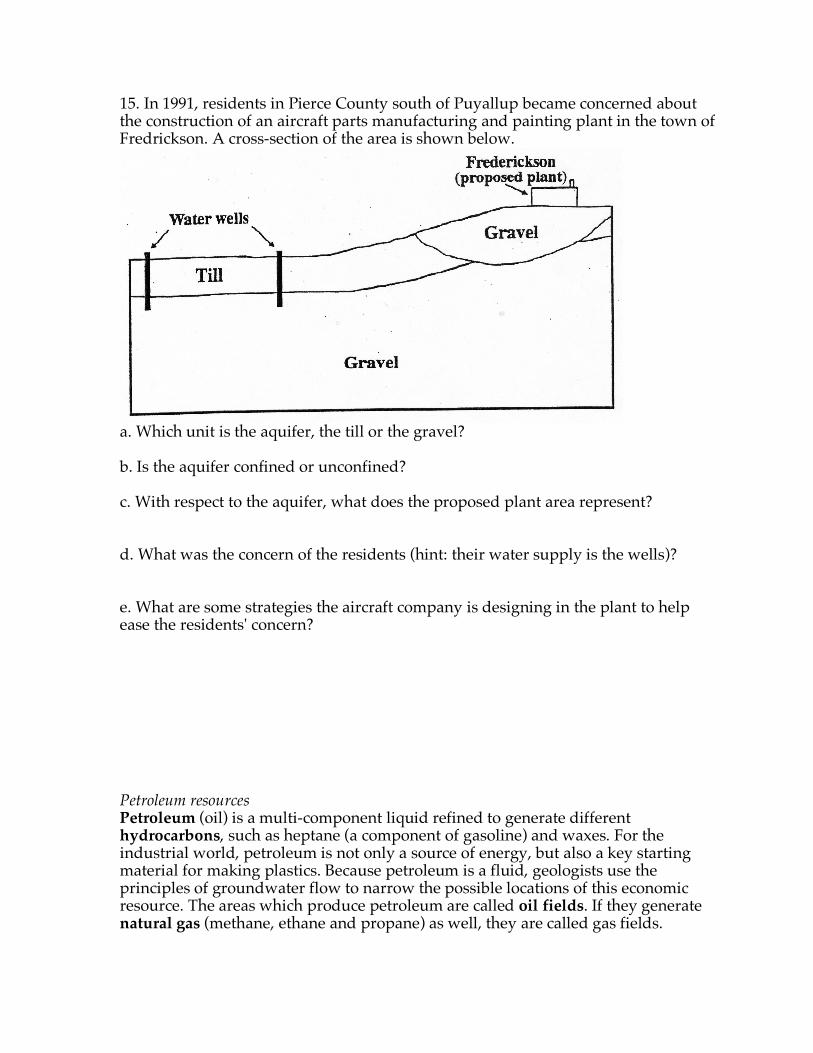
15. In 1991, residents in Pierce County south of Puyallup became concerned about the construction of an aircraft parts manufacturing and painting plant in the town of Fredrickson. A cross-section of the area is shown below.
a. Which unit is the aquifer, the till or the gravel? b. Is the aquifer confined or unconfined? c. With respect to the aquifer, what does the proposed plant area represent? d. What was the concern of the residents (hint: their water supply is the wells)? e. What are some strategies the aircraft company is designing in the plant to help ease the residents' concern? Petroleum resources Petroleum (oil) is a multi-component liquid refined to generate different hydrocarbons, such as heptane (a component of gasoline) and waxes. For the industrial world, petroleum is not only a source of energy, but also a key starting material for making plastics. Because petroleum is a fluid, geologists use the principles of groundwater flow to narrow the possible locations of this economic resource. The areas which produce petroleum are called oil fields. If they generate natural gas (methane, ethane and propane) as well, they are called gas fields.
Many geologic factors determine where oil fields occur and the quality of the oil within that field. Though some components of oil are denser than water, oil and natural gas are typically less dense than water and thus will float on top or bubble through water. This means that oil and gas will rise to the surface using fractures and pore spaces within rocks. If the oil and gas reach an impermeable layer can no longer move upward, they are said to be “trapped” and the structure in which they are stuck is called an oil trap. Three necessary factors for generating and trapping oil and gas are: • A hydrocarbon source rock where the oil is made. A typical source rock is a marine limestone with plenty of organic material (mostly dead single-celled plankton). The sediments that will become this rock are covered, lithified, pressurized and heated by the burial. By excluding oxygen gas, the trapped organic material becomes more carbon-rich (water is driven out of the remains) through a series of chemical reactions. Organic-rich siltstones and shales also make good source rocks. • A porous and permeable reservoir rock into which the oil and gas can migrate away from the source, accumulate and later be pumped out. These rocks include arenitic and greywacke sandstones, limestones and other carbonate rocks. • An impermeable cap rock which acts like an aquiclude to prevent the oil and gas from escaping to the surface (once oil reaches the surface, the lighter molecular weight components simply evaporate!). Shale, evaporites (rock salt) and other fine-grained rocks are good cap rocks. Note that the source rock is usually not the reservoir rock and that the cap rock is, of course, different from those two. 16. Look at rock samples R45, R46 and R47 and classify each as a good source rock, a good reservoir rock or a good cap rock. R45 R46 R47 Geologic map cross-section A-A' of the La Habra and Whittier Quadrangles 17. a. The major reservoir rock in this area is the Tfl strata. According to the explanation, what rock is Tfl made of? How well-cemented is this rock, in order that it be a good reservoir rock?
b. Which formation is the source rock? (Hint: it can be only one of the formations listed and remember that most of the oil may have migrated to the reservoir rock, so that very few wells would try to tap into the source rock). What must the source rock contain? 18. a. Which formation is the cap rock? (Hint: again, it can be only one of the formations listed. What characteristic should the cap rock have? Find a two-word phrase which is this characteristic.) b. In areas where there is no cap rock but ample reservoir rock, what would you expect to see on the surface? (Hint: this happens in the La Brea district of Los Angeles. Also, R46 is actually from such a surface feature near Ojai, California) 19. Note the large number of vertical lines in the cross-section; these represent oil wells. The ID number of the well is given in parentheses above the well (for instance, the furthest west well on A-A' is #133). The depth of each well is given at the bottom of the well (Well #133 is 7832 feet deep). a. What is the number and the depth of the deepest well in the cross-section? b. Look for A-A' on the geologic map and note that the wells are now represented by open or filled circles. Using the explanation to figure out what the open and filled circles mean, is the deepest well a producing well or a "dry" well? What does this suggest to you about the continued potential of this area as an oil-producing site? 20. Recalling how anticlines and synclines are represented on geological maps, are the producing wells concentrated on anticlines or on synclines? Why is this so?


![[Geology] Buckland W. 1836 - Geology and Mineralogy](https://img.pdfslide.net/doc/110x75/551dd45649795950198b4f64/geology-buckland-w-1836-geology-and-mineralogy.jpg)