Embed Size (px)
Citation preview

Geology and Nonfuel Mineral Deposits of the United States
By Michael L Zientek and Greta J Orris
Open-File Report 2005-1294A
US Department of the Interior US Geological Survey
US Department of the Interior Gale A Norton Secretary
US Geological Survey P Patrick Leahy Acting Director
US Geological Survey Reston Virginia 2005
For product and ordering information World Wide Web httpwwwusgsgovpubprod Telephone 1-888-ASK-USGS
For more information on the USGSmdashthe Federal source for science about the Earth its natural and living resources natural hazards and the environment World Wide Web httpwwwusgsgov Telephone 1-888-ASK-USGS
Suggested citation Zientek ML and Orris GJ 2005 Geology and nonfuel mineral deposits of the United States US Geological Survey Open-File Report 2005-1294A 172 p [URL httppubsusgsgovof20051294]
Any use of trade product or firm names is for descriptive purposes only and does not imply endorsement by the US Government
Although this report is in the public domain permission must be secured from the individual copyright owners to reproduce any copyrighted material contained within this report
ii
Contents Contents iii Abstract 1 Introduction 1 Some basic terms and concepts 3 Overview of geologic and tectonic history 6 Principal commodities and deposit types 8
Metals 10 Beryllium 10 Cobalt 11 Copper 13 Gold 17 Iron ore 21 Lead and zinc 23 Molybdenum 26 Platinum-group elements and nickel 28 Rare-earth elements 31 Silver 33 Titanium 38
Industrial materials 40 Barite 40 Bentonite 42 Boron 44 Bromine 46 Diatomite 47 Garnet 48 Gypsum 49 Kaolin 50 Phosphate rock 51 Potash 53 Salt (halite) 54 Soda ash (sodium carbonate) 56 Talc 58
Regional exploration history and significant recent discoveries 59 Potential for undiscovered mineral resources 62 References cited 65 Figures 79 Appendix 1 Major mineral deposits in the United States 125 Appendix 2 Selected criteria used to identify major mineral deposits listed in Table 2 of this report 171 Appendix 3 Resource-reserves definitions (USGS 2004) 172
iii
Tables Table 1 Value of selected mineral commodities produced in the United States 2 Table 2 Beryllium - proportion of world mine production for the United States 10 Table 3 Cobalt - proportion of world mine production reserves and reserve base for the
United States 11 Table 4 Copper - proportion of world mine production reserves reserve base and
resource base for the United States 13 Table 5 Gold - proportion of world mine production reserves and reserve base for the
United States 17 Table 6 Iron ore - proportion of world mine production reserves and reserve base for the
United States 21 Table 7 Lead - proportion of world mine production reserves and reserve base for the
United States 23 Table 8 Zinc - proportion of world mine production reserves and reserve base for the
United States 23 Table 9 Molybdenum - proportion of world mine production reserves and reserve base
for the United States 26 Table 10 Platinum-group elements - proportion of world mine production reserves and
reserve base for the United States 28 Table 11 Rare-earth elements - proportion of world mine production in 2002 and 2003
reserves and reserve base for the United States 31 Table 12 Silver - proportion of world mine production reserves and reserve base for the
United States 33 Table 13 Titanium concentrate (ilmenite) - proportion of world mine production reserves
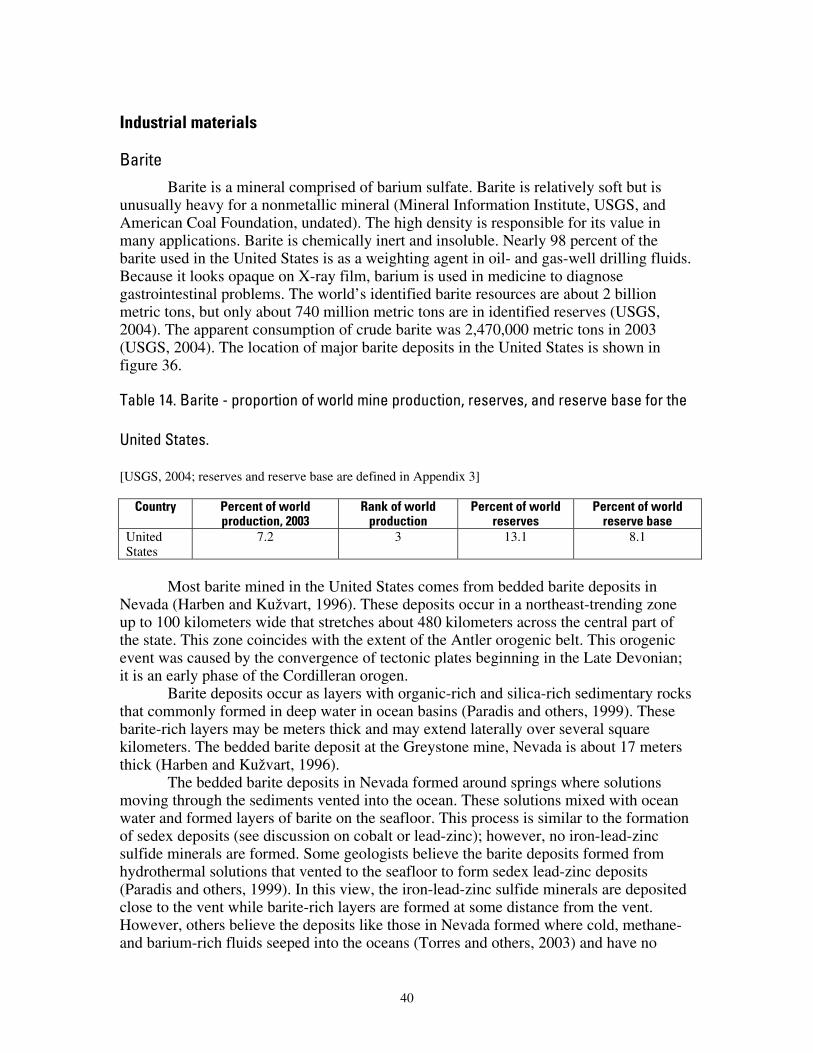
and reserve base for the United States 38 Table 14 Barite - proportion of world mine production reserves and reserve base for the
United States 40 Table 15 Bentonite - proportion of world mine production for the United States 42 Table 16 Boron - proportion of world mine production reserves and reserve base for the
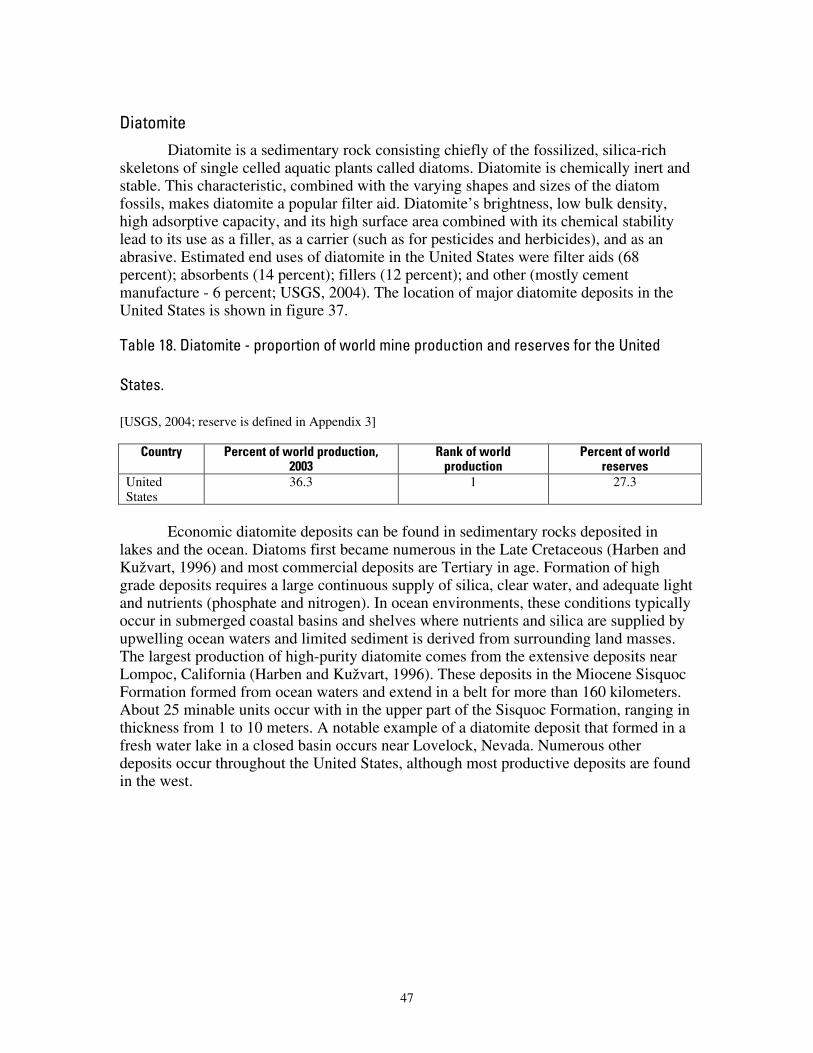
United States 44 Table 17 Bromine - proportion of world mine production for the United States 46 Table 18 Diatomite - proportion of world mine production and reserves for the United
States 47 Table 19 Garnet - proportion of world mine production for the United States 48 Table 20 Gypsum - proportion of world mine production for the United States 49 Table 21 Kaolin - proportion of world mine production for the United States 50 Table 22 Phosphate rock - proportion of world mine production reserves and reserve
base for the United States 51 Table 23 Potassium - proportion of world mine production reserves and reserve base for
the United States 53 Table 24 Salt - proportion of world mine production for the United States 54
iv
Table 25 Soda ash - proportion of world mine production reserves and reserve base for the United States 56
Table 26 Talc - proportion of world mine production for the United States 58
Figures
Figure 1 Map of the World showing the areas covered by this series of regional reports tectonic plate boundaries and ocean bathymetry 79
Figure 2 Sketches showing the layered internal structure of the Earth 80 Figure 3 Perspective diagram and cross section of the uppermost layers of the Earth
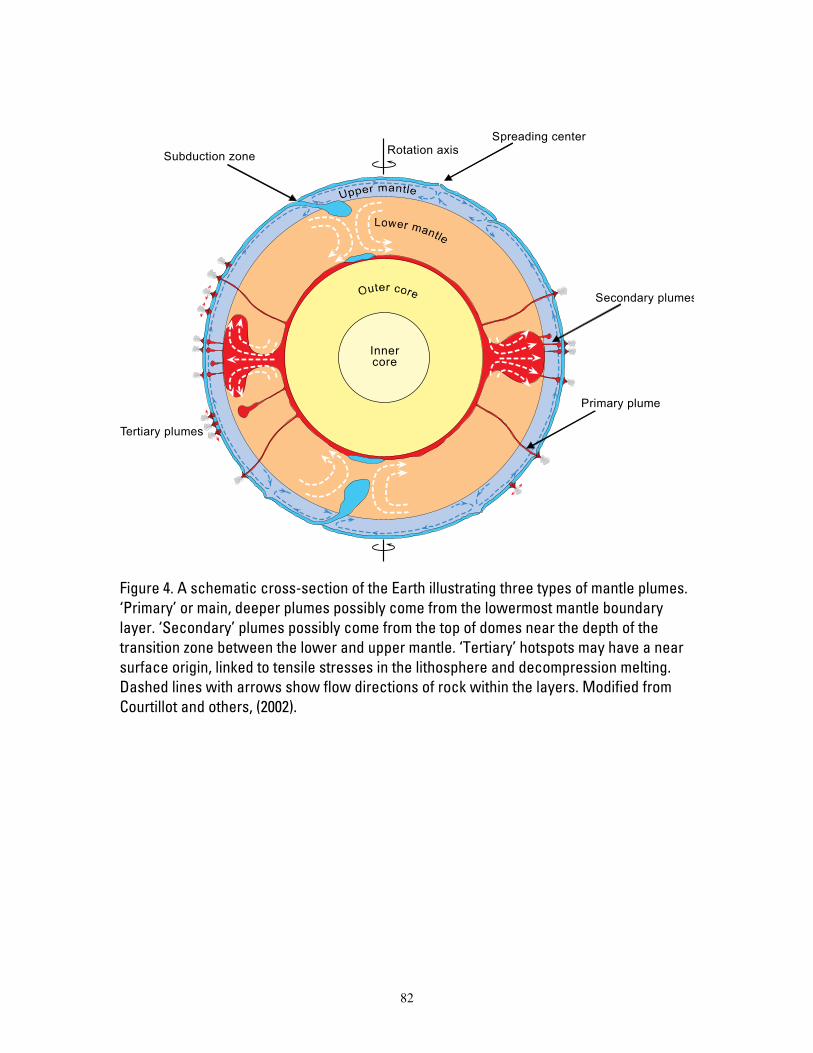
illustrating the main types of tectonic plate boundaries 81 Figure 4 A schematic cross-section of the Earth illustrating three types of mantle plumes
82 Figure 5 A map of the globe showing the distribution of the igneous rocks associated with
selected large igneous provinces (red regions) that formed in the last 250 million years 83
Figure 6 Map showing the location of the major magmatic and metamorphic mineral deposits of United States 84
Figure 7 Cross section of the uppermost layers of the Earth illustrating the distribution of mineral deposits in relation to the main types of tectonic plate boundaries 85
Figure 8 Map showing the location of the major hydrothermal mineral deposits of United States 86
Figure 9 Map showing the location of the major sedimentary mineral deposits of United States 87
Figure 10 Map showing the location of the major surficial mineral deposits of United States 88
Figure 11 Relative geologic time units used in this report 89 Figure 12 Simplified geologic map of North America 90 Figure 13 Map of North American showing the geology of the North American craton
underlying the sedimentary rocks that cover much of the continent 91 Figure 14 Summary of selected geologic events and features for the North American
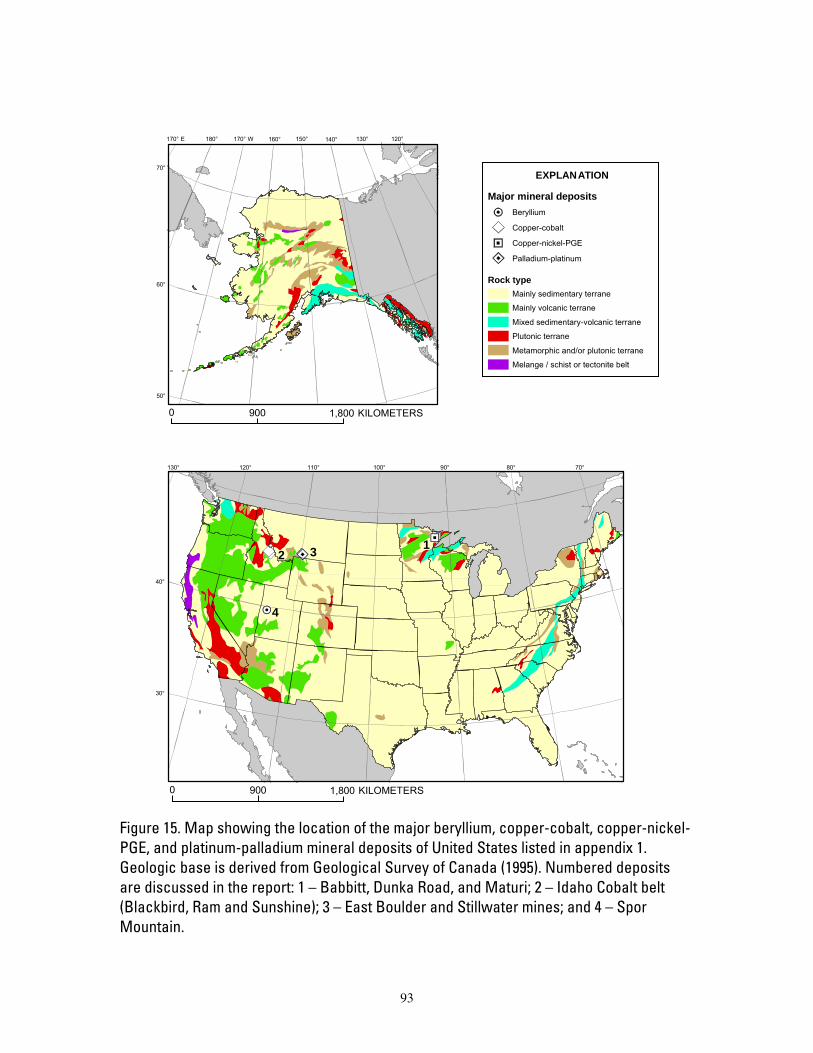
craton in the last 2000 million years 92 Figure 15 Map showing the location of the major beryllium copper-cobalt copper-nickel-
PGE and platinum-palladium mineral deposits of United States 93 Figure 16 Cross section schematically illustrating the characteristic features of an
idealized sedimentary-exhalative (sedex) mineral deposit 94 Figure 17 Simplified geologic map showing the distribution of metamorphosed
sedimentary rocks (Belt-Purcell Supergroup) deposited in the Middle Proterozoic Belt basin and Cretaceous igneous rocks related to the Cordilleran orogen 95
Figure 18 Map showing the location of the major copper mineral deposits of United States 96
v
Figure 19 Cross section through an idealized stratovolcano showing various styles of related mineralization 97
Figure 20 Map illustrating changes in metal content of mineralized rock and ore deposits in the Bingham district Utah 98
Figure 21 Map showing the distribution of the Middle Proterozoic Revett Formation and associated hydrothermal copper-silver mineralization in northwestern Montana and northern Idaho 99
Figure 22 Map showing selected geologic features and the location of major sedimentary iron deposits (banded iron formation) magmatic copper-nickel-PGE deposits and hydrothermal copper deposits in basalt 100
Figure 23 Map showing the location of the major gold mineral deposits of United States 101
Figure 24 Map showing the distribution of sedimentary rock-hosted gold deposits and mineralization of the Blue-Star area of the Carlin Trend Nevada 102
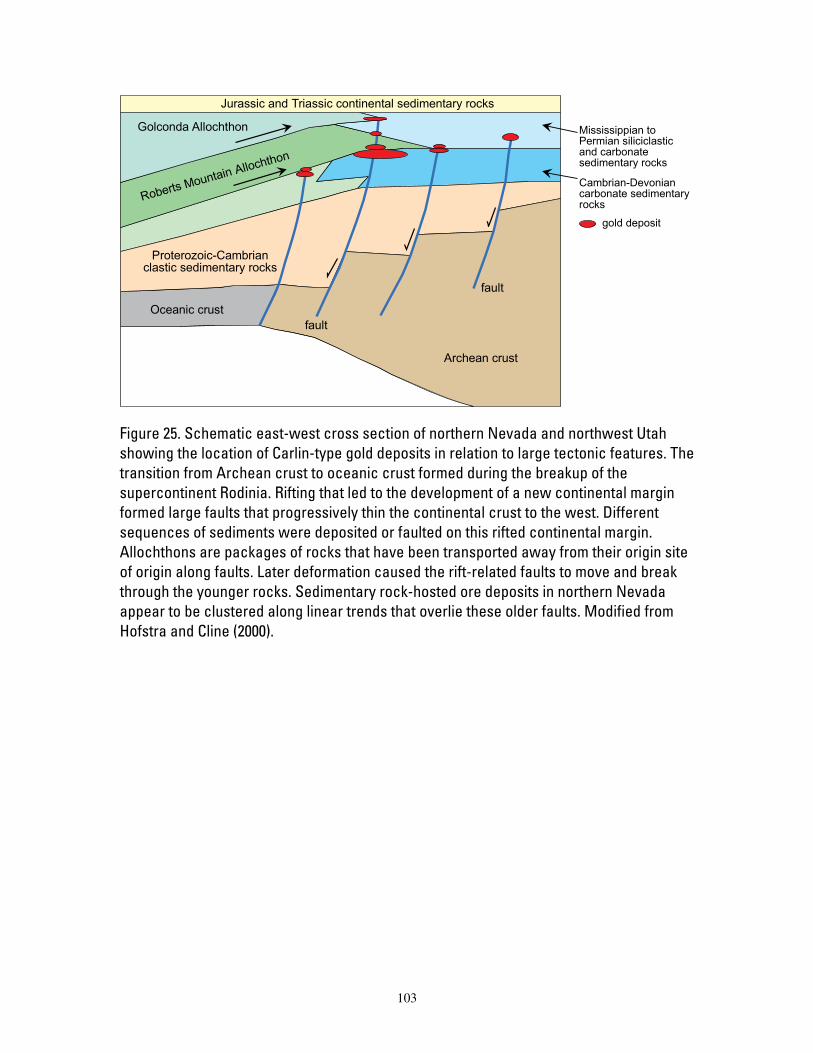
Figure 25 Schematic east-west cross section of northern Nevada and northwest Utah showing the location of Carlin-type gold deposits in relation to large tectonic features 103
Figure 26 Schematic cross section that illustrates generalized patterns of alteration and mineralization of epithermal gold deposits 104
Figure 27 Map showing the location of the major iron niobium rare-earth metals and titanium mineral deposits of United States 105
Figure 28 Map showing the location of the major lead and zinc mineral deposits of United States listed 106
Figure 29 Cross section illustrating the essential features of an idealized volcanogenic massive sulfide deposit 107
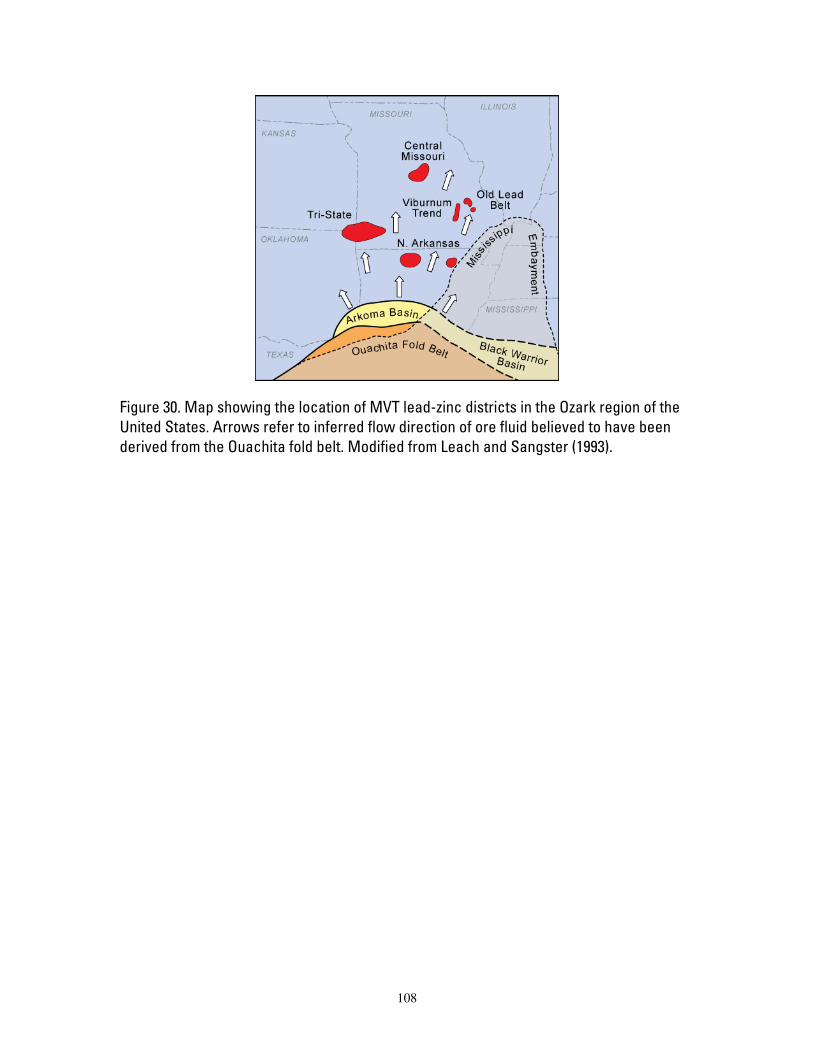
Figure 30 Map showing the location of MVT lead-zinc districts in the Ozark region of the United States 108
Figure 31 Map of southeast Missouri showing location of major Mississippi Valley ore districts surrounding outcrops of Precambrian igneous rocks in the St Francois Mountains 109
Figure 32 Map showing the location of the major molybdenum mineral deposits of United States 110
Figure 33 Idealized section through an ultramafic-to-mafic layered igneous intrusion showing the distribution of magmatic ore deposits 111
Figure 34 Map showing the location of the major silver mineral deposits of United States 112
Figure 35 Map showing heavy mineral deposits in northeastern Florida and southeastern Georgia 113
Figure 36 Map showing the location of the major barite garnet and talc mineral deposits of United States 114
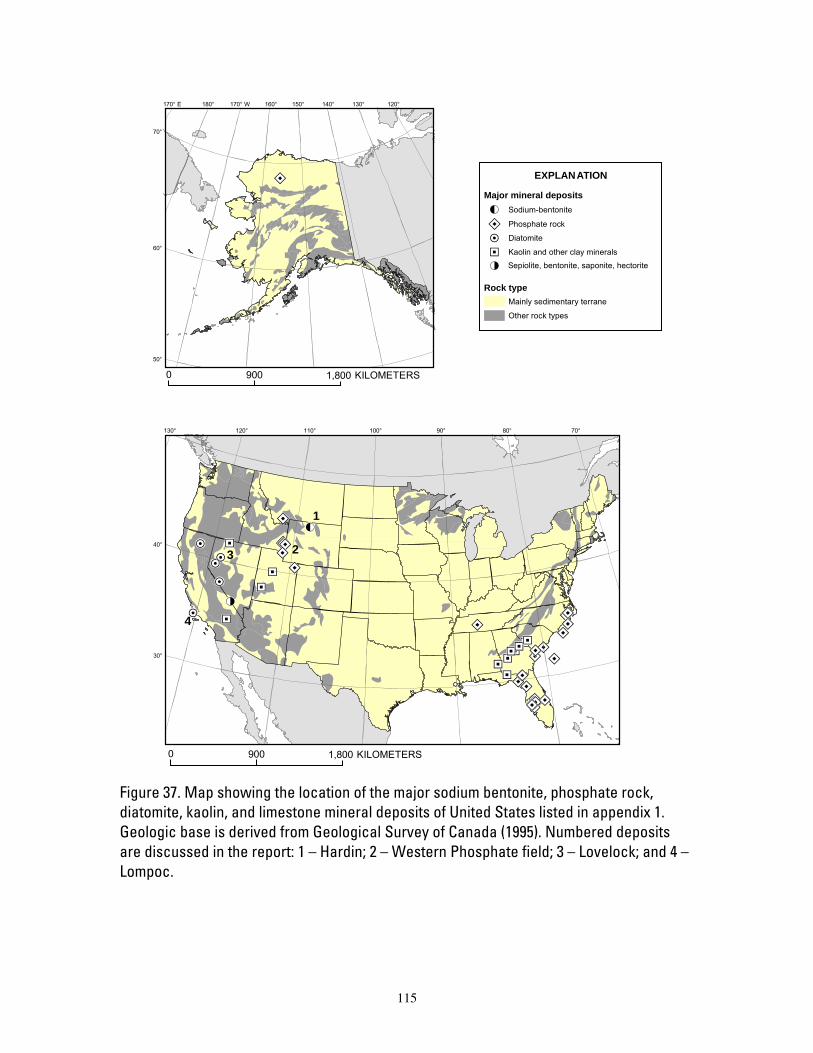
Figure 37 Map showing the location of the major sodium bentonite phosphate rock diatomite kaolin and limestone mineral deposits of United States 115
vi
Figure 38 Map showing the location of the major gypsum boron bromine salt potash and sodium carbonate mineral deposits of United States 116
Figure 39 Map showing the location of the major phosphorite deposits relative to the Miocene geologic framework of the southeast Atlantic Coastal Plain-continental shelf system 117
Figure 40 Map showing the distribution the location of major salt and potash deposits in evaporite basins in North America showing Modified from Kesler (1994) 118
Figure 41 Map showing the distribution of the Green River Formation and the location of sodium carbonate deposits in Utah Colorado and Wyoming 119
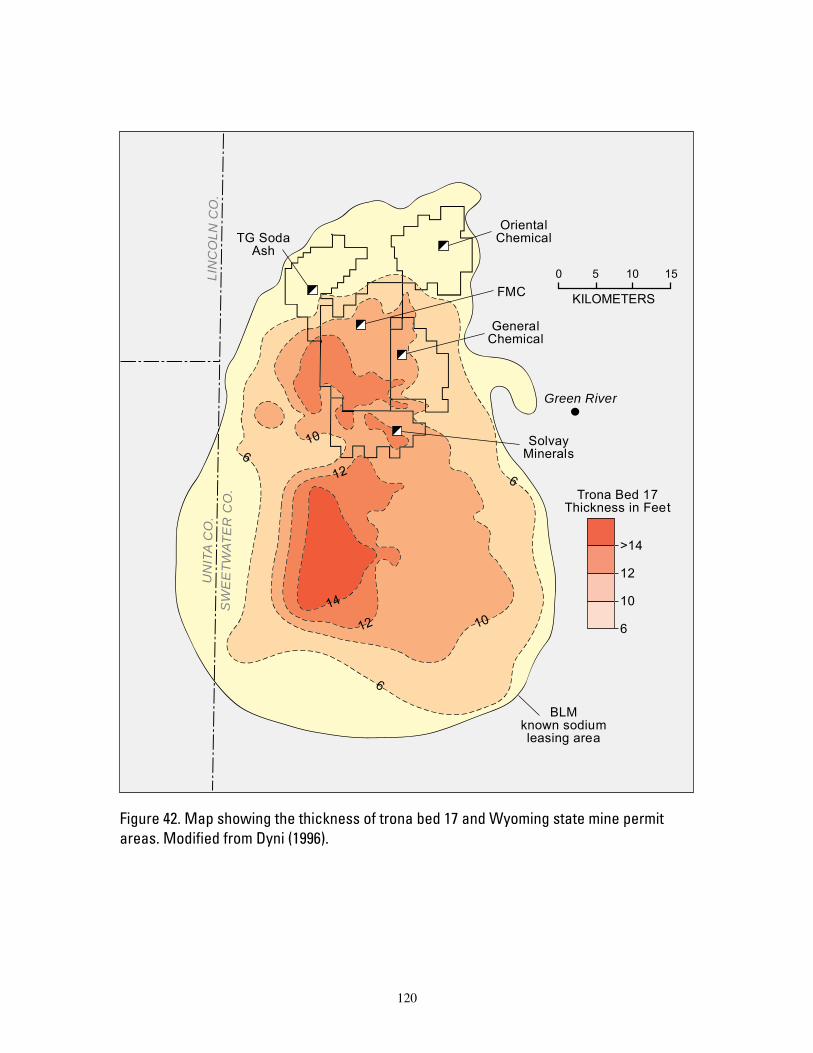
Figure 42 Map showing the thickness of trona bed 17 and Wyoming state mine permit areas 120
Figure 43 Charts showing the density of exploration sites for selected regions of the United States 121
Figure 44 Graph showing the number of active mining claims held on public lands in the United States from 1976 to 2003 122
Figure 45 Graph showing the number of active mining operations in the United States from 1979 to 2002 123
vii
Geology and Nonfuel Mineral Deposits of the United States
Michael L Zientek and Greta J Orris
Abstract This report which is one of a series of reports summarizing the Worldrsquos
endowment of nonfuel mineral resources describes the location and general geologic setting of deposits of major mineral commodities in the United States The discussion in this report focuses on those commodities produced in the United States that constituted at least 5 percent of global production or global reserve base in 2003 or had at least $100 million production value in 2001 The discussion for each commodity begins with a brief description of the chemical and physical properties of the material and how it is used The importance of the commodity in the United States relative to the world is also presented However most of the discussion emphasizes the geology of mineral commodities ndash the important mineral deposit types their geologic setting and the processes that led to their formation A compilation of almost 400 major mineral deposits in the United States is included as an appendix
Introduction This report is one of a series that summarize information about the Worldrsquos
endowment of nonfuel mineral resources These area reports are designed to inform the non-earth scientist about the location and general geologic setting of deposits of major mineral commodities The reports are organized by the five areas shown in Figure 1 this report covers the United States Additional information such as production statistics economic factors that affect the mineral industries of the region and historical information is available in USGS publications such as the Minerals Yearbook (available on the web) and through the detailed references provided at the end of this report A brief overview of the potential for undiscovered mineral resources is included in this report
The data in this report will be incorporated into the ongoing USGS international quantitative mineral resource assessment of the nonfuel mineral resources of the continental regions of the world This assessment led by the USGS is designed to assess the global endowment of both discovered and undiscovered nonfuel mineral resources at a scale of 11000000 (Briskey and others 2001 2002) The results will delineate areas of the world that are geologically permissive for the occurrence of selected undiscovered nonfuel mineral resources together with estimates of the quantity and quality of those resources The global assessment will result in information that will assist in efforts to maintain a world supply of essential mineral resources while minimizing the global environmental and societal impacts of mining
1
Currently more than 5 percent of the worldrsquos production of barite beryllium boron bromine copper garnet gypsum gold salt (halite) iron lead zinc molybdenum palladium phosphate rock soda ash silver and titanium come from mining operations in the United States These materials are derived from mineral deposits ndash a concentration of a mineral commodity of sufficient size and grade that might be mined or developed given favorable socio-economic conditions A variety of mineral deposits types have been recognized that occur in distinctive geologic settings Knowledge about the geologic context of mineral deposits can be applied to predict where undiscovered resources may be found
The information in this report is organized by commodity table 1 lists those materials that are described Each section begins with a brief description of the chemical and physical properties of the material and how it is used The relative importance of the commodity in the United States relative to the world is also presented However most of the discussion emphasizes the geology of mineral commodities ndash the important mineral deposit types their geologic setting and the processes that led to their formation
Table 1 Value of selected mineral commodities produced in the United States
[Value can be measured either in dollars (annual production value) or in the relative contribution to the
global output of a commodity (percent of world production) Commodities highlighted with bold type are
discussed in this report Annual production value from National Mining Association (undated) percent of
world production from USGS (2004)]
Commodity Annual production value in 2001
Percent of world production in 2003
Stone crushed $8920000000 Cement portland and masonry $6827000000 Sand and gravel - construction and industrial $6246000000 Gold $2930000000 10 Copper $2270000000 8 Clays (includes ball bentonite common fire fullers earth and kaolin)
$1467170000 401 182
Iron ore (usable) $1210000000 5 Lime $1160000000 Salt $1110000000 20 Phosphate rock $856000000 24 Zinc $774000000 9 Soda ash $773000000 953
Boron minerals (B2O3) $506000000 24 Lead $437000000 16 Potash (K2O) $260000000 4 Silver $245000000 7 Palladium $237000000 8 Diatomite $174000000 27 Bromine $159000000 38 Gypsum (crude) $119000000 16 Platinum $61900000 2 Feldspar $44100000 Rare-earth metal concentrates $27600000
2
Table 2 Value of selected mineral commodities produced in the United States - continued
Peat $24800000 Perlite crude $21300000 Iodine $18400000 Pumice and pumicite $18000000 Gemstones $15100000 Tripoli $15100000 Kyanite $13400000 Barite $11000000 7 Mica crude $7990000 Garnet industrial $6430000 14 Silica stone $4040000 Iron Oxide pigments (crude) $3460000 Beryllium Concentrates $3000 62 Molybdenum Data withheld 27 Talc No data 9 Titanium No data 7 1 bentonite 2 kaolin 3 natural soda ash
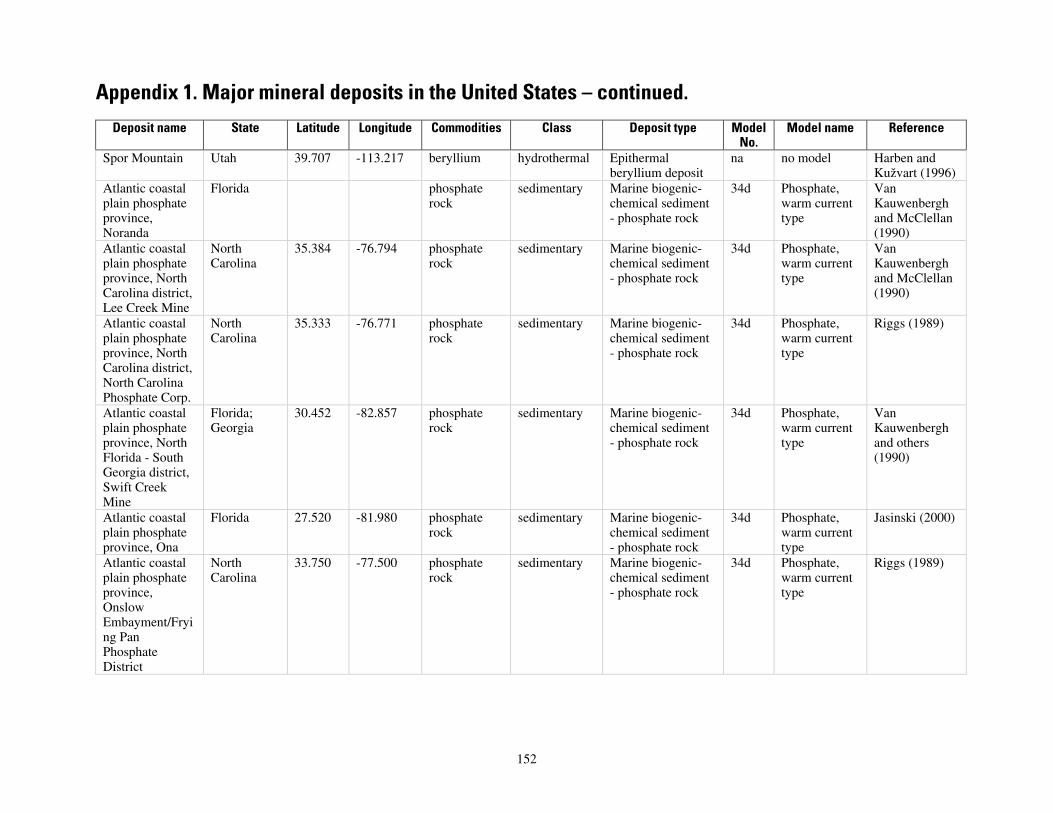
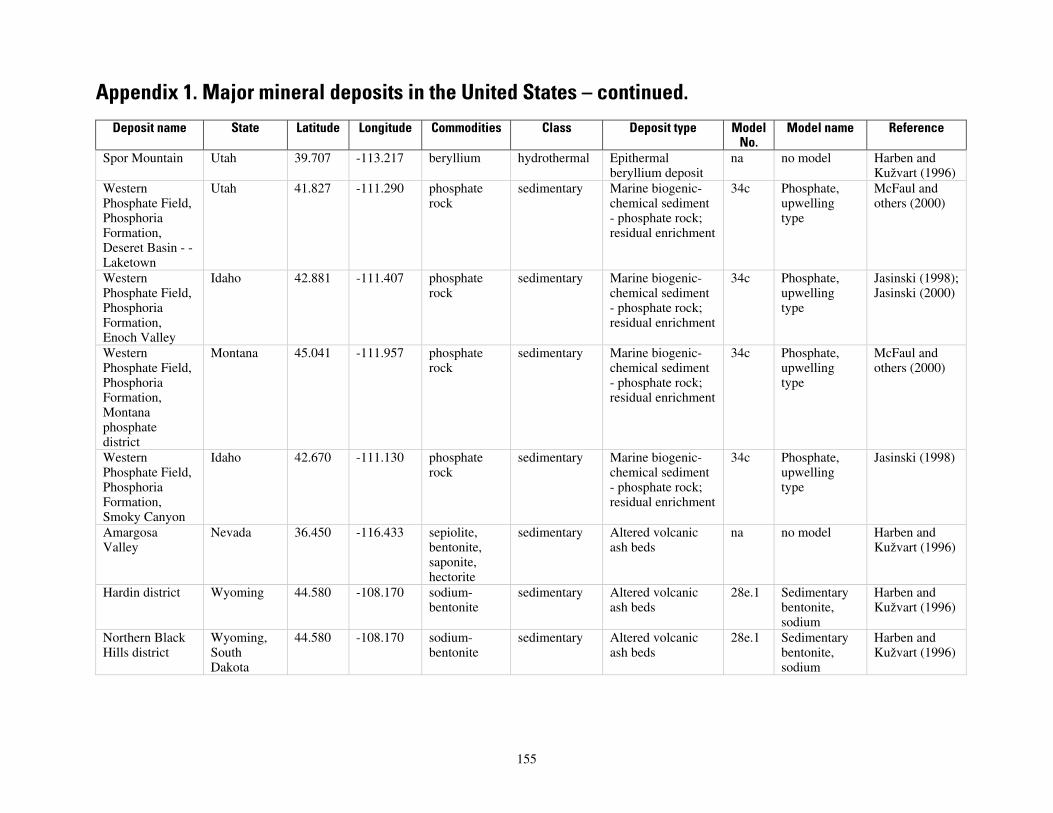
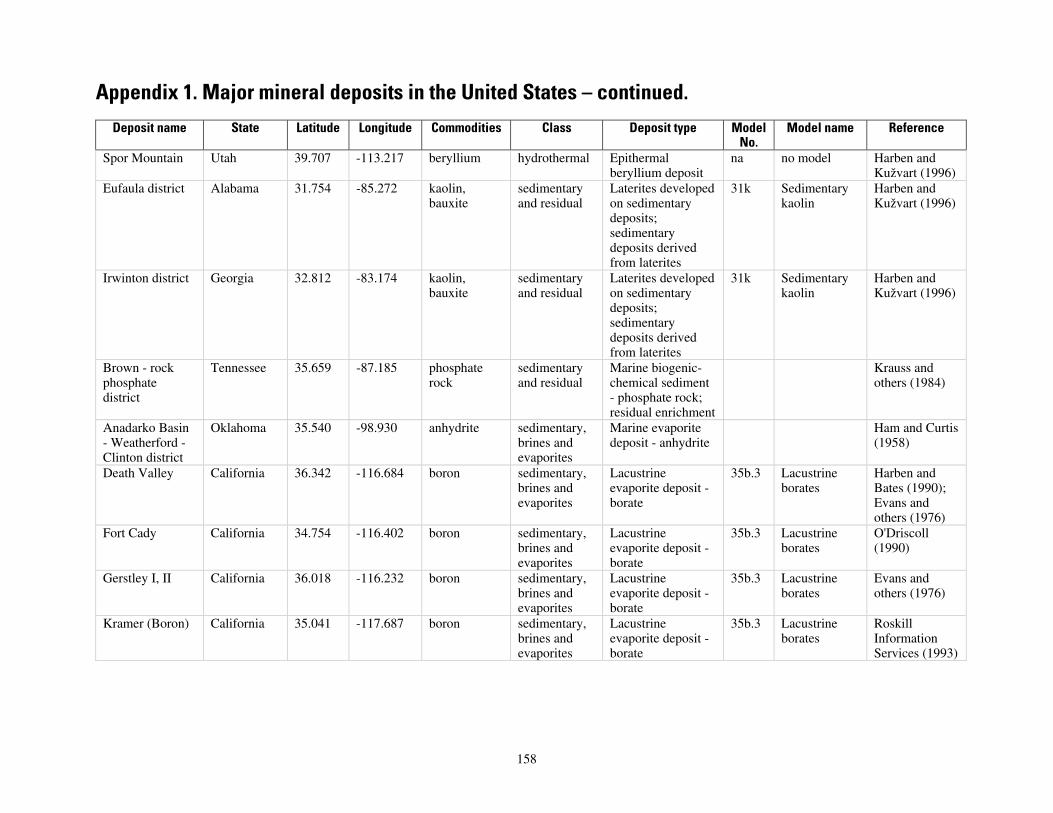
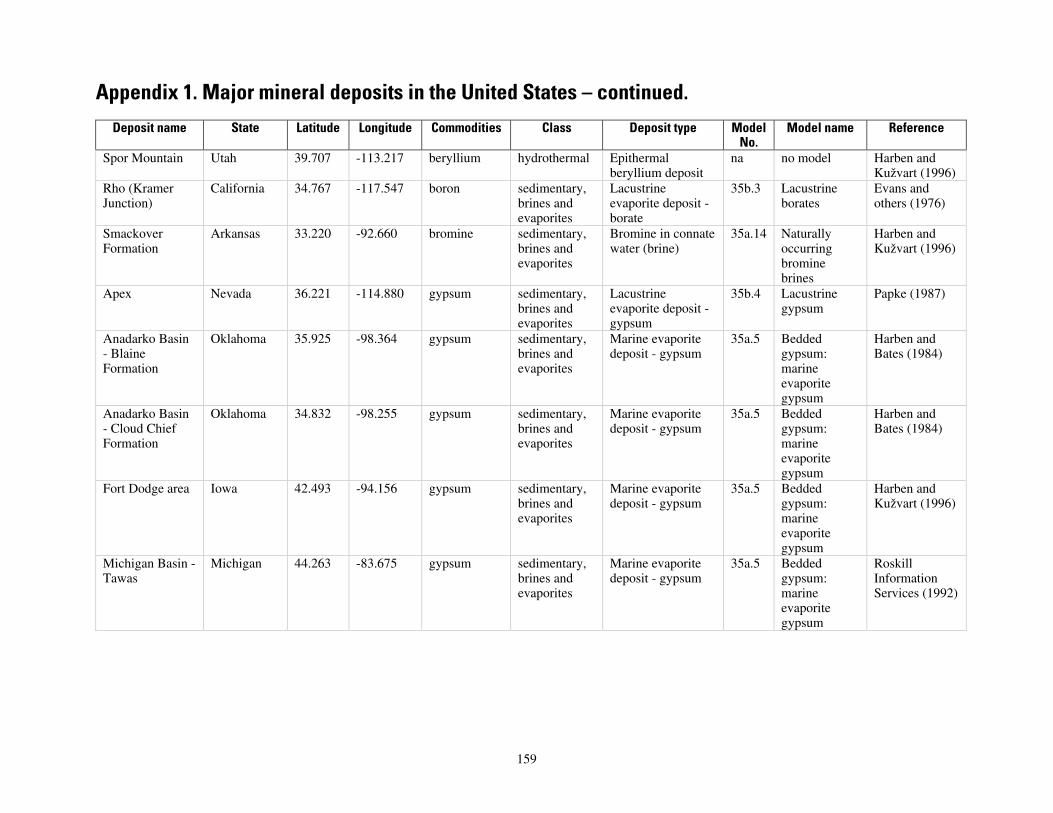
In addition this report contains a compilation of major mineral deposits in the United States (appendix 1) In the United States hundreds of thousands of mineral occurrences (a concentration of a mineral commodity that is or has been considered valuable) have been found and well over a thousand of these are thought to be significant (Long and others 1998) However most of the mineral resources and mine production in the United States are associated with a small number of large deposits For example the largest 10 percent of the known gold deposits in the world contain 86 percent of the gold that has ever been discovered (Singer 1995) Only large deposits are included in appendix 1 For some commodities (appendix 2) specific criteria were used to select the mineral deposits to include in appendix 1 for other commodities qualitative measures such as the relative proportion of material contained in the deposit compared to deposits outside the United States were used to identify major deposits
This report is not intended as a comprehensive overview of the geology or mineral resources of the United States Interested readers are referred to other available literature on the geologic evolution and mineral resources of the United States Compendiums include Bally and Palmer (1989) Brobst and Pratt (1973) Gluskoter and others (1991) Harben and Kužvart (1996) Long and others (1998) and US Geological Survey National Mineral Resource Assessment Team (2000)
Some basic terms and concepts The surface of the Earth is constantly being modified by the action of wind water
ice and the movement of large masses of rock and magma (naturally-occurring molten material from which igneous rocks are formed) The distribution of many mineral deposits is intimately related to processes that operate at the scale of the planet The discussion of mineral commodities in this report emphasizes how the geologic evolution of North America has determined the mineral resource endowment of the United States This section introduces some basic geologic concepts that are essential to understanding the genesis and spatial distribution of mineral deposits
3
The Earth consists of 3 main layers or shells like an onion (fig 2 Kious and Tilling 1996) The crust the outermost layer is rigid and relatively thin ranging in thickness from 5 to 100 kilometers Below the crust is the mantle a dense hot layer of semi-solid rock approximately 2900 kilometers thick At the center of the Earth lies the core which is composed of solid and liquid iron-nickel alloy
The theory of plate tectonics states that the Earths outer layers are fragmented into a dozen or more slabs that are moving relative to one another (figs 1 and 3 Kious and Tilling 1996) These tectonic plates are massive irregularly shaped slabs of solid rock generally composed of continental and oceanic crust and part of the underlying upper mantle that together comprise the lithosphere Plate size can vary greatly from a few hundred to thousands of kilometers across Plate thickness also varies greatly ranging from less than 15 kilometers for young oceanic lithosphere to about 200 kilometers or more for ancient continental lithosphere (for example the interior parts of North America)
The relative motion between tectonic plates generally is on the order of several millimeters per year Geologic features of the Earthrsquos crust record the movement and interaction of tectonic plates features include linear belts of mountains long narrow valleys bounded by faults volcanoes and earthquakes along the margins of tectonic plates Geologists distinguish three types of plate margins depending on their relative motion Plates can move toward each other move away from each other or slide past each other When two lithospheric plates come together a plate covered by oceanic crust will sink into the mantle forming a subduction zone On continental crust mountain belts (orogens) form where plates collide Most volcanoes on land occur parallel to and inland from subduction zones Rift zones form where plates move apart Strike-slip or transform faults form where plates slide past each other
Scientists also believe that masses of relatively hot low-density mantle rise from the upper boundary of the core (fig 4) On reaching the base of the upper mantle these mantle plumes can spread laterally and cause rock to melt forming magma (Condie 2001) Geological features linked to mantle plumes include broad doming of the crust modification of continental-scale drainage patterns rifting of continental crust and the breakup of continental tectonic plates and the rapid eruption of large volumes of magma enriched in iron and magnesium (fig 5 Buchan and Ernst 2001)
Many mineral deposits are found in areas where the movements of magmas and water-rich fluids have been focused Heat generated by the radioactive decay of elements deep within the Earth can melt rocks to form magma causes rocks magmas and fluids to move by making them less dense and more buoyant and provides the energy needed to drive chemical reactions The interaction of tectonic plates that make up the upper 200 kilometers of the Earth and ascent of plumes of hot rock toward the surface from deep within the mantle generates the magmas and fluids fractures and faults mountain ranges and sedimentary basins that are critically important to localizing magmatic hydrothermal and metamorphic mineral deposits
Magmatic mineral deposits form during the cooling and crystallization of magma These deposits are typical of igneous rocks that form from magmas enriched in magnesium nickel and chromium Some deposits such as those enriched in chromium simply are made up of crystals that grew from the magma In other cases deposits form from sulfur- or iron-rich liquids that segregate from a silicate magma and crystallize separately These sulfur- or iron-rich liquids are denser than the original magma Once formed these separated sulfur- or iron-rich liquids do not mix or blend with the silicate-
4
rich magma (the separation of oil and vinegar in a salad dressing is an example of a similar process) The sulfur-or iron-rich liquids accumulate in zones or layers and solidify Sulfide-rich liquids can be enriched in nickel copper and platinum-group elements In addition the resulting sulfide mineralization potentially contains important by-products such as cobalt gold silver selenium and tellurium the ores also are used to produce sulfuric acid and liquid sulfur dioxide Iron-rich liquids are enriched in titanium vanadium and phosphorus Large magmatic mineral deposits enriched in nickel chromium and platinum-group elements are associated with plume-related igneous activity Other magmatic mineral deposits are associated with igneous rocks that formed from magmas enriched in silicon potassium and sodium When these magmas cool the last material to crystallize may be enriched in water and elements such as lithium tantalum and niobium These igneous rocks called pegmatites are characterized by crystals that can be quite large ranging from centimeters to meters in diameter Gem minerals such as tourmaline and topaz may also form in these rocks Figure 6 shows the distribution of magmatic ore deposits in the United States
Hydrothermal mineral deposits form by the interaction of hot water and rock Water is a good solvent and hot water called hydrothermal fluid can efficiently move and deposit materials that occur in some mineral deposits Plate interactions (collisions and rifts) are characterized by the large-scale movement of magmas and hydrothermal fluids that can form hydrothermal mineral deposits (fig 7) Faults formed at plate margins form discontinuities in the crust that focus the movement of fluids and magmas Cooling igneous magmas can produce hydrothermal fluids that form a variety of deposit types enriched in a broad suite of metals (Thompson and Newberry 2000)
Not all hydrothermal fluids are directly related to magmatic activity Some hydrothermal fluids are generated in sedimentary basins - regions of the crust where relatively great thicknesses of sediment have accumulated Sedimentary basins commonly form where the interaction of tectonic plates locally cause the Earthrsquos crust to subside (Busby and Ingersoll 1995) The decay of naturally-occurring radioactive elements within the Earth causes rock temperatures to rise with increasing depth As sediments are buried hydrothermal fluids form by the heating of pore water trapped in the sediment and the break-down of water-rich minerals that are only stable at low temperatures As these hydrothermal fluids move through the crust they interact with other fluids rocks and ultimately the atmosphere locally forming mineral deposits Most hydrothermal deposits are located in the western part of the United States (fig 8)
Metamorphic deposits Rocks are changed (metamorphosed) as they are subjected to higher temperature andor pressure New minerals can form and the size and shape of existing minerals are modified Mountain building processes or burial of sediment or rocks can cause metamorphism Emplacement of magma can also cause metamorphism by heating rocks around the intrusion In some cases the new metamorphic minerals have useful properties Examples include garnet (silicate minerals containing variable proportions of iron aluminum magnesium and calcium that are used for abrasives water filtration and semi-precious gems) wollastonite (a calcium silicate used for asbestos substitutes ceramics friction products metallurgy paint plastics) and kyanite (aluminum silicate used for brake linings and clutch facings ceramics grinding and cutting wheels refractories) Figure 6 shows the distribution of metamorphic ore deposits in the United States
Rocks disintegrate when exposed to water air and microbes at the Earthrsquos surface The movement of water and air in part driven by solar radiation redistributes
5
rock and soil particles These processes can also cause the transportation concentration and localization of materials that form some types of mineral deposits Sedimentary mineral deposits are economic concentrations of minerals in sedimentary rocks that formed directly from water in oceans lakes or in underground reservoirs The precipitation of minerals can be caused by evaporation of water or by mixing of waters with different compositions The resources associated with these deposits can be quite large because minerals can be deposited uniformly over large areas The uniformity of these deposits and their lateral extent also can make them easier to mine Evaporite and brine deposits are sedimentary mineral deposits that form by the evaporation of lake water or seawater These deposits are sedimentary layers that are enriched in a variety of salts These deposits form from bodies of water that have restricted circulation and high evaporation rates Major deposits of evaporites are commonly found in sedimentary basins that formed when continental crust is pulled apart to form a rift and in sedimentary basins that form on continental crust well away from tectonic plate boundaries The composition of water constrains the mineralogy and composition of evaporite deposits (Guilbert and Park 1986) Salts that form from seawater include halite (sodium chloride) gypsum (hydrated calcium sulfate) sylvite (potassium chloride) and carnalite (hydrated calcium-magnesium chloride) The variable composition of lake water results in a variety of evaporation-concentrated mineral deposits Large deposits of nitrates sodium carbonates and borates have formed by the evaporation of lakes Sedimentary mineral deposits also include large bedded deposits of iron minerals that formed from ancient oceans Organic activity plays an important role in the formation of other sedimentary mineral deposits such as phosphate rock and diatomite Figure 9 shows the distribution of sedimentary mineral deposits in the United States
Erosion and weathering of rocks can form surficial mineral deposits Placer deposits form as heavy particles of rocks or minerals are physically concentrated by the action of moving water Placer deposits can form in active stream deposits or along the shoreline of oceans or lakes Minerals typically concentrated in placer deposits include gold platinum titanium-minerals and garnet (silicate minerals containing variable proportions of iron aluminum magnesium and calcium) Placer deposits are relatively easy to find and simple to mine Residual deposits are formed by the intense weathering of rocks under hot humid conditions The mineralogy and composition of the weathered rock determines which elements will be concentrated by weathering Aluminum nickel manganese iron and clay deposits can form by this process Weathering of near-surface exposures of mineral deposits can also form minerals that are easier to treat and extract during mining In other situations the metals leached from near surface exposures can be re-deposited near the groundwater table forming secondary enrichment zones Figure 10 shows the distribution of surficial deposits in the United States
Overview of geologic and tectonic history The movement of material in the mantle and of tectonic plates is responsible for
the development of cratons orogens large provinces of igneous rocks and rifts that are characteristic of continental crust In general the interiors of continents consist of ancient continental crust that is surrounded by younger belts of deformed rocks The ancient parts of a continent that have been structurally stable for a prolonged period of time are called cratons (Condie 1997) The younger curvilinear belts of deformed rocks often accompanied by metamorphic and igneous rocks are called orogens The linear belts of
6
igneous rocks associated with orogens are called igneous arcs Orogens form on continental crust in response to the convergence of tectonic plates Young orogens are expressed on the Earthrsquos surface as mountain ranges Orogens are important in the formation of mineral deposits the collisional process provides heat to generate magmas and hydrothermal fluids and fractures and faults that focus their flow Many types of mineral deposits are spatially and temporally associated with orogenic belts
Parts of some continents are characterized by large tracts of igneous rocks enriched in magnesium and iron (basalt) that are not associated with orogens These igneous rocks along with sedimentary rocks found in long linear fault-bounded valleys may have formed as mantle plumes reached the base of the crust or as tectonic plates moved away from each other As with orogens heat related to magmatism and faulting can give rise to a variety of mineral deposits in this geologic setting
Throughout this report events related to the physical formation and development of the Earth are described using either absolute (chronometric) or relative (chronostratigraphic) time scales Absolute time is reported as numerical ages in billions of years (Ga) or millions of years (Ma) that are measured using radiometric dating methods Relative time is based relations of rock units and fossils that can be recognized globally These relative subdivisions of geologic time have been given names and are grouped hierarchically the boundaries between these units can be calibrated using the absolute time scale (fig 11)
The geologic architecture of the United States uniquely reflects the sequence of geologic events that culminated in the distribution of rocks (fig 12) and mineral deposits (figs 6 8 9 and 10) we see today The more we know about the geologic fabric of each continent and the processes that control the regional and local distribution of mineral deposits the better we can predict where new deposits will be found and what they may contain
Today most of the United States land mass lies on one tectonic plate the North American plate (fig 1) The western margin of this plate is the site of an orogen that started to develop 100s of millions of years ago and is still active today The mountain ranges active volcanoes and earthquakes that are characteristic features of the landscape of the western conterminous United States and Alaska are a result of on-going subduction and transform motion between tectonic plates Magmatic activity at Hawaii and Yellowstone is thought to be the result of mantle plumes However the plates and continents have not always been dispersed around the globe as they are today
The geology of the United States records a long history of tectonic plate and mantle plume interactions (figs 13 and 14) The rocks that make up the interior of the North American continent were assembled by the merger of smaller continental masses during the Early Proterozoic followed by the accretion of younger continental crust during the Middle Proterozoic (Hoffman 1989) The oldest continental crust is exposed in Archean cratons Most of the Archean cratons that make up the interior of the conterminous United States are now covered by younger sedimentary rocks Part of the largest Archean craton in North America the Superior province is exposed in Minnesota Archean rocks of the Wyoming province are exposed in some mountain ranges in Wyoming and Montana Although older rocks are present these cratonic provinces experienced strong compression magmatism and metamorphism between 28 and 26 Ga During the Archean these cratons appear to have been separate continental masses About 19-17 Ga convergence of tectonic plates welded the Superior and Wyoming cratons together the convergent boundary is delineated by the Trans-Hudson orogen
7
Subduction of tectonic plates along the southern margin of the combined Superior and Wyoming provinces created several orogens that added new continental crust to the North American continent The oldest is the Penokean orogen south of Lake Superior Younger orogens (Yavapai Mazatzal Central Plains) developed between 18 and 16 Ga and accreted additional crust to the southern margin of the North American continent Following these events the North American continent experienced no orogenic activity for about 350 million years
Many if not all of the major continents were joined together during the Middle Proterozoic (about 13 to 10 Ga) and the Paleozoic (between about 543 and 248 Ma (millions of years before the present) forming super continents called Rodinia and Pangea respectively (Condie 1997) The Middle Proterozoic Grenville orogen exposed from eastern Canada to Mexico formed during the series of plate collisions that formed Rodinia (fig 13) This supercontinent broke apart between 750 to 550 Ma The Paleozoic Appalachian orogen in the eastern United States and the Ouachita orogen in Arkansas and Texas formed during the assembly of Pangea (figs 12 and 13) Pangea began to break up about 160 Ma In the Middle and Late Jurassic the North American continent split from Africa and Europe to form the North Atlantic Ocean The breakup of the continents was accompanied by igneous activity and the formation of rift-related sedimentary basins
The Cordilleran orogen lies on the western part of the North American continent The orogen developed along a continental margin that formed about 600 Ma during the breakup of the super continent Rodinia This orogen reflects intermittent convergent margin tectonic activity between oceanic and continental plates starting in middle Paleozoic time and continuing to present (Bally and Palmer 1989 Burchfiel and others 1992) The Cordilleran orogen is one of the longest-lived orogenic belts in the world The long history of magmatic and tectonic activity and its young age has resulted in the formation and preservation of a large number of major mineral deposits
About 20 igneous events in the United States are linked to mantle plumes (fig 14 Ernst and Buchan 2001) Many of these events are also associated with the development of continental rifts The igneous rocks associated with these events range in age from a few million years to 29 billion years Examples of geologic provinces related to plume events are the Tertiary Columbia River flood basalt province in Washington Oregon and Idaho the Triassic Wrangellia rocks of Alaska and the Late Proterozoic Keewenawan flood basalt province that extends from Kansas to Minnesota and Michigan (fig 12) These provinces are characterized by the rapid eruption of large volumes of sheet-like lava flows that are enriched magnesium and iron Major mineral deposits are associated with the Keewenawan event and the older Stillwater event in Montana Plume-related magmatic activity also appears to be associated with the tectonic events that resulted in the breakup of the Rodinian and Pangean supercontinents
Principal commodities and deposit types For this report information is organized following usage in USGS Minerals
Yearbooks Metallic and industrial commodities are distinguished with each commodity listed alphabetically and discussed under one of these categories Some mineral deposits produce more than one commodity The discussion for these polymetallic deposits is repeated for each commodity that is present This creates some redundancy in the report
8
however it allows each commodity section to stand alone if the reader wants to relate this discussion to information in the USGS Minerals Yearbooks
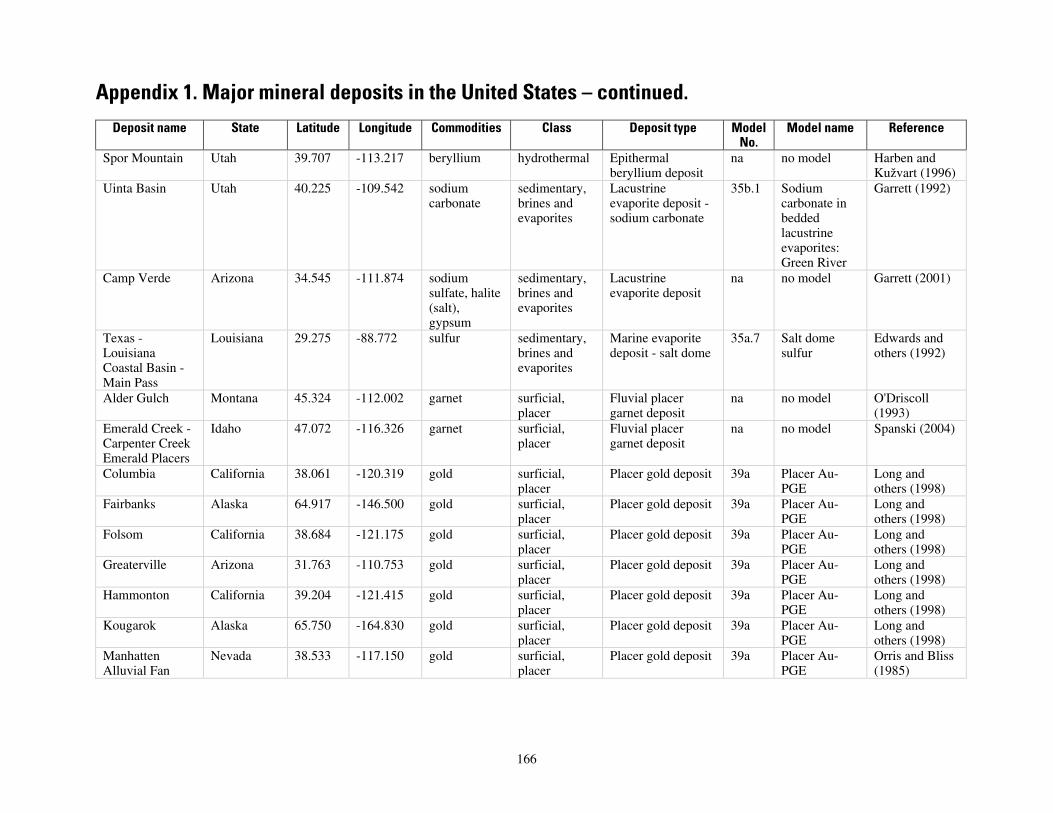
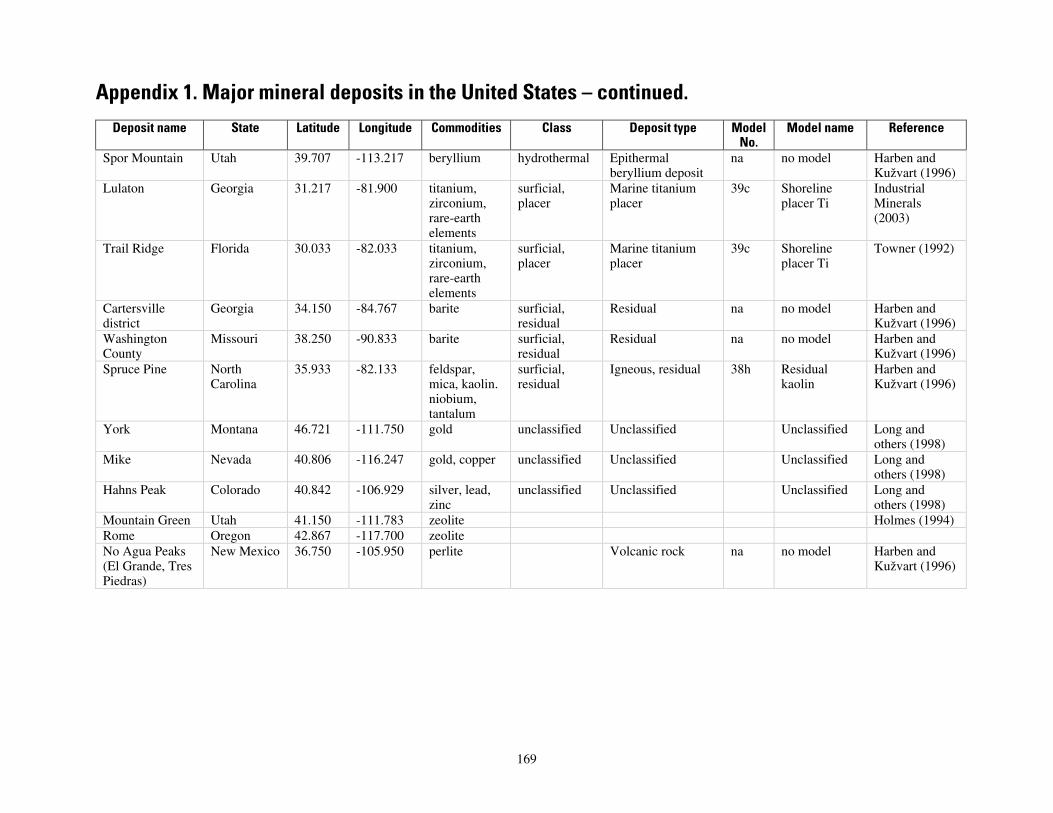
Appendix 1 is a compilation of the major mineral deposits in the United States The importance and diversity of mineral deposits as sources of commodities in our modern society is evident from almost 400 major mineral deposits summarized in appendix 1 This table gives the deposit name the commodities produced deposit-type categories and a reference At some level of understanding every mineral deposit is unique However shared characteristics of some deposits allow them to be considered as a group Studies of these groups provide the insight needed to recognize the fundamental processes and controls that lead to the formation of mineral deposits These insights can be formalized as models that give geologists the ability to understand the known distribution of mineral deposits and to predict the location quantity and quality of undiscovered resources Therefore if possible the mineral deposit model (Cox and Singer 1986 Stoeser and Heran 2000) that applies to each deposit is also given
Although the table is comprehensive our discussion focuses on those commodities produced in the United States that constituted at least 5 percent of global production or global reserve base in 2003 (Appendix 3) or had at least $100 million production value in 2001 (table 1) For each commodity the use of the commodity the United States contribution to world production and reserves and the geology of the deposits that account for the majority of the commodity production in the United States are briefly described The geologic discussion focuses on the combination of geologic factors that concentrated the commodity into a deposit A broad genetic classification of mineral deposits is used as the primary framework for discussion Our simple classification includes magmatic hydrothermal metamorphic sedimentary and surficial mineral deposits
9
Metals
Beryllium Beryllium is a hard silvery-white and very light metal with a very high melting
point The combination of its light weight and high melting point make it valuable for making metal alloys which are used in electronic and electrical components and aerospace and defense applications (Mineral Information Institute USGS and American Coal Foundation undated)
Table 2 Beryllium - proportion of world mine production for the United States
[USGS 2004]
Country Percent of world production 2003
Rank of world production
United States 621 1 Known world resources of beryllium have been estimated to be more than 80000
metric tons In 2003 the apparent consumption of beryllium in the United States was 190 metric tons (USGS 2004) About 65 percent of the global beryllium resource is in the United States for the most part concentrated in the Spor Mountain and Gold Hill areas in Utah and the Seward Peninsula area in Alaska The United States produced over 60 percent of the total world output of beryllium in 2003
The deposits in the Spor Mountain region of Utah (fig 15) are the only developed source of beryllium in the United States and North America (Brush Engineered Materials Inc 2003) Proven bertrandite (hydrous beryllium silicate) reserves in Utah total about 16000 metric tons of beryllium These proven ore reservesmdashthe largest in the worldmdashare sufficient to fill the requirements of the worldrsquos beryllium industry for at least the next sixty years based on present production rates
The hydrothermal mineralization at Spor Mountain is associated with a volcano that was active about 20 million years ago The volcanic activity formed a caldera (a large basin-shaped volcanic depression) deposited layers of volcanic fragmental rock or tuff and erupted silica-rich lavas Beryllium mineralization along with fluorite (calcium fluoride) and uranium is found in the volcanic tuff unit (Lindsey 1998) The volcanic complex is part of an east-west trending belt of igneous activity that developed late in the evolution of the Cordilleran orogen and extends from the Sierra Nevada to the Wasatch Range in Utah (Christiansen and Yeats 1992)
10
Cobalt Cobalt is a bluish-gray shiny brittle metallic element Some applications of
cobalt include catalysts cemented carbides for cutting tools and drill bits drying agents for paints magnets and superalloys for jet engine components (Mineral Information Institute USGS and American Coal Foundation undated) Identified world cobalt resources are about 15 million metric tons (USGS 2004) The apparent consumption of cobalt in the United States in 2003 was 10000 metric tons (USGS 2004)
Table 3 Cobalt - proportion of world mine production reserves and reserve base for the
United States
[USGS 2004 reserves and reserve base are defined in Appendix 3]
Country Percent of world production 2003
Rank of world production
Percent of world reserves
Percent of world reserve base
United States
-- -- -- 72
Cobalt can be recovered from mineral deposits developed primarily for their
cobalt content or as a by-product of mining nickel Mines in the United States currently are not producing significant quantities of cobalt However primary cobalt reserves have been identified and are associated with metamorphosed hydrothermal deposits in Idaho (fig 15) By-product cobalt resources also could be recovered if the copper-nickel-PGE deposits associated with the Duluth Complex Minnesota are developed (see discussion under copper nickel or platinum-group elements)
The primary cobalt deposits in Idaho formed when hydrothermal solutions moving along fractures towards the Earthrsquos surface vented into the ocean and formed hot springs (fig 16) The hydrothermal solutions mixed with ocean water and formed layered deposits of sulfide minerals enriched in iron cobalt copper and gold on the seafloor Geologists refer to this type of mineralization as sedimentary exhalative (sedex) deposits The ore minerals were deposited in sedimentary rocks from hydrothermal solutions that may have been generated as water-rich sediments were deeply buried in sedimentary basins within the crust Thin layers of volcanic rock in the sedimentary basins suggest igneous processes also may have had some role in generating the hydrothermal fluids Deposits may have been localized near faults that were active during sedimentation and provided channel ways for the fluids to escape to the surface
Sedimentary-exhalative cobalt deposits occur in a linear trend in east-central Idaho The belt extends for about 55 kilometers and contains at least eleven sediment-hosted copper-cobalt deposits and occurrences (Box and others 1995) Recently Formation Capital has established a cobalt-copper-gold reserveresource on two zones the Sunshine and Ram deposits (Formation Capital undated) The diluted proven and probable reserves and inferred resources for their Idaho Cobalt Project are estimated to be 286 million metric tons grading 0602 percent cobalt 045 percent copper and 05 grams per ton gold (Shedd 2002) Nearby the Blackbird deposit has resources estimated to be 489 million metric tons grading 071 percent cobalt and 124 percent copper (Spanski 2004)
11
The cobalt deposits are hosted in a Proterozoic sedimentary basin (the Belt basin) that is made up of about 16 kilometers of layered sedimentary rocks covers 200000 square kilometers and extends from Idaho Montana and Washington north into Canada (fig 17 Chandler 2000) This basin formed about 15 Ga when a rift developed on a supercontinent that was made up of most of North America along with Siberia Australia or Antarctica filled with sediment (Chandler 2000 Lydon 2000) The high heat flows associated with basins that form as continents are pulled apart or rifted generate hydrothermal fluids that can form sedex deposits (Lydon 1988 Lydon 1996) Sedex deposits with lead and zinc are relatively common and found world-wide (Lydon 1996) those enriched in cobalt and copper have only been described from Idaho
12
Copper Copper is a mineral and an element (Mineral Information Institute USGS and
American Coal Foundation undated) Copper has become a major industrial metal because of its high ductility malleability thermal and electrical conductivity and resistance to corrosion it ranks third after iron and aluminum in terms of quantities consumed About one-half of the copper and copper alloys are used in building construction and about one-half of the remainder is used in electric and electronic products Known land-based resources are estimated to be 16 billion metric tons of copper (USGS 2004) In 2003 the apparent unmanufactured consumption of copper in the United States was 2370000 metric tons (USGS 2004) The United States supplied about 8 percent of the worldrsquos production of copper in 2003 United States copper production largely comes from deposits in Arizona New Mexico and Utah The location of major copper deposits in the United States is shown in figure 18
Table 4 Copper - proportion of world mine production reserves reserve base and
resource base for the United States
[USGS 2004 Singer 1995 reserves and reserve base are defined in Appendix 3]
Country Percent of world production 2003
Rank of world production
Percent of world
reserves
Percent of world reserve
base
Percent of world discovered resources
United States
81 3 74 75 192
Currently most of the copper production in the United States is derived from
large relatively low grade hydrothermal mineral deposits that formed beneath composite volcanoes Important undeveloped hydrothermal copper deposits are hosted by sedimentary rocks in Montana these deposits are also enriched in silver Historically considerable copper production came from hydrothermal deposits associated with plume-related volcanic lava flows in Michigan In the future significant copper production can be expected from magmatic copper-nickel deposits in the Duluth Complex in Minnesota
Porphyry copper deposits Hydrothermal copper mineral deposits associated with composite volcanoes are called porphyry-type deposits by geologists (figs 19 and 20) The name is derived from the close association of mineralization with igneous rock called porphyry Most of the minerals that make up porphyry are too small to discriminate by eye however they also contain conspicuous larger crystals scattered throughout the rock This texture is indicative of crystallization and cooling of magma near the surface of the Earth
Porphyry intrusions and associated hydrothermal copper mineralization form deep beneath composite volcanoes Some magmas that erupt to the Earthrsquos surface create steep-sided symmetrical cone-shaped composite volcanoes comprised of alternating layers of lava flows volcanic ash cinders blocks and bombs (Kious and Tilling 1996) A composite volcano such as Mount Rainier in Washington can rise as much as 2500 meters above the surrounding landscape Magma that crystallizes deep within the volcano forms porphyry intrusions
13
Magma that forms composite volcanoes is typically rich in gases like water and carbon dioxide The release of these gases as the magmas reach the surface can result in explosive eruptions they are also a component of the hydrothermal fluids that are typically associated with these magmas Porphyry copper deposits are derived from hydrothermal fluids released from and driven by the cooling magma As the fluids cool and react with rocks copper is deposited both in the igneous porphyry intrusions as well as adjacent rocks (fig 19) As the hydrothermal fluids move away from the porphyry intrusions mineral deposits rich in lead zinc gold and silver are also formed (figs 19 and 20) An average porphyry copper deposit can contain 140 million metric tons of mineralization with 05 percent copper (Singer and others 2002) Most porphyry copper deposits are found in rocks younger than 300 million years
Composite volcanoes and associated porphyry copper deposits are not randomly distributed over the Earths surface Most are concentrated on the edges of continents or along island chains in the oceans In North and South America more than 270 composite volcanoes have been active in the last 10000 years almost of them occur in linear belts along the western margins of these continents (Siebert and Simkin 2002) The linear belts of modern volcanic activity are clearly associated with the convergence and subduction of tectonic plates Today off the coast of Washington Oregon and northern California the Juan de Fuca tectonic oceanic plate is pushing into and is sinking (being subducted) under the continental part of the North American Plate (fig 1) This convergence of oceanic and continental plates generates the magma that is erupted to form the active composite volcanoes such as Mount Rainier and Mount St Helens in the Cascades Range
For at least the last 300 million years the western margin of the North American continent has been a convergent plate boundary where the Earthrsquos tectonic plates are moving toward each other Subduction and destruction of oceanic crust has created linear belts of igneous rocks on the continental crust that makes up the western side of the North American continent The position duration and intensity of these igneous belts have shifted with time Variable uplift and erosion have cut through the volcanic rocks to expose underlying igneous intrusions that may host copper deposits Subduction may have caused many thousands (millions) of igneous intrusions to be emplaced in the Cordillera orogen of North America so far exploration geologists have found over 200 porphyry copper deposits along the western margin of the North American continent (Singer and others 2002) Approximately 100 porphyry copper deposits occur in the United States and almost half of these are found in southeastern Arizona and southwestern New Mexico
The largest copper-producing operations in the United States are all porphyry copper deposits Eight of the 9 top producers are in southeast Arizona and southwestern New Mexico (National Mining Association 2003a) The remaining deposit is in Utah The largest deposits in the United States are ContinentalButte in Montana and Morenci-Metcalf and Safford in Arizona all three deposits each contained over 32 million metric tons of copper Safford contains over 7 billion metric tons of ore averaging 044 percent copper (Singer and others 2002) These ore bodies also are an important source of molybdenum gold and silver
Revett copper deposits Revett copper deposits are lens-shaped bodies of disseminated copper sulfides with silver that occur in a narrow interval of sedimentary layers in a large sedimentary basin (Hayes and Einaudi 1986 Hayes and others 1989 Hayes 1990 Cox and others 2003) However mineralization does not necessarily
14
conform to sedimentary bedding These deposits form after the host sediment is deposited but in most cases before the sediment is converted into solid rock The ore minerals appear to have been deposited from waters that filled pores between the sediment particles These copper deposits are formed where waters of different composition and temperature mix in the subsurface in porous sediments The distribution of minerals in the rocks that host the deposit indicate that the sulfide minerals were deposited as warm salty metal-bearing water (brine) moved through the porous beds and mixed with cool pre-existing pore water
Revett-type copper deposits occur in quartzite beds (quartz-rich metamorphosed sedimentary rocks) of the Revett Formation in the Belt basin a middle Proterozoic sedimentary basin (fig 21 Harrison 1972) The Belt basin covers 200000 square kilometers and extends from Idaho Montana and Washington north into Canada (fig 17 Chandler 2000) This basin formed about 15 Ga when a rift developed on a supercontinent that was made up of most of North America along with Siberia Australia or Antarctica filled with sediment (Chandler 2000 Lydon 2000) Over 16 kilometers of layered sedimentary rocks were deposited in this basin The sediment layers were originally deposited on the bottom of a lake or an embayment open to the ocean As layers were buried by younger sediments their pore waters become warmer and contained more dissolved components Copper can be one of these dissolved components if ferromagnesian minerals (dark-colored minerals enriched in magnesium andor iron) or mafic rock fragments (rock chiefly composed of ferromagnesian minerals) are present in the sediments The pressure of the overlying sediments and the high geothermal gradients associated with basins that form as continents are pulled apart can ultimately drive these warm brines upwards along faults that were active during deposition of the basin Fluid mixing responsible for mineral deposition occurred as these brines moved vertically through the section and laterally into the porous sediment layers that ultimately were converted into quartzite
Long and others (1998) described 9 significant Revett-type copper deposits 2 deposits are large enough to include in this compilation The median size of a Revett-type sediment-hosted copper deposit is 14 million metric tons with 079 percent copper and 31 grams per ton silver (Cox and others 2003) The largest deposit Rock Lake-Rock Creek contains approximately 300 million metric tons of ore containing 081 percent copper and 71 grams per ton silver
Native copper deposits associated with basalt flows Approximately 11 Ga a mantle plume is thought to have developed under what is now the area around Lake Superior This plume event was associated with the eruption of lavas and emplacement of igneous intrusions between 1109 and 1087 Ma along a linear belt where the earthrsquos crust subsided forming a rift valley The rift extends for more than 2500 kilometers from Kansas northward beneath Lake Superior and then southeast through Michigan (fig 8) however exposures of rocks related to the rift are only found in the Lake Superior region (Schulz and Cannon 1997) Part of the igneous activity involved the voluminous eruption of sheet-like lava flows now consisting of a rock called basalt (an igneous rock enriched in iron and magnesium) Taken together these basalt flows exceed 10 kilometers in thickness Some of these lavas the Portage Lake Volcanics are well-exposed on the Keweenaw Peninsula of upper Michigan (fig 22) Relative to other types of volcanic rocks basalts like those that form the flows in Michigan are enriched in copper Hydrothermal solutions generated deeper in the rift basin leached copper from the basalt flows and deposited copper minerals principally as native copper in thin layers of
15
sediments between lava flows or in the rubble that occurs along the base or top of lava flows Prehistoric Native Americans found and mined native copper from these deposits Before large-scale mining of porphyry copper deposits began early in the 20th century these deposits in basalt flows in Michigan were an important source of copper in the United States Long and others (1998) described 13 significant native copper deposits associated with basalt flows in Michigan 3 are large enough to include in this compilation There are no active mines on these deposits
Magmatic copper-nickel deposits in the Duluth Complex Igneous intrusions formed during the 11 billion Ga mantle plume event in the Lake Superior area also contain copper mineralization The largest of the intrusions occurs in Minnesota and is known as the Duluth Complex (fig 22 Miller Green and others 2002) When this intrusion was emplaced it reacted with the surrounding rocks resulting in the formation and segregation of immiscible liquids containing sulfur iron copper nickel platinum-group elements and cobalt As a result large volumes of rock with a few percent sulfide minerals occur along the western margin the Duluth Complex locally the rocks are made up almost entirely of sulfide minerals Exploration activity has delineated several low-grade copper-nickel deposits in these rocks that have local zones enriched in platinum-group elements At this time no mines are developing these resources Listerud and Meineke (1977) estimate the resources along the western margin of the complex to be 4400 million short tons of rock containing 066 percent copper and 020 percent nickel Subsequent exploration has focused on three deposits ndash Dunka Road (the Northmet project) Babbitt (the Mesaba project) and Maturi An open pit minable resource of 808 million metric tons containing 0432 percent copper 0109 percent nickel 0166 grams per ton platinum 0437 grams per ton palladium 0061 grams per ton gold and 15 grams per ton silver has been defined at the Northmet project (Polymet Mining Corporation 2003) Copper along with platinum-group elements and nickel will be recovered when these deposits are developed Worldwide this type of large tonnage low grade copper-nickel-PGE mineralization is relatively uncommon Similar deposits are known in South Africa Finland Australia Canada and Russia
16
Gold Gold is a metallic element that is beautiful durable easily worked and rare
(Mineral Information Institute USGS and American Coal Foundation undated) It has been used throughout human history for jewelry and as currency It is also chemically stable and as a result seldom combines with other elements It does not corrode or rust and conducts heat and electricity very well Gold is very malleable and ductile Today gold is primarily used in coins and jewelry and is stored by many countries to support their currencies It is also used in dentistry and electrical and electronic applications
About 190000 metric tons of gold has been discovered in the world (Singer 1995) About 10 percent of total gold discovered is in the United States Total world gold resources are currently estimated to be about 100000 metric tons (USGS 2004) The reported consumption of gold in the United States in 2003 was 150 metric tons (USGS 2004) The location of major deposits of gold in the United States is shown in figure 23
Table 5 Gold - proportion of world mine production reserves and reserve base for the
United States
[USGS 2004 reserves and reserve base are defined in Appendix 3]
Country Percent of world production 2003
Rank of world production
Percent of world reserves
Percent of world reserve base
United States
102 3 130 68
Major gold deposits are either hydrothermal or surficial Over 80 percent of the
295 metric tons of gold produced in the United States in 2002 came from mines in Nevada (Price and Meeuwig 2002) These mines also produced 422 metric tons of silver approximately 30 percent of United States output The gold and silver in Nevada are mined from three types of hydrothermal deposits ndash Carlin-type gold deposits distal disseminated gold deposits and epithermal gold deposits
Sedimentary rock-hosted or Carlin-type gold deposits contain most of discovered gold resources in Nevada The gold in these deposits is associated with small amounts (about 5 percent) of pyrite (iron sulfide) that is dispersed through altered sedimentary rocks that contain more than 50 percent carbonate minerals (Hofstra and Cline 2000) The gold grains form particles that are usually less than a millionth of a meter in diameter The hydrothermal fluids that formed these deposits moved upwards along major structures until they encountered units that restricted fluid flow At that point the fluids migrated laterally into sedimentary units that easily allowed the movement of fluids As the fluids reacted with the rock they dissolved carbonate minerals and deposited clay minerals silica and gold-bearing pyrite (iron sulfide) Gold ore is concentrated in areas where faults and fractures intersect rocks that easily react with hydrothermal fluids Most deposits formed at depths of greater than 2 kilometers The vertical extent of gold mineralization in a deposit rarely exceeds 1000 meters more commonly mineralization extends over vertical intervals of 100 to 500 meters The largest example of a Carlin-type deposit Betze-Post contains 1250 metric tons of gold (fig 24 Bettles 2002)
17
These deposits are associated with the processes that formed the Cordilleran orogen specifically when tectonic plate motions changed directions about 43 Ma (Hofstra and Cline 2000) This change in plate motion was associated with the development of an east-west trending subduction related igneous belt that formed at the same time that the Earthrsquos crust was slowly being pulled apart However the gold deposits are not spatially associated with igneous centers instead they are located along old (Late Proterozoic) faults that penetrate deep into the crust (fig 25) Different types of hydrothermal fluids can be generated in this type of setting research on these deposits has not definitively identified the process that generated the ore-forming fluid More than 100 Carlin-like gold deposits and occurrences are now recognized in northern Nevada and northwest Utah with a pre-mining resource of more than 4800 metric tons of gold About 20 percent of this resource had been recovered by the end of the twentieth century (Kerrich and others 2000) Eleven deposits are included in this compilation
Distal disseminated gold deposits are found sedimentary in rocks that may be over a kilometer from igneous intrusions that cooled and crystallized to form porphyry copper deposits (fig 19 see discussion on copper for a description of porphyry copper deposits) These deposits share many of the characteristics of Carlin-type gold deposits except that the hydrothermal fluids are clearly related spatially and genetically to the cooling and crystallization of subduction-related magmas that formed nearby porphyry copper deposits and related replacement and vein deposits (Cox 1992) Gold and silver mineralization is associated with the dissolution of carbonate minerals and the deposition of silica in sedimentary units Silver and gold minerals may be dispersed throughout altered sedimentary rock or be concentrated in narrow veinlets and fractures (Peters and others 2004) Fractures are the most important feature that controlled the flow of hydrothermal fluids and the concentration of gold and silver These deposits have significantly higher silver grades than Carlin-type deposits Long and others (1998) described 25 significant deposits in the United States 1 deposit in Arizona and 4 in Nevada are large enough to include in this compilation Distal disseminated deposits currently being mined in Nevada include McCoy-Cove and Rochester Silver is the dominant commodity in these deposits However they produce significant by-product gold
Epithermal gold deposits form less than a kilometer below the surface of the Earth and typically are found with volcanic rocks that are related to igneous arcs formed at convergent tectonic plate margins (Cooke and Simmons 2000 Hedenquist and others 2000) Typically the volcanic rocks were erupted on the land surface rather than beneath the ocean These deposits commonly are found in young orogens where rocks formed near the surface of the earth are more likely to be preserved These epithermal deposits can be enriched in gold and silver and also can contain minor amounts of zinc lead andor copper
The most common type of deposit forms from hydrothermal fluids that are similar to waters tapped by drilling beneath modern geothermal hot springs In most cases geothermal systems are driven by intrusions located as much as 5 to 6 kilometers below the surface Epithermal gold deposits formed from geothermal systems usually occur several kilometers above the site of the igneous intrusion Gold deposition is initiated as the hydrothermal fluids start to boil when they approach the surface Gold is commonly associated with quartz (silicon oxide) and adularia (potassium aluminum silicate) Gold is concentrated in places where the hydrothermal solutions could easily flow ndash fractures faults and porous volcanic and sedimentary units (fig 26) Ore bodies can extend
18
laterally hundreds or thousands of meters but rarely extend more than 600 meters vertically Clusters of epithermal deposits cover areas that range from a few to several tens of square kilometers If the hydrothermal fluids discharge to the land surface they form boiling hot springs that deposit silica similar to those found today in Yellowstone National Park Long and others (1998) described 129 significant epithermal and hot-spring gold deposits in the United States 11 deposits are large enough to include in this compilation Over 40 percent of the significant and major deposits are in Nevada significant deposits also occur in Alaska Arizona California Colorado Idaho Montana North Carolina New Mexico Oregon South Carolina Utah and Washington Examples of epithermal deposits recently being mined include Round Mountain Mesquite and McLaughlin
Outside of Nevada several other types of major gold deposits are found in the United States Some gold placer deposits and hydrothermal orogenic gold veins were the principle sources of gold production in the 19th and early 20th centuries A belt of hydrothermal porphyry gold deposits is currently being developed in northwestern Canada and south-central Alaska
Orogenic gold veins are associated with major fault zones that occur in orogens formed by convergence of tectonic plates (Hageman and Brown 2000) These fault zones cut regionally metamorphosed rocks of all ages are up to several kilometers wide can be over 100 kilometers long and are nearly vertical These fault zones were the pathways for hydrothermal fluids generated by subduction-related thermal events Scientific studies have not conclusively determined if the hydrothermal fluids have an igneous or metamorphic origin Gold deposition occurred in and near fault zones at depths ranging from 3 to 20 kilometers Gold mineralization is primarily associated with hydrothermal veins that occur near the major fault zones in metamorphic rocks Mineralization in the veins can be traced over 2 kilometers in depth The metamorphic rocks that most commonly host the gold deposits are sedimentary and volcanic rocks that formed at the margins of the converging tectonic plates World-wide quartz-carbonate-gold veins have been found in metamorphic rocks of all ages However most of the mineralized veins in the United States have been found in the Cordilleran orogen in California
The veins are mainly composed of quartz (silicon oxide) with less abundant carbonate minerals Pyrite (iron sulfide) and arsenopyrite (iron arsenic sulfide) constitute less than 5 percent of the veins The main ore mineral in most deposits is native gold The gold in these veins can be abundant coarse-grained and easy to extract However gold is commonly concentrated in rocks next to the veins that are iron-rich and difficult to deform such as banded iron formation (sedimentary rock consisting of alternating iron-rich and silica-rich layers) Examples of quartz-carbonate-gold veins associated with banded iron formation include the Homestake mine in South Dakota
These deposits have been a significant source of historic (and prehistoric) gold production Long and others (1998) described 150 significant orogenic gold deposits primarily in the western United States and Alaska 6 deposits in Alaska California and South Dakota are large enough to include in this compilation Over 70 percent of the significant deposits occur in the western foothills of the Sierra Nevada This belt of quartz-carbonate-gold veins is known as the Mother Lode the discovery of placer gold deposits derived from these veins caused the 1849 gold rush to California
Intrusion-related gold ndash Tintina gold belt Gold exploration has recently focused on igneous intrusions formed at convergent plate margins Upon cooling the magmas generated by subduction at convergent tectonic plate margins can generate hydrothermal
19
fluids that can form porphyry copper deposits (see discussion under copper) or replacement deposits (such as the distal disseminated gold deposits discussed earlier in this section) The association of gold with these particular hydrothermal systems has been known for decades
Recently a new type of gold deposit associated with igneous rocks has been defined (Thompson and Newberry 2000) Like porphyry copper deposits these gold deposits are related to hydrothermal systems formed during the cooling of magmas generated by the convergence and subduction of tectonic plates However the composition of the magma is different from the magmas that are associated with porphyry copper deposits mineralization associated with the hydrothermal systems is characterized by economically significant gold high concentrations of bismuth arsenic antimony and tellurium and low concentrations of copper molybdenum tungsten and tin The best examples of this style of mineralization are associated with a Cretaceous igneous arc in the Cordilleran orogen that extends from the Yukon Territory in Canada to interior Alaska (also known as the Tintina gold belt) However similar gold deposits have been described in subduction-related igneous arcs in Europe central Asia northeast China eastern Australia and Bolivia (Thompson and Newberry 2000) Long and others (1998) described 6 significant intrusion-related gold deposits in the United States (5 in Alaska and 1 in Nevada) 2 deposits Donlin Creek and Fort Knox are large enough to include in this compilation
Placer gold deposits Heavy minerals like gold can be concentrated in sediments by moving water These gold-rich sediments or placers are derived by weathering and erosion of hydrothermal deposits with relatively coarse-grained particles of gold Placer gold deposits can be high grade easy to locate and relatively simple to mine Most of these deposits have been found with little difficulty by prospectors with little or no formal training in geology These deposits usually were the first metal deposits to be discovered and developed in the eastern and western areas of the United States
Placer gold deposits in the United States have produced over 2500 metric tons of gold (Long and others 1998) This represents about 20 percent of the gold production in the United States through 1998 154 significant placer gold deposits have been described in the western conterminous United States and Alaska Most of these deposits are related to the development of the Cordilleran orogen Ten placer deposits in Alaska Arizona California and Wyoming are large enough to include in this compilation (fig 23)
Most placer gold production in the United States came from deposits in California (1170 metric tons) and Alaska (750 metric tons) (Long and others 1998) The largest concentration of gold placer deposits in the United States is along the western side of the Sierra Nevada in California The 1849 gold rush initiated the development of these deposits ultimately producing more than 1000 metric tons of gold These placer deposits as well as some of the larger deposits in Alaska were derived from orogenic gold deposits Most placer gold mining in the United States took place in the 19th and early 20th century Although identified gold resources still remain in placer gold deposits they are unlikely to be developed on a large scale because of the impact to aquatic and riparian environments Small-scale and recreational placer mining will continue to be a minor source of gold production in the United States
Other deposit types Significant quantities of gold are recovered from the porphyry copper deposits in the Cordilleran orogen (see copper discussion) and from volcanogenic massive sulfide deposits in Alaska (see lead-zinc discussion)
20
Iron ore Iron is one of the most abundant elements on Earth but it does not occur in nature
in useful metallic form (Mineral Information Institute USGS and American Coal Foundation undated) Iron ore is the term applied to a natural iron-bearing mineral or rock in which the content of iron is sufficient to be commercially usable Metallic iron from which steel is derived must be extracted from iron ore Iron ore is the source of primary iron for the worlds iron and steel industries Identified world resources are estimated to exceed 800 billion metric tons of crude ore containing more than 230 billion metric tons of iron The United States is ranked seventh in the world in iron ore production and has about 5 percent of the world reserve base (USGS 2004) In 2003 the apparent consumption of useable iron ore in the United States was 56100000 metric tons (USGS 2004) The locations of major iron deposits in the United States are shown in figure 27
Table 6 Iron ore - proportion of world mine production reserves and reserve base for the
United States
[USGS 2004 reserves and reserve base are defined in Appendix 3]
Country Percent of world production 2003
Rank of world production
Percent of world reserves
Percent of world reserve base
United States
45 7 47 46
Most of the iron mined in the United States comes from iron-rich sedimentary
deposits (called banded iron formation or BIF) that occur in Minnesota Michigan and Wisconsin (fig 22) These deposits originally formed flat-lying sedimentary layers but have been tilted and deformed in later orogenic events The most important occurrences are in the Mesabi Marquette and Menominee Ranges (Kuck 1998) Most of the iron production has been from deposits in the Mesabi Range in Minnesota Leading iron producers in 2001 include Hibbing Taconite Co Minntac National Steel Pellet Co and Thunderbird in Minnesota and Empire Iron Mining Partnership and Tilden Mining Co in Michigan (National Mining Association 2003a)
BIF is not unique to this region More than 95 percent of iron resources of the world occur in banded iron formation (Gross 1996a) Banded iron formation is sedimentary rock characterized by alternating iron-rich and silica-rich layers The thickness of individual layers varies from less than a millimeter to meters overall a succession of rock layers may be 100s of meters thick The principal iron minerals are the iron oxides hematite and magnetite Banded iron formation has been found on all continents except Antarctica
Although they are widespread geographically sedimentary iron deposits mostly formed during two periods in the development of the Earth These deposits occur in rocks ranging in age from 38 to about 18 Ga and from 08 to 06 Ga The oldest deposits tend to be smaller and are associated with volcanic rocks The mot extensive deposits of banded iron formation are associated with sedimentary units that formed from oceans during the Late Archean to Early Proterozoic (27 to 19 Ga) Sedimentary iron deposits
21
formed from 08 to 06 Ga are smaller and less widely distributed than the older banded iron formations
The iron resources in BIFrsquos are large because the deposits are laterally extensive The iron minerals formed from ocean water and were deposited uniformly over large areas At the time they were deposited some iron formations and associated sedimentary rocks may have covered over 100000 square kilometers Individual layers in some sequences can be traced for over 100 kilometers The iron-rich deposits may have formed on submerged continental shelves surrounding Archean cratons Younger (Paleozoic) iron-rich sedimentary units ironstones do not show the lamination characteristic of the older banded-iron formations
The origin of banded iron formation is still controversial These deposits are studied because they provide insights into the early evolution of the Earthrsquos atmosphere and oceans (Konhauser and others 2002) They also provide insights on biological processes early in the Earthrsquos history because of the close association of iron and oxygen The iron minerals present today are not those that were chemically precipitated from seawater The present minerals reflect the burial of these rocks in sedimentary basins where the rocks interacted with hydrothermal fluids and grew new minerals as temperature and pressure increased In addition weathering in tropical climates leached silica from some deposits enriching the iron content in these rocks and changing the iron minerals
Iron formation typically contains about 30 percent iron However leaching of silica during weathering can produce iron ores with as much as 66 percent iron From the 1800s until about 1955 most of the iron produced from Minnesota Michigan and Wisconsin was from these naturally-enriched iron ores Since then lower grade iron-formation has been mined and treated to produce taconite pellets The iron formation in Minnesota Michigan and Wisconsin has been metamorphosed In the process grain size of minerals increased and new minerals such as magnetite (iron oxide) formed from pre-existing iron silicate or iron carbonate minerals without significantly changing the amount of iron in the rock Metamorphosed iron formation is called taconite Powerful magnets can concentrate magnetite from pulverized taconite into a rich concentrate containing about 60 percent iron This powder is mixed with clay and water balled and fired in a kiln to make hard pellets The taconite pellets are the product shipped to the foundry to make iron or steel (Schaetzl undated)
Even though iron mining has been important in the upper Great Lakes region for the last 100 years iron-rich resources have not been entirely depleted For example an immense oxidized taconite resource remains undeveloped in the western Mesabi Range (Zanko and others 2003) Economics and advances in non-magnetic iron ore processing technology will help determine if any portion of this resource will be further developed
22
Lead and zinc Lead is a very corrosion-resistant dense ductile malleable blue-gray metal
(Mineral Information Institute USGS and American Coal Foundation undated) The majority of the lead consumed annually is used by the transportation industry mainly for lead-acid batteries Remaining uses include ammunition electrical electronic and communication applications and radiation shields Zinc is also a blue-gray metallic element Because of its anticorrosion properties more than one-half of zinc metal consumed annually is used for galvanizing followed by the production of zinc-based alloys - brass and bronze
About 350 million metric tons of lead has been discovered in the world (Singer 1995) About 20 percent of total lead discovered is in the United States The apparent consumption of lead in the United States in 2003 was 14600000 metric tons (USGS 2004)
Table 7 Lead - proportion of world mine production reserves and reserve base for the
United States
[USGS 2004 reserves and reserve base are defined in Appendix 3]
Country Percent of world production 2003
Rank of world production
Percent of world reserves
Percent of world reserve base
United States
158 3 122 144
About 710 million metric tons of zinc has been discovered (Singer 1995) About
18 percent of total zinc discovered is the United States The apparent consumption of zinc in the United States in 2003 was 1370000 metric tons (USGS 2004)
Table 8 Zinc - proportion of world mine production reserves and reserve base for the
United States
[USGS 2004 reserves and reserve base are defined in Appendix 3]
Country Percent of world production 2003
Rank of world production
Percent of world reserves
Percent of world reserve base
United States
91 5 136 196
Lead and zinc minerals commonly occur together in polymetallic mineral deposits
that form from low-temperature hydrothermal fluids Several types of deposits can be recognized based on the how the hydrothermal fluids were generated and where they moved the distribution of ore minerals in the mineral deposit and the geologic setting The location of major lead and zinc deposits in the United States is shown in figure 28
Two deposit types can form when hydrothermal fluids vent into the ocean For the type geologists call volcanogenic massive sulfide (VMS) deposits cooling of magma
23
either from volcanic rocks erupted on the ocean floor or emplaced in shallow intrusions supplies the heat needed to generate hydrothermal solutions (fig 29) For the type called sedimentary exhalative (sedex) deposits hydrothermal solutions are generated as water-rich sediments are deeply buried in sedimentary basins within the crust (fig 16) For both deposit types hydrothermal solutions move towards the surface along fractures and form hot springs where they vent into the ocean The hydrothermal solutions mix with ocean water and can deposit large quantities of iron zinc lead and copper minerals as mounds and layers on the seafloor
Like porphyry copper deposits VMS deposits are associated with magma that is generated at convergent plate boundaries However these deposits are associated with the eruption of volcanic rocks under water Unlike porphyry copper deposits they are found in rocks of all ages The oldest deposits in Archean rocks have less lead than younger deposits Deposits of all ages also can contain copper gold and silver
VMS deposits are a common deposit type and are widely distributed in orogenic belts around the world Long and others (1998) identifies over 77 significant VMS deposits in the United States They are associated with igneous arcs developed in the Cordilleran orogen (including deposits in the Brooks Range in Alaska in southeast Alaska and the Sierra foothills in California) and the Paleozoic igneous arcs of the Appalachian orogen Proterozoic VMS deposits are associated with orogenic igneous arcs developed in what is now Wisconsin and Arizona However only three deposits Arctic Camp Greens Creek and Crandon were large enough to include in this compilation The deposit at Greens Creek is currently being mined Arctic Camp and Crandon have not been developed
Sedex deposits are found in sedimentary basins characterized by high geothermal gradients (Lydon 1988 Lydon 1996) These basins commonly form as continents are pulled apart or rifted Sedex deposits typically occur in large basins sometimes filled with more than 10 kilometers of sediments Copper is rarely present in sedex deposits but silver may be present in economic amounts Globally sedex deposits are younger than 1800 million years No sedex deposits older than 1300 million years are known from the United States Sedex deposits occur less frequently than VMS deposits Long and others (1998) lists 6 significant sedex deposits in the United States 3 are large enough to include in this report (Red Dog Su-Lik and Pierrepont-Balmat-Edwards) The Red Dog lead-zinc deposit in the Brooks Range of Alaska is the single largest zinc deposit in the world and presently supplies 10 percent of the worlds zinc (Leach undated)
Mississippi Valley-type deposits Another type of lead-zinc deposit also forms from hydrothermal fluids generated in a sedimentary basin However in these deposits the hydrothermal fluids move through underground formations that can store or transmit water until they mix with other fluids and deposit minerals in open cavities in carbonate sedimentary rocks Geologists refer to these mineral bodies as Mississippi Valley-type (MVT) deposits (Sangster 1996) The movement of hydrothermal fluids in the sedimentary basins is driven by plate boundary interactions These deposits form in the relatively undeformed sedimentary rocks that occur inland from orogenic belts formed at convergent plate margins Long and others (1998) described 22 MVT deposits in the United States 6 deposits in Missouri Oklahoma Kansas Tennessee and Kentucky are large enough to include in this compilation Historically MVT deposits accounted for 57 percent of lead and 45 percent of zinc production in the United States
The genesis of MVT lead-zinc ores is directly related to enormous hydrothermal systems generated by the uplift of sedimentary basins that developed as orogens form at
24
convergent tectonic plate boundaries (Leach and others 2001 Leach and Rowan 1986) As orogens develop the crust may subside between the main orogenic belt and the relatively undeformed continental craton (Moores and Twiss 1995 Busby and Ingersoll 1995) This zone of subsidence forms on the side of the orogenic belt away from the zone of active subduction Sediments derived by erosion of the mountains formed during the orogenic process are deposited in this area of crustal subsidence forming sedimentary basins Sedimentary rocks in the basin can reach a thickness of about 10 kilometers near the mountain front Away from the orogen these sedimentary rocks are only slightly deformed However near the mountain front these sedimentary rocks are commonly uplifted and deformed by folds and faults late in the development of the orogen
Uplift of the sedimentary basin allows gravity to drive hydrothermal fluids out of the basin and on to the adjacent platform (fig 30 Leach and others 2001) MVT deposits generally form in carbonate-rich sedimentary rocks that overlie the relatively undeformed continental craton and had some hydrologic connection to the sedimentary basins developed adjacent to the orogenic belts Hydrothermal fluids that formed most MVT mineral deposits have migrated considerable distances into relatively undisturbed rocks The deposits occur where local geological and hydrological features focused the migrating hydrothermal fluids into areas where they could mix with other fluids or react with rocks and precipitate ore minerals
MVT deposits are found world-wide but the largest deposits occur in North America (Leach and others 2001) Most deposits formed in response to hydrothermal systems developed during two large subduction-related tectonic events during the Devonian to Late Permian and again during the Cretaceous and Tertiary The Devonian to Late Permian event is the most important and corresponds to the assembly of the supercontinent known as Pangea During the assembly of Pangea convergence of tectonic plates towards the North American craton formed both the Ouchita and Appalachian orogens In the United States the world-class Viburnum Trend Old Lead Belt and Tri-State MVT deposits are found in the Ozark region north of the Ouachita orogen (fig 31) The Ouchita orogen formed as the result of closure of a Paleozoic ocean basin and the late Paleozoic collision of the Llanorian and North American plates (Leach and Rowan 1986) Sedimentary basins like the Arkoma basin formed on the northern flank of the Ouchita orogen in response to crustal down warping and rapid sedimentation accompanying the orogeny At least 12 kilometers of sediments were deposited on the southern edge of the Arkoma basin Deformation of the Arkoma basin and uplift of the Ouachita Mountains caused hot subsurface brines (water containing at least 100000 parts per million dissolved salts Harben and Kužvart 1996) to migrate onto the southern flank of the North American craton and formed MVT lead-zinc deposits in the Ozark region of Missouri Arkansas Kansas and Oklahoma Other MVT deposits occur intermittently along the west side of the Appalachian orogen and probably formed from hydrothermal systems generated from this orogenic system
25
Molybdenum Molybdenum is a metallic element used principally as an alloying agent in cast
iron steel and super alloys to enhance hardness strength toughness and wear and corrosion resistance (Mineral Information Institute USGS and American Coal Foundation undated) Identified molybdenum resources of the world are about 18 million metric tons (USGS 2004) The apparent consumption of molybdenum in the United States in 2003 was 13900 metric tons The location of major molybdenum deposits in the United States is shown in figure 32
Table 9 Molybdenum - proportion of world mine production reserves and reserve base
for the United States
[USGS 2004 reserves and reserve base are defined in Appendix 3]
Country Percent of world production 2003
Rank of world production
Percent of world reserves
Percent of world reserve base
United States
268 1 314 268
The United States ranks first in world production of molybdenum and has a large
proportion of the world reserve base Generally molybdenum is produced as a byproduct of mining copper in particular porphyry copper deposits
Porphyry copper deposits Hydrothermal copper mineral deposits associated with composite volcanoes are called porphyry-type deposits by geologists (figs 19 and 20) This type of hydrothermal copper mineralization forms deep beneath steep-sided volcanoes that form as magma rises to the surface along subduction zones Porphyry copper deposits are derived from hydrothermal fluids released from and driven by the cooling magma deep within the volcano As the fluids cool and react with rocks copper and other metals such as molybdenum is deposited both in the igneous porphyry intrusions as well as adjacent rocks (fig 19)
Molybdenum is recovered as a by-product of mining copper from porphyry copper deposits Eight of the 9 top producing mines developed on porphyry copper deposits are in southeast Arizona and southwestern New Mexico (National Mining Association 2003a) The remaining deposit is in Utah These ore bodies also are an important source of gold and silver
Porphyry molybdenum deposits Some hydrothermal deposits are mined principally for their molybdenum contents Carten and others (1993) identified 25 molybdenum or molybdenum-copper deposits in the United States that are related to felsic rocks (composed primarily of feldspar (sodium and potassium aluminosilicate) and quartz (silicon oxide)) Thirteen are large enough to include in this compilation Four of these deposits are associated with continental igneous arcs that formed as a result of subduction of tectonic plates analogous to the geologic setting previously described for porphyry copper deposits A complete continuum exists between subduction-related porphyry copper deposits (that contain some molybdenum) and porphyry molybdenum deposits (with some copper) Subduction-related molybdenum-copper deposits tend to be low grade and have low fluorine contents
26
However nine of the hydrothermal molybdenum deposits included in the compilation are associated with magmas that are generated when continental crust is pulled apart These Climax-type molybdenum deposits formed from hydrothermal fluids derived from shallowly-emplaced silica- and fluorine-rich magmas in continental rifts (Carten and others 1993) Magmas associated with the continental rift-associated deposits in the United States do not appear to be related to mantle plumes Instead the magmas are generated as hot mantle rises and melts in areas where continental tectonic plates are being pulled apart following a period of subduction-related magmatism The molybdenum deposits tend to be found far from continental margins in areas of thick continental crust (Ludington 1986) Many of the deposits in this compilation are associated with a Tertiary continental rift Colorado and New Mexico today the Rio Grande River follows this partially-filled rift valley Climax-type molybdenum deposits tend to have higher molybdenum grades than the subduction-related deposits
Like porphyry copper deposits economic porphyry molybdenum deposits (both subduction-related and rift-related) are primarily Cretaceous and Tertiary in age (Carten and others 1993)
27
Platinum-group elements and nickel The platinum-group elements (PGE) are platinum palladium rhodium iridium
ruthenium and osmium In general platinum-group elements exhibit high density high electrical conductivity high melting points and low reactivity (Mineral Information Institute USGS and American Coal Foundation undated) Platinum is used in automobile pollution abatement systems jewelry and catalysts to produce industrial chemicals Palladium is used in automobile pollution abatement systems electronic components process catalysts and dental alloys Identified world resources of platinum-group elements in mineral concentrations that can be mined economically are estimated to total more than 100 million kilograms (USGS 2004) In 2003 the United States imported 111000 kilograms platinum and 73000 kilograms palladium for consumption (USGS 2004) For the same year mine production in the United States was 4100 kilograms platinum and 14600 kilograms palladium
Table 10 Platinum-group elements - proportion of world mine production reserves and
reserve base for the United States
[USGS 2004 reserves and reserve base are defined in Appendix 3]
Country Platinum percent of world
production 2003
Palladium percent of world
production 2003
Palladium Rank of world
production
PGE Percent of world reserves
PGE Percent of world
reserve base United States
22 85 3 13 25
Nickel is a silvery metallic element (Mineral Information Institute USGS and
American Coal Foundation undated International Nickel Study Group undated) About 65 per cent of nickel is used to manufacture stainless steels and 20 per cent in other steel and non-ferrous (including super) alloys often for highly specialized industrial aerospace and military applications About 9 per cent is used in plating and 6 per cent in other uses including coins and a variety of nickel chemicals Globally identified land-based resources averaging 1 percent nickel or greater contain at least 130 million metric tons of nickel (USGS 2004) In 2003 the apparent primary consumption of nickel in the United States was 218000 metric tons (USGS 2004) No mine projection reserves or reserve base of nickel have been reported in the United States (USGS 2004) However magmatic mineral deposits that PGE commonly contain nickel and copper Nickel is recovered from the magmatic PGE deposit in the Stillwater Complex Montana a large resource of nickel is associated with copper and PGE-bearing rocks of the Duluth Complex in Minnesota (figure 15)
Magmatic PGE deposit in the Stillwater Complex Montana A major palladium-platinum deposit in south-central Montana the J-M Reef is currently the sole source of primary PGE production and reserves in the United States This deposit is associated with igneous activity that probably resulted from an Archean mantle plume event (Ernst and Buchan 2001) The only geologic feature that is attributed to this event is an igneous intrusion the Stillwater Complex Layers of igneous rock characterized by different proportions sizes and shapes of igneous minerals formed when this intrusion
28
cooled and crystallized In the Stillwater Complex over 5500 meters of layered rocks are exposed Igneous layering is an uncommon phenomenon the minerals in most igneous intrusions are homogeneously distributed
Layered igneous intrusions like the Stillwater Complex are economically important because they can host magmatic mineral deposits containing economic concentrations of chromium nickel copper titanium and platinum-group elements (Zientek and others 2002) The mineralization can also occur as layers within the intrusion that also may be enriched in chromium or titanium and vanadium sulfide mineralization variably enriched in PGE can also occur in the rocks that crystallized near the margin of the intrusion (fig 33) The palladium-platinum deposit at Stillwater the J-M Reef is a 1- to 3 m-thick layer that contains 05 to 3 volume percent PGE-enriched sulfide minerals The sulfide minerals represent the crystallization products of an immiscible sulfide liquid that formed by the mixing of two magmas in the intrusion The J-M Reef sulfide mineralization has been traced for 42 kilometers along the extent of the intrusion and at least a kilometer down the dip of layering The average grade is 19 grams per ton palladium and platinum with a palladium- to platinum ratio of 34 to 1 Geologic resource estimates range from 116 to 421 million metric tons of ore containing 188 grams per ton palladium plus platinum Two mines the Stillwater mine and the East Boulder mine are developing this deposit
Mineral deposits similar to the J-M Reef in the Stillwater Complex are the major source of platinum in the world (Sutphin and Page 1986 Cawthorn 1999) The largest deposit the Merensky Reef is in South Africa An analogous deposit also is being mined in Zimbabwe Although the J-M Reef is smaller than these deposits in Africa it has the highest overall concentration of platinum-group elements
Magmatic copper-nickel-PGE deposits in the Duluth Complex Approximately 11 Ga a mantle plume is thought to have developed under what is now the area around Lake Superior This plume event was associated with the eruption of lavas and emplacement of igneous intrusions between 1109 and 1087 Ma along a linear belt where the earthrsquos crust subsided forming a rift valley The rift extends for more than 2500 kilometers from Kansas northward beneath Lake Superior and then southeast through Michigan (fig 13) however exposures of rocks related to the rift are only found in the Lake Superior region (Schulz and Cannon 1997) Igneous rocks associated with this event cover more than 160000 square kilometers (Ernst and Buchan 2001) The largest of the intrusions is known as the Duluth Complex (fig 22 Miller Green and others 2002) When this intrusion was emplaced it reacted with the surrounding rocks resulting in the formation and segregation of immiscible liquids containing copper nickel platinum-group elements and cobalt As a result large volumes of rock with a few percent sulfide minerals occur along the western margin the Duluth Complex locally the rocks are made up almost entirely of sulfide minerals Exploration activity has delineated several low-grade nickel-copper deposits in these rocks that have local zones enriched in platinum-group elements At this time no mines are developing these resources Listerud and Meineke (1977) estimate the resources along the western margin of the complex to be 4400 million short tons of rock containing 066 percent copper and 020 percent nickel This represents the largest known nickel resource in the United States and is one of the largest in the world Subsequent exploration has focused on three deposits ndash Dunka Road (the Northmet project) Babbitt (the Mesaba project) and Maturi An open pit minable resource of 808 million metric tons containing 0432 percent copper 0109 percent nickel 0166 grams per ton platinum 0437 grams per ton palladium 0061
29
grams per ton gold and 15 grams per ton silver has been defined at the Northmet project (Polymet Mining Corporation 2003) PGE along with copper and nickel will be recovered when these deposits are developed Worldwide this type of large tonnage low grade copper-nickel-PGE mineralization is relatively uncommon Similar deposits are known in South Africa Finland Australia Canada and Russia
30
Rare-earth elements The rare-earth elements (REE) are a group of 17 elements that include scandium
yttrium and the lanthanides The lanthanides a group of 15 elements with atomic numbers 57 through 71 are lanthanum cerium praseodymium neodymium promethium samarium europium gadolinium terbium dysprosium holmium erbium thulium ytterbium lutetium (Mineral Information Institute USGS and American Coal Foundation undated) The REE are a chemically coherent group of elements with diverse nuclear metallurgical chemical catalytic electrical magnetic and optical properties Uses of REE range from the ordinary such as glass polishing and lighter flints to high-tech such as liquid crystal displays fiber-optic cables and potentially magnetic refrigeration In 2002 the approximate distribution by end use was petroleum refining catalysts 27 percent glass polishing and ceramics 23 percent automotive catalytic converters 21 percent metallurgical additives and alloys 15 percent permanent magnets 5 percent rare-earth phosphors for lighting televisions computer monitors radar and X-ray intensifying film 4 percent and other uses 5 percent (USGS 2004)
REE are relatively abundant in the Earthrsquos crust but minable concentrations are uncommon United States and world resources are contained primarily in the minerals bastnaumlsite a rare-earth fluorocarbonate mineral and monazite a rare-earth phosphate mineral (USGS 2004) Bastnaumlsite deposits in China and the United States make up the largest proportion of the worldrsquos identified economic resources of REE ion-absorption clays are also a significant source of REE in China The remaining resources are monazite deposits located in Australia Brazil China India Malaysia South Africa Sri Lanka Thailand and the United States (USGS 2004) In the United States production is from a single deposit Mountain Pass in California (fig 27) Until the mid-1960s almost all REE production was derived from monazite-bearing placer deposits (Haxel and others 2002) In 1965 bastnaumlsite production began at the Mountain Pass deposit this single deposit dominated world REE supply until the mid-1980s The United States was once largely self-sufficient in REE but has become a net importer in the last decade with more than 90 percent of US industry needs now supplied by deposits mined in China (Haxel and others 2002)
Table 11 Rare-earth elements - proportion of world mine production in 2002 and 2003
reserves and reserve base for the United States
[USGS 2004 reserves and reserve base are defined in Appendix 3]
Country Percent of world production 2002
Percent of world production 2003
Rank of world production 2002
Percent of world
reserves
Percent of world reserve
base United States
51 none 2 148 91
REE in the United States are associated with uncommon and unusual igneous
rocks (carbonatites) and with surficial (placer) deposits Carbonatites The worldrsquos largest REE deposits are associated with igneous
rocks called carbonatites Carbonatites contain more than 50 percent by volume carbonate
31
minerals with calcite (calcium carbonate) and dolomite (calcium magnesium carbonate) most common These carbonate-rich rocks commonly are part of larger complexes of alkaline intrusive and volcanic igneous rocks containing relatively high concentrations of potassium and sodium Magmas that can crystallize large amounts of carbonate minerals are unusual only about 330 carbonatites are known worldwide (Woolley 1989) Igneous intrusions with carbonatite occur mainly on continents they rarely are in an oceanic setting The intrusions generally are found near large fractures in continental crust that formed as plate tectonic activity was stretching or extending the continental crust Weathering of these deposits can generate REE-enriched soils
The most important REE deposit in the United States Mountain Pass in California is associated with carbonatite The REE mineralization is dominated by bastnaumlsite (rare-earth fluorocarbonate) with lesser parasite (a calcium rare-earth fluorocarbonate) monazite (rare-earth phosphate) allanite (rare-earth silicate) and other REE-bearing minerals The economic potential of the Hicks Dome carbonatite in Illinois also has been evaluated At least seven other carbonatites with REE mineralization are known to occur in the US but are not considered to be economically viable sources of REE at the present time
Alkaline deposits other than carbonatites REE occur in a wide variety of alkaline igneous (enriched in sodium and potassium) and hydrothermally-altered rocks other than carbonatite The REE ore minerals in these deposits include eudialyte (hydrated zirconium silicate with sodium calcium rare-earth elements and iron) loparite (titanium-niobium oxide with cerium sodium and calcium) allanite (rare-earth silicate) and REE-bearing zircon (zirconium silicate) These deposits are significant producers of byproduct REE in Russia and byproduct production has occurred from deposits in China and Brazil The United States has resources in this type of deposit at Bokan Mountain and Mt Prindle in Alaska and at Wind Mountain (Cornudas Mountains) and Pajarito Mountain in New Mexico (Woolley 1987)
Placer deposits In placer deposits the action of water tends to concentrate minerals of higher density that are resistant to abrasion through transport and to breakdown by chemical and mechanical action Because many of these minerals are dense and (or) dark colored these placer deposits are referred to as heavy mineral sands or as black sand placers Minerals concentrated in this process include gold ilmenite (iron titanium oxide) cassiterite (tin oxide) rutile (titanium oxide) zircon (zirconium silicate) monazite (rare-earth phosphate) xenotime (yttrium phosphate) and many others Although monazite and xenotime contents of these placers are typically fairly low these minerals have been extracted as byproducts of titanium tin and gold placer mining operations in the past Recovery of byproduct monazite has been discontinued in recent years due to concerns related to the thorium content of most monazite While thorium is not radioactive thorium has radioactive daughter products Historically the United States has produced monazite from Idaho and the southeast United States and significant reserves are still present
32
Silver Silver is a metal that has been used for thousands of years in jewelry ornaments
and utensils and as the basis of many monetary systems (Mineral Information Institute USGS and American Coal Foundation undated) Industrial applications of silver include electrical and electronic products mirrors and photography which is the largest single end use of silver Silvers catalytic properties make it ideal for use as a catalyst in oxidation reactions Over 17 million metric tons of silver has been discovered in the world (Singer 1995) In 2003 the apparent consumption of silver in the United States was 5430 metric tons (USGS 2004) About 21 percent of total silver discovered is in the United States The location of major silver deposits in the United States is shown in figure 34
Table 12 Silver - proportion of world mine production reserves and reserve base for the
United States
[USGS 2004 reserves and reserve base are defined in Appendix 3]
Country Percent of world production 2003
Rank of world production
Percent of world reserves
Percent of world reserve base
United States
68 5 92 141
More than two-thirds of the worldrsquos silver resources are associated with copper
lead and zinc deposits The remainder is associated with hydrothermal gold deposits Historically the largest proportion of silver production in the United States has come from polymetallic replacement deposits Coeur drsquoAlene polymetallic veins and polymetallic veins (Long and others 1998) Remaining resources associated with these deposit types are relatively small and mining has ceased except for two mines on Coeur drsquoAlene polymetallic veins
Currently the largest silver-producing mines in the United States are developed on VMS deposits sedex deposits distal disseminated gold-silver deposits Coeur drsquoAlene polymetallic veins and porphyry copper deposits (Hilliard 2002) The majority of the identified remaining silver resources in the United States are associated with porphyry copper deposits Revett copper deposits and VMS deposits (Long and others 1998) Silver production from epithermal deposits has been and will continue to be important In the following sections VMS and sedex deposits are discussed first followed by sections on Coeur drsquoAlene veins and Revett copper deposits Deposits related to the igneous activity in subduction zones (porphyry copper deposits polymetallic replacement deposits and epithermal deposits) are discussed last
VMS and sedex deposits Lead zinc and silver commonly occur together in mineral deposits that form from low-temperature hydrothermal fluids In particular two different-types of lead zinc and silver deposit types can form when hydrothermal fluids vent into the ocean For the type geologists call volcanogenic massive sulfide (VMS) deposits cooling of magma either from volcanic rocks erupted on the ocean floor or emplaced in shallow intrusions supplies the heat needed to generate hydrothermal solutions (fig 29) For the type called sedimentary exhalative (sedex) deposits
33
hydrothermal solutions are generated as water-rich sediments are deeply buried in sedimentary basins within the crust (fig 16) For both deposit types hydrothermal solutions move towards the surface along fractures and form hot springs where they vent into the ocean The hydrothermal solutions mix with ocean water and can deposit large quantities of iron zinc lead silver and copper minerals as mounds and layers on the seafloor
VMS deposits are associated with magma that is generated at convergent plate boundaries VMS deposits are a common deposit type and are widely distributed in orogenic belts around the world Long and others (1998) identifies over 77 significant VMS deposits in the United States They are associated with igneous arcs developed in the Cordilleran orogen (including deposits in the Brooks Range in Alaska in southeast Alaska and the Sierra foothills in California) and the Paleozoic igneous arcs of the Appalachian orogen Proterozoic VMS deposits are associated with orogenic igneous arcs developed in what is now Wisconsin and Arizona However only three deposits Arctic Camp Greens Creek and Crandon were large enough to include in this compilation The deposit at Greens Creek is currently being mined Arctic Camp and Crandon have not been developed
Sedex deposits are found in sedimentary basins characterized by high geothermal gradients (Lydon 1988 Lydon 1996) These basins commonly form as continents are pulled apart or rifted Sedex deposits typically occur in large basins sometimes filled with more than 10 kilometers of sediments Sedex deposits occur less frequently than VMS deposits Long and others (1998) lists 6 significant sedex deposits in the United States 3 are large enough to include in this report silver is reported in two of these deposits (Red Dog and Su-Lik)
Coeur dAlene-type polymetallic vein deposits - Since the 1880s the Coeur dAlene mining district has produced more than 30000 metric tons of silver more than any silver mining district in the world with the exception of Cerro Rico de Potosi in Bolivia (Long 1998) Total production from the Coeur drsquoAlene district accounts for more than 28 percent of historic production of silver in the United States In addition to silver veins in this district have also produced significant amounts of lead and zinc with lesser amounts of copper gold cadmium and cobalt This style of silver-lead-zinc mineralization is unique to this mining district Long and others (1998) described 26 significant deposits in the Coeur drsquoAlene district in northern Idaho 5 deposits are large enough to include in this compilation Two mines the Galena and the Lucky Friday are still active and ranked 4th and 7th in United States silver production in 2002 (Hilliard 2002) Resources measured for the Lucky Friday mine and the Galena mine are 655 million metric tons containing 538 grams per ton silver 102 percent lead and 16 percent zinc and 63 million metric tons containing 777 grams per ton silver 08 percent copper 015 percent lead and 003 percent antimony respectively (Long 1998)
Coeur dAlene (CDA)-type polymetallic vein deposits are clustered near large faults that cut metamorphosed sedimentary rocks of the Belt basin (Hobbs and Fryklung 1968) The middle Proterozoic Belt basin covers 200000 square kilometers and extends from Idaho Montana and Washington north into Canada (fig 17 Chandler 2000) These faults are the western end of a complex system of faults that extend from northern Idaho to south-central Montana (Smith 1965) These near vertical faults have a long and complex history of movement The zone affected by faulting is up to several kilometers wide The veins occur in fractures that develop near the large faults in any metamorphosed sedimentary rock derived from fragments of older rocks However
34
silver-lead-zinc ore bodies are commonly found in rocks that are relatively more difficult to deform such as quartzite (quartz (silicon oxide)-rich metamorphosed sedimentary rock)
There are literally hundreds of veins both mineralized and barren that belong to the main period of lead-zinc-silver mineralization of the Coeur drsquoAlene district (Hobbs and Fryklung 1968) Most of the veins range in width from a few millimeters up to 3 meters Unmineralized veins are composed mainly of quartz (silicon oxide) and carbonate minerals Mineralized veins also contain various proportions of galena (lead sulfide) sphalerite (zinc-iron sulfide) and tetrahedrite (copper-iron-zinc-silver-antimony sulfide) Some veins are mined mostly for lead and zinc whereas others are mined mostly for silver (Box and others 1995 Long 1998) The mineralized portions of veins are called ore shoots The vertical dimensions of ore shoots are several times longer than their horizontal dimensions Measured horizontally individual ore shoots range in length from several meters to over 1 kilometer The vertical dimension of ore shoots can exceed 2 kilometers
The faults and the veins formed late in the sequence of events that deformed and metamorphosed the sedimentary rocks (Hobbs and Frykland 1968) These veins are deposited from hydrothermal fluids generated by metamorphism of the sedimentary rocks (Fleck and others 2002) Subduction-related magmatism that formed a Cretaceous batholith (large mass of igneous intrusions) in Idaho may have been the thermal event that initiated the metamorphism of the rocks and caused long-distance migration of hydrothermal fluid The fault zones were the pathways that controlled the migration of the hydrothermal fluids
Revett copper deposits Revett copper deposits are lens-shaped bodies of disseminated copper sulfides with silver that occur in a narrow interval of sedimentary layers in a large sedimentary basin (Hayes and Einaudi 1986 Hayes and others 1989 Hayes 1990 Cox and others 2003) However mineralization does not necessarily conform to sedimentary bedding These deposits form after the host sediment is deposited but in most cases before the sediment is converted into solid rock The ore minerals appear to have been deposited from waters that filled pores between the sediment particles These copper deposits are formed where waters of different composition and temperature mix in the subsurface in porous sedimentary rocks The distribution of minerals in the rocks that host the deposit indicate that the sulfide minerals were deposited as warm salty metal-bearing water (brine) moved through the porous beds and mixed with cool pre-existing pore water
Revett-type copper deposits occur in quartzite beds (quartz-rich metamorphosed sedimentary rocks) of the Revett Formation in the Belt basin a middle Proterozoic sedimentary basin (figs 17 and 21 Harrison 1972) This basin formed about 15 Ga when a rift developed on a supercontinent that was made up of most of North America along with Siberia Australia or Antarctica filled with sediment (Chandler 2000 Lydon 2000) The sediment layers were originally deposited on the bottom of a lake or an embayment open to the ocean As layers were buried by younger sediments their pore waters become warmer and contained more dissolved components The pressure of the overlying sediments and the high geothermal gradients associated with basins that form as continents are pulled apart can ultimately drive these warm brines upwards along faults that were active during deposition of the basin Fluid mixing responsible for mineral deposition occurred as these brines moved vertically through the section and laterally into the porous sediment layers that ultimately were converted into quartzite
35
Long and others (1998) described 9 significant Revett-type copper deposits 2 deposits are large enough to include in this compilation The median size of a Revett-type sediment-hosted copper deposit is 14 million metric tons with 079 percent copper and 31 grams per ton silver (Cox and others 2003) The largest deposit Rock Lake-Rock Creek contains approximately 300 million metric tons of ore containing 081 percent copper and 71 grams per ton silver
Porphyry copper deposits Hydrothermal copper mineral deposits associated with composite volcanoes are called porphyry-type deposits by geologists (figs 19 and 20) This type of hydrothermal copper mineralization forms deep beneath steep-sided volcanoes that form as magma rises to the surface along subduction zones Porphyry copper deposits are derived from hydrothermal fluids released from and driven by the cooling magma deep within the volcano As the fluids cool and react with rocks copper and other metals such as silver is deposited both in the igneous porphyry intrusions as well as adjacent rocks (fig 19) Silver along with gold and molybdenum is recovered as a by-product of mining copper from porphyry copper deposits Eight of the 9 top producing mines developed on porphyry copper deposits are in southeast Arizona and southwestern New Mexico (National Mining Association 2003a) The remaining deposit is in Utah
Polymetallic replacement deposits form when hydrothermal solutions generated and driven by the cooling of volcanic rock and shallow igneous intrusions flow into nearby carbonate sedimentary rocks (Nelson 1996) The igneous activity is related to igneous arcs developed by subduction of oceanic crust beneath the western margin of the United States Polymetallic replacement deposits are typically associated with but distal from porphyry copper mineralization (figs 19 and 20) Ore minerals typically galena (lead sulfide) sphalerite (zinc-iron sulfide) tetrahedrite (copper-iron-zinc-silver-antimony sulfide) and other silver sulfosalts (minerals that contain silver a semi-metal such as antimony or arsenic and sulfur) can be deposited along bedding related to dissolution of carbonate sedimentary rocks and fracture zones to form irregularly shaped orebodies that can form horizontal sheets (mantos) parallel to sedimentary bedding or veins or pipes discordant to bedding These deposits are variably enriched in silver lead and zinc Long and others (1998) described 45 significant polymetallic replacement deposits in the United States 8 deposits in Arizona Colorado Nevada and Utah are large enough to include in this compilation The mines on these major deposits are now closed
Distal disseminated gold deposits are found sedimentary rocks that may be over 1 kilometer from igneous intrusions that cooled and crystallized to form porphyry copper deposits (fig 19) Gold and silver mineralization is associated with the dissolution of carbonate minerals and the deposition of silica in sedimentary units Silver and gold minerals may be dispersed throughout altered sedimentary rock or be concentrated in narrow veinlets and fractures (Peters and others 2004) Fractures are the most important feature that controlled the flow of hydrothermal fluids and the concentration of gold and silver Long and others (1998) described 25 significant deposits in the United States 1 deposit in Arizona and 4 in Nevada are large enough to include in this compilation Examples of distal disseminated deposits currently being mined in Nevada include McCoy-Cove and Rochester
Epithermal gold deposits form less than a kilometer below the surface of the Earth and typically are found with volcanic rocks that are related to igneous arcs formed at convergent tectonic plate margins (Cooke and Simmons 2000 Hedenquist and others
36
2000) Typically the volcanic rocks were erupted on the land surface rather than beneath the ocean These deposits commonly are found in young orogens where rocks formed near the surface of the earth are more likely to be preserved These epithermal deposits can be enriched in gold and silver and also can contain minor amounts of zinc lead andor copper
The most common type of deposit forms from hydrothermal fluids that are similar to waters tapped by drilling beneath modern geothermal hot springs In most cases geothermal systems are driven by intrusions located as much as 5 to 6 kilometers below the surface Epithermal gold deposits formed from geothermal systems usually occur several kilometers above the site of the igneous intrusion Gold and silver deposition is initiated as the hydrothermal fluids start to boil when they approach the surface Gold and silver are commonly associated with quartz (silicon oxide) and adularia (potassium aluminum silicate) Gold and silver are concentrated in places where the hydrothermal solutions could easily flow ndash fractures faults and porous volcanic and sedimentary units (fig 26) If the hydrothermal fluids discharge to the land surface they form boiling hot springs that deposit silica similar to those found today in Yellowstone National Park Long and others (1998) described 129 significant epithermal and hot-spring gold deposits in the United States 11 deposits are large enough to include in this compilation Over 40 percent of the significant and major deposits are in Nevada significant deposits also occur in Alaska Arizona California Colorado Idaho Montana North Carolina New Mexico Oregon South Carolina Utah and Washington Examples of epithermal deposits recently being mined include Round Mountain Mesquite and McLaughlin
37
Titanium Titanium is a hard silvery-white metallic element found in the minerals ilmenite
leucoxene and rutile (Mineral Information Institute USGS and American Coal Foundation undated Rio Tinto 2001) Titanium dioxide (TiO2) is worldrsquos premier white pigment in the coatings and plastics industry which accounts for nearly all of its industrial applications Titanium dioxide is non-toxic and biologically inert so is used for coloring in foodstuffs like flour icing sugar sweets cosmetics and toothpaste Titanium metal is strong yet lightweight About 65 percent of the titanium metal is used in aerospace applications the remaining 35 percent is used in medical sporting goods and other applications Ilmenite supplies about 90 percent of the worldrsquos demand for titanium minerals Identified world ilmenite resources total about 1 billion metric tons of titanium dioxide (USGS 2004) Identified world resources of rutile (including anatase) total about 230 million metric tons of contained TiO2 The location of major titanium deposits in the United States is shown in figure 27
Table 13 Titanium concentrate (ilmenite) - proportion of world mine production reserves
and reserve base for the United States
[USGS 2004 reserves and reserve base are defined in Appendix 3]
Country Percent of world production 2003
Rank of world production
Percent of world reserves
Percent of world reserve base
United States
70 5 14 80
Economic titanium mineralization occurs as primary deposits formed by igneous
processes or secondary (surficial) deposits formed by weathering and sedimentary processes In primary deposits concentrations of titanium-enriched minerals form during the crystallization of igneous rocks (Gross 1996b) Production of titanium from primary deposits in the United States is largely of historical interest (Harben and Kužvart 1996) Large reserves of primary titanium minerals occur in an igneous rock called anorthosite in the Adirondack Mountains of New York State However production from these deposits ended in the 1970s Secondary deposits form as titanium-rich minerals are weathered from rocks Titanium-enriched minerals are heavier than many other minerals flowing water will concentrate these heavy minerals in sediments (Harben and Kužvart 1996) Most production and known reserves of titanium in the United States occur in heavy-mineral sand deposits These deposits are known to occur on the United States Atlantic and Gulf coastal plains from New Jersey to Florida (Harben and Kužvart 1996) The deposits formed on the shoreline of the ocean however they are not restricted to the present-day coast Sea-level has risen or lowered many times due to expansion or contraction of the polar ice caps in the last 16 million years As a result heavy-mineral sand deposits can now be found inland 10s of meters above current sea-level or off-shore on the continental shelf
The largest secondary deposit in the United States is Trail Ridge in Florida (fig 35) Trail Ridge is the largest of several long low north-trending heavy-mineral enriched sand ridges in Florida (Force 1991 httptapestryusgsgovfeatures43trailridgehtml
38
accessed May 6 2004) The Trail Ridge deposit is part of a 200-km long sand ridge that extends from north-central Florida to southeastern Georgia (Harben and Kužvart 1996) The commercial section of Trail Ridge is 27 kilometers long and 15 to 3 kilometers wide It has an average thickness of 12 meters and contains on average 35 percent heavy minerals About half of these heavy minerals contain titanium Other heavy-mineral bearing sand ridges in northern Florida and southern Georgia include Green Cove Springs Folkston Boulogne Jacksonville and Mineral City (Ponte Vedra) (fig 35 Harben and Kužvart 1996) These ridges are complexes of sand dunes formed near the shoreline during different stands of sea-level during the Pleistocene The titanium minerals were ultimately derived from rocks in the southern Appalachian Mountains DuPont has extracted heavy minerals from Trail Ridge sands since 1949 (httpwwwtitaniumdupontcomNASAppTTPORTALMediatoraction=230 accessed May 6 2004) Major shoreline deposits of heavy-mineral sands are also mined in Australia and have been discovered in Africa smaller shoreline deposits have been developed in India and Sri Lanka
39
Industrial materials
Barite Barite is a mineral comprised of barium sulfate Barite is relatively soft but is
unusually heavy for a nonmetallic mineral (Mineral Information Institute USGS and American Coal Foundation undated) The high density is responsible for its value in many applications Barite is chemically inert and insoluble Nearly 98 percent of the barite used in the United States is as a weighting agent in oil- and gas-well drilling fluids Because it looks opaque on X-ray film barium is used in medicine to diagnose gastrointestinal problems The worldrsquos identified barite resources are about 2 billion metric tons but only about 740 million metric tons are in identified reserves (USGS 2004) The apparent consumption of crude barite was 2470000 metric tons in 2003 (USGS 2004) The location of major barite deposits in the United States is shown in figure 36
Table 14 Barite - proportion of world mine production reserves and reserve base for the
United States
[USGS 2004 reserves and reserve base are defined in Appendix 3]
Country Percent of world production 2003
Rank of world production
Percent of world reserves
Percent of world reserve base
United States
72 3 131 81
Most barite mined in the United States comes from bedded barite deposits in
Nevada (Harben and Kužvart 1996) These deposits occur in a northeast-trending zone up to 100 kilometers wide that stretches about 480 kilometers across the central part of the state This zone coincides with the extent of the Antler orogenic belt This orogenic event was caused by the convergence of tectonic plates beginning in the Late Devonian it is an early phase of the Cordilleran orogen
Barite deposits occur as layers with organic-rich and silica-rich sedimentary rocks that commonly formed in deep water in ocean basins (Paradis and others 1999) These barite-rich layers may be meters thick and may extend laterally over several square kilometers The bedded barite deposit at the Greystone mine Nevada is about 17 meters thick (Harben and Kužvart 1996)
The bedded barite deposits in Nevada formed around springs where solutions moving through the sediments vented into the ocean These solutions mixed with ocean water and formed layers of barite on the seafloor This process is similar to the formation of sedex deposits (see discussion on cobalt or lead-zinc) however no iron-lead-zinc sulfide minerals are formed Some geologists believe the barite deposits formed from hydrothermal solutions that vented to the seafloor to form sedex lead-zinc deposits (Paradis and others 1999) In this view the iron-lead-zinc sulfide minerals are deposited close to the vent while barite-rich layers are formed at some distance from the vent However others believe the deposits like those in Nevada formed where cold methane- and barium-rich fluids seeped into the oceans (Torres and others 2003) and have no
40
relationship to higher-temperature sedex-forming vent systems Modern barite deposits that are found forming around active methane seeps on the ocean floor support their hypothesis Modern cold seeps are often associated with faults located along continental margins
41
Bentonite Bentonite is a rock consisting of clay minerals (Mineral Information Institute
USGS and American Coal Foundation undated) The most common clay minerals in bentonite are one or more members of the smectite mineral group (most commonly the mineral montmorillonite a hydrous aluminum silicate with some calcium sodium potassium or magnesium) The properties of bentonite are dictated by the properties of the dominant clay minerals For the most part bentonites are divided into sodium bentonite (swelling bentonite) and calcium bentonite (non-swelling bentonite) other varieties of bentonite include palygorskite and hectorite (discussed below Harben and Kužvart 1996) Most bentonites can swell to over 10 times their dry volume with the addition of liquid have the ability to increase the viscosity of a liquid and have good bonding characteristics and high adsorption These properties lead to diverse end uses such as drilling mud pet litter chemical carrier thickeners and fillers Almost half of the world production of bentonites is from the United States The location of major bentonite deposits in the United States is shown in figure 37
Table 15 Bentonite - proportion of world mine production for the United States
[USGS 2004]
Country Percent of world production 2003 Rank of world production United States 392 1
Bentonite deposits can form through a variety of processes that alter volcanic
rocks (commonly tuffs) and on rare occasions other rocks The most extensive deposits are derived the alteration of volcanic ash beds deposited in water Volcanic ash is dust-sized particles of rock ejected from a volcano The dust is transported through the air and ultimately settles as layers on land or is deposited as beds underwater The ash beds that are altered to form bentonite are made up of particles of volcanic rocks derived from magmas that are enriched in silicon and aluminum and would crystallize feldspars and quartz The ash beds deposited in oceans alter to form bentonite only if the water composition is alkaline (contains various soluble salts sufficient to raise the pH value above 70) Bentonite is stable near the surface of the Earth The abundance of this mineral decreases with depth in the crust bentonite is not found at greater than 4 kilometers (Hosterman and Orris 1998ab Weaver 1959) Most deposits are Cretaceous or younger in age
Sedimentary bentonite Sedimentary bentonite forms through the chemical alteration of volcanic ash deposited in or washed into an alkaline ocean environment Calcium bentonite forms where calcium-ions are available Sodium bentonite only forms where calcium-ion concentrations are low and sodium ions are relatively abundant (Hosterman and Orris 1998ab) Deposits range in age from Cretaceous to mid-Tertiary Major sodium bentonite deposits are found in two districts in the western United States the Hardin district (Montana and Wyoming) and the Black Hills district (Montana Wyoming and South Dakota) As much as 90 percent of sodium-bentonite production has come from these two areas In the United States the most significant Ca-bentonite resources are in the Aberdeen-Tipley district in Mississippi
42
Hectorite Hectorite is a lithium-bearing variety of smectite a clay mineral Hectorite deposits occur in a variety of geologic settings Hectorite deposits form by 1) alteration of volcanic glass to lithium-rich smectite 2) precipitation from lake waters andor 3) incorporation of lithium into existing smectites (Asher-Bolinder 1991) All deposits form in arid environments and are associated with alkaline waters enriched in magnesium and lithium volcanic rocks hot-spring travertine deposits and very fine-grained masses of silica (Odom 1992 Asher-Bolinder 1991)
Palygorskite Palygorskite is a clay mineral that can contain up to 50 percent water Palygorskite commonly forms through alteration of smectite clays in sediments in an ocean environment or as a primary precipitate through a reaction between sea water and magnesium-rich sea water (Hosterman 1998) Known deposits in the United States are Tertiary in age
43
Boron Boron is a semi-metallic element that is a dark amorphous (noncrystalline)
nonreactive solid (Mineral Information Institute USGS and American Coal Foundation undated) Borates which are usually boric acid and anhydrous borax are processed from boron minerals Borates have a wide variety of uses such as in ceramic glazes fertilizers fire retardants and soaps and detergents Sales of boron for glass consumption represented 78 percent of domestic demand in 2002 (Lyday 2002) The location of major boron deposits in the United States is shown in figure 38
Table 16 Boron - proportion of world mine production reserves and reserve base for the
United States
[USGS 2004 reserves and reserve base are defined in Appendix 3]
Country Percent of world production 2003
Rank of world production
Percent of world reserves
Percent of world reserve base
United States
244 2 233 196
Four minerals comprise almost 90 percent of the borates used by industry
worldwide they are the hydrated sodium borates borax and kernite the hydrated calcium borate colemanite and the hydrated sodium-calcium borate ulexite These minerals are extracted primarily in California and Turkey and to a lesser extent in Argentina Bolivia Chile China and Peru The majority of boron production in California is from Kern County California with the balance from San Bernardino and Inyo Counties California (Lyday 2002) Large domestic reserves of boron materials occur in California chiefly in sediments and their contained brines Extensive resources also occur in Turkey At current levels of consumption world resources are adequate for the foreseeable future (USGS 2004) In 2003 the apparent consumption of boric oxide in the United States was 488000 metric tons (USGS 2004)
Most of the worldrsquos significant commercial borate deposits were created by the evaporation of shallow lakes that were fed by boron-bearing springs (Harben and Kužvart 1996 Smith 2002) Boron-bearing springs are spatially associated with volcanic activity Boron is leached from hot rock associated with tectonic plate subduction zones and is concentrated in water that moves through geologic formations on its way to the surface where it forms geothermal springs (Smith 2002) If the springs feed into lakes in closed basins characterized by high-evaporation rates boron salts will crystallize and form layers in sediments that accumulate in the lake The boron-bearing salt layers are surrounded by layers of clay minerals that prevent the salt layers from being re-dissolved Almost all important sedimentary borate deposits are less than 20 million years old
The Boron deposit (Kramer district) in California has been the worldrsquos leading source of borates since it opened in 1926 (Harben and Kužvart 1996) The deposit is a sodium-borate bed that occurs in lake deposits near the edge of a large Tertiary sedimentary basin The sodium-borate deposit is more than 3 kilometers long 15
44
kilometers wide and ranges from a meter to 10 meters thick Only the Bigadic Emet and Kirka deposits in Turkey are larger than the Boron deposit (Deeby 2002)
45
Bromine Bromine is a reddish-brown fuming liquid at room temperature it has a very
strong irritating odor and is chemically reactive and rather poisonous (Mineral Information Institute USGS and American Coal Foundation undated) The natural form of bromine is a solution of sodium bromide in natural brines oceans salt lakes and seas Bromine is used in agriculture fire retardants petroleum additives and other applications Resources of bromine are virtually unlimited In 2003 the apparent consumption of bromine in the United States was 211000 metric tons (USGS 2004) The location of the major bromine deposit in the United States is shown in figure 38
Table 17 Bromine - proportion of world mine production for the United States
[USGS 2004]
Country Percent of world production 2003 Rank of world production United States 38 1
The major commercial sources of bromine are seawater (containing an average of
65 parts per million bromine) and surface and subsurface brines (Harben and Kužvart 1996) Subsurface brines in Arkansas contain about 5000 parts per million bromine the brines that make up the Dead Sea contain between 5000 and 10000 parts per million bromine
Brines produced from wells in Arkansas and Michigan are the main source of United States bromine production (Harben and Kužvart 1996) The brines occur in sedimentary layers in the Gulf Coast and Michigan sedimentary basins Both basins contain thick layers of evaporite minerals such as salt (sodium chloride) The brines may represent a mixture of trapped seawater fluids expelled from the salt layers or ground waters that dissolved beds of salt gypsum and carbonate minerals
46
Diatomite Diatomite is a sedimentary rock consisting chiefly of the fossilized silica-rich
skeletons of single celled aquatic plants called diatoms Diatomite is chemically inert and stable This characteristic combined with the varying shapes and sizes of the diatom fossils makes diatomite a popular filter aid Diatomitersquos brightness low bulk density high adsorptive capacity and its high surface area combined with its chemical stability lead to its use as a filler as a carrier (such as for pesticides and herbicides) and as an abrasive Estimated end uses of diatomite in the United States were filter aids (68 percent) absorbents (14 percent) fillers (12 percent) and other (mostly cement manufacture - 6 percent USGS 2004) The location of major diatomite deposits in the United States is shown in figure 37
Table 18 Diatomite - proportion of world mine production and reserves for the United
States
[USGS 2004 reserve is defined in Appendix 3]
Country Percent of world production 2003
Rank of world production
Percent of world reserves
United States
363 1 273
Economic diatomite deposits can be found in sedimentary rocks deposited in
lakes and the ocean Diatoms first became numerous in the Late Cretaceous (Harben and Kužvart 1996) and most commercial deposits are Tertiary in age Formation of high grade deposits requires a large continuous supply of silica clear water and adequate light and nutrients (phosphate and nitrogen) In ocean environments these conditions typically occur in submerged coastal basins and shelves where nutrients and silica are supplied by upwelling ocean waters and limited sediment is derived from surrounding land masses The largest production of high-purity diatomite comes from the extensive deposits near Lompoc California (Harben and Kužvart 1996) These deposits in the Miocene Sisquoc Formation formed from ocean waters and extend in a belt for more than 160 kilometers About 25 minable units occur with in the upper part of the Sisquoc Formation ranging in thickness from 1 to 10 meters A notable example of a diatomite deposit that formed in a fresh water lake in a closed basin occurs near Lovelock Nevada Numerous other deposits occur throughout the United States although most productive deposits are found in the west
47
Garnet Garnet refers to a group of chemically-complex and physically-similar minerals
They are silicate minerals that also contain variable proportions of iron aluminum magnesium and calcium Garnets are all quite hard ndash harder than most common rock-forming minerals including quartz (silicon oxide) but less hard than corundum (aluminum oxide) or diamond (carbon) When broken they fracture into sharp irregular pieces The hardness and irregular fracture of garnet make it a valuable abrasive material The color of garnet is typically deep red but can occur as green or yellow crystals Large clear crystals with few flaws are used in jewelry The vast majority of garnet is used as an abrasive blasting material for water filtration in a process called water jet cutting and to make abrasive powders (Mineral Information Institute USGS and American Coal Foundation undated) The location of major garnet deposits in the United States is shown in figure 36
Table 19 Garnet - proportion of world mine production for the United States
[USGS 2004]
Country Percent of world production 2003 Rank of world production United States 138 3
Garnets are most commonly formed by metamorphism of other rocks Garnets
will form in igneous or sedimentary rocks (containing the appropriate proportions of silicon aluminum iron magnesium and calcium) when temperatures exceed 500˚C and the depth of burial ranges from 6 to 30 kilometers (Bucher and Frey 2002) Large domestic resources of industrial garnet are associated with unique metamorphic rocks found near North Creek New York (USGS 2004) At this locality a metamorphosed igneous rock contains 5 to 20 percent garnet that forms crystals measuring 5 centimeters to nearly a meter in diameter (Harben and Kužvart 1996) When crushed these garnets break into sharp chisel-like fragments It has been estimated that this deposit contributes about 95 percent of the worldrsquos production of high-quality abrasive-grade garnet
Due to its high density garnet can be concentrated into surficial deposits by running water In Idaho and Montana the concentration of garnet is great enough to form a placer garnet deposit than can be economically developed The Emerald Creek placer garnet deposits are currently being mined from modern and ancient stream deposits in Benewah County Idaho (Harben and Kužvart 1996) Garnet in these deposits is derived from metamorphosed sedimentary rocks
48
Gypsum Gypsum (hydrated calcium sulfate) is the most common of the approximately 150
sulfate minerals More than two-thirds of the produced gypsum is used for plaster and wallboard in houses and other buildings (Mineral Information Institute USGS and American Coal Foundation undated) Gypsum is produced from 50 mines located in 19 states (Olson 2002) The location of major gypsum deposits in the United States is shown in figure 38
Table 20 Gypsum - proportion of world mine production for the United States
[USGS 2004]
Country Percent of world production 2003 Rank of world production United States 157 1
Bedded deposits of gypsum in sedimentary rocks are the primary source of
gypsum mined in the United States These gypsum layers are found in sedimentary basins with restricted circulation where brines formed as the result of the evaporation ocean or lake water The first minerals to crystallize from evaporated water are gypsum and carbonates (Guilbert and Park 1986) If evaporation continues salt (halite or sodium-chloride) and potash (sylvite or potassium chloride) will precipitate followed by a variety of salts of potassium sodium magnesium chlorine and bromine late in the evaporation process The actual proportions of minerals that precipitate are determined by the unique conditions that developed for each basin
Several sedimentary basins host major bedded gypsum deposits in the United States (fig 38 Harben and Kužvart 1996) Silurian rocks host gypsum deposits at two localities on the northwest margin of the Appalachian Basin in New York and Ohio In the Michigan basin Mississippian rocks with gypsum deposits are found in Michigan and Indiana Gypsum deposits in the Permian Basin are mined in Oklahoma Texas and Kansas In California gypsum deposits occur in the Miocene Salton (or Guaymas) basin The thickness of the gypsum beds mined in these deposits range from 1 to 35 meters
49
Kaolin Kaolin is a term for a group of clays that might best be described as kaolinite-
bearing clays This group of clays includes commercial varieties (or subgroups) such as ball clay halloysite kaolin and fire or refractory clay Although best known as the main component in porcelain and other ceramics kaolin has diverse uses in the production of paper refractories cosmetics and other products Many of its uses are determined by its whiteness and composition (Mineral Information Institute USGS and American Coal Foundation undated USGS 2004) The location of major kaolin deposits in the United States is shown in figure 37
Table 21 Kaolin - proportion of world mine production for the United States
[USGS 2004]
Country Percent of world production 2003 Rank of world production United States 178 1
Sedimentary kaolin Sedimentary hi-alumina kaolins such as those found in
Georgia formed in temperate climates when atmospheric-derived water containing weak acids percolated through feldspar (calcium-potassium-sodium aluminosilicate)-rich rocks and converted the feldspar to kaolinite (hydous aluminosilicate) or halloysite (hydrous aluminosilicate forming tubular or spherical particles) The clays were then eroded and deposited in tidal flats or estuaries Some deposits also may have formed in-place by weathering of older clay-rich sediments (Hosterman and Orris 1998c) In the eastern United States a belt of kaolin-bearing rocks extends almost 400 kilometers from Aiken South Carolina to Eufaula Alabama and contains 7 to 10 billion metric tons of sedimentary kaolin (Harben and Kužvart 1996) Ninety percent of United States kaolin production is concentrated in a 240 kilometers long segment of this belt that extends from Macon Georgia to Aiken South Carolina The kaolin deposits occur as lenses in quartz (silicon oxide) sands and may be up to 13 meters thick and 2 kilometers long (Harben and Kužvart 1996)
Ball clay contains abundant organic matter and has high plasticity and dry strength it is the dominant type of kaolin in Tennessee Ball clay originates in rivers and is deposited in shallow lakes with abundant organics and particles of sand (Hosterman and Orris 1998d) Fire clay used in refractories is hard nonplastic and homogeneous kaolin that fractures with long smooth surfaces like broken glass These kaolins form when clay minerals undergo severe leaching of potassium and silica in acidic swamps (Hosterman and Orris 1998e) Fire clay is produced in Missouri and Pennsylvania
Hydrothermal kaolin Hydrothermal kaolin (including halloysite) is formed from the alteration of feldspar-rich rocks by acidic hydrothermal solutions that leach the alkalies from the host rock (Hosterman and Orris 1998f) This type of kaolin is typically used for ceramics and filler
50
Phosphate rock Phosphorus is an essential element for plant and animal nutrition It is mined in
the form of phosphate rock Most production is converted to phosphate fertilizers The location of major phosphate rock deposits in the United States is shown in figure 37
Table 22 Phosphate rock - proportion of world mine production reserves and reserve
base for the United States
[USGS 2004 reserves and reserve base are defined in Appendix 3]
Country Percent of world production 2003
Rank of world production
Percent of world reserves
Percent of world reserve base
United States
242 1 56 80
About 80 percent of the worldrsquos phosphate production comes from bedded
sedimentary deposits called phosphorites that formed from ocean water These phosphate-rich deposits form extensive layers that can cover thousands of square kilometers These rocks formed near middle to low latitude margins of continents where organic productivity was high and the flux of other sediments was low (Harben 2002 Harben and Kužvart 1996) The phosphorus-bearing mineral carbonate fluorapatite occurs in very thin layers pellets or nodules and as fragments of shell or bone
Weathered rocks are the ultimate source of most of the phosphorus in the ocean phosphorus derived from the weathering of rocks on the continents enters the oceans through rivers (Benitez-Nelson 2000) However the primary source of phosphorus in phosphorites is plankton and other fauna found in the oceans (Hein and others 2004) Phosphorus is an essential nutrient for the growth and development of all organisms and is concentrated in their tissues and skeletons relative to seawater (Rusch and others 1996)
Where enough light is available to support photosynthesis biological activity depletes the phosphorus content of near-surface ocean water Below this zone of depletion and up to a depth of approximately 1000 m phosphorus concentrations go up with increasing depth of the water Below 1000 m phosphorus concentrations are relatively constant and are about 10 times higher than surface water (Benitez-Nelson 2000)
Biological productivity is stimulated when upwelling currents carry phosphorus-rich cold waters from deeper ocean levels (Kesler 1994) Most phosphorite deposits are found where these nutrient-rich cold waters mix with shallow ocean water with a limited influx of sediment derived from nearby landmasses Upwelling and the resultant high biological activity occurs at certain coastal locations determined by the interplay of major winds ocean currents and the distribution of continents (Chandler and Christie 1996) Upon death of the organisms their remains sink to the ocean floor Phosphate is leached from some of the remains and concentrated in the pore waters of sediments The subsequent growth of carbonate fluorapatite from pore waters of organic-rich sediment is the predominant mechanism for formation of phosphorite (Hein and others 2004) Ocean currents that move material along the sea floor and chemical changes that take place as
51
the sediments change into rocks have important roles in concentrating these phosphate mineral precipitates into deposits (Rusch and others 1996) Weathering can further concentrate the phosphorus contents of the rocks (Kesler 1994)
Major phosphorite deposits in the United States are related to zones of oceanic upwelling that took place along the western coast of North America in the Permian (forming the western phosphate field in Wyoming Idaho Montana and Utah) and off the southeast North American coast in the Miocene (forming the phosphate deposits in Florida and Carolina fig 39)
52
Potash Potash refers to a group of water-soluble salts that contain the element
potassium (Mineral Information Institute USGS and American Coal Foundation undated) Potassium like phosphorus is an essential element for animal and plant nutrition Potassium is present in every living cell and is an essential nutrient for plant growth for that reason over 95 percent of potash production is used for fertilizers Potash is also used in medicine in the chemical industry and to produce decorative color effects on brass bronze and nickel Estimated world resources total about 250 billion metric tons (USGS 2004) In 2003 apparent consumption in the United States was 5300000 metric tons K2O equivalent The location of major potash deposits in the United States is shown in figure 38
Table 23 Potassium - proportion of world mine production reserves and reserve base for
the United States
[USGS 2004 reserves and reserve base are defined in Appendix 3]
Country Percent of world production 2003
Rank of world production
Percent of world reserves
Percent of world reserve base
United States
40 7 11 18
Sedimentary potash deposits form by the evaporation of seawater As evaporation
proceeds and carbonate minerals and gypsum (hydrated calcium sulfate) have crystallized salt (halite or sodium-chloride) and potash (sylvite or potassium chloride) will form The actual proportions of minerals that precipitate are determined by the unique conditions that developed for each basin
Five sedimentary basins host major potash deposits in the United States (fig 40 Harben and Kužvart 1996) They are the Silurian Salina Basin (also called the Michigan-Appalachian basin) that covers part of Michigan New York Ohio Pennsylvania and West Virginia the Permian-Jurassic Gulf Coast Basin that covers parts of Alabama Arkansas Florida Mississippi eastern Texas Louisiana and extends into Mexico the Permian Permian Basin that covers parts of Colorado Kansas New Mexico Oklahoma and western Texas the Middle Pennsylvanian-Permian Paradox Basin that covers parts of Utah and Colorado and the Ordovician-Permian Williston Basin that covers part of North and South Dakota and extends into Canada
Most domestic production is from evaporite deposits in the Permian Basin near Carlsbad New Mexico The estimated potash reserves in this district amount to more than 502 million metric tons (USGS 2002) Beds mined for potash range in thickness from 14 meters to more than 3 meters Estimated domestic potash resources total about 6 billion metric tons (USGS 2004) Most of this resource lies at depths between 1800 and 3100 meters in a 3110-square-kilometer area of Montana and North Dakota These potash deposits occur in the Williston Basin and are extensions of the potash deposits in Saskatchewan Canada The Paradox Basin in Utah contains approximately 2 billion metric tons mostly at depths of more than 1200 meters A large potash resource lies about 2100 meters under central Michigan in the Michigan Basin
53
Salt (halite) Salt (sodium chloride) is necessary to support life As a mineral salt is called
halite The chemical industry uses about 40 percent of salt produced (chlorine is a major product) and highway de-icing for about 35 percent (Mineral Information Institute USGS and American Coal Foundation undated) World continental resources of salt are practically unlimited and the salt content in the oceans is virtually inexhaustible (USGS 2004) The location of major salt deposits and the sedimentary basins hosting the deposits in the United States are shown in figure 38
Table 24 Salt - proportion of world mine production for the United States
[USGS 2004]
Country Percent of world production 2003
Rank of world production
United States 196 1 The United States is the worlds largest salt producer producing 45 million metric
tons a year nearly half of that in the form of brines produced by solution mines located at the site of chemical plants The remaining is dry salt produced using three basic technologies solar evaporation of seawater or saline lake water solution mining and vacuum pan evaporation and underground mining Currently the United States salt industry operates 48 salt production plants with major production sites in Louisiana Ohio New York Kansas Michigan Utah Texas and California (Salt Institute undated)
Sedimentary salt deposits form by the evaporation of seawater As evaporation proceeds and carbonate minerals and gypsum (hydrated calcium sulfate) have crystallized salt (halite or sodium-chloride) and potash (sylvite or potassium chloride) will form The actual proportions of minerals that precipitate are determined by the unique conditions that developed for each basin
Four sedimentary basins host major rock salt deposits in the United States and are some of the largest accumulations of salt in the world (fig 40 Harben and Kužvart 1996) They are the Silurian Salina Basin (also called the Michigan-Appalachian basin) that covers part of Michigan New York Ohio Pennsylvania and West Virginia the Permian-Jurassic Gulf Coast Basin that covers parts of Alabama Arkansas Florida Mississippi eastern Texas Louisiana and extends into Mexico the Permian Permian Basin that covers parts of Colorado Kansas New Mexico Oklahoma and western Texas and the Ordovician-Permian Williston Basin that covers part of North and South Dakota and extends into Canada
The salt can occur as relatively flay-lying layers with other sedimentary rocks - typically carbonates shales or other evaporite layers Individual rock salt layers in the Gulf Coast basin are 2 to 3 meters thick and cover 460000 square kilometers The aggregate thickness of salt layers exceeds 600 meters for the Salina group in the Michigan basin and is over 1000 meters in part of the Permian Basin (Johnson 2002)
Salt is less dense than the surrounding sedimentary rocks When buried deeply salt layers will deform and flow forming salt domes that rise up towards the surface Louisiana and Texas are the leading salt producing states (Harben and Kužvart 1996) In
54
these states most production comes from salt domes either by underground or solution mining
55
Soda ash (sodium carbonate) Soda ash is the trade name for sodium carbonate (Mineral Information Institute
USGS and American Coal Foundation undated) Natural soda ash is refined from the mineral trona (hydrated sodium carbonate) or sodium-carbonate-bearing brines Synthetic soda ashrdquo is manufactured from one of several chemical processes Worldwide synthetic production of about 22 million metric tons is about twice that of natural production Most soda ash in the United States is used in the manufacture of glass It is also used to make a variety of chemicals soap and powdered detergents in medicine as a food additive in cleaning compounds in paper and paper pulp production and water treatment At least 62 natural sodium carbonate deposits have been identified worldwide Although soda ash can be manufactured from salt and limestone both of which are practically inexhaustible synthetic soda ash is more costly to produce and generates environmentally harmful wastes
Table 25 Soda ash - proportion of world mine production reserves and reserve base for
the United States
[USGS 2004 reserves and reserve base are defined in Appendix 3]
Country Percent of world production 2003
(natural)
Percent of world production 2003
(natural and synthetic)
Rank of world production
(natural)
Percent of world
reserves (natural)
Percent of world reserve base (natural)
United States
95 28 1 95 98
All United States soda ash production (unlike Europe) is natural and comes
from sodium carbonate mines in Wyoming and Colorado and from brine in California the United States produces more than 95 percent of the worlds natural soda ash (USGS 2004) The largest known trona deposit in the world is in the Green River Basin of Wyoming This deposit alone could produce as much as 47 billion metric tons of soda ash In California Searles Lake and Owens Lake are soda brine lakes that are estimated to contain 815 million metric tons of soda ash The location of major sodium carbonate deposits in the United States is shown in figure 38
The deposits in the Green River Basin of Wyoming are part of the Eocene Green River Formation The sediments that make up the Green River Formation were deposited in two large lakes that occupied several structural basins in Colorado Wyoming and Utah (fig 41) Lake Gosiute occupied the Green River Washakie and Sand Wash Basins Lake Uinta occupied the Uinta and Piceance Creek Basins in Utah and Colorado Much of the time the lakes were closed with no outlets During arid periods evaporation of lake water caused large quantities of sodium salts to form either directly from the lake waters or from waters within the sediments
The Green River Formation contains world-class resources of oil shale and sodium-carbonate minerals (Dyni 1996) The formation contains the worlds largest known resource of natural sodium carbonate as bedded trona in southwest Wyoming As many as 42 beds of trona have been described in Green River Formation in the Green
56
River Basin in Sweetwater County southwest Wyoming (Dyni 1996) The thickest and economically most important of these beds are numbered from 1 to 25 in ascending order Twenty-two of the 25 numbered beds are estimated to contain a total of 115 billion metric tons of trona ore Trona bed 17 is one of the most important in the district The bed where it is more than 4 feet (12 m) thick underlies about 775 square miles (2007 square kilometers) and ranges from 4 to 17 feet (12 to 52 m) in thickness (fig 42) The second largest known resource of sodium carbonate occurs as bedded and nodular nahcolite (sodium bicarbonate) in northwest Colorado Four companies currently mine beds of trona in Wyoming and one company mines a bed of nahcolite in Colorado The Wyoming trona district currently produces about 15 million metric tons per year (83 million metric tons of refined soda ash Kostick 2004)
57
Talc Talc is an extremely soft hydrous magnesium silicate mineral Soapstone and
steatite are rocks composed primarily of the mineral talc Talc is used commercially because of its fragrance retention luster purity softness and whiteness Other commercially important properties of talc are its chemical inertness high dielectric strength high thermal conductivity low electrical conductivity and oil and grease adsorption Ground talc is used as an ingredient in ceramics paper paint roofing plastics and cosmetics (such as talcum and baby powders) (Mineral Information Institute USGS and American Coal Foundation undated) The location of major talc deposits in the United States is shown in figure 36
Table 26 Talc - proportion of world mine production for the United States
[USGS 2004]
Country Percent of world production 2003 United States 9
Nine mines in five States produced talc in 2003 Most domestic production came
from mines in Montana New York Texas and Vermont (USGS 2004) Montana has been the leading talc-producing state for more than 20 years supplying more than a third of the United States talc production in recent years The largest producing mine in Montana and in the United States is the Yellowstone mine near Ennis (Virta and others 2000)
Talc deposits form when hydrothermal solutions react with rocks enriched in magnesium at relatively high temperatures (Harben and Kužvart 1996) Magnesium-enriched rocks include dolomite (a sedimentary rock rich in carbonate minerals) and ultramafic igneous rocks (very enriched in magnesium and iron minerals and low in silica) that represent fragments of oceanic crust that have been faulted into continental crust near plate tectonic boundaries The deposits may be adjacent to major fault zones which provide a pathway for the introduction of hydrothermal fluids or near contacts between magnesium-enriched and silica-enriched rocks (Simandl and Ogden 1999 Simandl and Paradis 1999) For deposits hosted in carbonate rocks the hydrothermal fluids provided silica for ultramafic-rock hosted deposits the hydrothermal fluids supplied carbon dioxide In the United States most of the talc deposits except those in Vermont are associated with carbonate rocks (Harben and Kužvart 1996) The deposits in Vermont are associated with ultramafic igneous rocks The hydrothermal fluids may be generated by the emplacement and cooling of magma or by regional metamorphism The deposits in Montana appear to be related to the continental rifting that formed the Belt Basin (fig 17 Brady and others 1998 also see discussion on cobalt copper and silver) Continental rifting and associated emplacement of magma into dikes elevated the temperature of the sequence of rocks containing the carbonate units The talc deposits formed when seawater circulated into these rocks along fault zones
58
Regional exploration history and significant recent discoveries Information needed to directly monitor and assess all mineral exploration
activities in the United States is not readily available in the public domain Some information is available for Federally-managed land but exploration activity elsewhere is not systematically recorded However trends in minerals exploration activities can be ascertained by reviewing information in trade literature the number of active mining claims on Federal lands and the number of operating mines When plotted by year for a given area this type of information can reveal cyclic as well as systematic patterns of activity Some of these cycles and trends appear to be in response to global economic social and political events others are only regional
Exploration sites Minerals-related exploration activity reported in trade journals and other literature can be used to discuss regional trends in exploration and variations with time Because states are not the same size the density of exploration sites in a state (number of sites divided by the area of the state) is used to discuss trends The density of exploration sites is illustrated in figure 43 is based on information compiled from 1995 to 2003 (David Wilburn written communication 2003) These values are estimates ndash not all exploration sites are described in literature and not all commodities may be represented However if the same information sources and compilation criteria are used the estimates provided here should reveal trends in exploration activity The states with the highest density of exploration sites are those covering the Cordilleran orogen and Precambrian rocks near Lake Superior Nevada by far has the highest density of exploration sites reported Western states in the conterminous United States show a similar pattern of activity ndash a peak around 19971998 a low in 20002001 and higher numbers in 20022003 Other states show different patterns The density of sites in Alaska peaked in 19992000 activity in Minnesota has been steadily increasing from 1997 to 2003
Mining claims The number of active mining claims held on Federally-owned lands from 1976 to 2003 is illustrated in figure 44 This information is summarized from information available from the Bureau of Land Management Land and Mineral Records ndash LR2000 system (httpwwwblmgovlr2000 accessed June 23 2004 DC Causey written communication 2004) The number of claims peaked around 1980 and again around 1988 before dropping dramatically in 1993 A minor peak in 1997 is followed by decreasing number of claims through to 2003
Number of active mines The number of active mines is illustrated in figure 45 These data are summarized from information collected by the Mine Safety and Health Administration (National Mining Association 2003b) With the exception of sand and gravel and stone operations the number of active mines has systematically decreased in the United States from 1979 to 2001 The number of stone and sand and gravel mining operations has increased during the same time period This increase largely reflects construction needs in the United States especially in coastal urban areas
To understand these patterns we need to briefly discuss the factors that control exploration activity Minerals exploration activity can be divided into two components (Singer and Kouda 1999) Lower risk minerals exploration focuses on finding extensions to existing deposits or new ore bodies near previously discovered large deposits This type of exploration activity is often driven by the depletion of reserves at known deposits Exploration has added additional resources to known gold deposits in Nevada zinc-lead-silver deposits in Alaska palladium-platinum deposits in Montana and silver deposits in
59
Idaho In the 1990s a new porphyry copper deposit Resolution was found in a well explored area in southeastern Arizona known for its major porphyry copper deposits (Manske and Paul 2002) The last discovery of a major copper deposit in this area occurred over 20 years ago This high-grade porphyry copper deposit is covered by younger rocks and lies at depths between 1500 and 2100 meters rock pressures at that depth are high and temperatures are approximately 77ordmC (Ducote 2004) Higher-risk exploration looks for mineral deposits where none have been previously discovered Some discoveries are made as the result of model-driven exploration programs Others are found serendipitously However low versus high risk exploration does not explain the cyclic patterns of mineral activity
Cyclic patterns of exploration activity and resource development have been described around the world (Dummett 2000) A cycle of exploration is followed by a wave of discovery which is succeeded by a period of production Cycles of exploration are driven by events A new period of exploration activity can be initiated by innovation (new use of a commodity new information new technology new concepts) change in commodity metal price a change in market conditions or a changes in public policy Some examples relevant to the United States are discussed below
Changes in monetary policy and technology innovations in the 1970s and 1980s and the emergence of new geologic concepts lead to the discovery and development of one of the worldrsquos major gold provinces in northern Nevada In the early 1970s the United States government removed restrictions on the price of gold and allowed its citizens to buy and hold gold (Amey 1998) In an eight year period the price of gold rose from $38 per ounce to approximately $850 per ounce About the same time cyanide leaching technology developed by the US Bureau of Mines in the 1950s was refined to allow the processing of lower-grade gold ore at low costs (httpwwwmmestatevausDMRDOCSMinResGOLDextracthtml accessed May 20 2004) Cyanide heap leaching technology involves spraying a cyanide-bearing leach solution over a pile of crushed or pulverized rock that contains minute particles of native gold The solution moves through the pile and dissolves the gold and silver The solution collected at the base of the pile is stripped of precious metals with activated carbon or other electrochemical exchange processes Large mobile conveyors have been developed that can produce heap leach piles 900 meters in diameter and 18 meters high
Fine-grained gold mineralization was discovered in northern Nevada in the 1930s (Bettles 2002) However the style of mineralization was not economic to develop until the price of gold increased and a low-cost method of extraction was developed Effective exploration techniques were then developed and dozens of previously unknown gold deposits were discovered Gold production started soon thereafter Exploration continues in Nevada focusing on extensions to known deposits and targets at depth As these deposits were developed and studied new deposit models and exploration concepts were developed that have guided successful exploration programs in other places (Hofstra and Cline 2000) Northern Nevada is now recognized as containing one of the largest concentrations of gold in the world Annual gold production in Nevada around 1970 was less than 500000 oz (15550 kg) per year since 2000 over 8 million ounces (250000 kg) of gold are produced annually
A cycle of mineral exploration can result in the discovery of a previously unknown style of mineralization The successful discovery and development of the gold deposits in Nevada initiated a world-wide search for gold deposits that could be mined using cyanide heap leach technology Geologists took their experience and exploration
60
technologies to new areas The peak in mining claim activity in the late 1980s largely reflects this phase of gold exploration programs being conducted around the United States In Alaska the gold deposits at Fort Knox Donlin Creek and Pogo were discovered in the 1990s Geologists realized that these gold deposits were unlike those in Nevada They appeared to be associated with subduction-related igneous activity but were unlike porphyry copper-gold deposits found elsewhere Geologists defined a new type of gold deposit and were able to relate this style of mineralization to an igneous arc that extended from the Yukon Territory to interior Alaska during the Cretaceous This then stimulated a phase of new exploration throughout the geologic terrane for this type of gold deposit This activity may be the cause of increase in the number of exploration sites in Alaska up to 2000
Exploration activity for nickel-copper-platinum-group element (PGE) mineralization has been driven by metal price new exploration concepts and a new process to extract minerals from ore Between 1997 and 2000 the price of palladium increased from less than $200 per ounce to over $1000 per ounce (Johnson Matthey 2004) Throughout the 1990s geologists were able to develop new exploration models for magmatic mineral deposits Important events included the discovery in 1994 of the Voiseyrsquos Bay nickel deposit in Labrador and research projects that allowed western geologists to study the major Norilrsquosk-Talnakh nickel-copper-PGE deposits in Siberia In addition a new process called PLATSOLtrade was developed to dissolve copper nickel gold and the PGErsquos from low-grade sulfide concentrates (Fleming undated) Taken together these events lead to a surge in exploration activity in areas where platinum-group element enriched deposits could be found In United States this activity was principally focused in Montana Minnesota and Wisconsin Although palladium prices have subsequently dropped platinum prices have recently increased along with demand and this probably will sustain interest in exploration for the platinum-group elements
Changes in technology have been especially important for some industrial minerals that occur in natural brines or that can be mined by solution methods Improved brine processing technology has allowed the development of some previously sub-economic deposits and led to the closure of other more traditional mining operations Within the last decade lower cost production of lithium from brines associated with desert lakes has displaced much of the traditional production of lithium from igneous rocks The Fort Cady borate deposit lies at a depth of more than 400 m development was possible through the use of an in-situ leaching technique Other industrial mineral commodities for which brine mining (including sea water) and (or) in-situ leaching are or might in the future be significant include rock salt magnesium sodium carbonate sodium sulfate potash borates lithium iodine and bromine
New information that could stimulate exploration activity also includes systematic collection of new data in an area with mineral potential Work supported by government industry and universities is generating the scientific infrastructure needed by the mining industry to find new deposits For example the airborne geophysicalgeological mineral inventory sponsored by the Alaska Division of Geological and Geophysical Surveys is a multi-year project to expand the knowledge base of Alaskarsquos mineral resources as a catalyst to private sector investment (Burns undated) This effort focuses on Alaska state lands the BLM in Alaska funds similar work focused on Federal lands in Alaska
Finally government policies and programs can have a significant impact on minerals exploration and development As previously discussed governments can create scientific information useful to the minerals exploration industry However laws on
61
mineral rights ownership taxation and environmental protection have the strongest affect on stimulating or discouraging minerals exploration Global events in the early 1990s also had a significant impact on exploration activities in the United States In 1992 Chile Mexico and Peru initiated comprehensive mining law reforms Starting with the collapse of communist regimes throughout Eastern Europe in 1989 and culminating with the end of the USSR in 1991 the Cold War was brought to an end In 1994 free multiracial elections were held in South Africa These and other events profoundly changed the global minerals economy by removing restrictions on where exploration activity investment and development could take place At the same time tougher environmental laws and permitting requirements were put in place in the United States In 1993 regulations for hard-rock mining claims on Federal lands were changed Prior to 1993 exploration expenditures could be used to maintain rights to mining claims After 1993 a fee of $100 per mining claim was required to paid to the government in order to hold a mining claim Even though the geology of an area may be favorable for the discovery of new mineral deposits exploration companies generally are unwilling to invest if laws and regulations make it difficult or expensive to develop mineral resources The global change in the minerals economy the changing attitude towards mineral development in the United States and the change in mining regulation is reflected in the precipitous drop of the number of active mining claims in the United States in 1993
The declining number of mining operations in the United States may be an early reflection of the decreased exploration activity in the United States starting in the 1990s The deposits being mined today were mostly discovered decades ago Decreased exploration will mean fewer discoveries which will lead to fewer mines in the United States in the years to come
Potential for undiscovered mineral resources Despite the high level of exploration activity that has occurred in parts of the
United States undiscovered mineral resources remain to be found Mineral resources are currently being produced from world class mineral deposits The mere presence of a mineral deposit suggests that others are likely to exist because the processes that result in mineralization commonly form clusters and linear belts of mineral deposits In this section the following discussion will address where new deposits will be found the commodities that will be present and the difficulty in finding them
From our discussion of mineral commodities we hope the reader has come away with these points 1) Mineral deposits are associated with large scale geologic processes that reoccur in time and place The decay of radioactive elements deep within the Earth provides the heat needed to drive the movement of materials in the Earthrsquos mantle and tectonic plates This movement of materials generates the magmas and hydrothermal fluids fractures and faults mountain ranges and sedimentary basins that are locally and critically important to localizing mineral deposits 2) Mineral deposits do not occur randomly their distribution is intimately related to the geologic history of each continent The movement of material in the mantle and tectonic plates is responsible for the development of cratons orogens and rifts that are characteristic of continental crust The geologic architecture of each continent uniquely reflects the sequence of events that culminated in the distribution of rocks and mineral deposits we see today The more we know about the geologic fabric of each continent and
62
the processes that control the regional and local distribution of mineral deposits the better we can address where new deposits may be found and what they may contain
Our ability to find undiscovered mineral deposits is affected by many factors For example how well has the geology of the continent been mapped There are still parts of the world where the geologic framework of the continents is poorly mapped or largely unknown Terrain and access can limit field investigations in other regions thick vegetation soils and younger deposits conceal the underlying geology In other cases the policies of governments have restricted access to information about geology and mineral resources The less that is known about an area the more likely mineral deposits are left to be discovered Alaska remains an exploration frontier the basic geologic framework has been established but the remoteness of the area and the prevalence of overlying deposits obscure much detail Geochemical surveys routinely used to explore for mineral deposits are more difficult to interpret because unconsolidated material transported by glaciers is harder to trace to a bedrock source
How well do we understand the type of mineral deposit for which we are searching Robust exploration models can be developed from the shared characteristics and associations of many deposits If geologists understand the ore forming process a variety of geologic geochemical and geophysical tools can be developed to identify areas where undiscovered mineral deposits may occur Porphyry copper deposits and volcanogenic massive sulfide deposits are well understood styles of mineralization in part because many deposits of these types have been discovered and studied in detail Effective deposit models are hard to create for styles of mineralization only known from one or two deposits (such as the hydrothermal beryllium mineralization at Spor Mountain) The search for more mineral deposits represented by these rare occurrences will be more complicated and less certain
How difficult will it be to find them The approach that involves the least risk to the exploration geologist is to search in lsquomaturersquo areas with known mineral deposits well characterized geology and an experience base that has identified which exploration techniques have been successful However the expected returns may be lower because the remaining concealed deposits will be harder to find and may not be as large as those found first The most exciting discoveries and some of the largest are in areas where no mineral deposits have been found previously The opportunities for these ldquograss-rootsrdquo discoveries are usually in those areas for which the least amount of information is available
However ultimately it still comes back to the geology The basic requirements to form a mineral deposit involve source and process There must be a source area of the material a mechanism to transport it and a means to concentrate it If any part of this is missing a mineral deposit will not be formed Certain types of mineral deposits only are found in specific geologic settings If that setting is not present the associated mineral deposit will not be found The geologic evolution of each continent has developed with characteristic environments in which mineral deposits may be found Some of the major geologic areas in the United States that constrain the types and distribution of mineral deposits that could be expected include
bull The geologically-young Cordilleran orogen has considerable potential for undiscovered hydrothermal deposits of copper molybdenum gold lead zinc and silver related to emplacement and cooling of igneous rocks
63
bull The Appalachian orogen has potential for undiscovered volcanogenic massive sulfide deposits and pluton-associated gold deposits
bull Carbonate sedimentary rocks adjacent to the Ouchita and Appalachian orogens and throughout Alaska may host undiscovered Mississippi Valley Type zinc-lead deposits
bull Hydrothermal fluids generated in sedimentary basins formed during the extension of continental crust can vent to the seafloor to form sedex zinc-lead deposits Undiscovered deposits of this type may occur in the Belt basin in Montana and Idaho and the northern Brooks Range in Alaska
bull Sedimentary basins also contain large deposits of minerals formed by the evaporation of lake or seawater These deposits are commonly covered by younger layers of sediment and many basins have not been drilled to great depths These deposits are easily developed by solution mining
bull Large provinces of magnesium- and iron-rich igneous rocks emplaced on the continent during mantle upwelling events have resulted in the rapid emplacement of large volumes of volcanic flows and igneous intrusions over large parts of North America These igneous rocks are not directly related to the development of continental orogens Undiscovered nickel copper and platinum-group element deposits may be associated with these igneous rocks One event formed a belt of Mesozoic rocks extending from British Columbia through the Yukon Territory to Alaska Another belt of Proterozoic igneous rocks extends from Kansas through Minnesota Michigan and Wisconsin
In 1998 the USGS estimated the gold silver copper lead and zinc in undiscovered deposits in the United States (US Geological Survey National Mineral Resource Assessment Team 2000) The identified resources and past production of these five metals were also estimated Assessment results include the following
bull 18000 metric tons of gold 460000 metric tons of silver 290000000 metric tons of copper 85000000 metric tons of lead and 210000000 metric tons of zinc are estimated to be present in undiscovered deposits minable with existing technology
bull 15000 metric tons of gold 160000 metric tons of silver 260000000 metric tons of copper 51000000 metric tons of lead and 55000000 metric tons of zinc remain in identified resources
bull Past production from the largest identified resources of gold silver copper lead and zinc is estimated to be 12000 metric tons of gold 170000 metric tons of silver 91000000 metric tons of copper 41000000 metric tons of lead and 44000000 metric tons of zinc These deposits account for about 99 percent of cumulative domestic production in the United States
From this assessment about as much gold silver copper lead or zinc is left to be discovered in the United States as has already been found However finding new minable mineral deposits will be challenging given that undiscovered deposits are not exposed access is more difficult environmental regulations impose constraints on the techniques used to find and develop mineral deposits landownership is more fragmented than in the past and the constant competition from low-cost foreign producers
64
References cited Amey EB 1998 Annual average gold price US Geological Survey Metal prices in
the United States through 1998 p 49-53 ONLINE Available httpmineralserusgsgovmineralspubscommoditygold300798pdf [Accessed May 20 2004]
Anstett TF Krauss UH Ober JA and Schmidt HW 1990 International strategic mineral inventory summary report ndash lithium US Geological Survey Circular 930-I 28 p
Asher-Bolinder Sigrid 1991 Descriptive model of lithium in smectites of closed basins in Orris GJ and Bliss JD eds Some industrial mineral deposit models Descriptive deposit models US Geological Survey Open-File Report 91-11A p 9-10
Atkinson Jr WW and Einaudi MT 1978 Skarn formation and mineralization in the contact aureole at Carr Fork Bingham Utah Economic Geology v 73 p 1326-1365
Austin G S Kottlowski FE Siemers WT 1982 Industrial minerals of New Mexico in 1981 in Austin GS comp Industrial rocks and minerals of the Southwest New Mexico Bureau of Mines and Mineral Resources Circular 182 p 9-16
Bally AW and Palmer AR 1989 The Geology of North America An overview Geological Society of America The Geology of North America volume A 619 p
Bally AW Scotese CR and Ross MI 1989 North America Plate tectonic setting and tectonic elements in Bally AW and Palmer AR The Geology of North America An overview Geological Society of America The Geology of North America volume A p 1-16
Bauer RR Copeland JR and Santini Ken 1994 Wollastonite in Carr DD ed Industrial minerals and rocks Littleton Colorado Society for Mining Metallurgy and Exploration p 1119-1128
Benitez-Nelson Claudia 2000 The biogeochemical cycling of phosphorus in marine systems Earth-Science Reviews v 51 p 109-135
Bettles Keith 2002 Exploration and geology 1962 to 2002 at the Goldstrike property Carlin Trend Nevada in Goldfarb RJ and Nielsen RL eds Integrated methods for discovery global exploration in the twenty-first century Society of Economic Geologists Special Publication 9 p 275-298
Box S E Bookstrom A A Zientek M L Derkey P D Ashley R P Elliott J E and Peters S G 1995 Assessment of undiscovered mineral resources in the Pacific Northwest a contribution to the Interior Columbia Basin Ecosystem Management Project US Geological Survey Open-File Report 95-682 415 p
Brady JB Cheney JT Rhodes AL Vasquez Angela Green Chris Duvall Mathieu Kogut Ari Kaufman Lewis and Kovaric Dana 1998 Isotope geochemistry of Proterozoic talc occurrences in Archean marbles of the Ruby Mountains southwest Montana USA Geological Materials Research vol 1 p 1-41
Briskey JA Schulz KJ Mosesso JP Horwitz LR and Cunningham CG 2001 Itrsquos time to know the planetrsquos mineral resources Geotimes v 46 no 3 (March) p 14-19
Briskey JA Schulz KJ Mosesso JP Horwitz LR and Cunningham CG 2002 Environmental planning issues and a conceptual global assessment of undiscovered nonfuel mineral resources in Briskey JA and Schulz KJ eds Agenda extended abstracts and bibliographies for a Workshop on Deposit Modeling Mineral Resources
65
Assessment and Their Role in Sustainable Development - 31st International Geological Congress Rio de Janeiro Brazil [extended abstract] U S Geological Survey Open-File Report 02-423 p 7-10
British Sulphur Corporation Limited 1964 A world survey of phosphate deposits London The British Sulphur Corporation Limited 206 p
British Sulphur Corporation Limited 1979 World survey of potash resources London The British Sulphur Corporation Limited 138 p
British Sulphur Corporation Limited 1985 World survey of potash resources London The British Sulphur Corporation Limited 144 p
British Sulphur Corporation Limited 1987 A world survey of phosphate deposits London The British Sulphur Corporation Limited 274 p
Brobst DA and Pratt WP eds 1973 United States mineral resources US Geological Survey Professional Paper 820 722 p
Brush Engineered Materials Inc 2003 Brush Resources a Brush Engineered Materials IncCompany ONLINE Available httpwwwbrushresourcescom [Accessed February 14 2004]
Buchan KL and Ernst RE 2001 Introduction in Ernst RE and Buchan KL eds Mantle plumes their identification through time and space Geological Society of America Special Paper 352 p 1-4
Bucher Kurt and Frey Martin 2002 Petrogenesis of metamorphic rocks 7th edition Berlin Springer 341 p
Burchfiel BC Lipman PW and Zoback ML 1992 Introduction in Burchfiel BC Lipman PW and Zoback ML eds The Cordilleran orogen Geological Society of America The Geology of North America v G-3 p 1-7
Burns Laurel undated Airborne geophysicalgeological inventory Alaska Division of Geological and Geophysical Surveys 1 p ONLINE Available httpwwwdggsdnrstateakusBriefing03M_FY03_CouncilGeophyspdf [Accessed May 21 2004]
Busby CJ and Ingersoll RV eds 1995 Tectonics of sedimentary basins Cambridge Massachusetts Blackwell Science 579 p
Cannon WF Kress TH Sutphin DM Morey GB Meints Joyce and Barber-Delach RD 1997 Digital Geologic Map and Mineral Deposits of Minnesota Wisconsin and Michigan (Version 30) US Geological Survey Open-File Report 97-455
Carr DD Rooney LF and Freas RC 1994 Limestone and dolomite in Carr DD ed Industrial minerals and rocks 6th edition Littleton Colorado Society for Mining Metallurgy and Exploration Inc p 605-629
Carten RB White WH and Stein HJ 1993 High-grade granite-related molybdenum systems classification and origin in Kirkham RV Sinclair WD Thorpe RI and Duke JM eds Mineral deposit modeling Geological Association of Canada Special Paper 40 p 521-554
Cathcart JB Sheldon RP and Gulbransen RA 1984 Phosphate-rock resources of the United States US Geological Survey Circular 888 48 p
Cawthorn RG 1999 The platinum and palladium resources of the Bushveld Complex South African Journal of Science v 95 p 481-489
Chandler FW 2000 The Belt-Purcell Basin as a low-latitude passive riftmdashImplications for the geological environment of Sullivan-type deposits in Lydon JW and others eds The Geological Environment of the Sullivan Deposit British Columbia
66
Geological Association of Canada Mineral Deposits Division Special Publication No 1 p 82-112
Chandler FW and Christie RL 1996 Stratiform phosphate in Eckstrand OR Sinclair WD and Thorpe RI eds Geology of Canadian Mineral Deposit Types Geological Survey of Canada Geology of Canada no 8 p 33-40
Chernoff CB and Orris GJ 2002 Data set of world phosphate mines deposits and occurrences Part A Geologic data US Geological Survey Open-File Report 02-0156A 352 p
Christiansen RL and Yeats RS 1992 Post-Laramide geology of the US Cordilleran region in Burchfiel BC Lipman PW and Zoback ML eds The Cordilleran orogen Conterminous US Geological Society of America The Geology of North America volume G-3 p 261-406
Coffin MF and Eldholm Olav 1993 Large igneous provinces Scientific American October 1993 p 42- 49
Condie KC 1997 Plate Tectonics and Crustal Evolution Fourth Edition Butterworth-Heinemann Oxford UK 282 p
Condie KC 2001 Mantle plumes and their record in Earth history Cambridge University Press Cambridge 306 p
Cooke DR and Simmons SF 2000 Characteristics and genesis of epithermal gold deposits in Hageman SG and Brown PE eds Gold in 2000 Society of Economic Geologists Review in Economic Geology v 13 p 221-244
Courtillot Vincent Davaille Anne Besse Jean and Stock Joann 2002 Three distinct types of hotspots in the Earthrsquos mantle Earth and Planetary Science Letters v 205 p 295-308
Cox DP 1992 Descriptive model of distal disseminated Ag-Au in Bliss JD editor Developments in mineral deposit modeling US Geological Survey Bulletin 2004 p 19
Cox DP and Singer DA eds 1986 Mineral deposit models US Geological Survey Bulletin 1693 379 p
Cox DP Lindsay DA Singer DA and Diggles MF 2003 Sediment-hosted copper deposits of the world Deposit models and database US Geological Survey Open-File Report 03-107 1 CD-ROM
Crockett RN and Sutphin DM 1993 International strategic mineral inventory summary report ndash niobium (columbium) and tantalum US Geological Survey Circular 930-M 36 p
Dawson KM 1996 Skarn zinc-lead-silver in Eckstrand OR Sinclair WD and Thorpe RIeds Geology of Canadian Mineral Deposit Types Geological Survey of Canada Geology of Canada no 8 p 448-459
Deeby DJ 2002 Borate deposits of California past present and future in Scott PW and Bristow CM eds Industrial minerals and extractive industry geology Geological Society of London London p 87-92
Ducote Richard 2004 Copper find at Superior enormous Arizona Daily Star published May 2 2004 ONLINE Available httpwwwdailystarcomdailystarprintDS20375php [Accessed May 19 2004]
Dummett HT 2000 Mineral resource development ndash our new challenges Mining Engineering v 52 p 37-42
Dyni JR 1996 Sodium carbonate resources of the Green River Formation US Geological Survey Open-File Report 96-729 39 p
67
Edwards AF and others 1992 The geology of Main Pass sulphur and oil deposit Society of Mining Engineers Preprint 92-254 14 p
Ernst RE and Buchan KL 2001 Large mafic magmatic events through time and links to mantle-plume heads in Ernst RE and Buchan KL eds Mantle plumes their identification through time Geological Society of America Special Paper 352 p 483-575
Evans JR Taylor GC and Rapp JS 1976 Mines and mineral deposits in Death Valley National Monument California California Division of Mines and Geology Special Report 125 61 p
Eyde TH and Eyde DT 1987 The Bowie chabazite deposit in Pierce HW ed Proceedings of the 21st Forum on the Geology of Industrial Minerals Arizona Bureau of Geology and Mineral Technology Geological Survey Branch Special Paper 4 p 133
Fleck RJ Criss RE Eaton GF Cleland RW Wavra CS and Bond WD 2002 Age and origin of base and precious metal veins of the Coeur drsquoAlene mining district Idaho Economic Geology v 97 p 23-42
Fleming Chris undated Platsoltrade process provides a viable alternative to smelting reprinted from African Mining 4 p ONLINE Available httpwwwlakefieldcompdfmetservicesPaper202002-120AM20Jan-Feb20220Platsolpdf [Accessed May 20 2004]
Foose MP 1993 Digital metallogenic data set for North America and South America US Geological Survey Open-File Report 93-328
Force ER 1991 Geology of titanium-mineral deposits Geological Society of America Special Paper 259 112 p
Formation Capital undated US Projects ONLINE Available httpwwwformcapcomfrus1htm [Accessed April 7 2004]
Foster HL 1969 Asbestos occurrence in the Eagle C-4 quadrangle Alaska US Geological Survey Circular 611 7 p
Garrett DE 1992 Natural soda ash occurrences processing and use New York Van Nostrand Reinhold Publishing Company 636 p
Garrett DE 1996 Potash deposits processing properties and uses New York Kluwer Academic Publishers 752 p
Garrett DE 2001 Sodium sulfate handbook of deposits processing and use San Diego Academic Press 365 p
Geological Survey of Canada 1995 Generalized geological map of the World and linked databases Geological Survey of Canada Open File 2715d CD-ROM
Gluskoter HJ Rice DD and Taylor RB eds 1991 Economic geology US Geological Society of America The Geology of North America volume P-2 622 p
Griffiths JB 1995 Industrial Minerals Directory A world guide to producers and processors London Industrial Minerals Information Ltd 553 p
Gross GA 1996a Lake Superior-type iron-formations in Eckstrand OR Sinclair WD and Thorpe RI eds Geology of Canadian Mineral Deposit Types Geological Survey of Canada Geology of Canada no 8 p54-66
Gross GA 1996b Mafic intrusion-hosted titanium-iron in Eckstrand OR Sinclair WD and Thorpe RI eds Geology of Canadian Mineral Deposit Types Geological Survey of Canada Geology of Canada no 8 p573-582
Guilbert JM and Park Jr CF 1986 The geology of ore deposits New York WH Freeman and Company 985 p
68
Hageman SG and Brown PE 2000 Gold in 2000 ndash An introduction in Hageman SG and Brown PE eds Gold in 2000 Society of Economic Geologists Review in Economic Geology v 13 p 1-7
Ham WE and Curtis NM Jr 1958 Gypsum in the Weatherford-Clinton district Oklahoma Oklahoma Geological Survey Mineral Report 5 32 p
Hansen WR 1991 Suggestions to authors of the reports of the United States Geological Survey seventh edition US Government Printing Office 289 p
Haq BU and Van Eysinga FWB 1998 Geological Time Table Fifth revised enlarged and updated edition Amsterdam The Netherlands Elsevier Science BV
Harben PW 2002 The industrial minerals handybook - 4th Edition A guide to markets specifications amp prices Surrey UK Industrial Minerals Information 412 p
Harben PW and Bates RL 1984 Geology of the nonmetallics New York Metal Bulletin Inc 392 p
Harben PW and Bates RL 1990 Industrial minerals geology and world deposits Metal Bulletin Inc 312 p
Harben PW and Kužvart Milǒs 1996 Industrial minerals A global geology London Industrial Minerals Information Ltd 462 p
Harrison JE 1972 Precambrian Belt basin of northwestern United States Its geometry sedimentation and copper occurrences Geological Society of America Bulletin v 83 p 1215-1240
Haxel GB Hedrick JB and Orris GJ 2002 Rare earth elementsmdashCritical resources for high technology US Geological Survey Fact Sheet 087-02 4 p
Hayes TS 1990 A preliminary study of thermometry and metal sources of the Spar Lake stratabound copper-silver deposit Belt Supergroup Montana US Geological Survey Open File Report 90-0484 30 p
Hayes TS and Einaudi MT 1986 Genesis of the Spar Lake strata-bound copper-silver deposit Montana Part 1 Controls inherited from sedimentation and preore diagenesis Economic Geology v 81 p 1899-1931
Hayes TS Rye RO Whelan JF and Landis GP1989 Geology and sulfur isotope geothermometry of the Spar Lake stratabound copper-Ag deposit in the Belt Supergroup Montana in Boyle RW Brown AC Jefferson CW Jowett EC and Kirkham RV eds Sediment-hosted Stratiform Copper Deposits Geological Association of Canada Special Paper 36 p 319-338
Hedenquist JW Arribas R Antonio Gonzalez-Urien Eliseo 2000 Exploration for epithermal gold deposits in Hageman SG and Brown PE eds Gold in 2000 Society of Economic Geologists Review in Economic Geology v 13 p 245-277
Hein JR Perkins RB and McIntyre BR 2004 Evolution of thought concerning the origin of the Phosphoria Formation western US phosphate field in Hein JR Life cycle of the Phosphoria Formation From deposition to post-mining environment Handbook of Exploration and Environmental Geochemistry v 8 Elsevier BV Amstersdam p 19-42
Hilliard HE 2002 Silver - 2002 US Geological Survey Minerals Yearbook - 2002 13 p ONLINE Available httpmineralsusgsgovmineralspubscommoditysilversilvemyb02pdf [Accessed April 7 2004]
Hite R J 1964 Salines in Mineral and water resources of Utah Utah Geological and Mineral Survey Bulletin 73 p 206-215
69
Hite RJ 1967 Distribution and geologic habitat of marine halite and associated potash deposits US Geological Survey Open-File Report 67-113 52 p
Hobbs SW and Fryklund Jr VC 1968 The Coeur drsquoAlene mining district Idaho in Ridge JD ed Ore deposits of the United States 1933-1967 (Graton-Sales volume) New York American Institute of Mining Metallurgical and Petroleum Engineers v 2 p 1417-1435
Hoffman PF 1989 Precambrian geology and tectonic history of North America in Bally AW and Palmer AR eds The Geology of North America An overview Geological Society of America The Geology of North America volume A p 447-512
Hofstra AH and Cline JS 2000 Characteristics and models for Carlin-type gold deposits in Hageman SG and Brown PE eds Gold in 2000 Society of Economic Geologists Reviews in Economic Geology v 13 p 163-220
Holmes DA 1994 Zeolites in Carr DD ed Industrial minerals and rocks Littleton Colorado Society for Mining Metallurgy and Exploration p 1129-1158
Hosterman JW 1998 Preliminary descriptive model for palygorskite in Orris GJ ed Additional descriptive models of industrial mineral deposits US Geological Survey Open-File Report 98-505 p 39-40
Hosterman JW and Orris GJ 1998a Preliminary descriptive model of sedimentary bentonite Deposit subtype Sodium Bentonite in Orris GJ ed Additional descriptive models of industrial mineral deposits US Geological Survey Open-File Report 98-505 p 24-26
Hosterman JW and Orris GJ 1998b Preliminary descriptive model of sedimentary bentonite Deposit subtype Calcium Bentonite in Orris GJ ed Additional descriptive models of industrial mineral deposits US Geological Survey Open-File Report 98-505 p 27-29
Hosterman JW and Orris GJ 1998c Preliminary descriptive model of sedimentary kaolinmdashdeposit subtype kaolin in Orris GJ ed Additional descriptive models of industrial mineral deposits US Geological Survey Open-File Report 98-505 p 36-38
Hosterman JW and Orris GJ 1998d Preliminary descriptive model of sedimentary kaolinmdashdeposit subtype Ball Clay in Orris GJ ed Additional descriptive models of industrial mineral deposits US Geological Survey Open-File Report 98-505 p 30-32
Hosterman JW and Orris GJ 1998e Preliminary descriptive model of sedimentary kaolinmdashdeposit subtype Fire Clay in Orris GJ ed Additional descriptive models of industrial mineral deposits US Geological Survey Open-File Report 98-505 p 33-35
Hosterman JW and Orris GJ 1998f Preliminary descriptive model of hydrothermal kaolin in Orris GJ ed Additional descriptive models of industrial mineral deposits US Geological Survey Open-File Report 98-505 p 21-23
Hosterman JW and Patterson SH 1992 Bentonite and fullers earth resources of the United States U S Geological Survey Professional Paper 1522 45 p
Industrial Minerals 1987 Merlins rare earths venture in Company News Industrial Minerals no 243 p 92
Industrial Minerals 1992 Baroid to reopen Rossi barytes operation Industrial Minerals no 301 p 16
Industrial Minerals 1995 Newcomer to nepheline syenite Industrial Minerals no 332 p 17
Industrial Minerals 1999a Montana vermiculite production planned Industrial Minerals no 376 p 8
70
Industrial Minerals 1999b American Soda plans soda ash production from nahcolite Industrial Minerals no 378 p 19
Industrial Minerals 1999c AZCO invests in Arizona muscovite mica project Industrial Minerals no 380 p 15-16
Industrial Minerals 2002 AZCO secures $8m for 10000 tpa mica project Industrial Minerals no 412 p 15
Industrial Minerals 2003 Minsand update Industrial Minerals no 431 p 12-13 Industrial Minerals 2004a April start for Atlas halloysite mine Industrial Minerals no
439 p 31 Industrial Minerals 2004b Bear River Zeolite sales up Industrial Minerals no 439 p
33 International Nickel Study Group undated The world of nickel ONLINE Available
httpwwwinsgorgnickelhtm [ January 25 2004] Jackson WD and Christiansen Grey 1993 International strategic mineral inventory
summary report ndash rare-earth oxides US Geological Survey Circular 930-N 68 p Jasinski SM 1998 Phosphate rock- 1998 US Geological Survey Minerals Yearbook
1998 p 571-5713 Jasinski SM 2000 Phosphate rock - 2000 US Geological Survey Minerals Yearbook
2000 pp581-5812 Johnson Matthey 2004 Platinum Today Price Charts ONLINE Available
httpwwwplatinummattheycompricesprice_chartshtml [January 31 2004] Johnson KS 2002 Salt resources and production in the United States in Scott PW
and Bristow CM eds Industrial minerals and extractive industry geology Geological Society of London London p 83-86
Kerrich Robert Goldfarb Richard Groves David and Garwin Steven 2000 The geodynamics of world-class gold deposits characteristics space-time distribution and origins in Hageman SG and Brown PE eds Gold in 2000 Society of Economic Geologists Review in Economic Geology v 13 p 501-551
Kesler SE 1994 Mineral resources economics and the environment New York Macmillan College Publishing Company Inc 391 p
Kious WJ and Tilling RI 1996 This dynamic Earth The story of plate tectonics version 10 ONLINE Available httppubsusgsgovpublicationstextdynamichtmlanchor19309449 [January 30 2004]
Kirkham RV and Sinclair W D 1996a Porphyry copper gold molybdenum tungsten tin silver in Eckstrand OR Sinclair WD and Thorpe RI eds Geology of Canadian Mineral Deposit Types Geological Survey of Canada Geology of Canada no 8 p 421-446
Kirkham RV 1996 Volcanic redbed copper in Eckstrand OR Sinclair WD and Thorpe RI eds Geology of Canadian Mineral Deposit Types Geological Survey of Canada Geology of Canada no 8 p 241-252
Kirkham RV and Sinclair WD 1996b Vein copper in Eckstrand OR Sinclair WD and Thorpe RI eds Geology of Canadian Mineral Deposit Types Geological Survey of Canada Geology of Canada no 8 p 399-408
Konhauser KO Hamade Tristan Raiswell Rob Morris RC Ferris FG Southam Graham and Canfield DE 2002 Could bacteria have formed the Precambrian banded iron formations Geology v 30 p 1079-1082
71
Kostick DS 2004 Soda ash US Geological Survey Mineral Commodity Summaries January 2004 p 152-153 ONLINE Available httpmineralsusgsgovmineralspubscommoditysoda_ashsodaamcs04pdf [Accessed April 9 2004]
Krauss UH Saam HG and Schmidt HW 1984 International strategic mineral inventory summary report ndash phosphate US Geological Survey Circular 930-C 41 p
Kuck Peter 1998 Iron ore US Geological Survey Statistical Compendium ONLINE Available httpmineralsusgsgovmineralspubscommodityiron_orestat [Accessed February 28 2004]
Laznicka Peter 1999 Quantitative relationships among giant deposits of metals Economic Geology v 94 p 455-473
Leach DL and Rowan EL 1986 Genetic link between Ouchita foldbelt tectonism and the Mississippi Valley-type lead-zinc deposits of the Ozarks Geology v 14 p 931-935
Leach DL and Sangster DF 1993 Mississippi Valley-type lead-zinc deposits in Kirkham RV Sinclair WD Thorpe RI and Duke JM eds Mineral deposit modeling Geological Association of Canada Special Paper 40 p 289-314
Leach DL Bradley Dwight Lewchuck MT Symons DTA de Marsily Ghislain and Brannon Joyce 2001 Mississippi Valley-type lead-zinc deposits through geologic time implications from recent age-dating research Mineralium Deposita v 36 p 711-740
Leach David undated The giant Red Dog massive sulfide deposit Brooks Range Alaska Discovery geology geochemistry and genesis ONLINE Available httpwwwcpggufbabrmetalogeneseLeach1htm [Accessed May 21 2004]
Lindsey DA 1998 Slides of the fluorspar beryllium and uranium deposits at Spor Mountain Utah US Geological Survey Open-File Report 98-524 ONLINE Available httppubsusgsgovof1998ofr-98-0524HOMEHTM [Accessed April 7 2004]
Listerud WH and Meineke DG 1977 Mineral resources of a portion of the Duluth Complex and adjacent rocks in St Louis and Lake Counties northeastern Minnesota Minnesota Department of Natural Resources Division of Minerals Report 93 49 p
Long KC DeYoung JH Jr and Ludington SD 1998 Database of significant deposits of gold silver copper lead and zinc in the United States US Geological Survey Open-File Report 98-206 Part A Database description and analysis 60 p and Part B Excel spreadsheet and references
Long KL 1998 Grade-tonnage models for Coeur drsquoAlene-type polymetallic veins US Geological Survey Open-File Report 98-583 28 p
Ludington SD 1986 Descriptive model of Climax Mo deposits in Cox DP and Singer DA eds Ore deposit models US Geological Survey Bulletin 1693 p 73
Lyday PA 2002 Boron - 2002 US Geological Survey Minerals Yearbook - 2002 14 p ONLINE Available httpmineralsusgsgovmineralspubscommodityboronboromyb02pdf [Accessed April 7 2004]
Lydon JW 1988 Volcanogenic massive sulphide deposits part 1 A descriptive model in Roberts RG and Sheahan PA eds Ore Deposit Models Geoscience Canada Reprint Series 3 p 145-153
72
Lydon JW 1996 Sedimentary exhalative sulphides (sedex) in Eckstrand OR Sinclair WD and Thorpe RI eds Geology of Canadian Mineral Deposit Types Geological Survey of Canada Geology of Canada no 8 p 130-152
Lydon JW 2000 A synopsis of the current understanding of the geological environment of the Sullivan deposit Chapter 3 in Lydon JW and others eds The Geological Environment of the Sullivan Deposit British Columbia Geological Association of Canada Mineral Deposits Division Special Publication No 1 p 12-31
Manske SLand Paul AH 2002 Geology of a major new porphyry copper center in the Superior (Pioneer) district Arizona Economic Geology v 97 p 197-220
McFaul EJ Mason GT Jr Ferguson WB and Lipin BR 2000 U S Geological Survey mineral databases MRDS and MASMILS US Geological Survey Digital Data Series DDS 52 CD-ROM
Miller JD Jr Severson MJ and Hauck SA 2002 History of geologic mapping and mineral exploration in the Duluth Complex in Miller JD Jr Green JC Severson MJ Chandler VW Hauck SA Peterson DM and Wahl TE eds Geology and mineral potential of the Duluth Complex and related rocks of northeastern Minnesota Minnesota Geological Survey Report of Investigations 58 p 21- 51
Miller JD Jr Green JC Severson MJ Chandler VW Hauck SA Peterson DM and Wahl TE 2002 Geology and mineral potential of the Duluth Complex and related rocks of northeastern Minnesota Minnesota Geological Survey Report of Investigations 58 207 p
Mineral Information Institute USGS and American Coal Foundation undated Minerals in your world Mineral Information Institute Golden Colorado CD ROM
Moores EM and Twiss RJ 1995 Tectonics New York WH Freeman and Company 415 p
Mutschler FE Ludington Steve and Bookstrom AA 1999 Giant porphyry-related metal camps of the world ndash a database US Geological Survey Open-File Report 99-556 Online Version 10 Available httpgeopubswrusgsgovopen-fileof99-556 [Accessed July 15 2004]
National Mining Association 2003a Leading nonfuel mining operations in the United States by crude ore output in 2001 National Mining Association 1 p ONLINE Available httpwwwnmaorgpdfm_mining_operationspdf [Accessed April 8 2004]
National Mining Association 2003b Mine Safety and Health Administrationrsquos number of coal and nonfuel mineral operations in the United States 1979-2002 2p ONLINE Available httpwwwnmaorgpdfm_number_operationspdf [Accessed April 8 2004]
National Mining Association undated Mining in the United States National Mining Association 2 p ONLINE Available httpwwwnmaorgpdfstates_01us2001pdf [Accessed May 18 2004
Neary CR and Highley DE 1984 The economic importance of the rare earth elements in Henderson P ed Rare earth element geochemistry New York Elsevier Developments in Geochemistry 2 p 423-466
Nelson JL 1996 Polymetallic mantos Ag-Pb-Zn in Lefebure DV and Hoy T eds Selected British Columbia mineral deposit profiles Volume 2 ndash Metallic deposits British Columbia Ministry of Employment and Investment Open-File 1996-13 p 101-104
73
New York State Department of Environmental Conservation undated Mining data ONLINE Available httpwwwdecstatenyuswebsitedmnminedatahtm [Accessed June 23 2004]
Newmont 2003 Information handbook 2003 Newmont Mining Corporation ONLINE Available wwwnewmontcomenpdfinfohandbookHB2003-Completepdf [February 16 2004]
Odom IE 1992 Hectorite deposits properties and use in Griffiths JB ed Proceedings 10th Industrial Minerals International Congress San Francisco Metal Bulletin plc p 105-111
ODriscoll Mike 1990 Minerals in the US South-West breaking rocks in the hot sun Industrial Minerals no 272 p 52-83
ODriscoll Mike 1993 Garnet--Set for blast off Industrial Minerals no 304 p 19-33 Olson DW 2002 Gypsum - 2002 US Geological Survey Minerals Yearbook - 2002
14 p ONLINE Available httpmineralsusgsgovmineralspubscommoditygypsumgypsumyb02pdf [Accessed April 7 2004]
Orris GJ 1985 Beddedstratiform barite deposits Geologic and grade-tonnage data including a partial bibliography US Geological Survey Open-File Report 85-447 32 p
Orris GJ and Bliss JD 1985 Geologic and grade-volume data on 330 gold placer deposits US Geological Survey Open-File Report 85-213 167 p
Orris GJ and Chernoff CB 2002 Data set of world phosphate mines deposits and occurrences Part B Location and mineral economic data US Geological Survey Open-File Report 02-0156B 328 p
Orris GJ and Chernoff CB 2004 Review of world sedimentary phosphate deposits and occurrences in Hein JR Life cycle of the Phosphoria Formation From deposition to post-mining environment Handbook of Exploration and Environmental Geochemistry v 8 Elsevier BV Amsterdam p 559-573
Papke KG 1984 Barite in Nevada Nevada Bureau of Mines and Geology Bulletin 98 125 p
Papke KG 1987 Gypsum deposits in Nevada Nevada Bureau of Mines and Geology Bulletin 103 26 p
Paradis S Simandl GJ MacIntyre D and Orris GJ 1999 Sedimentary-hosted stratiform barite in Simandl GJ Zdenek DH and Lefebure DV Selected British Columbia mineral deposit profiles Volume 3 ndash Industrial minerals and gemstones British Columbia Ministry of Energy and Mines Mineral Resources Division Geological Geological Survey Branch Open File 1999-10 p 43-46
Pearson Karine 1999 A TiO2 feedstock review Industrial Minerals no 378 p 42-53 Peters SG Mihalasky MJ and Theodore TG 2004 Assessment for sedimentary
rock-hosted Au-Ag deposits in Wallace AR Ludington S Mihalasky MJ Peters SG Theodore TG Ponce DA John DA and Berger BR Assessment of metallic mineral resources in the Humboldt River Basin northern Nevada with a section on PGE potential of the Humboldt mafic complex by ML Zientek GB Sidder and RA Zierenberg US Geological Survey Bulletin 2218 p 189-239
Pirkle FL Pirkle EC Reynolds JG Pirkle WA Henry JA and Rice WJ 1993 The Folkston West and Amelia heavy mineral deposits of Trail Ridge southeastern Georgia Economic Geology v 88 p 961-971
74
Placer Dome Inc 2002a PDG Placer Dome Operations Cortez mine Placer Dome Gold Inc ONLINE Available httpwwwplacerdomecomoperationscortezcortezhtml [March 1 2004]
Placer Dome Inc 2002b PDG Placer Dome Operations Turquoise Ridge mine Placer Dome Gold Inc ONLINE Available httpwwwplacerdomecomoperationsgetchellgetchellhtml [March 1 2004]
Polymet Mining Corporation 2003 The Northmet project ONLINE Available httpwwwpolymetminingcomnorthmetpdf [Accessed April 6 2004]
Price JG and Meeuwig RO 2002 Overview in the Mineral Industry of Nevada Nevada Bureau of Mines and Geology Special Publication MI-2002 p 3-11
Price RA and Sears JW 2000 Preliminary palinspasthic map of the Belt-Purcell Supergroup Implications for tectonic setting and structural evolution in Lydon JW and others eds The Geological Environment of the Sullivan Deposit British Columbia Geological Association of Canada Mineral Deposits Division Special Publication No 1 p 61-81
Riggs SR 1979 Phosphate sedimentation in Florida ndash a model phosphogenic system Economic Geology v 74 p 285-314
Riggs SR 1989 Phosphate deposits of the North Carolina coastal plan continental shelf and adjacent Blake Plateau USA in Notholt AJG Sheldon RP and Davidson DR eds Phosphate deposits of the world volume 2 phosphate rock resources Cambridge Cambridge University Press 42-52 p
Rio Tinto 2001 Fact sheet series Industrial Minerals ONLINE Available httpwwwriotintocomlibraryreportsPDFscorpPub_FactSheet_IndustMinpdf [January 26 2004]
Robert Francois 1996 Quartz-carbonate vein gold in Eckstrand OR Sinclair WD and Thorpe RI eds Geology of Canadian Mineral Deposit Types Geological Survey of Canada Geology of Canada no 8 p 350-366
Roberts RG 1988 Archean lode gold deposits in Roberts RG and Sheahan PA eds Ore deposit models Geoscience Canada Reprint Series 3 p 1-20
Roskill Information Services 1983 The economics of salt 4th ed London Roskill Information Services Ltd 183 p plus appendices
Roskill Information Services 1988 The economics of rare earths amp yttrium seventh edition London Roskill Information Services 359 p plus appendices
Roskill Information Services 1989 The economics of potash London Roskill Information Services variously paginated
Roskill Information Services 1992 The economics of gypsum and anhydrite 1992 6th ed London Roskill Information Services Ltd 168 p plus appendices
Roskill Information Services 1993 The economics of boron 7th ed London Roskill Information Services Ltd 156 p
Roskill Information Services 1994 The economics of iodine 1994 6th ed London Roskill Information Services Ltd 98 p plus appendices
Rusch TL Sankar R Scharf JE Follmi KB 1996 The phosphorus cycle phosphogenesis and marine phosphate-rich deposits Earth-Science Reviews v 40 p 55-124
Russell Alison 1988 Potash- Long haul recovery under way Industrial Minerals no 244 p 16-34
Salt Institute undated About the salt industry ONLINE Available httpwwwsaltinstituteorg3html [ accessed May 10 2004]
75
Sangster D F 1996 Mississippi Valley-type lead-zinc in Eckstrand OR Sinclair WD and Thorpe RI eds Geology of Canadian Mineral Deposit Types Geological Survey of Canada Geology of Canada no 8 p 253-261
Sawkins FJ 1984 Metal deposits in relation to plate tectonics Berlin Springer-Verlag 325 p
Schaetzl RJ undated Iron mining today GEO 333 Geography of Michigan and Great Lakes region ndash a course at the Michigan State University ONLINE Available httpwwwgeomsuedugeo333iron_iiihtml [Accessed February 28 2004]
Schulz and Cannon 1997 Potential for new nickel-copper sulfide deposits in the Lake Superior region Available ONLINE httppubsusgsgovinfomwni_cu [Accessed April 6 2004]
Shedd KB 2002 Cobalt - 2002 US Geological Survey Minerals Yearbook - 2002 21 p ONLINE Available httpmineralsusgsgovmineralspubscommoditycobaltcobalmyb02pdf [Accessed April 7 2004]
Siebert L and Simkin T 2002 Volcanoes of the World an illustrated catalog of Holocene volcanoes and their eruptions Smithsonian Institution Global Volcanism Program Digital Information Series GVP-3 ONLINE Available httpwwwvolcanosiedugvpworld [January 16 2004]
Simandl GJ and Ogden D 1999 Ultramafic-hosted talc-magnesite in Simandl GJ Zdenek DH and Lefebure DV Selected British Columbia mineral deposit profiles Volume 3 ndash Industrial minerals and gemstones British Columbia Ministry of Energy and Mines Mineral Resources Division Geological Geological Survey Branch Open File 1999-10 p 65-68
Simandl GJ and Paradis S 1999 Carbonate-hosted talc in Simandl GJ Zdenek DH and Lefebure DV Selected British Columbia mineral deposit profiles Volume 3 ndash Industrial minerals and gemstones British Columbia Ministry of Energy and Mines Mineral Resources Division Geological Geological Survey Branch Open File 1999-10 p 35-38
Singer DA 1995 World class base and precious metal deposits ndash a quantitative analysis Economic Geology v 90 p 88-104
Singer DA and Kouda Ryoichi 1999 Examining risk in mineral exploration Natural Resources Research v 8 p 111-122
Singer DA Berger VI and Moring BC 2002 Porphyry copper deposits of the World database maps and preliminary analysis US Geological Survey Open-File Report 02-268 ONLINE Available httpgeopubswrusgsgovopen-fileof02-268 [Accessed July 15 2004]
Singer DA Mosier DL and Menzie DW 1993 Digital grade and tonnage data for 50 types of mineral deposits US Geological Survey Open-File Report 93-280 ONLINE Available httppubsusgsgovof1993ofr-93-0280 [Accessed July 15 2004]
Smith JG 1965 Fundamental transcurrent faulting in the northern Rocky Mountains Bulletin of the American Association of Petroleum Geologists v 49 p 1398-1409
Smith RA 2002 Basic geology and chemistry of borate American Ceramic Society Bulletin v 81 no 8 6 p
Spanski GT 2004 Inventory of significant mineral deposit occurrences in the Headwaters project area in Idaho western Montana and extreme eastern Oregon and Washington US Geological Survey Open-File Report 2004-1038 13 p
76
St John B 2000 Sedimentary provinces of the World (BG) including GIS layer for giant oil amp gas fields AAPG Datapages Digital Product Digital Map Product Code 52 CD-ROM
Stoeser DB and Heran WD 2000 USGS deposit models US Geological Survey Digital Data Series DDS-064 version 10 CD-ROM
Sutphin DM and Page NJ 1986 International Strategic Minerals Inventory Summary Report - Platinum-group metals US Geological Survey Circular 930-E 34 p
Taylor Lindsey 2004 Clear winners Industrial Minerals no 436 p 45-49 Thompson JFH and Newberry RJ 2000 Gold deposits related to reduced granitic
intrusions in Hagemann SG and Brown PE eds Gold in 2000 Society of Economic Geologists Reviews in Economic Geology v 13 p 377-400
Tingley JV 2002 Major precious-metal deposits in the Mineral Industry of Nevada Nevada Bureau of Mines and Geology Special Publication MI-2002 p 26-41
Torres ME Bohrman Gerhard Dube TE and Poole FG 2003 Formation of modern and Paleozoic stratiform barite at cold methane seeps on continental margins Geology v 31 p 897-400
Towner RR 1992 International strategic mineral inventory summary report ndash zirconium US Geological Survey Circular 930-L 47 p
Towner RR Gray J M and Porter LM 1988 International strategic mineral inventory summary report ndash titanium US Geological Survey Circular 930-G 58 p
US Geological Survey National Mineral Resource Assessment Team 2000 1998 assessment of undiscovered deposits of gold silver copper lead and zinc in the United States US Geological Survey Circular 1178 21 p and CD-ROM
USGS 1997 Active mines and mineral plants in the US ONLINE Available httptinerusgsgovmineplant [Accessed July 1 2004]
USGS 2002 The mineral industry of New Mexico US Geological Survey Minerals Yearbook 10 p ONLINE Available httpmineralsusgsgovmineralspubsstate2002nmstmyb02pdf [Accessed May 17 2004]
USGS 2004 Mineral Commodity Summaries 2004 US Government Printing Office Washington DC 197 p Available httpmineralsusgsgovmineralspubsmcs2004mcs2004pdf [January 30 2004]
Van Kauwenbergh SJ and McClellan GH 1990 Comparative geology and mineralogy of the southeastern United States and Togo phosphorites Geological Society Special Publication 52 p 139-155
Van Kauwenbergh SJ Cathcart JB and McClellan GH 1990 Mineralogy and alteration of the phosphate deposits of Florida US Geological Survey Bulletin 1914 46 p
Virta RL van Gosen BS and Berg RB 2000 Industrial minerals of the United States US talc ndash baby powder and much more US Geological Survey Fact Sheet FS-065-00 2 p ONLINE Available httppubsusgsgovfsfs-0065-00fs-0065-00pdf [Accessed May 13 2004]
Warren John 1999 Evaporites-- their evolution and economics Malden Massachussetts Blackwell Science 438 p
Weaver CE 1959 The clay petrology of sediments Clays and Clay Minerals v 6 p 154-187
77
Williams-Stroud SC Searls JP and Hite RJ 1994 Potash resources in Carr DD ed Industrial minerals and rocks Littleton Colorado Society for Mining Metallurgy and Exploration p 783-802
Woolley AR 1987 Alkaline rocks and carbonatites of the world Part 1 North and South America University of Texas Press Austin Texas 216 p
Woolley AR 1989 The spatial and temporal distribution of carbonatites in Bell Keith ed Carbonatites genesis and evolution Unwin Hyman Boston p 15-37
Yeats CJ and Vanderhor Fop 1998 Archaean lode-gold deposits AGSO Journal of Australian Geology and Geophysics v 17 no 4 p 253-258
Zanko LM Severson MJ Oreskovich JA Heine JJ Hauck SA 2003 Oxidized taconite geological resources for a portion of the western Mesabi Range (west half of the Arcturus mine to the east half of the Canisteo mine) Itasca County Minnesota ndash a GIS-based resource analysis for land-use planning University of Minnesota Duluth Natural Resources Research Institute NRRITR-2001-40 86 p
Zientek ML Cooper RW Corson SR and Geraghty EP 2002 Platinum-group element mineralization in the Stillwater Complex Montana in Cabri LJ The geology geochemistry mineralogy and mineral beneficiation of platinum-group elements Canadian Institute of Mining Metallurgy and Petroleum Special Volume 54 p 459-481
78
Figures
Figure 1 Map of the World showing the areas covered by this series of regional reports tectonic plate boundaries and ocean bathymetry Continental shelves are shown in yellow in oceans increasing water depth is indicated by darker shades of blue Tectonic plate boundaries (black lines) from httpmapngdcnoaagovwebsiteseghazardsviewerhtm [Accessed May 23 2005] Plate names from httpwwwigutexaseduresearchprojectsplatesplateshtm [Accessed May 23 2005] Ocean bathymetry from derived from ETOPO2 (httpwwwngdcnoaagovmggimage2minreliefhtml [Accessed May 23 2005])
79
Core
Lithosphere(crust and upper-most solid mantle)
Mantle
Liquid
Solid
Crust 5-100km thick
Outer core
Inner core
Mantle
Crust
To scale
Not to scale
Figure 2 Sketches showing the layered internal structure of the Earth The three major layers (crust mantle and core) comprising the Earth are schematically portrayed in the sectional wedge (not to scale) The cutaway view in the lower right shows the layers drawn to scale Modified from Kious and Tilling (1996)
80
ConvergentPlate Boundary Transform
Plate Boundary
Hotspot
Asthenosphere
Lithosphere
TrenchStrato-volcano
Shieldvolcano
Oceanicspreading
ridge
DivergentPlate Boundary
ConvergentPlate Boundary
Continental Rift Zone(Young Plate Boundary)
Oceanic crust Continental crust
Subductingplate
Islandarc
Subducting
plate
TransformPlate Boundary
DivergentPlate Boundary
ConvergentPlate Boundary
area ofmagma
generationarea ofmagma
generation
Figure 3 Perspective diagram and cross section of the uppermost layers of the Earth illustrating the main types of tectonic plate boundaries Modified from Kious and Tilling (1996)
81
Innercore
Rotation axis
Primary plume
Secondary plumes
Tertiary plumes
Subduction zone
Spreading center
Figure 4 A schematic cross-section of the Earth illustrating three types of mantle plumes lsquoPrimaryrsquo or main deeper plumes possibly come from the lowermost mantle boundary layer lsquoSecondaryrsquo plumes possibly come from the top of domes near the depth of the transition zone between the lower and upper mantle lsquoTertiaryrsquo hotspots may have a near surface origin linked to tensile stresses in the lithosphere and decompression melting Dashed lines with arrows show flow directions of rock within the layers Modified from Courtillot and others (2002)
82
North AtlanticVolcanic Province
KarooBasalts
DeccanTraps
SiberianTrapsColumbia
River FloodBasalts
Hawaii
AfarBasalts
ParanaBasalts
Figure 5 A map of the globe showing the distribution of the igneous rocks associated with selected large igneous provinces (red regions) that formed in the last 250 million years These rocks are related to mantle plumes and are widely distributed on both continental and oceanic crust Modified from Coffin and Eldholm (1993)
83
))))
))
)
)
)
)) ))
))
)
)
)))
) )
)
)
)
))
120deg130deg 110deg 100deg 90deg 80deg 70deg
30deg
40deg
)
180deg170degE 170degW 150deg 130deg 120deg
50deg
60deg
70deg
160deg 140deg
EXPLANATIONMajor mineral deposits) Magmatic
) Metamorphic
Rock typeMainly sedimentary terraneMainly volcanic terrraneMixed sedimentary-volcanic terranePlutonic terrraneMetamorphic andor plutonic terraneMelange schist or tectonite belt
9000 1800 KILOMETERS
9000 1800 KILOMETERS
Figure 6 Map showing the location of the major magmatic and metamorphic mineral deposits of United States listed in appendix 1 Geologic base is derived from Geological Survey of Canada (1995)
84
ConvergentPlate Boundary
Hotspot
Asthenosphere
Lithosphere
Shieldvolcano
DivergentPlate Boundary
ConvergentPlate Boundary
ContinentalRift Zone
Oceanic crust Continental crust
Subductingplate
Islandarc
Subducting
plate
Continentalarc
Spreadingcenter
Volcanogenicmassive sulfide
deposits
PorphyrydepositsPorphyry
deposits
Epithermaldeposits
Epithermaldeposits
Polymetallicreplacement
deposits
Sedimentary-exhalativesediment-hosted copperand evaporite deposits
Orogenic goldvein depositsVolcanogenic
massive sulfidedeposits MVT
depositsVolcanogenic
massive sulfidedeposits
Figure 7 Cross section of the uppermost layers of the Earth illustrating the distribution of mineral deposits in relation to the main types of tectonic plate boundaries
85
[
[
[[[
[
[
[
[[[[[
[
[[
[
[[[
[[
[
[[
[
[
[
[
[
[
[
[[
[
[
[
[
[
[
[
[[
[
[[[ [
[[ [
[[[[[[[
[
[
[[
[
[
[
[
[
[
[
[
[
[
[
[
[
[
[
[[[
[
[
[
[[[ [
[
[[
[
[[[[[
[
[
[[[[[ [
[[[ [
[[
[
[
[[
[
[[
[[[
[
[
[
[[
[[[[[[[[[[[
[
[
[[[[
[
[[
120deg130deg 110deg 100deg 90deg 80deg 70deg
30deg
40deg
[
[[
[[
[[
[
[
[
[[[
[
50deg
60deg
70deg
180deg170deg E 170deg W 150deg 130deg 120deg160deg 140deg
EXPLANATIONMajor mineral deposits
[ Hydrothermal
Rock typeMainly sedimentary terrane
Mainly volcanic terrane
Mixed sedimentary-volcanic terrane
Plutonic terrane
Metamorphic andor plutonic terrane
Melange schist or tectonite belt
9000 1800 KILOMETERS
9000 1800 KILOMETERS
Figure 8 Map showing the location of the major hydrothermal mineral deposits of United States listed in appendix 1 Geologic base is derived from Geological Survey of Canada (1995)
86
Figure 9 Map showing the location of the major sedimentary mineral deposits of United States listed in appendix 1 The map also shows the extent of sedimentary basins mentioned in the report Geologic base is derived from Geological Survey of Canada (1995) and sedimentary basins are from St John (2000)
87
WW
W
WW
WWW
W
WWW
XW
WW
W
W
WWW
XW
W
XW
W
WWWW
130deg 120deg 110deg 100deg 90deg 80deg 70deg
30deg
40deg
50deg
WWW
50deg
60deg
70deg
180deg170deg E 160deg 140deg 120deg 110deg130deg150deg170deg W
EXPLANATION
Rock typeMainly sedimentary terraneOther rock types
Major mineral depositsW Surficial placer
XW Surficial residual
9000 1800 KILOMETERS
9000 1800 KILOMETERS
Figure 10 Map showing the location of the major surficial mineral deposits of United States listed in appendix 1 Geologic base is derived from Geological Survey of Canada (1995)
88
Holocene
Pleistocene
Pliocene
Miocene
Oligocene
Eocene
Paleocene
Neo
gene
Cen
ozoi
c
Pale
ogen
e
Phanerozoic
Late
EarlyCretaceous
Mesozoic
Prec
ambr
ian
Late
Early
Late
Early
Late
Early
Late
Early
Late
Early
Middle
Late
Early
Middle
Terti
ary
Quaternary
Eon Era PeriodSubperiod Epoch Age
Late
Early
MiddleJurassic
Triassic
Late
EarlyPermian
Late
Early
001
076
18
36
5
11
165
24
34
285
55
37
49
61
65
160
144
97
205
180
228
242
248
256
295
304
311
324
340
354
372
416
391
442
495
544
458
470
505
518
2400
1600
900
3000
3400
3800
422
Millionsof Years
Late
Early
Middle
Paleozoic
Late
Early
MiddlePennsylvanian
Mississippian
Late
Early
MiddleDevonian
Late
Early
Middle
Late
Early
Late
Early
MiddleCambrian
Ordovician
Silurian
Late
Early
Middle
Late
Early
Middle
Proterozoic
Archean
None defined
Figure 11 Relative geologic time units used in this report (modified from Hansen 1991 and Haq and Van Eysinga 1998)
89
Figure 12 Simplified geologic map of North America Modified from Bally and others (1989) and Hoffman (1989) White labels are CRB ndash Columbia River flood basalt province K ndash Keweenawan flood basalt province and W Wrangellia flood basalts
90
Figure 13 Map of North American showing the geology of the North American craton underlying the sedimentary rocks that cover much of the continent Modified from Hoffman (1989)
91
Westernmargin of
craton
Interior ofcraton
Southeasternmargin of
craton
Easternmargin of
craton
Breakup ofPangea
Breakup ofRodinia
Assembly of theNorth Americancraton
Assembly of thesupercontinentRodinia
Assembly of thesupercontinentPangea
Igneous eventslinked to
mantle plumes
Geo
logi
c tim
em
illion
s of
yea
rbe
fore
pre
sent
s
0
100
1200
1100
1000
900
800
700
600
500
400
300
200
Gulf ofMexicoBasin
Cordilleranorogen
Ouachitaorogen
Rifting
Rift basinsEastern USA
Appalachianorogen
Willistonbasin
Grenvilleorogen
Rifting
1500
1400
1300
Belt basin
Rifting
Michiganbasin
2000
1900
1800
1700
1600
Trans-Hudsonorogen
Wrangellia
Columbia River
Central AtlanticMagmatic Province
Moyie
Pecos
Keweenawan
SW USAdiabaseprovince
Gunbarrel
Wichita Mountains
Late Central-Iapetus
Middle Central-Iapetus
Early Central-Iapetus
Yavapai Mazatal andCentral plains orogens
Penokeanorogen
Mid-continentrift
Figure 14 Summary of selected geologic events and features for the North American craton in the last 2000 million years Large igneous events from Ernst and Buchan (2001)
92
)))
JJJ
JJ
H
120deg130deg 110deg 100deg 90deg 80deg 70deg
30deg
40deg
9000 1800 KILOMETERS
9000 1800 KILOMETERS
180deg170deg E 170deg W 150deg 130deg 120deg
50deg
60deg
70degEXPLANATION
Rock typeMainly sedimentary terrane
Mainly volcanic terrane
Mixed sedimentary-volcanic terrane
Plutonic terrane
Metamorphic andor plutonic terrane
Melange schist or tectonite belt
Major mineral depositsBeryllium
Copper-cobalt
Copper-nickel-PGE
Palladium-platinum
132
4
160deg 140deg
Figure 15 Map showing the location of the major beryllium copper-cobalt copper-nickel-PGE and platinum-palladium mineral deposits of United States listed in appendix 1 Geologic base is derived from Geological Survey of Canada (1995) Numbered deposits are discussed in the report 1 ndash Babbitt Dunka Road and Maturi 2 ndash Idaho Cobalt belt (Blackbird Ram and Sunshine) 3 ndash East Boulder and Stillwater mines and 4 ndash Spor Mountain
93
Bedded ores
averagescale in meters
0 1000
20
Fault
Ore in fractures
Broken rock
Sediments
Water
Figure 16 Cross section schematically illustrating the characteristic features of an idealized sedimentary-exhalative (sedex) mineral deposit Modified from Lydon (1996)
94
118deg 116deg 114deg
112deg
47deg
45deg
51deg
HelenaMissoula
Libby
SullivanALBERTA
MONTANA
BRITISH COLUMBIAWASHINGTON
MONTANAIDAHO
WASHINGTONOREGON
CalgaryBelt-PurcellSupergroup
Cretaceousgranitic plutons
Rock Creek-Rock Lake
Spar Lake
Coeur dAlenemining district
IdahoCu-Co Belt
Figure 17 Simplified geologic map showing the distribution of metamorphosed sedimentary rocks (Belt-Purcell Supergroup) deposited in the Middle Proterozoic Belt basin and Cretaceous igneous rocks related to the Cordilleran orogen Mineral deposits shown in this diagram are discussed in the text Modified from Price and Sears (2000)
95
H
HHHHHHH
H
H
H
H
H
HHH
H
H
H
HH
H H
H
HH
H
HH
HHH
H
H
HHHHH
H
HH
H H
H
H
H
HH
HHHHH
HHHH
120deg130deg 110deg 100deg 90deg 80deg 70deg
30deg
40deg
HH
H
H
50deg
60deg
70deg
180deg170deg E 170deg W 150deg 130deg 120deg140deg160deg
EXPLANATION
Major copper deposits
H Copper with other metals
Other metals with some copper
Rock typeMainly sedimentary terrane
Mainly volcanic terrane
Mixed sedimentary-volcanic terrane
Plutonic terrane
Metamorphic andor plutonic terrane
Melange schist or tectonite belt
1
2 3
4
56
9000 1800 KILOMETERS
9000 1800 KILOMETERS
Figure 18 Map showing the location of the major copper mineral deposits of United States listed in appendix 1 Geologic base is derived from Geological Survey of Canada (1995) Numbered deposits are discussed in the report 1 ndash Rock CreekRock Lake 2 ndash ContinentalButte 3 ndash Babbit Dunka Road and Maturi 4 ndash Bingham Canyon 5 ndash MorenciMetcalf and 6 ndash Safford
96
0Kilometers
1
2
3
4
5
6
Volcanic rocks of a stratovolcano
Intrusive igneous rocks (quartz monzonite)
Breccia
Pre-volcanic basement rocks
Limestone beds
Mineralized veins
Mineralized rock
Older Rocks
Mineralization
Igneous rocks associated withhydrothermal ore deposits Elements
Ag - silverAs - arsenicAu - goldCu - copperHg - mercuryMn - manganeseMo - molybdenumPb - leadS - sulfurSb - antimonyZn - zinc
PbZnAg
Cu
CuMo
Mo Cu
Pb-Zn
Cu
ZnPbAgMn
AuAgSAsSbHgNative sulfur
AuAgCu
Porphyrycopper
Epithermal veins
Hot springs
fumerolesHigh-temperature
Distaldisseminated
Polymetallicreplacement
lead-zinc
Figure 19 Cross section through an idealized stratovolcano showing various styles of related mineralization
97
Figure 20 Map illustrating changes in metal content of mineralized rock and ore deposits in the Bingham district Utah The map was created by vertically projecting underground features to the surface Copper and copper+molybdenum mineralization is associated with a porphyry copper deposit The igneous intrusion responsible for forming these hydrothermal deposits is labeled as QMP on the map Hydrothermal solutions related to the porphyry copper deposit moved into and reacted with adjacent sedimentary rocks to form copper deposits and lead-zinc-silver deposits Modified from Atkinson and Einaudi (1978)
98
Figure 21 Map showing the distribution of the Middle Proterozoic Revett Formation and associated hydrothermal copper-silver mineralization in northwestern Montana and northern Idaho
99
94deg 93deg 92deg 91deg 90deg 89deg 88deg 87deg
46deg
47deg
48deg
EXPLANATIONSelected rock units
iron-formation
Portage Lake Volcanics
Duluth Complex
Deposit typeBasaltic Cu
Duluth Cu-Ni-PGE
Superior Fe
0 50 100 KILOMETERS
Mesabi Range
Gunflint RangeCANADA
CuyunaRange
MarquetteRange
MenomineeRange
Penokee-GogebecRange
MIN
NE
SO
TAW
ISC
ON
SIN MICHIGAN
Lake Superior7
65
43
21
8
KeweenawPeninsula
Figure 22 Map showing selected geologic features and the location of major sedimentary iron deposits (banded iron formation) magmatic copper-nickel-PGE deposits and hydrothermal copper deposits in basalt Map derived from Cannon and others (1997) Numbered deposits are discussed in the report 1 ndash Birch Lake 2 ndash Maturi 3 ndash Dunka Road 4 ndash Thunderbird 5 ndash Minntac 6 ndash Hibbing Taconite 7 ndash National Steel and 8 ndash Empire and Tilden
100
H
H
HHH
HH
H
H
H
H
H
H
H
H
H
HH
H
H
H
H
H
HH
H
H
H
H
H
H
H
H
H
H
H
HHHHH
HHHHH
H
HH
H
H
H
H
H
H
H
H
120deg130deg 110deg 100deg 90deg 80deg 70deg
30deg
40deg
180deg170deg E 170deg W 150deg 130deg 120deg
50deg
60deg
70deg
EXPLANATION
Major gold depositsH Gold with other metals
Other metals with gold
Rock typeMainly sedimentary terrane
Mainly volcanic terrane
Mixed sedimentary-volcanic terrane
Plutonic terrane
Metamorphic andor plutonic terrane
Melange schist or tectonite belt
1
2
3
9
74
58
6
9000 1800 KILOMETERS
H
HH
HHH
HH
H
160deg 140deg
9000 1800 KILOMETERS
Figure 23 Map showing the location of the major gold mineral deposits of United States listed in appendix 1 Geologic base is derived from Geological Survey of Canada (1995) Numbered deposits are discussed in the report 1 ndash Fort Knox 2 ndash Donlin Creek 3 ndash Homestake 4 ndash BetzePost 5 ndash McCoyCove 6 ndash Rochester 7 ndash McLaughlin 8 ndash Round Mountain and 9 ndash Mesquite
101
Quaternary - Tertiary units
Jurassic igneous rocks (diorite)
Devonian - Silurian sedimentary rocks
Silurian - Ordovician sedimentary rocks
Extent of gold deposit
Roberts Mountain Thrust
Meikle
Griffin
Rodeo
Post
Blue Star
Beast
Genesis
Banshee
Skarn Hill
GoldenApril
Betze
WinstonGoldstrikeIntrusion
LittleBoulderBasinStock
Deep PostScreamer
Bazza PointWest Bazza
North Star
Bobcat
DeepStar
9
Shalosky
0 1
KILOMETER
Figure 24 Map showing the distribution of sedimentary rock-hosted gold deposits and mineralization of the Blue-Star area of the Carlin Trend Nevada The extent of the gold deposits and igneous intrusions on the map was created by vertically projecting underground features to the surface Modified from Bettles (2002)
102
Archean crust
Golconda Allochthon
Roberts Mountain Allochthon
Oceanic crust
Proterozoic-Cambrianclastic sedimentary rocks
Jurassic and Triassic continental sedimentary rocks
Cambrian-Devoniancarbonate sedimentaryrocks
fault
Mississippian toPermian siliciclasticand carbonatesedimentary rocks
gold deposit
fault
Figure 25 Schematic east-west cross section of northern Nevada and northwest Utah showing the location of Carlin-type gold deposits in relation to large tectonic features The transition from Archean crust to oceanic crust formed during the breakup of the supercontinent Rodinia Rifting that led to the development of a new continental margin formed large faults that progressively thin the continental crust to the west Different sequences of sediments were deposited or faulted on this rifted continental margin Allochthons are packages of rocks that have been transported away from their origin site of origin along faults Later deformation caused the rift-related faults to move and break through the younger rocks Sedimentary rock-hosted ore deposits in northern Nevada appear to be clustered along linear trends that overlie these older faults Modified from Hofstra and Cline (2000)
103
Silica deposited fromwater flowing from
hot springs
Hot springs
50-100
0 50-100METERS
Rock alteredby steam
Silica depositedat the water table
Permeablelithology
Watertable
Gold oreconcentrated
in veins
Gold ore dispersedthroughout a
permeable lithology
Altered rockdominated byclay minerals
Strongly altered rockdominated by clay minerals
with some potassiumaluminosilicate minerals
Altered rockwith clay minerals
and calcium carbonate
Figure 26 Schematic cross section that illustrates generalized patterns of alteration and mineralization of epithermal gold deposits Modified from Hedenquist and others (2000)
104
lt
)
lt lt
)))))
)))
lt
lt
J
lt
)
)))
)
lt
120deg130deg 110deg 100deg 90deg 80deg 70deg
30deg
40deg
180deg170deg E 170deg W 150deg 130deg 120deg
50deg
60deg
70deg EXPLANATION
Rock typeMainly sedimentary terrane
Mainly volcanic terrane
Mixed sedimentary-volcanic terrane
Plutonic terrane
Metamorphic andor plutonic terrane
Melange schist or tectonite belt
Major mineral deposits Iron
lt Niobium rare-earth elements and other metals
lt
Rare-earth elements and other metals
J Titanium and iron
) Titanium zirconium and other materials
1 2
3
160deg 140deg
9000 1800 KILOMETERS
9000 1800 KILOMETERS
Figure 27 Map showing the location of the major iron niobium rare-earth metals and titanium mineral deposits of United States listed in appendix 1 Geologic base is derived from Geological Survey of Canada (1995) Numbered deposits are discussed in the report 1 ndash Mountain Pass 2 ndash Hicks Dome and 3 ndash Trail Ridge
105
H
H
HH HH
HH
H
H
H
120deg130deg 110deg 100deg 90deg 80deg 70deg
30deg
40deg
HH
50deg
60deg
70deg
EXPLANATION
Rock typeMainly sedimentary terrane
Mainly volcanic terrane
Mixed sedimentary-volcanic terrane
Plutonic terrane
Metamorphic andor plutonic terrane
Melange schist or tectonite belt
Major lead and zinc depositsH Lead and zinc with other metals
Other metals with lead and zinc
180deg170deg E 170deg W 150deg 130deg 120deg
12
3
4 5
67
9000 1800 KILOMETERS
9000 1800 KILOMETERS
140deg160deg
Figure 28 Map showing the location of the major lead and zinc mineral deposits of United States listed in appendix 1 Geologic base is derived from Geological Survey of Canada (1995) Numbered deposits are discussed in the report 1 ndash Red Dog and Su-Lik 2 ndash Arctic Camp 3 ndash Greens Creek 4 ndash Crandon 5 ndash PierreBalmatEdwards 6 ndash Viburnum Trend and Old Lead Belt and 7 ndash Tri-State
106
Fractured Zone
Disseminated copper ore
Disseminated iron zincand lead ore
Massive sulfide lens
Older volcanic rocks
Zinc- and lead-rich ore
Copper-rich ore
Younger volcanic orsedimentary rocksRocks rich in silica
and iron that weredeposited fromseawater
Figure 29 Cross section illustrating the essential features of an idealized volcanogenic massive sulfide deposit Modified from Lydon (1988)
107
Figure 30 Map showing the location of MVT lead-zinc districts in the Ozark region of the United States Arrows refer to inferred flow direction of ore fluid believed to have been derived from the Ouachita fold belt Modified from Leach and Sangster (1993)
108
Outcrops of Precambrianigneous rocks
Cambrian and Ordoviciansedimentary rocks
Area of intensivemineralization
Area of weak (trace)mineralization
Mine shaft
Old Lead Belt
St FrancoisMountains
0 10
ViburnumTrend
ViburnumMines
MagmontBuick
Brushy Creek
Fletcher
OzarkLead
MISSOURI
KILOMETERS
Figure 31 Map of southeast Missouri showing location of major Mississippi Valley ore districts surrounding outcrops of Precambrian igneous rocks in the St Francois Mountains The extent of mineralization associated with the Viburnum Trend shown on the map was created by vertically projecting underground features to the surface Modified from Sawkins (1984)
109
H
H
HHH
H
H
H
H
H
H
H
120deg130deg 110deg 100deg 90deg 80deg 70deg
30deg
40deg
H
50deg
60deg
70deg
EXPLANATION
Rock typeMainly sedimentary terrane
Mainly volcanic terrane
Mixed sedimentary-volcanic terrane
Plutonic terrane
Metamorphic andor plutonic terrane
Melange schist or tectonite belt
Major molybdenum depositsH Molybdenum with other metals
Other metals with molybdenum
180deg170deg E 170deg W 150deg 130deg 120deg
9000 1800 KILOMETERS
9000
160deg 140deg
1800 KILOMETERS
Figure 32 Map showing the location of the major molybdenum mineral deposits of United States listed in appendix 1 Geologic base is derived from Geological Survey of Canada (1995)
110
mafic lava flows5 km
10 km
sedimentary rocks
chromite seamPGE reef
titaniferousmagnetite layer
ultramafic rocksmafic rocks
basement rocks
feeder dike
marginal rocks(border phase)
disseminated tomassive sulfides
Figure 33 Idealized section through an ultramafic-to-mafic layered igneous intrusion showing the distribution of magmatic ore deposits
111
HHHH
H
H
H
H
H
H
H
H
H
H
H
H
120deg130deg 110deg 100deg 90deg 80deg 70deg
30deg
40deg
H
H
50deg
60deg
70deg
EXPLANATION
Rock typeMainly sedimentary terrane
Mainly volcanic terrane
Mixed sedimentary-volcanic terrane
Plutonic terrane
Metamorphic andor plutonic terrane
Melange schist or tectonite belt
Major silver depositsH Silver with other metals
Other metals with some silver
180deg170deg E 170deg W 150deg 130deg 120deg
12
3
45
6
78
910
11
140deg160deg
9000 1800 KILOMETERS
9000 1800 KILOMETERS
Figure 34 Map showing the location of the major silver mineral deposits of United States listed in appendix 1 Geologic base is derived from Geological Survey of Canada (1995) Numbered deposits are discussed in the report 1 ndash Red Dog and Su-Lik 2 ndash Arctic Camp 3 ndash Greens Creek 4 ndash Rock CreekRock Lake 5 ndash Galena and Lucky Friday mines Coeur drsquoAlene mining district 6 ndash Crandon 7 ndash McLaughlin and 8 ndash Rochester 9 ndash McCoyCove 10 ndash Round Mountain and 11 - Mesquite
112
AT
LAN
TIC
O
CE
AN
GEORGIAFLORIDA
JesupAmelia
Altama
Mineral City(Ponte Vedra)
Arlington
Brunswick
Jacksonville
Folkston
Waycross
Lake City Ridge
Starke
HighlandMaxville
TrailRidge
BaywoodPromontory
GreenCove
Springs
OkefenokeeSwamp
Yulee
FolkstonWest
Boulougne
CabinBluff
TrailRidge
WaycrossRidge
Heavy mineral concentrations
Sand ridges
0 20MILES
0 32KILOMETERS
FL
GA
Figure 35 Map showing heavy mineral deposits in northeastern Florida and southeastern Georgia Sand ridges are shown in yellow Heavy mineral concentrations are colored red Modified from Pirkle and others (1993)
113
H
J
H
Jltltltlt
HHHHHH
JJ
120deg130deg 110deg 100deg 90deg 80deg 70deg
30deg
40deg
180deg170deg E 170deg W 150deg 130deg 120deg
50deg
60deg
70deg
EXPLANATION
Rock typeMainly sedimentary terrane
Mainly volcanic terrane
Mixed sedimentary-volcanic terrane
Plutonic terrane
Metamorphic andor plutonic terrane
Melange schist or tectonite belt
Major mineral depositsH Barite
J Garnet
lt Talc
1
2
3
4
9000 1800 KILOMETERS
9000 1800 KILOMETERS
160deg 140deg
Figure 36 Map showing the location of the major barite garnet and talc mineral deposits of United States listed in appendix 1 Geologic base is derived from Geological Survey of Canada (1995) Numbered deposits are discussed in the report 1 ndash Emerald Creek 2 ndash Yellowstone 3 ndash Greystone and 4 ndash North Creek
114
J
H
JH
JJ
J
JJJJJJJJJJJJJJJJJ
JJJ
J J
JJJJ
J
JJJJ
J
lt
H
HH
J
JJ
JJJ
J
JJJ
J
J
J
J
J
lt
lt
120deg130deg 110deg 100deg 90deg 80deg 70deg
30deg
40deg
J
50deg
60deg
70deg
EXPLANATION
Rock typeMainly sedimentary terrane
Other rock types
Major mineral deposits
lt
Sodium-bentonite
J Phosphate rock
H Diatomite
J Kaolin and other clay minerals
Sepiolite bentonite saponite hectorite
180deg170deg E 170deg W 150deg 130deg 120deg
1
2
4
3
lt
9000 1800 KILOMETERS
9000 1800 KILOMETERS
160deg 140deg
Figure 37 Map showing the location of the major sodium bentonite phosphate rock diatomite kaolin and limestone mineral deposits of United States listed in appendix 1 Geologic base is derived from Geological Survey of Canada (1995) Numbered deposits are discussed in the report 1 ndash Hardin 2 ndash Western Phosphate field 3 ndash Lovelock and 4 ndash Lompoc
115
lt
J
C
(
(
((
(
lt
JJJJ
HJH HJ
J
H
HHHHHHHH
J
J
H
J
H
H
HHlt
ltltltltltlt
120deg130deg 110deg 100deg 90deg 80deg 70deg
30deg
40deg
180deg170deg E 170deg W 150deg 130deg 120deg
50deg
60deg
70deg
EXPLANATION
Rock typeMainly sedimentary terrane
Other rock types
Major mineral deposits Gypsum or anhydrite
( Boron
C Bromine
J Salt (halite) with other evaporite minerals
H Potash with other evaporite minerals
lt Sodium carbonate
lt
Sodium sulfate with other evaporite minerals
Sedimentary basin
1
160deg 140deg
Williston
Anadarko
Michigan
Appa
lachia
n
MississippiLouisiana
Arkoma
SouthTexas
Permian
Gulf Coast
WashakieGreenRiver
Uinta
Paradox
Salton
Sand WashOwens Lake
Searles Lake
9000 1800 KILOMETERS
9000 1800 KILOMETERS
Figure 38 Map showing the location of the major gypsum boron bromine salt potash and sodium carbonate mineral deposits of United States listed in appendix 1 Geologic base is derived from Geological Survey of Canada (1995) Sedimentary basins are shown in color labeled basins are discussed in the text Sedimentary basins from St John (2000) Numbered deposit is discussed in the report 1 ndash Boron
116
Phosphate Districts 1 - South Florida 2 - Central Florida 3 - North Central Florida 4 - North Florida 5 - South Georgia 6 - East Florida 7 - St Augustine 8 - Savannah 9 - Beaufort10 - Frying Pan11 - Pungo River12 - Ocala Hard Rock
ATLANTICOCEAN
Upland areas
Coastal marine environments
Areas of major phosphoritesedimentation
Depositional basins - intermediatewater depths
Depositional basins - deep water
7
6
1
2
34
5
9
10
8
11
12
100200
100200
200MILES0
Bathymetric contours in meters
0 322KILOMETERS
Figure 39 Map showing the location of the major phosphorite deposits relative to the Miocene geologic framework of the southeast Atlantic Coastal Plain-continental shelf system Modified from Riggs (1979)
117
0 1000MILES
Gypsum
Halite
Sylvite andother salts
0 1600KILOMETERS
Gulf Coast Basin
PermianBasin
ParadoxBasin
WillistonBasin
MichiganBasin
AppalachianBasin
MaritimesBasin
Figure 40 Map showing the distribution the location of major salt and potash deposits in evaporite basins in North America showing Modified from Kesler (1994)
118
WYOMING
IDAHO
UTAH
COLORADO0 100
KILOMETERS
Bedded Trona(hydrated sodium carbonate )Nahcolite (sodium bicarbonate )
Bedded halite and sodium carbonate salts
GrandJunction
Salt Lake City
Green River Formation
Uinta Basin
PiceanceCreekBasin
Green RiverBasin
Great DivideBasin
WashakieBasin
FossilBasin
107deg113deg
38deg
43deg
GreenRiver
Figure 41 Map showing the distribution of the Green River Formation and the location of sodium carbonate deposits in Utah Colorado and Wyoming Modified from Dyni (1996)
119
14
12
12
10
6
610
6
0 15 10
KILOMETERS
Green River
OrientalChemicalTG Soda
Ash
GeneralChemical
FMC5
SolvayMinerals
UN
ITA
CO
S
WE
ETW
ATE
R C
O
LIN
CO
LN C
O
BLMknown sodiumleasing area
6
10
12
gt14
Trona Bed 17Thickness in Feet
Figure 42 Map showing the thickness of trona bed 17 and Wyoming state mine permit areas Modified from Dyni (1996)
120
Figure 43 Charts showing the density of exploration sites for selected regions of the United States The density represents the number of sites for a state as described in literature from 1994 to 2003 divided by the area of the state A) Density of sites in Nevada Alaska Arizona California Idaho Montana and New Mexico B) Density of sites in Alaska relative to Arizona California Idaho Montana and New Mexico (combined) C) Density of sites in Alaska and Minnesota Source of information ndash D Wilburn (written comm 2003)
121
Figure 44 Graph showing the number of active mining claims held on public lands in the United States from 1976 to 2003 Source of information ndash DC Causey (written comm 2004)
122
Figure 45 Graph showing the number of active mining operations in the United States from 1979 to 2002 A) Total number of metal and nonmetal mines B) Total number of stone and surface sand and gravel mines Data from National Mining Association (2003b)
123
Appendix 1 Major mineral deposits in the United States [The information in this table is organized first by class then commodity and finally by deposit name Latitude and longitude are given in decimal degrees
Positive and negative values of latitude are in the northern and southern hemisphere respectively Positive and negative values of longitude are in the eastern and
western hemispheres respectively ldquoCommoditiesrdquo is a list of the major metals and materials associated with each deposit The most important commodities are
listed first The terms in ldquoClassrdquo broadly group the mineral deposits based on how they form the terms in deposit type are descriptive names given to groups of
mineral deposits that form in specific geologic settings ldquoModel Nordquo and ldquoModel namerdquo are the number and name of descriptive deposit models published by the
US Geological Survey (Stoeser and Heran 2000) ldquoReferencerdquo provides brief citations for additional information for the mineral deposit]
Deposit name State Latitude Longitude Commodities Class Deposit type Model No
Model name Reference
Spor Mountain Utah 39707 -113217 beryllium hydrothermal Epithermal beryllium deposit
na no model Harben and Kužvart (1996)
Kennecott Alaska 61528 -142840 copper hydrothermal Copper sulfide mineral deposit associated with carbonate sedimentary rocks
-- Kennecott Cu US Geological Survey National Mineral Resource Assessment Team (2000) Kirkham (1996)
Allouez Michigan 47289 -88404 copper hydrothermal Native copper deposits associated with basalt flows
23 Basaltic Cu Kirkham (1996)
Baltic Michigan 47065 -88634 copper hydrothermal Native copper deposits associated with basalt flows
23 Basaltic Cu Kirkham (1996)
Calumet - Hecla Michigan 47246 -88450 copper hydrothermal Native copper deposits associated with basalt flows
23 Basaltic Cu Kirkham (1996)
Appendix 1 Major mineral deposits in the United States ndash continued
Deposit name State Latitude Longitude Commodities Class Deposit type Model No
Model name Reference
Spor Mountain Utah 39707 -113217 beryllium hydrothermal Epithermal beryllium deposit
na no model Harben and Kužvart (1996)
Kearsarge Michigan 47278 -88418 copper hydrothermal Native copper deposits associated with basalt flows
23 Basaltic Cu Kirkham (1996)
Kingston Conglomerate
Michigan 47291 -88385 copper hydrothermal Native copper deposits associated with basalt flows
23 Basaltic Cu Long and others (1998)
Osceola Michigan 47225 -88459 copper hydrothermal Native copper deposits associated with basalt flows
23 Basaltic Cu Kirkham (1996)
Pewabic Michigan 47133 -88567 copper hydrothermal Native copper deposits associated with basalt flows
23 Basaltic Cu Kirkham (1996)
Bond Creek - Orange Hill
Alaska 62200 -142767 copper hydrothermal Porphyry copper deposit
17 Porphyry Cu Mutschler and others (1999)
Glacier Peak Washington 48198 -120979 copper hydrothermal Porphyry copper deposit
17 Porphyry Cu Singer and others (2002) Long and others (1998)
Lakeshore (Cyprus Casa Grande Cyprus Tohono)
Arizona 32520 -111880 copper hydrothermal Porphyry copper deposit
17 Porphyry Cu Singer and others (2002) Long and others (1998)
Miami East Arizona 33420 -110740 copper hydrothermal Porphyry copper deposit
17 Porphyry Cu Long and others (1998)
Poston Butte (Florence)
Arizona 33117 -111417 copper hydrothermal Porphyry copper deposit
17 Porphyry Cu Singer and others (2002) Long and others (1998)
Red Mountain Arizona 31490 -110720 copper hydrothermal Porphyry copper deposit
17 Porphyry Cu Singer and others (2002)
Santa Cruz Arizona 32890 -111860 copper hydrothermal Porphyry copper deposit
17 Porphyry Cu Long and others (1998)
Santa Cruz (Casa Grande) Sacaton
Arizona 32867 -111950 copper hydrothermal Porphyry copper deposit
17 Porphyry Cu Mutschler and others (1999)
126
Appendix 1 Major mineral deposits in the United States ndash continued
Deposit name State Latitude Longitude Commodities Class Deposit type Model No
Model name Reference
Spor Mountain Utah 39707 -113217 beryllium hydrothermal Epithermal beryllium deposit
na no model Harben and Kužvart (1996)
Sheep Mountain Arizona 34080 -112460 copper hydrothermal Porphyry copper deposit
17 Porphyry Cu Singer and others (2002)
Superior East (Pinal Ranch)
Arizona 33378 -110999 copper hydrothermal Porphyry copper deposit
17 Porphyry Cu Singer and others (2002)
Yerington Nevada 38983 -119183 copper hydrothermal Porphyry copper deposit
17 Porphyry Cu Mutschler and others (1999)
Kona Dolomite Michigan 46533 -87450 copper hydrothermal Sediment-hosted copper deposit
30b2 Sediment-hosted copper reduced-facies subtype
Cox and others (2003) Long and others (1998)
White Pine Michigan 46767 -89567 copper hydrothermal Sediment-hosted copper deposit
30b2 Sediment-hosted copper reduced-facies subtype
Cox and others (2003) Long and others (1998)
Blackbird Idaho 45121 -114339 copper cobalt
hydrothermal Sedimentary exhalative copper-cobalt deposit
24d Blackbird Co-Cu
Spanski (2004)
Iron Creek Idaho 44962 -114115 copper cobalt
hydrothermal Sedimentary exhalative copper-cobalt deposit
24d Blackbird Co-Cu
Spanski (2004)
Ram (Idaho Cobalt Project)
Idaho 45140 -114360 copper cobalt
hydrothermal Sedimentary exhalative copper-cobalt deposit
24d Blackbird Co-Cu
Spanski (2004)
Ajo (New Cornelia)
Arizona 32360 -112850 copper gold hydrothermal Porphyry copper deposit
17 Porphyry Cu Singer and others (2002) Long and others (1998)
Dos Pobres Arizona 32970 -109650 copper gold hydrothermal Porphyry copper deposit
20c Porphyry Cu-Au
Long and others (1998)
Ely (Robinson Ruth)
Nevada 39260 -114999 copper gold hydrothermal Porphyry copper deposit
17 Porphyry Cu Singer and others (2002) Mutschler and others (1999)
127
Appendix 1 Major mineral deposits in the United States ndash continued
Deposit name State Latitude Longitude Commodities Class Deposit type Model No
Model name Reference
Spor Mountain Utah 39707 -113217 beryllium hydrothermal Epithermal beryllium deposit
na no model Harben and Kužvart (1996)
Lone Star Arizona 32930 -109600 copper gold hydrothermal Porphyry copper deposit
20c Porphyry Cu-Au
Long and others (1998)
Margaret (Earl) Washington 46356 -122081 copper gold hydrothermal Porphyry copper deposit
17 Porphyry Cu Singer and others (2002) Long and others (1998)
Pebble Copper (Pebble Beach)
Alaska 59898 -155296 copper gold hydrothermal Porphyry copper deposit
20c Porphyry Cu-Au
Singer and others (2002)
Safford (Lone Star includes Dos Pobres San Juan)
Arizona 32933 -109600 copper gold hydrothermal Porphyry copper deposit
20c Porphyry Cu-Au
Singer and others (2002) Long and others (1998)
Bagdad Arizona 34580 -113170 copper molybdenum silver gold
hydrothermal Porphyry copper deposit
21a Porphyry Cu-Mo
Singer and others (2002)
Bingham Canyon
Utah 40540 -112140 copper molybdenum silver gold
hydrothermal Porphyry copper deposit
21a Porphyry Cu-Mo
Long and others (1998)
Butte (Continental Berkeley etc)
Montana 46020 -112526 copper molybdenum silver gold
hydrothermal Porphyry copper deposit
21a Porphyry Cu-Mo
Long and others (1998)
Casa Grande West (Santa Cruz)
Arizona 32867 -111950 copper molybdenum silver gold
hydrothermal Porphyry copper deposit
21a Porphyry Cu-Mo
Singer and others (2002)
Esperanza - Sierrita
Arizona 31869 -111120 copper molybdenum silver gold
hydrothermal Porphyry copper deposit
21a Porphyry Cu-Mo
Singer and others (2002)
Miami - Inspiration (includes Bluebird Copper Cities Globe Van Dyke)
Arizona 33420 -110740 copper molybdenum silver gold
hydrothermal Porphyry copper deposit
21a Porphyry Cu-Mo
Singer and others (2002) Long and others (1998)
128
Appendix 1 Major mineral deposits in the United States ndash continued
Deposit name State Latitude Longitude Commodities Class Deposit type Model No
Model name Reference
Spor Mountain Utah 39707 -113217 beryllium hydrothermal Epithermal beryllium deposit
na no model Harben and Kužvart (1996)
Mineral Park Arizona 35367 -114150 copper molybdenum silver gold
hydrothermal Porphyry copper deposit
21a Porphyry Cu-Mo
Kirkham and Sinclair (1996a)
Morenci - Metcalf
Arizona 33090 -109340 copper molybdenum silver gold
hydrothermal Porphyry copper deposit
21a Porphyry Cu-Mo
Singer and others (2002) Long and others (1998)
Pinto Valley - Castle Dome
Arizona 33400 -110950 copper molybdenum silver gold
hydrothermal Porphyry copper deposit
21a Porphyry Cu-Mo
Long and others (1998)
Ray Arizona 33160 -110970 copper molybdenum silver gold
hydrothermal Porphyry copper deposit
21a Porphyry Cu-Mo
Singer and others (2002) Long and others (1998)
San Manuel - Kalamazoo
Arizona 32670 -110670 copper molybdenum silver gold
hydrothermal Porphyry copper deposit
21a Porphyry Cu-Mo
Singer and others (2002) Long and others (1998)
Taurus Alaska 63521 -141324 copper molybdenum silver gold
hydrothermal Porphyry copper deposit
21a Porphyry Cu-Mo
Long and others (1998)
Twin Buttes Arizona 31880 -111030 copper molybdenum silver gold
hydrothermal Porphyry copper deposit
21a Porphyry Cu-Mo
Singer and others (2002)
Tyrone New Mexico 32633 -108367 copper molybdenum silver gold
hydrothermal Porphyry copper deposit
21a Porphyry Cu-Mo
Singer and others (2002)
Bisbee (Warren) Arizona 31433 -109900 copper silver hydrothermal Porphyry copper deposit
17 Porphyry Cu Mutschler and others (1999)
Castle Dome (Pinto Valley includes Carlota - Cactus)
Arizona 33400 -110950 copper silver hydrothermal Porphyry copper deposit
17 Porphyry Cu Singer and others (2002)
129
Appendix 1 Major mineral deposits in the United States ndash continued
Deposit name State Latitude Longitude Commodities Class Deposit type Model No
Model name Reference
Spor Mountain Utah 39707 -113217 beryllium hydrothermal Epithermal beryllium deposit
na no model Harben and Kužvart (1996)
Hannover Mountains (Fierro - Hannover)
New Mexico 32833 -108083 copper silver hydrothermal Porphyry copper deposit
17 Porphyry Cu Singer and others (2002)
Helvetia (Rosemont includes Rosemont Peach - Elgin Broadtop Butte and Copper World)
Arizona 31830 -110760 copper silver hydrothermal Porphyry copper deposit
17 Porphyry Cu Singer and others (2002)
Mission - Pima - San Xavier
Arizona 31983 -111067 copper silver hydrothermal Porphyry copper deposit
17 Porphyry Cu Singer and others (2002) Long and others (1998)
Rosemont - Peach - Elgin - Broadtop Butte
Arizona 31830 -110760 copper silver hydrothermal Porphyry copper deposit
18a Porphyry Cu skarn-related
Long and others (1998)
Rock Creek (includes Rock Lake Montanore Copper Gulch Horizon Basin Rock Peak)
Montana 48079 -115677 copper silver hydrothermal Revett copper deposit
30b4 Revett Cu Cox and others (2003) Long and others (1998)
Spar Lake (Troy mine)
Montana 48230 -115905 copper silver hydrothermal Revett copper deposit
30b4 Revett Cu Cox and others (2003)
Bingham Canyon (skarn)
Utah 40540 -112140 copper silver gold
hydrothermal Copper skarn deposit
18b Skarn Cu Long and others (1998)
Robinson Nevada 39260 -115000 copper silver gold
hydrothermal Porphyry copper deposit
18a Porphyry Cu skarn-related
Long and others (1998)
130
Appendix 1 Major mineral deposits in the United States ndash continued
Deposit name State Latitude Longitude Commodities Class Deposit type Model No
Model name Reference
Spor Mountain Utah 39707 -113217 beryllium hydrothermal Epithermal beryllium deposit
na no model Harben and Kužvart (1996)
Santa Rita (Chino includes Groundhog - Pewabic - Empire (skarns))
New Mexico 32792 -108067 copper silver gold
hydrothermal Porphyry copper deposit
17 Porphyry Cu Singer and others (2002)
Magma Arizona 33306 -111093 copper silver gold
hydrothermal Porphyry-related copper veins
gsc17 Vein polymetallic porphyry Cu-related
Kirkham and Sinclair (1996b)
Butte (Veins) Montana 46020 -112530 copper silver zinc gold lead
hydrothermal Porphyry-related copper veins
gsc17 Vein copper deposits (Vein polymetallic porphyry Cu-related)
Long and others (1998)
Donlin Creek Alaska 62075 -158217 gold hydrothermal Intrusion-related gold deposit
43 Plutonic porphyry Au
Long and others (1998)
Fort Knox Alaska 64967 -147367 gold hydrothermal Intrusion-related gold deposit
43 Plutonic porphyry Au
Long and others (1998)
Pogo (Liese zone)
Alaska 64283 -144883 gold hydrothermal Intrusion-related gold deposit
43 Plutonic porphyry Au
Mutschler and others (1999)
Alaska - Juneau (AJ Perseverance)
Alaska 58308 -134345 gold hydrothermal Orogenic gold veins
36a Low-sulfide Au-quartz vein
Long and others (1998)
Empire - North Star
California 39206 -121045 gold hydrothermal Orogenic gold veins
36a Low-sulfide Au-quartz vein
Long and others (1998)
Homestake South Dakota
44360 -103770 gold hydrothermal Orogenic gold veins
36b Homestake Au
Long and others (1998)
Idaho - Maryland - Eureka - Brunswick
California 39224 -121038 gold hydrothermal Orogenic gold veins
36a Low-sulfide Au-quartz vein
Long and others (1998)
131
Appendix 1 Major mineral deposits in the United States ndash continued
Deposit name State Latitude Longitude Commodities Class Deposit type Model No
Model name Reference
Spor Mountain Utah 39707 -113217 beryllium hydrothermal Epithermal beryllium deposit
na no model Harben and Kužvart (1996)
Jamestown California 37946 -120437 gold hydrothermal Orogenic gold veins
36a Low-sulfide Au-quartz vein
Long and others (1998)
Kensington - Jualin
Alaska 58866 -135087 gold hydrothermal Orogenic gold veins
36a Low-sulfide Au-quartz vein
Long and others (1998)
Candelaria Nevada 38150 -118080 gold silver hydrothermal Distal disseminated gold deposit
19c Distal disseminated Ag-Au
Long and others (1998)
Hardshell Arizona 31460 -110720 gold silver hydrothermal Distal disseminated gold deposit
19c Distal disseminated Ag-Au
Long and others (1998)
Lone Tree - Stonehouse
Nevada 40830 -117210 gold silver hydrothermal Distal disseminated gold deposit
19c Distal disseminated Ag-Au
Long and others (1998) Tingley (2002)
McCoy - Cove Nevada 40340 -117210 gold silver hydrothermal Distal disseminated gold deposit
19c Distal disseminated Ag-Au
Long and others (1998)
Rochester Nevada 40280 -118150 gold silver hydrothermal Distal disseminated gold deposit
19c Distal disseminated Ag-Au
Long and others (1998)
Bald Mountain (Wharf Trojan Portland)
South Dakota
44344 -103842 gold silver hydrothermal Epithermal gold deposit
22b Alakaline Au-Te (Au-Ag-Te veins)
Long and others (1998)
Black Hills Tertiary (includes Gilt Edge Golden Reward Annie Creek (Foley Ridge) Richmond Hill Green Mountain)
South Dakota
44333 -103767 gold silver hydrothermal Epithermal gold deposit
25a-d Epithermal vein
Mutschler and others (1999)
132
Appendix 1 Major mineral deposits in the United States ndash continued
Deposit name State Latitude Longitude Commodities Class Deposit type Model No
Model name Reference
Spor Mountain Utah 39707 -113217 beryllium hydrothermal Epithermal beryllium deposit
na no model Harben and Kužvart (1996)
Comstock Lode Nevada 39320 -119590 gold silver hydrothermal Epithermal gold deposit
25c Epithermal vein Comstock
Long and others (1998)
Cripple Creek Colorado 38717 -105133 gold silver hydrothermal Epithermal gold deposit
22b Alakaline Au-Te (Au-Ag-Te veins)
Long and others (1998)
Goldbanks Nevada 40465 -117604 gold silver hydrothermal Epithermal gold deposit
25a Hot-spring Au-Ag
Long and others (1998)
Golden Sunlight Montana 45906 -112014 gold silver hydrothermal Epithermal gold deposit
22b Alakaline Au-Te (Au-Ag-Te veins)
Long and others (1998) Mutschler and others (1999)
Goldfield Nevada 37710 -117210 gold silver hydrothermal Epithermal gold deposit
25e Epithermal quartz-alunite Au
Long and others (1998)
Ken Snyder (Midas) mine (Gold Circle district)
Nevada 41250 -116790 gold silver hydrothermal Epithermal gold deposit
25c Epithermal vein Comstock
Long and others (1998) Tingley (2002)
McDonald Montana 47000 -112525 gold silver hydrothermal Epithermal gold deposit
25a Hot-spring Au-Ag
Long and others (1998)
McLaughlin California 38836 -122357 gold silver hydrothermal Epithermal gold deposit
25a Hot-spring Au-Ag
Long and others (1998)
Mesquite California 33098 -114963 gold silver hydrothermal Epithermal gold deposit
25a Hot-spring Au-Ag
Long and others (1998)
Oatman Arizona 35100 -114447 gold silver hydrothermal Epithermal gold deposit
25c Epithermal vein Comstock
Long and others (1998)
Ortiz Mountains (Old Placers)
New Mexico 35317 -106167 gold silver hydrothermal Epithermal gold deposit
25a-d Epithermal vein
Mutschler and others (1999)
Republic District (Knob Hill etc)
Washington 48673 -118758 gold silver hydrothermal Epithermal gold deposit
25c Epithermal vein Comstock
Long and others (1998)
133
Appendix 1 Major mineral deposits in the United States ndash continued
Deposit name State Latitude Longitude Commodities Class Deposit type Model No
Model name Reference
Spor Mountain Utah 39707 -113217 beryllium hydrothermal Epithermal beryllium deposit
na no model Harben and Kužvart (1996)
Round Mountain Nevada 38700 -117080 gold silver hydrothermal Epithermal gold deposit
25a Hot-spring Au-Ag
Long and others (1998)
Sleeper Nevada 41330 -118050 gold silver hydrothermal Epithermal gold deposit
25a Hot-spring Au-Ag
Long and others (1998) Tingley (2002)
Tonopah Nevada 38070 -117230 gold silver hydrothermal Epithermal gold deposit
25c Epithermal vein Comstock
Long and others (1998)
Zortman - Landusky
Montana 47929 -108586 gold silver hydrothermal Epithermal gold deposit
22b Alakaline Au-Te (Au-Ag-Te veins)
Long and others (1998)
Battle Mountain (Tomboy - Minnie - Fortitude - Northeast Ext - Iron Canyon - Midas - Phoenix)
Nevada 40530 -117120 gold silver hydrothermal Gold skarn deposit 18f Skarn Au Long and others (1998) Mutschler and others (1999) Tingley (2002) Newmont (2003)
Betze - Post (Betze Screamer and Deep Post)
Nevada 40977 -116358 gold silver hydrothermal Sediment-hosted gold deposit
26a1 Sediment-hosted Au
Long and others (1998) Bettles (2002)
Carlin - Hardie Nevada 40912 -116320 gold silver hydrothermal Sediment-hosted gold deposit
26a1 Sediment-hosted Au
Long and others (1998)
Chimney Creek South - Rabbit Creek
Nevada 41280 -117157 gold silver hydrothermal Sediment-hosted gold deposit
26a1 Sediment-hosted Au
Singer and others (1993)
Cortez (Cortez Pipeline South Pipeline Pediment Gap Gold Acres and Horse Canyon)
Nevada 40248 -116740 gold silver hydrothermal Sediment-hosted gold deposit
26a1 Sediment-hosted Au
Long and others (1998) Tingley (2002) Placer Dome (2002a)
134
Appendix 1 Major mineral deposits in the United States ndash continued
Deposit name State Latitude Longitude Commodities Class Deposit type Model No
Model name Reference
Spor Mountain Utah 39707 -113217 beryllium hydrothermal Epithermal beryllium deposit
na no model Harben and Kužvart (1996)
Genesis - Blue Star - Beast - Bobcat - Northstar
Nevada 40952 -116352 gold silver hydrothermal Sediment-hosted gold deposit
26a1 Sediment-hosted Au
Long and others (1998) Bettles (2002)
Getchell (Getchell Turquoise Ridge North Zone)
Nevada 41210 -117260 gold silver hydrothermal Sediment-hosted gold deposit
26a1 Sediment-hosted Au
Long and others (1998) Placer Dome (2002b)
Gold Quarry South Layback (Maggie Creek district)
Nevada 40825 -116225 gold silver hydrothermal Sediment-hosted gold deposit
26a1 Sediment-hosted Au
Long and others (1998) Newmont (2003)
Jerritt Canyon (Burns Basin Enfield Bell Pattani Springs)
Nevada 41340 -116010 gold silver hydrothermal Sediment-hosted gold deposit
26a1 Sediment-hosted Au
Long and others (1998)
Leeville (West Leeville Four Corners Turf)
Nevada 40930 -116320 gold silver hydrothermal Sediment-hosted gold deposit
26a1 Sediment-hosted Au
Long and others (1998) Newmont (2003)
Meikle (Purple Vein) (Meikle South Meikle Griffin and Rodeo)
Nevada 41010 -116360 gold silver hydrothermal Sediment-hosted gold deposit
26a1 Sediment-hosted Au
Long and others (1998) Bettles (2002)
Twin Creeks (Chimney Creek and Rabbit Creek)
Nevada 41280 -117170 gold silver hydrothermal Sediment-hosted gold deposit
26a1 Sediment-hosted Au
Long and others (1998)
Goodsprings Nevada 35850 -115500 gold silver zinc lead
hydrothermal Polymetallic replacement deposit
19a Polymetallic replacement
Long and others (1998)
135
Appendix 1 Major mineral deposits in the United States ndash continued
Deposit name State Latitude Longitude Commodities Class Deposit type Model No
Model name Reference
Spor Mountain Utah 39707 -113217 beryllium hydrothermal Epithermal beryllium deposit
na no model Harben and Kužvart (1996)
Pride of the Mountains
Washington 47981 -121369 gold silver zinc lead copper
hydrothermal Polymetallic veins 22c Polymetallic veins
Long and others (1998)
Dragon Mine Utah 39918 -112104 halloysite (clay mineral with tube-like crystals)
hydrothermal Hydrothermal kaolin (halloysite) deposit
25l2 Hydrothermal kaolin
Industrial Minerals (2004a)
Hector California 34755 -116431 hectorite (lithium-rich clay mineral)
hydrothermal Hydrothermal lithium-rich clay deposit
25l3 Lithium -rich clays
Harben and Kužvart (1996)
Montana Mountains
Nevada 41767 -118108 hectorite (lithium-rich clay mineral)
hydrothermal Hydrothermal lithium-rich clay deposit
25l3 Lithium -rich clays
Odom (1992)
Eagle Mountain California 33883 -115542 iron hydrothermal Iron skarn deposit 18d Skarn Fe Singer and others (1993)
Iron Springs Utah 37683 -113250 iron hydrothermal Iron skarn deposit 18d Skarn Fe Singer and others (1993)
Benson New York 44179 -75006 iron hydrothermal Magnetite deposits in volcanic rocks
25i Volcanic-hosted magnetite
Singer and others (1993)
Pea Ridge Missouri 38125 -91042 iron hydrothermal Magnetite deposits in volcanic rocks
25i Volcanic-hosted magnetite
Singer and others (1993)
Burkesville Kentucky 36775 -85335 lead zinc hydrothermal Mississippi Valley-type deposit (MVT)
32b Mississippi Valley Appalachian Zn
Long and others (1998)
Tri - state (Galena Joplin Picher)
Kansas Missouri Oklahoma
37083 -94650 lead zinc hydrothermal Mississippi Valley-type deposit (MVT)
32a Mississippi Valley SE Missouri Pb-Zn
Long and others (1998)
136
Appendix 1 Major mineral deposits in the United States ndash continued
Deposit name State Latitude Longitude Commodities Class Deposit type Model No
Model name Reference
Spor Mountain Utah 39707 -113217 beryllium hydrothermal Epithermal beryllium deposit
na no model Harben and Kužvart (1996)
Star - Morning Idaho 47468 -115812 lead zinc silver
hydrothermal Coeur d Alene-type polymetallic vein
-- Coeur d Alene-type polymetallic vein Revett-St Regis subtype
Long and others (1998)
Old Lead Belt Missouri 37842 -90534 lead zinc silver
hydrothermal Mississippi Valley-type deposit (MVT)
32a Mississippi Valley SE Missouri Pb-Zn
Long and others (1998)
Viburnum Trend Missouri 37583 -91167 lead zinc silver copper
hydrothermal Mississippi Valley-type deposit (MVT)
32a Mississippi Valley SE Missouri Pb-Zn
Long and others (1998)
Big Ben - Niehart
Montana 46950 -110733 molybdenum hydrothermal Climax-type molybdenum deposit
16 Climax Mo Mutschler and others (1999)
Cave Peak Texas 31433 -104883 molybdenum hydrothermal Climax-type molybdenum deposit
16 Climax Mo Mutschler and others (1999)
Climax Colorado 39367 -106167 molybdenum hydrothermal Climax-type molybdenum deposit
16 Climax Mo Mutschler and others (1999)
Henderson - Urad
Colorado 39750 -105833 molybdenum hydrothermal Climax-type molybdenum deposit
16 Climax Mo Mutschler and others (1999)
Mount Emmons - Redwell Basin
Colorado 38883 -107067 molybdenum hydrothermal Climax-type molybdenum deposit
16 Climax Mo Mutschler and others (1999)
Mount Hope Nevada 39783 -116167 molybdenum hydrothermal Climax-type molybdenum deposit
16 Climax Mo Mutschler and others (1999)
137
Appendix 1 Major mineral deposits in the United States ndash continued
Deposit name State Latitude Longitude Commodities Class Deposit type Model No
Model name Reference
Spor Mountain Utah 39707 -113217 beryllium hydrothermal Epithermal beryllium deposit
na no model Harben and Kužvart (1996)
Pine Grove Utah 38336 -113606 molybdenum hydrothermal Climax-type molybdenum deposit
16 Climax Mo Singer and others (1993)
Quartz Hill Alaska 55400 -130467 molybdenum hydrothermal Climax-type molybdenum deposit
16 Climax Mo Mutschler and others (1999) Singer and others (1993)
Questa New Mexico 36683 -105500 molybdenum hydrothermal Climax-type molybdenum deposit
16 Climax Mo Mutschler and others (1999)
Thompson Creek Idaho 44333 -114583 molybdenum hydrothermal Porphyry molybdenum deposit
21b Porphyry Mo Low-F
Mutschler and others (1999)
Buckingham Nevada 40617 -117075 molybdenum copper
hydrothermal Porphyry molybdenum deposit
21b Porphyry Mo Low-F
Long and others (1998)
Cumo Idaho 44000 -115783 molybdenum copper
hydrothermal Porphyry molybdenum deposit
21b Porphyry Mo Low-F
Mutschler and others (1999)
Mount Tolman Washington 48050 -118700 molybdenum copper
hydrothermal Porphyry molybdenum deposit
21b Porphyry Mo Low-F
Mutschler and others (1999)
Copper Queen Arizona 31430 -109910 silver copper gold zinc lead
hydrothermal Polymetallic replacement deposit
19a Polymetallic replacement
Long and others (1998)
Arctic Camp Alaska 67181 -156386 silver copper zinc
hydrothermal Volcanogenic massive sulfide deposit (VMS)
28a Massive sulfide Kuroko
Long and others (1998)
Rocky Range Utah 38450 -113063 silver gold copper
hydrothermal Copper skarn deposit
18b Skarn Cu Long and others (1998)
Leadville Colorado 39250 -106250 silver gold lead zinc copper
hydrothermal Polymetallic replacement deposit
19a Polymetallic replacement
Long and others (1998)
138
Appendix 1 Major mineral deposits in the United States ndash continued
Deposit name State Latitude Longitude Commodities Class Deposit type Model No
Model name Reference
Spor Mountain Utah 39707 -113217 beryllium hydrothermal Epithermal beryllium deposit
na no model Harben and Kužvart (1996)
Greens Creek Alaska 58077 -134619 silver gold zinc lead
hydrothermal Volcanogenic massive sulfide deposit (VMS)
28a Massive sulfide Kuroko
Long and others (1998)
Red Mountain - Sneffels - Telluride
Colorado 37958 -107750 silver gold zinc lead copper
hydrothermal Polymetallic veins 22c Polymetallic veins
Long and others (1998)
Presidio Texas 29810 -104330 silver lead hydrothermal Polymetallic replacement deposit
19a Polymetallic replacement
Long and others (1998)
Bunker Hill - Last Chance
Idaho 47536 -116138 silver lead zinc
hydrothermal Coeur d Alene-type polymetallic vein
-- Coeur d Alene-type polymetallic vein Revett-St Regis subtype
Long and others (1998)
Galena Idaho 47477 -115965 silver lead zinc
hydrothermal Coeur d Alene-type polymetallic vein
-- Coeur d Alene-type polymetallic vein Revett-St Regis subtype
Long and others (1998)
Lucky Friday Idaho 47471 -115780 silver lead zinc
hydrothermal Coeur d Alene-type polymetallic vein
-- Coeur d Alene-type polymetallic vein Revett-St Regis subtype
Long and others (1998)
Creede (Amethyst Bulldog etc veins)
Colorado 37875 -106933 silver lead zinc
hydrothermal Epithermal gold deposit
25b Epithermal vein Creede
Long and others (1998)
Aspen Colorado 39167 -106833 silver lead zinc
hydrothermal Polymetallic replacement deposit
19a Polymetallic replacement
Long and others (1998)
139
Appendix 1 Major mineral deposits in the United States ndash continued
Deposit name State Latitude Longitude Commodities Class Deposit type Model No
Model name Reference
Spor Mountain Utah 39707 -113217 beryllium hydrothermal Epithermal beryllium deposit
na no model Harben and Kužvart (1996)
Sunshine Idaho 47501 -116068 silver lead zinc copper
hydrothermal Coeur d Alene-type polymetallic vein
-- Coeur d Alene-type polymetallic vein Revett-St Regis subtype
Long and others (1998)
Bingham Canyon (polymetallic replacement)
Utah 40540 -112140 silver lead zinc gold copper
hydrothermal Polymetallic replacement deposit
19a Polymetallic replacement
Long and others (1998)
Park City Utah 40620 -111510 silver lead zinc gold copper
hydrothermal Polymetallic replacement deposit
19a Polymetallic replacement
Long and others (1998)
Tintic - East Tintic
Utah 39910 -112100 silver lead zinc gold copper
hydrothermal Polymetallic replacement deposit
19a Polymetallic replacement
Long and others (1998)
Crandon Wisconsin 45483 -88926 silver zinc gold copper lead
hydrothermal Volcanogenic massive sulfide deposit (VMS)
28a Massive sulfide Kuroko
Long and others (1998)
Beaverhead Montana 45224 -112301 talc hydrothermal Hydrothermal talc deposit
18m Metasomatic and metamorphic replacement talc
Spanski (2004)
Regal (Keystone)
Montana 45172 -112425 talc hydrothermal Hydrothermal talc deposit
18m Metasomatic and metamorphic replacement talc
Spanski (2004)
Treasure (Treasure State Treasure Chest
Montana 45228 -112309 talc hydrothermal Hydrothermal talc deposit
18m Metasomatic and metamorphic replacement talc
Spanski (2004)
140
Appendix 1 Major mineral deposits in the United States ndash continued
Deposit name State Latitude Longitude Commodities Class Deposit type Model No
Model name Reference
Spor Mountain Utah 39707 -113217 beryllium hydrothermal Epithermal beryllium deposit
na no model Harben and Kužvart (1996)
Yellowstone (Johnny Gulch Cyprus Cameron Montana Talc)
Montana 45077 -111730 talc hydrothermal Hydrothermal talc deposit
18m Metasomatic and metamorphic replacement talc
Spanski (2004)
Franklin New Jersey 41120 -74590 zinc hydrothermal Sedimentary exhalative zinc-lead deposit
31a Sedimentary exhalative Zn-Pb
Long and others (1998)
Sterling Hill New Jersey 41080 -74600 zinc hydrothermal Sedimentary exhalative zinc-lead deposit
31a Sedimentary exhalative Zn-Pb
Long and others (1998)
Fountain Run Kentucky 36704 -85943 zinc lead hydrothermal Mississippi Valley-type deposit (MVT)
32b Mississippi Valley Appalachian Zn
Long and others (1998)
Mascot - Jefferson City
Tennessee 36400 -83350 zinc lead hydrothermal Mississippi Valley-type deposit (MVT)
32b Mississippi Valley Appalachian Zn
Long and others (1998)
Pierrepont Edwards and Balmat
New York 44252 -75400 zinc lead hydrothermal Sedimentary exhalative zinc-lead deposit
31a Sedimentary exhalative Zn-Pb
Long and others (1998)
Lik - Su Alaska 68167 -163200 zinc lead silver
hydrothermal Sedimentary exhalative zinc-lead deposit
31a Sedimentary exhalative Zn-Pb
Long and others (1998)
Red Dog Alaska 68067 -162824 zinc lead silver
hydrothermal Sedimentary exhalative zinc-lead deposit
31a Sedimentary exhalative Zn-Pb
Long and others (1998)
Gilman Colorado 39533 -106376 zinc silver copper lead
hydrothermal Lead-zinc skarn deposit
18c Skarn Zn-Pb Dawson (1996)
Birch Lake Minnesota 47817 -91733 copper magmatic Magmatic copper-nickel deposit near base of mafic igneous intrusion
5a Duluth Cu-Ni-PGE
Long and others (1998)
141
Appendix 1 Major mineral deposits in the United States ndash continued
Deposit name State Latitude Longitude Commodities Class Deposit type Model No
Model name Reference
Spor Mountain Utah 39707 -113217 beryllium hydrothermal Epithermal beryllium deposit
na no model Harben and Kužvart (1996)
Babbit (Minnamax) - Mesaba project
Minnesota 47641 -91883 copper nickel PGE
magmatic Magmatic copper-nickel deposit near base of mafic igneous intrusion
5a Duluth Cu-Ni-PGE
Long and others (1998) Miller Severson and others (2002)
Dunka Road - Northmet project
Minnesota 47610 -91960 copper nickel PGE
magmatic Magmatic copper-nickel deposit near base of mafic igneous intrusion
5a Duluth Cu-Ni-PGE
Long and others (1998) Cannon and others (1997)
Maturi Minnesota 47801 -91756 copper nickel PGE
magmatic Magmatic copper-nickel deposit near base of mafic igneous intrusion
5a Duluth Cu-Ni-PGE
Long and others (1998) Miller Severson and others (2002)
Bessemer City South Carolina
35333 -81167 lithium magmatic Pegmatite 13b Li pegmatites Anstett and others (1990)
Kings Mountain North Carolina
35250 -81342 lithium mica magmatic Pegmatite rich in lithium
13b Li pegmatites Harben and Kužvart (1996)
Black Canyon Arizona 34120 -112210 mica feldspathic sand
magmatic Pegmatite rich in mica
13f Mica pegmatites
Industrial Minerals (1999c) Industrial Minerals (2002)
Wind Mountain New Mexico 32025 -105515 nepheline syenite
magmatic Igneous rock rich in nepheline
na no model Industrial Minerals (1995)
McClure Mountain Complex
Colorado 38350 -105467 niobium magmatic Mineralization associated with carbonatite igneous complex
10 carbonatite Crockett and Sutphin (1993)
142
Appendix 1 Major mineral deposits in the United States ndash continued
Deposit name State Latitude Longitude Commodities Class Deposit type Model No
Model name Reference
Spor Mountain Utah 39707 -113217 beryllium hydrothermal Epithermal beryllium deposit
na no model Harben and Kužvart (1996)
Iron Hill (Powderhorn Cebolla Creek)
Colorado 38250 -107050 niobium rare-earth elements barium fluorite phosphorus titanium
magmatic Mineralization associated with carbonatitealkalic igneous complex
10 carbonatite Woolley (1987)
Deep Creek Oregon 42050 -119950 niobium rare-earth elements phosphorus fluorium stronium
magmatic Mineralization associated with carbonatite igneous complex
10 carbonatite Woolley (1987)
J - M Reef - East Boulder mine
Montana 45403 -110007 palladium platinum
magmatic Reef-type PGE deposit
2b Merensky Reef PGE
Spanski (2004) Zientek and others (2002)
J - M Reef - Stillwater mine
Montana 45389 -109874 palladium platinum
magmatic Reef-type PGE deposit
2b Merensky Reef PGE
Spanski (2004) Zientek and others (2002)
Gem Park Colorado 38267 -105550 phosphorus niobium vermiculite rare-earth elements thorium copper barium
magmatic Mineralization associated with carbonatitealkalic igneous complex
10 carbonatite Woolley (1987)
Mountain Pass California 35483 -115533 rare-earth elements barium
magmatic Mineralization associated with carbonatite igneous complex
10 carbonatite Woolley (1987)
143
Appendix 1 Major mineral deposits in the United States ndash continued
Deposit name State Latitude Longitude Commodities Class Deposit type Model No
Model name Reference
Spor Mountain Utah 39707 -113217 beryllium hydrothermal Epithermal beryllium deposit
na no model Harben and Kužvart (1996)
Hicks Dome Illinois 37600 -88400 rare-earth elements fluorite
magmatic Mineralization associated with carbonatite igneous complex
10 carbonatite Jackson and Christiansen (1993)
Bear Lodge Mountains (southern)
Wyoming 44483 -104450 rare-earth elements thorium
magmatic Mineralization associated with carbonatite igneous complex
10 carbonatite Woolley (1987)
Tucker - Poplar Lake deposit
Minnesota 48167 -90667 titanium magnetite
magmatic Layers of ilmentite and titanomagnetite in ferrogabbroic and anothositic rocks
3 Bushveld Fe-Ti-V
Towner and others (1988)
Hamilton Montana 46262 -113888 vermiculite magmatic Vermiculite associated with ultramafic igneous rocks
na no model Industrial Minerals (1999a)
Zonolite (Rainy Creek Vermiculite Mountain Libby)
Montana 48434 -115406 vermiculite magmatic Vermiculite associated with ultramafic igneous rocks
na no model Spanski (2004)
Eagle (Slate Creek)
Alaska 64567 -142500 asbestos metamorphic Asbestos in metamorphosed ultramafic igneous rock
8d Serpentine-hosted asbestos
Foster (1969)
Gore Mountain New York 43679 -74054 garnet metamorphic Garnet in metamorphosed igneous rocks
na no model Harben and Kužvart (1996) New York State Department of Environmental Conservation (undated)
144
Appendix 1 Major mineral deposits in the United States ndash continued
Deposit name State Latitude Longitude Commodities Class Deposit type Model No
Model name Reference
Spor Mountain Utah 39707 -113217 beryllium hydrothermal Epithermal beryllium deposit
na no model Harben and Kužvart (1996)
Ruby Mountain Quarry
New York 43736 -74112 garnet metamorphic Garnet in metamorphosed igneous rocks
na no model New York State Department of Environmental Conservation (undated)
Addie (Smoky Mtns)
North Carolina
35399 -83159 olivine metamorphic Dunite na no model Harben and Kužvart (1996)
Twin Sisters Mountain (Cascade Mtns)
Washington 48708 -121958 olivine metamorphic Dunite na no model Harben and Kužvart (1996)
Hunter Mountain California 36533 -117517 wollastonite metamorphic Wollastonite in metamorphosed sedimentary rocks
18g Skarn wollastonite
Bauer and others (1994)
Oak Hill Mine Site
New York 44304 -73580 wollastonite metamorphic Wollastonite in metamorphosed sedimentary rocks
18g Skarn wollastonite
New York State Department of Environmental Conservation (undated) Bauer and others (1994)
Willsboro Mine (Fox Knoll Mine)
New York 44346 -73432 wollastonite garnet
metamorphic Wollastonite in metamorphosed sedimentary rocks
18g Skarn wollastonite
New York State Department of Environmental Conservation (undated) Harben and Kužvart (1996)
145
Appendix 1 Major mineral deposits in the United States ndash continued
Deposit name State Latitude Longitude Commodities Class Deposit type Model No
Model name Reference
Spor Mountain Utah 39707 -113217 beryllium hydrothermal Epithermal beryllium deposit
na no model Harben and Kužvart (1996)
Meigs - Attapulgus - Quincy district
Georgia Florida
30667 -84417 attapulgite (palygorskite fullers earth)
sedimentary 34e Palygorskite Harben and Kužvart (1996) Hosterman and Patterson (1992)
Argenta Nevada 40633 -116733 barite sedimentary Marine exhalative deposit -barite
31b Bedded barite Orris (1985) Papke (1984)
Greystone Nevada 40281 -116901 barite sedimentary Marine exhalative deposit -barite
31b Bedded barite Orris (1985) Papke (1984)
Mountain Springs
Nevada 40315 -117041 barite sedimentary Marine exhalative deposit -barite
31b Bedded barite Orris (1985) Papke (1984)
Rossi Nevada 40599 -116719 barite sedimentary Marine exhalative deposit -barite
31b Bedded barite Orris (1985) Industrial Minerals (1992)
Snoose Creek Nevada 41502 -115039 barite sedimentary Marine exhalative deposit -barite
31b Bedded barite Harben and Kužvart (1996)
Stormy Creek Nevada 41523 -115198 barite sedimentary Marine exhalative deposit -barite
31b Bedded barite Harben and Kužvart (1996)
Basalt Nevada 38011 -118219 diatomite sedimentary Lacustrine biogenic deposit - diatomite
31s Lacustrine diatomite
Taylor (2004)
Burney California 41033 -121683 diatomite sedimentary Lacustrine biogenic deposit - diatomite
31s Lacustrine diatomite
Taylor (2004)
Fernley Nevada 39600 -119250 diatomite sedimentary Lacustrine biogenic deposit - diatomite
31s Lacustrine diatomite
Taylor (2004)
Lovelock Nevada 40267 -118797 diatomite sedimentary Lacustrine biogenic deposit - diatomite
31s Lacustrine diatomite
Taylor (2004)
Vale Oregon diatomite sedimentary Lacustrine biogenic deposit - diatomite
31s Lacustrine diatomite
Taylor (2004)
Lompoc California 34582 -120345 diatomite sedimentary Marine biogenic deposit - diatomite
na no model Taylor (2004)
146
Appendix 1 Major mineral deposits in the United States ndash continued
Deposit name State Latitude Longitude Commodities Class Deposit type Model No
Model name Reference
Spor Mountain Utah 39707 -113217 beryllium hydrothermal Epithermal beryllium deposit
na no model Harben and Kužvart (1996)
Black River Falls Wisconsin 44293 -90725 iron sedimentary Banded iron formation
34a Superior Fe Cannon and others (1997)
Gogebic Range - Eureka - Asteroid Mine
Michigan 46476 -89984 iron sedimentary Banded iron formation
34a Superior Fe Cannon and others (1997)
Gogebic Range - Plymouth Mine
Michigan 46470 -89957 iron sedimentary Banded iron formation
34a Superior Fe Cannon and others (1997)
Gogebic Range - Sunday Lake Group Mines
Michigan 46483 -89920 iron sedimentary Banded iron formation
34a Superior Fe Cannon and others (1997)
Gogebic Range - Wakefield Mine
Michigan 46469 -89951 iron sedimentary Banded iron formation
34a Superior Fe Cannon and others (1997)
Gogebic Range - West Gogebic Taconite Deposit
Wisconsin 46297 -90653 iron sedimentary Banded iron formation
34a Superior Fe Cannon and others (1997)
Marquette Range - Empire Mine
Michigan 46461 -87597 iron sedimentary Banded iron formation
34a Superior Fe Cannon and others (1997)
Marquette Range - Tilden Mine
Michigan 46447 -87642 iron sedimentary Banded iron formation
34a Superior Fe Cannon and others (1997)
Menominee Range - Buck Mine
Michigan 46059 -88618 iron sedimentary Banded iron formation
34a Superior Fe Cannon and others (1997)
Menominee Range - Cannon Mine
Michigan 46077 -88615 iron sedimentary Banded iron formation
34a Superior Fe Cannon and others (1997)
Menominee Range - Groveland Mine
Michigan 45993 -87981 iron sedimentary Banded iron formation
34a Superior Fe Cannon and others (1997)
Menominee Range - Hiawatha Mine 1
Michigan 46075 -88645 iron sedimentary Banded iron formation
34a Superior Fe Cannon and others (1997)
147
Appendix 1 Major mineral deposits in the United States ndash continued
Deposit name State Latitude Longitude Commodities Class Deposit type Model No
Model name Reference
Spor Mountain Utah 39707 -113217 beryllium hydrothermal Epithermal beryllium deposit
na no model Harben and Kužvart (1996)
Menominee Range - Homer Mine
Michigan 46116 -88657 iron sedimentary Banded iron formation
34a Superior Fe Cannon and others (1997)
Menominee Range - Iron River - Sherwood Mine
Michigan 46112 -88641 iron sedimentary Banded iron formation
34a Superior Fe Cannon and others (1997)
Menominee Range - Wauseca - Aronson Mine (Konwinski)
Michigan 46111 -88647 iron sedimentary Banded iron formation
34a Superior Fe Cannon and others (1997)
Mesabi Range - Gross - Nelson Mine
Minnesota 47478 -92564 iron sedimentary Banded iron formation
34a Superior Fe Cannon and others (1997)
Mesabi Range - Hibbing Taconite
Minnesota 47460 -92958 iron sedimentary Banded iron formation
34a Superior Fe Cannon and others (1997)
Mesabi Range - Mckinley Mine
Minnesota 47522 -92400 iron sedimentary Banded iron formation
34a Superior Fe Cannon and others (1997)
Mesabi Range - Minntac Mine
Minnesota 47545 -92654 iron sedimentary Banded iron formation
34a Superior Fe Cannon and others (1997)
Mesabi Range - Minorca Mine
Minnesota 47543 -92519 iron sedimentary Banded iron formation
34a Superior Fe Cannon and others (1997)
Mesabi Range - National Steel Pellet Plant Mine
Minnesota 47423 -93069 iron sedimentary Banded iron formation
34a Superior Fe Cannon and others (1997)
Mesabi Range - Peter Mitchell Mine
Minnesota 47666 -91917 iron sedimentary Banded iron formation
34a Superior Fe Cannon and others (1997)
Mesabi Range - Plummer Mine
Minnesota 47321 -93396 iron sedimentary Banded iron formation
34a Superior Fe Cannon and others (1997)
Mesabi Range - Rana Mine
Minnesota 47520 -92744 iron sedimentary Banded iron formation
34a Superior Fe Cannon and others (1997)
148
Appendix 1 Major mineral deposits in the United States ndash continued
Deposit name State Latitude Longitude Commodities Class Deposit type Model No
Model name Reference
Spor Mountain Utah 39707 -113217 beryllium hydrothermal Epithermal beryllium deposit
na no model Harben and Kužvart (1996)
Mesabi Range - Rouchleau Mine
Minnesota 47511 -92523 iron sedimentary Banded iron formation
34a Superior Fe Cannon and others (1997)
Mesabi Range - Sherman Mine
Minnesota 47483 -92831 iron sedimentary Banded iron formation
34a Superior Fe Cannon and others (1997)
Mesabi Range - Thunderbird Mine
Minnesota 47482 -92548 iron sedimentary Banded iron formation
34a Superior Fe Cannon and others (1997)
Mesabi Range - Whitney Mine
Minnesota 47448 -92910 iron sedimentary Banded iron formation
34a Superior Fe Cannon and others (1997)
Mesabi Range - Wyoming Mine
Minnesota 47531 -92507 iron sedimentary Banded iron formation
34a Superior Fe Cannon and others (1997)
Atlantic coastal plain phosphate province
Florida 27888 -82036 phosphate rock
sedimentary Marine biogenic-chemical sediment - phosphate rock
34d Phosphate warm current type
Van Kauwenbergh and others (1990)
Atlantic coastal plain phosphate province Blake PlateauCharleston Bump
South Carolina
31500 -79000 phosphate rock
sedimentary Marine biogenic-chemical sediment - phosphate rock
34d Phosphate warm current type
Riggs (1989)
Atlantic coastal plain phosphate province Charleston - Beaufort District
South Carolina
32750 -80000 phosphate rock
sedimentary Marine biogenic-chemical sediment - phosphate rock
34d Phosphate warm current type
British Sulphur Corporation (1964)
Atlantic coastal plain phosphate province East Florida phosphate district
Florida 27800 -80781 phosphate rock
sedimentary Marine biogenic-chemical sediment - phosphate rock
34d Phosphate warm current type
149
Appendix 1 Major mineral deposits in the United States ndash continued
Deposit name State Latitude Longitude Commodities Class Deposit type Model No
Model name Reference
Spor Mountain Utah 39707 -113217 beryllium hydrothermal Epithermal beryllium deposit
na no model Harben and Kužvart (1996)
Atlantic coastal plain phosphate province Gardinier Mine (Cargill Mine)
Florida 27667 -81763 phosphate rock
sedimentary Marine biogenic-chemical sediment - phosphate rock
34d Phosphate warm current type
Van Kauwenbergh and others (1990)
Atlantic coastal plain phosphate province Hopewell
Florida 27925 -82106 phosphate rock
sedimentary Marine biogenic-chemical sediment - phosphate rock
34d Phosphate warm current type
Orris and Chernoff (2002) Chernoff and Orris (2002)
Atlantic coastal plain phosphate province Land Pebble district Fort Green
Florida 27668 -82007 phosphate rock
sedimentary Marine biogenic-chemical sediment - phosphate rock
34d Phosphate warm current type
Van Kauwenbergh and others (1990)
Atlantic coastal plain phosphate province Land Pebble district Fort Meade Mine (Mobil)
Florida 27766 -81807 phosphate rock
sedimentary Marine biogenic-chemical sediment - phosphate rock
34d Phosphate warm current type
Van Kauwenbergh and others (1990)
Atlantic coastal plain phosphate province Land Pebble district Four Corners
Florida 27664 -82091 phosphate rock
sedimentary Marine biogenic-chemical sediment - phosphate rock
34d Phosphate warm current type
Van Kauwenbergh and others (1990)
Atlantic coastal plain phosphate province Land Pebble district Haynsworth Mine
Florida 27758 -82014 phosphate rock
sedimentary Marine biogenic-chemical sediment - phosphate rock
34d Phosphate warm current type
Van Kauwenbergh and others (1990)
150
Appendix 1 Major mineral deposits in the United States ndash continued
Deposit name State Latitude Longitude Commodities Class Deposit type Model No
Model name Reference
Spor Mountain Utah 39707 -113217 beryllium hydrothermal Epithermal beryllium deposit
na no model Harben and Kužvart (1996)
Atlantic coastal plain phosphate province Land Pebble district Hookers Prairie
Florida 27781 -81939 phosphate rock
sedimentary Marine biogenic-chemical sediment - phosphate rock
34d Phosphate warm current type
Van Kauwenbergh and others (1990)
Atlantic coastal plain phosphate province Land Pebble district Payne Creek
Florida 27690 -81941 phosphate rock
sedimentary Marine biogenic-chemical sediment - phosphate rock
34d Phosphate warm current type
Jasinski (1998)
Atlantic coastal plain phosphate province Land Pebble district Rockland
Florida 27754 -81867 phosphate rock
sedimentary Marine biogenic-chemical sediment - phosphate rock
34d Phosphate warm current type
Van Kauwenbergh and others (1990)
Atlantic coastal plain phosphate province Land Pebble district Saddle Creek
Florida 28033 -81834 phosphate rock
sedimentary Marine biogenic-chemical sediment - phosphate rock
34d Phosphate warm current type
Van Kauwenbergh and others (1990)
Atlantic coastal plain phosphate province Land Pebble district Silver City
Florida 27800 -81903 phosphate rock
sedimentary Marine biogenic-chemical sediment - phosphate rock
34d Phosphate warm current type
British Sulphur Corporation (1987)
Atlantic coastal plain phosphate province Land Pebble district South Fort Meade
Florida 27667 -81763 phosphate rock
sedimentary Marine biogenic-chemical sediment - phosphate rock
34d Phosphate warm current type
Griffiths (1995)
151
Appendix 1 Major mineral deposits in the United States ndash continued
Deposit name State Latitude Longitude Commodities Class Deposit type Model No
Model name Reference
Spor Mountain Utah 39707 -113217 beryllium hydrothermal Epithermal beryllium deposit
na no model Harben and Kužvart (1996)
Atlantic coastal plain phosphate province Noranda
Florida phosphate rock
sedimentary Marine biogenic-chemical sediment - phosphate rock
34d Phosphate warm current type
Van Kauwenbergh and McClellan (1990)
Atlantic coastal plain phosphate province North Carolina district Lee Creek Mine
North Carolina
35384 -76794 phosphate rock
sedimentary Marine biogenic-chemical sediment - phosphate rock
34d Phosphate warm current type
Van Kauwenbergh and McClellan (1990)
Atlantic coastal plain phosphate province North Carolina district North Carolina Phosphate Corp
North Carolina
35333 -76771 phosphate rock
sedimentary Marine biogenic-chemical sediment - phosphate rock
34d Phosphate warm current type
Riggs (1989)
Atlantic coastal plain phosphate province North Florida - South Georgia district Swift Creek Mine
Florida Georgia
30452 -82857 phosphate rock
sedimentary Marine biogenic-chemical sediment - phosphate rock
34d Phosphate warm current type
Van Kauwenbergh and others (1990)
Atlantic coastal plain phosphate province Ona
Florida 27520 -81980 phosphate rock
sedimentary Marine biogenic-chemical sediment - phosphate rock
34d Phosphate warm current type
Jasinski (2000)
Atlantic coastal plain phosphate province Onslow EmbaymentFrying Pan Phosphate District
North Carolina
33750 -77500 phosphate rock
sedimentary Marine biogenic-chemical sediment - phosphate rock
34d Phosphate warm current type
Riggs (1989)
152
Appendix 1 Major mineral deposits in the United States ndash continued
Deposit name State Latitude Longitude Commodities Class Deposit type Model No
Model name Reference
Spor Mountain Utah 39707 -113217 beryllium hydrothermal Epithermal beryllium deposit
na no model Harben and Kužvart (1996)
Atlantic coastal plain phosphate province Onslow EmbaymentNortheast Onslow Bay District
North Carolina
34500 -76750 phosphate rock
sedimentary Marine biogenic-chemical sediment - phosphate rock
34d Phosphate warm current type
Riggs (1989)
Atlantic coastal plain phosphate province Pine Level
Florida 27250 -81991 phosphate rock
sedimentary Marine biogenic-chemical sediment - phosphate rock
34d Phosphate warm current type
Jasinski (2000)
Atlantic coastal plain phosphate province Raine
Florida 27725 -81811 phosphate rock
sedimentary Marine biogenic-chemical sediment - phosphate rock
34d Phosphate warm current type
Van Kauwenbergh and others (1990)
Atlantic coastal plain phosphate province Savannah District
Georgia 32050 -81083 phosphate rock
sedimentary Marine biogenic-chemical sediment - phosphate rock
34d Phosphate warm current type
British Sulphur Corporation (1964)
Atlantic coastal plain phosphate province South Florida phosphate district
Florida 27519 -82208 phosphate rock
sedimentary Marine biogenic-chemical sediment - phosphate rock
34d Phosphate warm current type
McFaul and others (2000)
Atlantic coastal plain phosphate province Suwanee River Mine
Florida Georgia
30437 -82777 phosphate rock
sedimentary Marine biogenic-chemical sediment - phosphate rock
34d Phosphate warm current type
Van Kauwenbergh and others (1990)
Aurora District North Carolina
35500 -76500 phosphate rock
sedimentary Marine biogenic-chemical sediment - phosphate rock
34d Phosphate warm current type
Griffiths (1995)
153
Appendix 1 Major mineral deposits in the United States ndash continued
Deposit name State Latitude Longitude Commodities Class Deposit type Model No
Model name Reference
Spor Mountain Utah 39707 -113217 beryllium hydrothermal Epithermal beryllium deposit
na no model Harben and Kužvart (1996)
Lisburne Group Alaska 68633 -155750 phosphate rock
sedimentary Marine biogenic-chemical sediment - phosphate rock
Cathcart and others (1984)
Western Phosphate Field Uinta Mountains Park City Formation Vernal
Utah 40607 -109491 phosphate rock
sedimentary Marine biogenic-chemical sediment - phosphate rock
34c Phosphate upwelling type
Jasinski (2000)
Atlantic coastal plain phosphate province Bronson (East Ocala Hard Rock) District
Florida 29333 -82500 phosphate rock
sedimentary Marine biogenic-chemical sediment - phosphate rock residual enrichment
34d Phosphate warm current type
British Sulphur Corporation (1964)
Atlantic coastal plain phosphate province Ridgeland Basin - Beaufort District
South Carolina
32583 -80917 phosphate rock
sedimentary Marine biogenic-chemical sediment - phosphate rock residual enrichment
34d Phosphate warm current type
British Sulphur Corporation (1964)
Atlantic coastal plain phosphate province Steinhatchee (N Ocala Hard Rock) District
Florida 29900 -83317 phosphate rock
sedimentary Marine biogenic-chemical sediment - phosphate rock residual enrichment
34d Phosphate warm current type
Foose (1993)
Western Phosphate Field Phosphoria Formation Conda
Idaho 42728 -111527 phosphate rock
sedimentary Marine biogenic-chemical sediment - phosphate rock residual enrichment
34c Phosphate upwelling type
McFaul and others (2000)
154
Appendix 1 Major mineral deposits in the United States ndash continued
Deposit name State Latitude Longitude Commodities Class Deposit type Model No
Model name Reference
Spor Mountain Utah 39707 -113217 beryllium hydrothermal Epithermal beryllium deposit
na no model Harben and Kužvart (1996)
Western Phosphate Field Phosphoria Formation Deseret Basin - - Laketown
Utah 41827 -111290 phosphate rock
sedimentary Marine biogenic-chemical sediment - phosphate rock residual enrichment
34c Phosphate upwelling type
McFaul and others (2000)
Western Phosphate Field Phosphoria Formation Enoch Valley
Idaho 42881 -111407 phosphate rock
sedimentary Marine biogenic-chemical sediment - phosphate rock residual enrichment
34c Phosphate upwelling type
Jasinski (1998) Jasinski (2000)
Western Phosphate Field Phosphoria Formation Montana phosphate district
Montana 45041 -111957 phosphate rock
sedimentary Marine biogenic-chemical sediment - phosphate rock residual enrichment
34c Phosphate upwelling type
McFaul and others (2000)
Western Phosphate Field Phosphoria Formation Smoky Canyon
Idaho 42670 -111130 phosphate rock
sedimentary Marine biogenic-chemical sediment - phosphate rock residual enrichment
34c Phosphate upwelling type
Jasinski (1998)
Amargosa Valley
Nevada 36450 -116433 sepiolite bentonite saponite hectorite
sedimentary Altered volcanic ash beds
na no model Harben and Kužvart (1996)
Hardin district Wyoming 44580 -108170 sodium-bentonite
sedimentary Altered volcanic ash beds
28e1 Sedimentary bentonite sodium
Harben and Kužvart (1996)
Northern Black Hills district
Wyoming South Dakota
44580 -108170 sodium-bentonite
sedimentary Altered volcanic ash beds
28e1 Sedimentary bentonite sodium
Harben and Kužvart (1996)
155
Appendix 1 Major mineral deposits in the United States ndash continued
Deposit name State Latitude Longitude Commodities Class Deposit type Model No
Model name Reference
Spor Mountain Utah 39707 -113217 beryllium hydrothermal Epithermal beryllium deposit
na no model Harben and Kužvart (1996)
Sublette Range (combined)
Wyoming 42200 -110983 vanadium phosphate rock
sedimentary Marine biogenic-chemical sediment - banasium-rich phosphate rock
British Sulphur Corporation (1987)
Ash Meadows California 35950 -116250 zeolite sedimentary Lacustrine deposit - zeolite
25o2 Sedimentary zeolites Zeolites in tuffs of saline alkaline-lake deposits
Holmes (1994)
Bear River Idaho 42424 -111381 zeolite sedimentary Lacustrine deposit - zeolite
25o2 Sedimentary zeolites Zeolites in tuffs of saline alkaline-lake deposits
Industrial Minerals (2004b)
Bowie Arizona 32450 -109367 zeolite sedimentary Lacustrine deposit - zeolite
25o2 Sedimentary zeolites Zeolites in tuffs of saline alkaline-lake deposits
Eyde and Eyde 1987
Harney Lake Oregon 43228 -118943 zeolite sedimentary Lacustrine deposit - zeolite
25o2 Sedimentary zeolites Zeolites in tuffs of saline alkaline-lake deposits
Holmes (1994)
Atlas Utah 38337 -113141 halloysite (clay mineral with tube-like crystals)
sedimentary and residual
Sedimentary kaolin (halloysite) deposit
na no model Industrial Minerals (2004a)
156
Appendix 1 Major mineral deposits in the United States ndash continued
Deposit name State Latitude Longitude Commodities Class Deposit type Model No
Model name Reference
Spor Mountain Utah 39707 -113217 beryllium hydrothermal Epithermal beryllium deposit
na no model Harben and Kužvart (1996)
Aiken district South Carolina
33642 -81628 kaolin sedimentary and residual
Laterites developed on sedimentary deposits sedimentary deposits derived from laterites
31k Sedimentary kaolin
Harben and Kužvart (1996)
Andersonville district
Georgia 32200 -84133 kaolin sedimentary and residual
Laterites developed on sedimentary deposits sedimentary deposits derived from laterites
31k Sedimentary kaolin
Harben and Kužvart (1996)
Augusta district Georgia 33467 -81967 kaolin sedimentary and residual
Laterites developed on sedimentary deposits sedimentary deposits derived from laterites
31k Sedimentary kaolin
Harben and Kužvart (1996)
Macon district Georgia 32833 -83633 kaolin sedimentary and residual
Laterites developed on sedimentary deposits sedimentary deposits derived from laterites
31k Sedimentary kaolin
Harben and Kužvart (1996)
Wrens district Georgia 33182 -82675 kaolin sedimentary and residual
Laterites developed on sedimentary deposits sedimentary deposits derived from laterites
31k Sedimentary kaolin
Harben and Kužvart (1996)
157
Appendix 1 Major mineral deposits in the United States ndash continued
Deposit name State Latitude Longitude Commodities Class Deposit type Model No
Model name Reference
Spor Mountain Utah 39707 -113217 beryllium hydrothermal Epithermal beryllium deposit
na no model Harben and Kužvart (1996)
Eufaula district Alabama 31754 -85272 kaolin bauxite
sedimentary and residual
Laterites developed on sedimentary deposits sedimentary deposits derived from laterites
31k Sedimentary kaolin
Harben and Kužvart (1996)
Irwinton district Georgia 32812 -83174 kaolin bauxite
sedimentary and residual
Laterites developed on sedimentary deposits sedimentary deposits derived from laterites
31k Sedimentary kaolin
Harben and Kužvart (1996)
Brown - rock phosphate district
Tennessee 35659 -87185 phosphate rock
sedimentary and residual
Marine biogenic-chemical sediment - phosphate rock residual enrichment
Krauss and others (1984)
Anadarko Basin - Weatherford - Clinton district
Oklahoma 35540 -98930 anhydrite sedimentary brines and evaporites
Marine evaporite deposit - anhydrite
Ham and Curtis (1958)
Death Valley California 36342 -116684 boron sedimentary brines and evaporites
Lacustrine evaporite deposit - borate
35b3 Lacustrine borates
Harben and Bates (1990) Evans and others (1976)
Fort Cady California 34754 -116402 boron sedimentary brines and evaporites
Lacustrine evaporite deposit - borate
35b3 Lacustrine borates
ODriscoll (1990)
Gerstley I II California 36018 -116232 boron sedimentary brines and evaporites
Lacustrine evaporite deposit - borate
35b3 Lacustrine borates
Evans and others (1976)
Kramer (Boron) California 35041 -117687 boron sedimentary brines and evaporites
Lacustrine evaporite deposit - borate
35b3 Lacustrine borates
Roskill Information Services (1993)
158
Appendix 1 Major mineral deposits in the United States ndash continued
Deposit name State Latitude Longitude Commodities Class Deposit type Model No
Model name Reference
Spor Mountain Utah 39707 -113217 beryllium hydrothermal Epithermal beryllium deposit
na no model Harben and Kužvart (1996)
Rho (Kramer Junction)
California 34767 -117547 boron sedimentary brines and evaporites
Lacustrine evaporite deposit - borate
35b3 Lacustrine borates
Evans and others (1976)
Smackover Formation
Arkansas 33220 -92660 bromine sedimentary brines and evaporites
Bromine in connate water (brine)
35a14 Naturally occurring bromine brines
Harben and Kužvart (1996)
Apex Nevada 36221 -114880 gypsum sedimentary brines and evaporites
Lacustrine evaporite deposit - gypsum
35b4 Lacustrine gypsum
Papke (1987)
Anadarko Basin - Blaine Formation
Oklahoma 35925 -98364 gypsum sedimentary brines and evaporites
Marine evaporite deposit - gypsum
35a5 Bedded gypsum marine evaporite gypsum
Harben and Bates (1984)
Anadarko Basin - Cloud Chief Formation
Oklahoma 34832 -98255 gypsum sedimentary brines and evaporites
Marine evaporite deposit - gypsum
35a5 Bedded gypsum marine evaporite gypsum
Harben and Bates (1984)
Fort Dodge area Iowa 42493 -94156 gypsum sedimentary brines and evaporites
Marine evaporite deposit - gypsum
35a5 Bedded gypsum marine evaporite gypsum
Harben and Kužvart (1996)
Michigan Basin - Tawas
Michigan 44263 -83675 gypsum sedimentary brines and evaporites
Marine evaporite deposit - gypsum
35a5 Bedded gypsum marine evaporite gypsum
Roskill Information Services (1992)
159
Appendix 1 Major mineral deposits in the United States ndash continued
Deposit name State Latitude Longitude Commodities Class Deposit type Model No
Model name Reference
Spor Mountain Utah 39707 -113217 beryllium hydrothermal Epithermal beryllium deposit
na no model Harben and Kužvart (1996)
Plaster City California 33033 -116088 gypsum sedimentary brines and evaporites
Marine evaporite deposit - gypsum
35a5 Bedded gypsum marine evaporite gypsum
Harben and Kužvart (1996)
White Mesa New Mexico 35520 -106797 gypsum sedimentary brines and evaporites
Marine evaporite deposit - gypsum
35a5 Bedded gypsum marine evaporite gypsum
Austin and others (1982)
Appalachian Basin
New York Pennsylvania Ohio West Virginia
41233 -79533 halite (salt) sedimentary brines and evaporites
Marine evaporite deposit - salt
35a3 Bedded salt marine evaporite salt
Harben and Kužvart (1996)
Appalachian Basin - Retsoff
New York 42778 -77858 halite (salt) sedimentary brines and evaporites
Marine evaporite deposit - salt
35a3 Bedded salt marine evaporite salt
Roskill Information Services (1983) Harben and Kužvart (1996)
Mississippi Basin
Mississippi 31460 -89210 halite (salt) sedimentary brines and evaporites
Marine evaporite deposit - salt dome
35a4 Salt domes diapiric salt structures
Harben and Kužvart (1996)
Texas - Louisiana Coastal Basin - Avery Island
Louisiana 29893 -91909 halite (salt) sedimentary brines and evaporites
Marine evaporite deposit - salt dome
35a4 Salt domes diapiric salt structures
Roskill Information Services (1983)
Texas - Louisiana Coastal Basin - Belle Isle (Patterson)
Louisiana 29709 -91351 halite (salt) sedimentary brines and evaporites
Marine evaporite deposit - salt dome
35a4 Salt domes diapiric salt structures
Roskill Information Services (1983)
160
Appendix 1 Major mineral deposits in the United States ndash continued
Deposit name State Latitude Longitude Commodities Class Deposit type Model No
Model name Reference
Spor Mountain Utah 39707 -113217 beryllium hydrothermal Epithermal beryllium deposit
na no model Harben and Kužvart (1996)
Texas - Louisiana Coastal Basin - Jefferson Island
Louisiana 29971 -91969 halite (salt) sedimentary brines and evaporites
Marine evaporite deposit - salt dome
35a4 Salt domes diapiric salt structures
Roskill Information Services (1983)
Texas - Louisiana Coastal Basin
Louisiana Texas
29600 -91817 halite (salt) gypsum
sedimentary brines and evaporites
Marine evaporite deposit - salt dome
35a4 Salt domes diapiric salt structures
Harben and Kužvart (1996)
Michigan Basin - Detroit River Group
Michigan 44241 -86180 halite (salt) gypsum magnesia bromine
sedimentary brines and evaporites
Marine evaporite deposit - salt
35a3 Bedded salt marine evaporite salt
Harben and Kužvart (1996)
Michigan Basin Michigan Indiana
43617 -84233 halite (salt) gypsum potash bromine iodine magnesia
sedimentary brines and evaporites
Marine evaporite deposit and brine
35a3 Bedded salt marine evaporite salt
Hite (1967) Harben and Kužvart (1996)
Michigan Basin - Salina
Michigan halite (salt) potash
sedimentary brines and evaporites
Marine evaporite deposit - salt
35a3 Bedded salt marine evaporite salt
British Sulphur Corporation (1979)
Supai Salt Basin Arizona 33537 -112338 halite (salt) potash
sedimentary brines and evaporites
Marine evaporite deposit - salt
35a3 Bedded salt marine evaporite salt
Garrett (1996)
South Texas Basin - Palangana Salt Dome
Texas 27648 -98394 halite (salt) potash
sedimentary brines and evaporites
Marine evaporite deposit - salt dome
35a4 Salt domes diapiric salt structures
Williams-Stroud and others (1994)
Anadarko Basin - Morrowan Formation
Oklahoma 36433 -99383 iodine sedimentary brines and evaporites
Iodine in connate water (brine)
35a13 Naturally occurring iodine brines
Harben and Kužvart (1996) Roskill Information Services (1994)
161
Appendix 1 Major mineral deposits in the United States ndash continued
Deposit name State Latitude Longitude Commodities Class Deposit type Model No
Model name Reference
Spor Mountain Utah 39707 -113217 beryllium hydrothermal Epithermal beryllium deposit
na no model Harben and Kužvart (1996)
Silver Peak (Clayton Valley)
Nevada 37750 -117633 lithium potash
sedimentary brines and evaporites
Playa brine - lithium and potash
35b13
Lithium-rich Playa brines
Garrett (1996)
Searles Lake California 35777 -118400 lithium potash sodium carbonate boron
sedimentary brines and evaporites
Lacustrine evaporite deposit
35b13
Li-rich playa brine
British Sulphur Corporation (1985) Russell (1988) Roskill Information Services (1989)
Michigan Basin - Manistee Operation
Michigan 44243 -86308 magnesia sedimentary brines and evaporites
Magesia from brine associated with marine evaporite deposit
na no model Harben and Kužvart (1996)
Cane Creek (Moab Salt Operation)
Utah 38523 -109658 potash sedimentary brines and evaporites
Marine evaporite deposit - potash
35a2 Potash-bearing bedded salt
Garrett (1996)
Carlsbad Potash District
New Mexico 32490 -103938 potash sedimentary brines and evaporites
Marine evaporite deposit - potash
35a2 Potash-bearing bedded salt
Garrett (1996)
Carlsbad Potash District - Eddy County Mine
New Mexico 32542 -103878 potash sedimentary brines and evaporites
Marine evaporite deposit - potash
35a2 Potash-bearing bedded salt
British Sulphur Corporation (1985)
Carlsbad Potash District - Hobbs
New Mexico 32505 -103780 potash sedimentary brines and evaporites
Marine evaporite deposit - potash
35a2 Potash-bearing bedded salt
Roskill Information Services (1989)
Carlsbad Potash District - IMC Mine (T22S R29E)
New Mexico 32413 -103937 potash sedimentary brines and evaporites
Marine evaporite deposit - potash
35a2 Potash-bearing bedded salt
Garrett (1996)
Carlsbad Potash District - IMC Mine (T23S R30E)
New Mexico potash sedimentary brines and evaporites
Marine evaporite deposit - potash
35a2 Potash-bearing bedded salt
Garrett (1996)
162
Appendix 1 Major mineral deposits in the United States ndash continued
Deposit name State Latitude Longitude Commodities Class Deposit type Model No
Model name Reference
Spor Mountain Utah 39707 -113217 beryllium hydrothermal Epithermal beryllium deposit
na no model Harben and Kužvart (1996)
Carlsbad Potash District - Lea Mine
New Mexico 32571 -103552 potash sedimentary brines and evaporites
Marine evaporite deposit - potash
35a2 Potash-bearing bedded salt
Garrett (1996)
Carlsbad Potash District - MCC
New Mexico 32490 -103938 potash sedimentary brines and evaporites
Marine evaporite deposit - potash
35a2 Potash-bearing bedded salt
Roskill Information Services (1989)
Carlsbad Potash District - Nash Draw
New Mexico 32337 -103832 potash sedimentary brines and evaporites
Marine evaporite deposit - potash
35a2 Potash-bearing bedded salt
Garrett (1996)
Carlsbad Potash District - New Mexico Potash
New Mexico potash sedimentary brines and evaporites
Marine evaporite deposit - potash
35a2 Potash-bearing bedded salt
Garrett (1996)
Carlsbad Potash District - Western Ag - Minerals (T20SR30E)
New Mexico potash sedimentary brines and evaporites
Marine evaporite deposit - potash
35a2 Potash-bearing bedded salt
Garrett (1996)
Carlsbad Potash District - Western Ag - Minerals (T22SR29E)
New Mexico potash sedimentary brines and evaporites
Marine evaporite deposit - potash
35a2 Potash-bearing bedded salt
Garrett (1996)
Michigan Basin - Hershey
Michigan 43825 -85425 potash sedimentary brines and evaporites
Marine evaporite deposit - potash
35a2 Potash-bearing bedded salt
Roskill Information Services (1989)
Paradox Basin Utah Colorado Arizona
37960 -109670 potash sedimentary brines and evaporites
Marine evaporite deposit - potash
35a2 Potash-bearing bedded salt
Hite (1967)
Salt Valley Anticline
Utah 38922 -109836 potash sedimentary brines and evaporites
Marine evaporite deposit - potash
35a2 Potash-bearing bedded salt
Hite (1964)
Williston Basin Montana North Dakota
47250 -101750 potash sedimentary brines and evaporites
Marine evaporite deposit - potash
35a2 Potash-bearing bedded salt
British Sulphur Corporation (1979)
163
Appendix 1 Major mineral deposits in the United States ndash continued
Deposit name State Latitude Longitude Commodities Class Deposit type Model No
Model name Reference
Spor Mountain Utah 39707 -113217 beryllium hydrothermal Epithermal beryllium deposit
na no model Harben and Kužvart (1996)
Michigan Basin - Midland Operation
Michigan 43600 -84232 potash bromine iodine magnesia
sedimentary brines and evaporites
Marine evaporite - potash-rich brine
35a2 Potash-bearing bedded salt
British Sulphur Corporation (1979)
Michigan Basin - Ludington Operation
Michigan 43939 -86433 potash bromine lithium magnesia
sedimentary brines and evaporites
Marine evaporite - potash-rich brine
35a2 Potash-bearing bedded salt
British Sulphur Corporation (1979)
Great Salt Lake Utah 40914 -112733 potash magnesia lithium sodiuum sulfate
sedimentary brines and evaporites
Lacustrine evaporite deposit
na no model Warren (1999)
Sevier Lake Utah 38813 -113201 potash sodium sulfate sodium chloride
sedimentary brines and evaporites
Playa brine na no model Garrett (1996)
Green River Formation
Wyoming 41528 -109368 sodium carbonate
sedimentary brines and evaporites
Lacustrine evaporite deposit - sodium carbonate
35b1 Sodium carbonate in bedded lacustrine evaporites Green River
Garrett (1992)
Green River Formation FMC Westvaco Mine 12
Wyoming 41622 -109814 sodium carbonate
sedimentary brines and evaporites
Lacustrine evaporite deposit - sodium carbonate
35b1 Sodium carbonate in bedded lacustrine evaporites Green River
USGS (1997)
164
Appendix 1 Major mineral deposits in the United States ndash continued
Deposit name State Latitude Longitude Commodities Class Deposit type Model No
Model name Reference
Spor Mountain Utah 39707 -113217 beryllium hydrothermal Epithermal beryllium deposit
na no model Harben and Kužvart (1996)
Green River Formation General Chemical Corp Allied Chemical
Wyoming 41599 -109740 sodium carbonate
sedimentary brines and evaporites
Lacustrine evaporite deposit - sodium carbonate
35b1 Sodium carbonate in bedded lacustrine evaporites Green River
USGS (1997)
Green River Formation OCI Chemical Corp Big Island
Wyoming 41718 -109692 sodium carbonate
sedimentary brines and evaporites
Lacustrine evaporite deposit - sodium carbonate
35b1 Sodium carbonate in bedded lacustrine evaporites Green River
USGS (1997)
Green River Formation Solvay Minerals Inc
Wyoming 41500 -109760 sodium carbonate
sedimentary brines and evaporites
Lacustrine evaporite deposit - sodium carbonate
35b1 Sodium carbonate in bedded lacustrine evaporites Green River
USGS (1997)
Green River Formation Texas Gulf Inc
Wyoming 41679 -109908 sodium carbonate
sedimentary brines and evaporites
Lacustrine evaporite deposit - sodium carbonate
35b1 Sodium carbonate in bedded lacustrine evaporites Green River
USGS (1997)
Piceance Creek Colorado 39957 -108360 sodium carbonate
sedimentary brines and evaporites
Lacustrine evaporite deposit - sodium carbonate
35b1 Sodium carbonate in bedded lacustrine evaporites Green River
Garrett (1992) Industrial Minerals (1999b)
165
Appendix 1 Major mineral deposits in the United States ndash continued
Deposit name State Latitude Longitude Commodities Class Deposit type Model No
Model name Reference
Spor Mountain Utah 39707 -113217 beryllium hydrothermal Epithermal beryllium deposit
na no model Harben and Kužvart (1996)
Uinta Basin Utah 40225 -109542 sodium carbonate
sedimentary brines and evaporites
Lacustrine evaporite deposit - sodium carbonate
35b1 Sodium carbonate in bedded lacustrine evaporites Green River
Garrett (1992)
Camp Verde Arizona 34545 -111874 sodium sulfate halite (salt) gypsum
sedimentary brines and evaporites
Lacustrine evaporite deposit
na no model Garrett (2001)
Texas - Louisiana Coastal Basin - Main Pass
Louisiana 29275 -88772 sulfur sedimentary brines and evaporites
Marine evaporite deposit - salt dome
35a7 Salt dome sulfur
Edwards and others (1992)
Alder Gulch Montana 45324 -112002 garnet surficial placer
Fluvial placer garnet deposit
na no model ODriscoll (1993)
Emerald Creek - Carpenter Creek Emerald Placers
Idaho 47072 -116326 garnet surficial placer
Fluvial placer garnet deposit
na no model Spanski (2004)
Columbia California 38061 -120319 gold surficial placer
Placer gold deposit 39a Placer Au-PGE
Long and others (1998)
Fairbanks Alaska 64917 -146500 gold surficial placer
Placer gold deposit 39a Placer Au-PGE
Long and others (1998)
Folsom California 38684 -121175 gold surficial placer
Placer gold deposit 39a Placer Au-PGE
Long and others (1998)
Greaterville Arizona 31763 -110753 gold surficial placer
Placer gold deposit 39a Placer Au-PGE
Long and others (1998)
Hammonton California 39204 -121415 gold surficial placer
Placer gold deposit 39a Placer Au-PGE
Long and others (1998)
Kougarok Alaska 65750 -164830 gold surficial placer
Placer gold deposit 39a Placer Au-PGE
Long and others (1998)
Manhatten Alluvial Fan
Nevada 38533 -117150 gold surficial placer
Placer gold deposit 39a Placer Au-PGE
Orris and Bliss (1985)
166
Appendix 1 Major mineral deposits in the United States ndash continued
Deposit name State Latitude Longitude Commodities Class Deposit type Model No
Model name Reference
Spor Mountain Utah 39707 -113217 beryllium hydrothermal Epithermal beryllium deposit
na no model Harben and Kužvart (1996)
Nome Alaska 64500 -165500 gold surficial placer
Placer gold deposit 39a Placer Au-PGE
Long and others (1998)
North Bloomfield
California 39394 -120915 gold surficial placer
Placer gold deposit 39a Placer Au-PGE
Long and others (1998)
Oregon Gulch Wyoming 42317 -108833 gold surficial placer
Placer gold deposit 39a Placer Au-PGE
Long and others (1998)
Pass Peak Formation
Wyoming 43988 -110292 gold surficial placer
Placer gold deposit 39a Placer Au-PGE
Long and others (1998)
Ruby Meadows Idaho 45233 -115881 rare-earth elements gold titanium
surficial placer
Fluvial placer deposit
na no model Industrial Minerals (1987)
Gold Fork - Little Valley
Idaho 44683 -115967 titanium zirconium garnet gold rare-earth elements
surficial placer
Fluvial placer deposit
na no model Jackson and Christiansen (1993)
Bear Valley Idaho 44350 -115400 titanium zirconium garnet niobium rare-earth elements
surficial placer
Fluvial placer deposit
na no model Jackson and Christiansen (1993)
Natchez Trace deposit
Tennessee 35833 -88200 titanium zirconium rare-earth elements
surficial placer
Ancient marine titanium placer deposit
39c Shoreline placer Ti
Towner (1992)
North Camden (Kerr - McGee deposit)
Tennessee 36117 -88183 titanium zirconium rare-earth elements
surficial placer
Ancient marine titanium placer deposit
39c Shoreline placer Ti
Towner (1992)
167
Appendix 1 Major mineral deposits in the United States ndash continued
Deposit name State Latitude Longitude Commodities Class Deposit type Model No
Model name Reference
Spor Mountain Utah 39707 -113217 beryllium hydrothermal Epithermal beryllium deposit
na no model Harben and Kužvart (1996)
Oak Grove Tennessee 36383 -88167 titanium zirconium rare-earth elements
surficial placer
Ancient marine titanium placer deposit
39c Shoreline placer Ti
Jackson and Christiansen (1993)
Old Hickory (Stony Creek)
Virginia 36917 -77567 titanium zirconium rare-earth elements
surficial placer
Ancient marine titanium placer deposit
39c Shoreline placer Ti
Pearson (1999)
Pearsol Creek Idaho 44517 -116083 titanium zirconium rare-earth elements
surficial placer
Fluvial placer deposit
na no model Jackson and Christiansen (1993)
San Gabriel Mountains - Soledad Canyon
California 34434 -118375 titanium zirconium rare-earth elements
surficial placer
Fluvial placer deposit
no model Roskill Information Services (1988)
Boulougne Florida 30734 -81984 titanium zirconium rare-earth elements
surficial placer
Marine titanium placer
39c Shoreline placer Ti
Neary and Highley (1984)
Cumberland Island
Georgia 30900 -81450 titanium zirconium rare-earth elements
surficial placer
Marine titanium placer
39c Shoreline placer Ti
Jackson and Christiansen (1993)
Green Cove Springs - Maxville
Florida 29867 -81717 titanium zirconium rare-earth elements
surficial placer
Marine titanium placer
39c Shoreline placer Ti
Jackson and Christiansen (1993)
Hilton Head Island
South Carolina
32200 -80733 titanium zirconium rare-earth elements
surficial placer
Marine titanium placer
39c Shoreline placer Ti
Jackson and Christiansen (1993)
168
x 1 Major mineral deposits in the United States ndash continued
169
Deposit name State Latitude Longitude Commodities Class Deposit type Model No
Model name Reference
Spor Mountain Utah 39707 -113217 beryllium hydrothermal Epithermal beryllium deposit
na
Appendi
no model Harben and Kužvart (1996)
Lulaton Georgia 31217 -81900 titanium zirconium rare-earth elements
surficial placer
Marine titanium placer
39c Shoreline placer Ti
Industrial Minerals (2003)
Trail Ridge Florida 30033 -82033 titanium zirconium rare-earth elements
surficial placer
Marine titanium placer
39c Shoreline placer Ti
Towner (1992)
Cartersville district
Georgia 34150 -84767 barite surficial residual
Residual na no model Harben and Kužvart (1996)
Washington County
Missouri 38250 -90833 barite surficial residual
Residual na no model Harben and Kužvart (1996)
Spruce Pine North Carolina
35933 -82133 feldspar mica kaolin niobium tantalum
surficial residual
Igneous residual 38h Residual kaolin
Harben and Kužvart (1996)
York Montana 46721 -111750 gold unclassified Unclassified Unclassified Long and others (1998)
Mike Nevada 40806 -116247 gold copper unclassified Unclassified Unclassified Long and others (1998)
Hahns Peak Colorado 40842 -106929 silver lead zinc
unclassified Unclassified Unclassified Long and others (1998)
Mountain Green Utah 41150 -111783 zeolite Holmes (1994) Rome Oregon 42867 -117700 zeolite No Agua Peaks (El Grande Tres Piedras)
New Mexico 36750 -105950 perlite Volcanic rock na no model Harben and Kužvart (1996)
Appendix 2 Selected criteria used to identify major mineral deposits listed in Table 2 of this report
Commodity Amount of contained metal (in metric tons)
Reference
Cobalt 10000 This study Copper 2000000 Giant deposit category Singer (1995) Gold 100 Giant deposit category Singer (1995) Iron ore 56142000
(metric tons iron) 75th percentile of iron for deposits in Singer and others (1993) or large deposit in Cannon and others (1997)
Lead 1000000 Giant deposit category Singer (1995) Molybdenum 300000 Giant deposit category Long (written comm) Nickel 1262300 This study Platinum-group elements
520 Medium-large deposit Laznicka (1999)
Silver 2400 Giant deposit category Singer (1995) Tin 200000 Giant camp Mutschler and others (1999) Tungsten 100000 Giant camp Mutschler and others (1999) Zinc 1700000 Giant deposit category Singer (1995)
171
Appendix 3 Resource-reserves definitions (USGS 2004) ResourcemdashA concentration of naturally occurring solid liquid or gaseous material in or on the Earthrsquos crust in such form and amount that economic extraction of a commodity from the concentration is currently or potentially feasible Identified ResourcesmdashResources whose location grade quality and quantity are known or estimated from specific geologic evidence Reserve BasemdashThat part of an identified resource that meets specified minimum physical and chemical criteria related to current mining and production practices including those for grade quality thickness and depth ReservesmdashThat part of the reserve base which could be economically extracted or produced at the time of determination The term reserves need not signify that extraction facilities are in place and operative
172

US Department of the Interior Gale A Norton Secretary
US Geological Survey P Patrick Leahy Acting Director
US Geological Survey Reston Virginia 2005
For product and ordering information World Wide Web httpwwwusgsgovpubprod Telephone 1-888-ASK-USGS
For more information on the USGSmdashthe Federal source for science about the Earth its natural and living resources natural hazards and the environment World Wide Web httpwwwusgsgov Telephone 1-888-ASK-USGS
Suggested citation Zientek ML and Orris GJ 2005 Geology and nonfuel mineral deposits of the United States US Geological Survey Open-File Report 2005-1294A 172 p [URL httppubsusgsgovof20051294]
Any use of trade product or firm names is for descriptive purposes only and does not imply endorsement by the US Government
Although this report is in the public domain permission must be secured from the individual copyright owners to reproduce any copyrighted material contained within this report
ii
Contents Contents iii Abstract 1 Introduction 1 Some basic terms and concepts 3 Overview of geologic and tectonic history 6 Principal commodities and deposit types 8
Metals 10 Beryllium 10 Cobalt 11 Copper 13 Gold 17 Iron ore 21 Lead and zinc 23 Molybdenum 26 Platinum-group elements and nickel 28 Rare-earth elements 31 Silver 33 Titanium 38
Industrial materials 40 Barite 40 Bentonite 42 Boron 44 Bromine 46 Diatomite 47 Garnet 48 Gypsum 49 Kaolin 50 Phosphate rock 51 Potash 53 Salt (halite) 54 Soda ash (sodium carbonate) 56 Talc 58
Regional exploration history and significant recent discoveries 59 Potential for undiscovered mineral resources 62 References cited 65 Figures 79 Appendix 1 Major mineral deposits in the United States 125 Appendix 2 Selected criteria used to identify major mineral deposits listed in Table 2 of this report 171 Appendix 3 Resource-reserves definitions (USGS 2004) 172
iii
Tables Table 1 Value of selected mineral commodities produced in the United States 2 Table 2 Beryllium - proportion of world mine production for the United States 10 Table 3 Cobalt - proportion of world mine production reserves and reserve base for the
United States 11 Table 4 Copper - proportion of world mine production reserves reserve base and
resource base for the United States 13 Table 5 Gold - proportion of world mine production reserves and reserve base for the
United States 17 Table 6 Iron ore - proportion of world mine production reserves and reserve base for the
United States 21 Table 7 Lead - proportion of world mine production reserves and reserve base for the
United States 23 Table 8 Zinc - proportion of world mine production reserves and reserve base for the
United States 23 Table 9 Molybdenum - proportion of world mine production reserves and reserve base
for the United States 26 Table 10 Platinum-group elements - proportion of world mine production reserves and
reserve base for the United States 28 Table 11 Rare-earth elements - proportion of world mine production in 2002 and 2003
reserves and reserve base for the United States 31 Table 12 Silver - proportion of world mine production reserves and reserve base for the
United States 33 Table 13 Titanium concentrate (ilmenite) - proportion of world mine production reserves
and reserve base for the United States 38 Table 14 Barite - proportion of world mine production reserves and reserve base for the
United States 40 Table 15 Bentonite - proportion of world mine production for the United States 42 Table 16 Boron - proportion of world mine production reserves and reserve base for the
United States 44 Table 17 Bromine - proportion of world mine production for the United States 46 Table 18 Diatomite - proportion of world mine production and reserves for the United
States 47 Table 19 Garnet - proportion of world mine production for the United States 48 Table 20 Gypsum - proportion of world mine production for the United States 49 Table 21 Kaolin - proportion of world mine production for the United States 50 Table 22 Phosphate rock - proportion of world mine production reserves and reserve
base for the United States 51 Table 23 Potassium - proportion of world mine production reserves and reserve base for
the United States 53 Table 24 Salt - proportion of world mine production for the United States 54
iv
Table 25 Soda ash - proportion of world mine production reserves and reserve base for the United States 56
Table 26 Talc - proportion of world mine production for the United States 58
Figures
Figure 1 Map of the World showing the areas covered by this series of regional reports tectonic plate boundaries and ocean bathymetry 79
Figure 2 Sketches showing the layered internal structure of the Earth 80 Figure 3 Perspective diagram and cross section of the uppermost layers of the Earth
illustrating the main types of tectonic plate boundaries 81 Figure 4 A schematic cross-section of the Earth illustrating three types of mantle plumes
82 Figure 5 A map of the globe showing the distribution of the igneous rocks associated with
selected large igneous provinces (red regions) that formed in the last 250 million years 83
Figure 6 Map showing the location of the major magmatic and metamorphic mineral deposits of United States 84
Figure 7 Cross section of the uppermost layers of the Earth illustrating the distribution of mineral deposits in relation to the main types of tectonic plate boundaries 85
Figure 8 Map showing the location of the major hydrothermal mineral deposits of United States 86
Figure 9 Map showing the location of the major sedimentary mineral deposits of United States 87
Figure 10 Map showing the location of the major surficial mineral deposits of United States 88
Figure 11 Relative geologic time units used in this report 89 Figure 12 Simplified geologic map of North America 90 Figure 13 Map of North American showing the geology of the North American craton
underlying the sedimentary rocks that cover much of the continent 91 Figure 14 Summary of selected geologic events and features for the North American
craton in the last 2000 million years 92 Figure 15 Map showing the location of the major beryllium copper-cobalt copper-nickel-
PGE and platinum-palladium mineral deposits of United States 93 Figure 16 Cross section schematically illustrating the characteristic features of an
idealized sedimentary-exhalative (sedex) mineral deposit 94 Figure 17 Simplified geologic map showing the distribution of metamorphosed
sedimentary rocks (Belt-Purcell Supergroup) deposited in the Middle Proterozoic Belt basin and Cretaceous igneous rocks related to the Cordilleran orogen 95
Figure 18 Map showing the location of the major copper mineral deposits of United States 96
v
Figure 19 Cross section through an idealized stratovolcano showing various styles of related mineralization 97
Figure 20 Map illustrating changes in metal content of mineralized rock and ore deposits in the Bingham district Utah 98
Figure 21 Map showing the distribution of the Middle Proterozoic Revett Formation and associated hydrothermal copper-silver mineralization in northwestern Montana and northern Idaho 99
Figure 22 Map showing selected geologic features and the location of major sedimentary iron deposits (banded iron formation) magmatic copper-nickel-PGE deposits and hydrothermal copper deposits in basalt 100
Figure 23 Map showing the location of the major gold mineral deposits of United States 101
Figure 24 Map showing the distribution of sedimentary rock-hosted gold deposits and mineralization of the Blue-Star area of the Carlin Trend Nevada 102
Figure 25 Schematic east-west cross section of northern Nevada and northwest Utah showing the location of Carlin-type gold deposits in relation to large tectonic features 103
Figure 26 Schematic cross section that illustrates generalized patterns of alteration and mineralization of epithermal gold deposits 104
Figure 27 Map showing the location of the major iron niobium rare-earth metals and titanium mineral deposits of United States 105
Figure 28 Map showing the location of the major lead and zinc mineral deposits of United States listed 106
Figure 29 Cross section illustrating the essential features of an idealized volcanogenic massive sulfide deposit 107
Figure 30 Map showing the location of MVT lead-zinc districts in the Ozark region of the United States 108
Figure 31 Map of southeast Missouri showing location of major Mississippi Valley ore districts surrounding outcrops of Precambrian igneous rocks in the St Francois Mountains 109
Figure 32 Map showing the location of the major molybdenum mineral deposits of United States 110
Figure 33 Idealized section through an ultramafic-to-mafic layered igneous intrusion showing the distribution of magmatic ore deposits 111
Figure 34 Map showing the location of the major silver mineral deposits of United States 112
Figure 35 Map showing heavy mineral deposits in northeastern Florida and southeastern Georgia 113
Figure 36 Map showing the location of the major barite garnet and talc mineral deposits of United States 114
Figure 37 Map showing the location of the major sodium bentonite phosphate rock diatomite kaolin and limestone mineral deposits of United States 115
vi
Figure 38 Map showing the location of the major gypsum boron bromine salt potash and sodium carbonate mineral deposits of United States 116
Figure 39 Map showing the location of the major phosphorite deposits relative to the Miocene geologic framework of the southeast Atlantic Coastal Plain-continental shelf system 117
Figure 40 Map showing the distribution the location of major salt and potash deposits in evaporite basins in North America showing Modified from Kesler (1994) 118
Figure 41 Map showing the distribution of the Green River Formation and the location of sodium carbonate deposits in Utah Colorado and Wyoming 119
Figure 42 Map showing the thickness of trona bed 17 and Wyoming state mine permit areas 120
Figure 43 Charts showing the density of exploration sites for selected regions of the United States 121
Figure 44 Graph showing the number of active mining claims held on public lands in the United States from 1976 to 2003 122
Figure 45 Graph showing the number of active mining operations in the United States from 1979 to 2002 123
vii
Geology and Nonfuel Mineral Deposits of the United States
Michael L Zientek and Greta J Orris
Abstract This report which is one of a series of reports summarizing the Worldrsquos
endowment of nonfuel mineral resources describes the location and general geologic setting of deposits of major mineral commodities in the United States The discussion in this report focuses on those commodities produced in the United States that constituted at least 5 percent of global production or global reserve base in 2003 or had at least $100 million production value in 2001 The discussion for each commodity begins with a brief description of the chemical and physical properties of the material and how it is used The importance of the commodity in the United States relative to the world is also presented However most of the discussion emphasizes the geology of mineral commodities ndash the important mineral deposit types their geologic setting and the processes that led to their formation A compilation of almost 400 major mineral deposits in the United States is included as an appendix
Introduction This report is one of a series that summarize information about the Worldrsquos
endowment of nonfuel mineral resources These area reports are designed to inform the non-earth scientist about the location and general geologic setting of deposits of major mineral commodities The reports are organized by the five areas shown in Figure 1 this report covers the United States Additional information such as production statistics economic factors that affect the mineral industries of the region and historical information is available in USGS publications such as the Minerals Yearbook (available on the web) and through the detailed references provided at the end of this report A brief overview of the potential for undiscovered mineral resources is included in this report
The data in this report will be incorporated into the ongoing USGS international quantitative mineral resource assessment of the nonfuel mineral resources of the continental regions of the world This assessment led by the USGS is designed to assess the global endowment of both discovered and undiscovered nonfuel mineral resources at a scale of 11000000 (Briskey and others 2001 2002) The results will delineate areas of the world that are geologically permissive for the occurrence of selected undiscovered nonfuel mineral resources together with estimates of the quantity and quality of those resources The global assessment will result in information that will assist in efforts to maintain a world supply of essential mineral resources while minimizing the global environmental and societal impacts of mining
1
Currently more than 5 percent of the worldrsquos production of barite beryllium boron bromine copper garnet gypsum gold salt (halite) iron lead zinc molybdenum palladium phosphate rock soda ash silver and titanium come from mining operations in the United States These materials are derived from mineral deposits ndash a concentration of a mineral commodity of sufficient size and grade that might be mined or developed given favorable socio-economic conditions A variety of mineral deposits types have been recognized that occur in distinctive geologic settings Knowledge about the geologic context of mineral deposits can be applied to predict where undiscovered resources may be found
The information in this report is organized by commodity table 1 lists those materials that are described Each section begins with a brief description of the chemical and physical properties of the material and how it is used The relative importance of the commodity in the United States relative to the world is also presented However most of the discussion emphasizes the geology of mineral commodities ndash the important mineral deposit types their geologic setting and the processes that led to their formation
Table 1 Value of selected mineral commodities produced in the United States
[Value can be measured either in dollars (annual production value) or in the relative contribution to the
global output of a commodity (percent of world production) Commodities highlighted with bold type are
discussed in this report Annual production value from National Mining Association (undated) percent of
world production from USGS (2004)]
Commodity Annual production value in 2001
Percent of world production in 2003
Stone crushed $8920000000 Cement portland and masonry $6827000000 Sand and gravel - construction and industrial $6246000000 Gold $2930000000 10 Copper $2270000000 8 Clays (includes ball bentonite common fire fullers earth and kaolin)
$1467170000 401 182
Iron ore (usable) $1210000000 5 Lime $1160000000 Salt $1110000000 20 Phosphate rock $856000000 24 Zinc $774000000 9 Soda ash $773000000 953
Boron minerals (B2O3) $506000000 24 Lead $437000000 16 Potash (K2O) $260000000 4 Silver $245000000 7 Palladium $237000000 8 Diatomite $174000000 27 Bromine $159000000 38 Gypsum (crude) $119000000 16 Platinum $61900000 2 Feldspar $44100000 Rare-earth metal concentrates $27600000
2
Table 2 Value of selected mineral commodities produced in the United States - continued
Peat $24800000 Perlite crude $21300000 Iodine $18400000 Pumice and pumicite $18000000 Gemstones $15100000 Tripoli $15100000 Kyanite $13400000 Barite $11000000 7 Mica crude $7990000 Garnet industrial $6430000 14 Silica stone $4040000 Iron Oxide pigments (crude) $3460000 Beryllium Concentrates $3000 62 Molybdenum Data withheld 27 Talc No data 9 Titanium No data 7 1 bentonite 2 kaolin 3 natural soda ash
In addition this report contains a compilation of major mineral deposits in the United States (appendix 1) In the United States hundreds of thousands of mineral occurrences (a concentration of a mineral commodity that is or has been considered valuable) have been found and well over a thousand of these are thought to be significant (Long and others 1998) However most of the mineral resources and mine production in the United States are associated with a small number of large deposits For example the largest 10 percent of the known gold deposits in the world contain 86 percent of the gold that has ever been discovered (Singer 1995) Only large deposits are included in appendix 1 For some commodities (appendix 2) specific criteria were used to select the mineral deposits to include in appendix 1 for other commodities qualitative measures such as the relative proportion of material contained in the deposit compared to deposits outside the United States were used to identify major deposits
This report is not intended as a comprehensive overview of the geology or mineral resources of the United States Interested readers are referred to other available literature on the geologic evolution and mineral resources of the United States Compendiums include Bally and Palmer (1989) Brobst and Pratt (1973) Gluskoter and others (1991) Harben and Kužvart (1996) Long and others (1998) and US Geological Survey National Mineral Resource Assessment Team (2000)
Some basic terms and concepts The surface of the Earth is constantly being modified by the action of wind water
ice and the movement of large masses of rock and magma (naturally-occurring molten material from which igneous rocks are formed) The distribution of many mineral deposits is intimately related to processes that operate at the scale of the planet The discussion of mineral commodities in this report emphasizes how the geologic evolution of North America has determined the mineral resource endowment of the United States This section introduces some basic geologic concepts that are essential to understanding the genesis and spatial distribution of mineral deposits
3
The Earth consists of 3 main layers or shells like an onion (fig 2 Kious and Tilling 1996) The crust the outermost layer is rigid and relatively thin ranging in thickness from 5 to 100 kilometers Below the crust is the mantle a dense hot layer of semi-solid rock approximately 2900 kilometers thick At the center of the Earth lies the core which is composed of solid and liquid iron-nickel alloy
The theory of plate tectonics states that the Earths outer layers are fragmented into a dozen or more slabs that are moving relative to one another (figs 1 and 3 Kious and Tilling 1996) These tectonic plates are massive irregularly shaped slabs of solid rock generally composed of continental and oceanic crust and part of the underlying upper mantle that together comprise the lithosphere Plate size can vary greatly from a few hundred to thousands of kilometers across Plate thickness also varies greatly ranging from less than 15 kilometers for young oceanic lithosphere to about 200 kilometers or more for ancient continental lithosphere (for example the interior parts of North America)
The relative motion between tectonic plates generally is on the order of several millimeters per year Geologic features of the Earthrsquos crust record the movement and interaction of tectonic plates features include linear belts of mountains long narrow valleys bounded by faults volcanoes and earthquakes along the margins of tectonic plates Geologists distinguish three types of plate margins depending on their relative motion Plates can move toward each other move away from each other or slide past each other When two lithospheric plates come together a plate covered by oceanic crust will sink into the mantle forming a subduction zone On continental crust mountain belts (orogens) form where plates collide Most volcanoes on land occur parallel to and inland from subduction zones Rift zones form where plates move apart Strike-slip or transform faults form where plates slide past each other
Scientists also believe that masses of relatively hot low-density mantle rise from the upper boundary of the core (fig 4) On reaching the base of the upper mantle these mantle plumes can spread laterally and cause rock to melt forming magma (Condie 2001) Geological features linked to mantle plumes include broad doming of the crust modification of continental-scale drainage patterns rifting of continental crust and the breakup of continental tectonic plates and the rapid eruption of large volumes of magma enriched in iron and magnesium (fig 5 Buchan and Ernst 2001)
Many mineral deposits are found in areas where the movements of magmas and water-rich fluids have been focused Heat generated by the radioactive decay of elements deep within the Earth can melt rocks to form magma causes rocks magmas and fluids to move by making them less dense and more buoyant and provides the energy needed to drive chemical reactions The interaction of tectonic plates that make up the upper 200 kilometers of the Earth and ascent of plumes of hot rock toward the surface from deep within the mantle generates the magmas and fluids fractures and faults mountain ranges and sedimentary basins that are critically important to localizing magmatic hydrothermal and metamorphic mineral deposits
Magmatic mineral deposits form during the cooling and crystallization of magma These deposits are typical of igneous rocks that form from magmas enriched in magnesium nickel and chromium Some deposits such as those enriched in chromium simply are made up of crystals that grew from the magma In other cases deposits form from sulfur- or iron-rich liquids that segregate from a silicate magma and crystallize separately These sulfur- or iron-rich liquids are denser than the original magma Once formed these separated sulfur- or iron-rich liquids do not mix or blend with the silicate-
4
rich magma (the separation of oil and vinegar in a salad dressing is an example of a similar process) The sulfur-or iron-rich liquids accumulate in zones or layers and solidify Sulfide-rich liquids can be enriched in nickel copper and platinum-group elements In addition the resulting sulfide mineralization potentially contains important by-products such as cobalt gold silver selenium and tellurium the ores also are used to produce sulfuric acid and liquid sulfur dioxide Iron-rich liquids are enriched in titanium vanadium and phosphorus Large magmatic mineral deposits enriched in nickel chromium and platinum-group elements are associated with plume-related igneous activity Other magmatic mineral deposits are associated with igneous rocks that formed from magmas enriched in silicon potassium and sodium When these magmas cool the last material to crystallize may be enriched in water and elements such as lithium tantalum and niobium These igneous rocks called pegmatites are characterized by crystals that can be quite large ranging from centimeters to meters in diameter Gem minerals such as tourmaline and topaz may also form in these rocks Figure 6 shows the distribution of magmatic ore deposits in the United States
Hydrothermal mineral deposits form by the interaction of hot water and rock Water is a good solvent and hot water called hydrothermal fluid can efficiently move and deposit materials that occur in some mineral deposits Plate interactions (collisions and rifts) are characterized by the large-scale movement of magmas and hydrothermal fluids that can form hydrothermal mineral deposits (fig 7) Faults formed at plate margins form discontinuities in the crust that focus the movement of fluids and magmas Cooling igneous magmas can produce hydrothermal fluids that form a variety of deposit types enriched in a broad suite of metals (Thompson and Newberry 2000)
Not all hydrothermal fluids are directly related to magmatic activity Some hydrothermal fluids are generated in sedimentary basins - regions of the crust where relatively great thicknesses of sediment have accumulated Sedimentary basins commonly form where the interaction of tectonic plates locally cause the Earthrsquos crust to subside (Busby and Ingersoll 1995) The decay of naturally-occurring radioactive elements within the Earth causes rock temperatures to rise with increasing depth As sediments are buried hydrothermal fluids form by the heating of pore water trapped in the sediment and the break-down of water-rich minerals that are only stable at low temperatures As these hydrothermal fluids move through the crust they interact with other fluids rocks and ultimately the atmosphere locally forming mineral deposits Most hydrothermal deposits are located in the western part of the United States (fig 8)
Metamorphic deposits Rocks are changed (metamorphosed) as they are subjected to higher temperature andor pressure New minerals can form and the size and shape of existing minerals are modified Mountain building processes or burial of sediment or rocks can cause metamorphism Emplacement of magma can also cause metamorphism by heating rocks around the intrusion In some cases the new metamorphic minerals have useful properties Examples include garnet (silicate minerals containing variable proportions of iron aluminum magnesium and calcium that are used for abrasives water filtration and semi-precious gems) wollastonite (a calcium silicate used for asbestos substitutes ceramics friction products metallurgy paint plastics) and kyanite (aluminum silicate used for brake linings and clutch facings ceramics grinding and cutting wheels refractories) Figure 6 shows the distribution of metamorphic ore deposits in the United States
Rocks disintegrate when exposed to water air and microbes at the Earthrsquos surface The movement of water and air in part driven by solar radiation redistributes
5
rock and soil particles These processes can also cause the transportation concentration and localization of materials that form some types of mineral deposits Sedimentary mineral deposits are economic concentrations of minerals in sedimentary rocks that formed directly from water in oceans lakes or in underground reservoirs The precipitation of minerals can be caused by evaporation of water or by mixing of waters with different compositions The resources associated with these deposits can be quite large because minerals can be deposited uniformly over large areas The uniformity of these deposits and their lateral extent also can make them easier to mine Evaporite and brine deposits are sedimentary mineral deposits that form by the evaporation of lake water or seawater These deposits are sedimentary layers that are enriched in a variety of salts These deposits form from bodies of water that have restricted circulation and high evaporation rates Major deposits of evaporites are commonly found in sedimentary basins that formed when continental crust is pulled apart to form a rift and in sedimentary basins that form on continental crust well away from tectonic plate boundaries The composition of water constrains the mineralogy and composition of evaporite deposits (Guilbert and Park 1986) Salts that form from seawater include halite (sodium chloride) gypsum (hydrated calcium sulfate) sylvite (potassium chloride) and carnalite (hydrated calcium-magnesium chloride) The variable composition of lake water results in a variety of evaporation-concentrated mineral deposits Large deposits of nitrates sodium carbonates and borates have formed by the evaporation of lakes Sedimentary mineral deposits also include large bedded deposits of iron minerals that formed from ancient oceans Organic activity plays an important role in the formation of other sedimentary mineral deposits such as phosphate rock and diatomite Figure 9 shows the distribution of sedimentary mineral deposits in the United States
Erosion and weathering of rocks can form surficial mineral deposits Placer deposits form as heavy particles of rocks or minerals are physically concentrated by the action of moving water Placer deposits can form in active stream deposits or along the shoreline of oceans or lakes Minerals typically concentrated in placer deposits include gold platinum titanium-minerals and garnet (silicate minerals containing variable proportions of iron aluminum magnesium and calcium) Placer deposits are relatively easy to find and simple to mine Residual deposits are formed by the intense weathering of rocks under hot humid conditions The mineralogy and composition of the weathered rock determines which elements will be concentrated by weathering Aluminum nickel manganese iron and clay deposits can form by this process Weathering of near-surface exposures of mineral deposits can also form minerals that are easier to treat and extract during mining In other situations the metals leached from near surface exposures can be re-deposited near the groundwater table forming secondary enrichment zones Figure 10 shows the distribution of surficial deposits in the United States
Overview of geologic and tectonic history The movement of material in the mantle and of tectonic plates is responsible for
the development of cratons orogens large provinces of igneous rocks and rifts that are characteristic of continental crust In general the interiors of continents consist of ancient continental crust that is surrounded by younger belts of deformed rocks The ancient parts of a continent that have been structurally stable for a prolonged period of time are called cratons (Condie 1997) The younger curvilinear belts of deformed rocks often accompanied by metamorphic and igneous rocks are called orogens The linear belts of
6
igneous rocks associated with orogens are called igneous arcs Orogens form on continental crust in response to the convergence of tectonic plates Young orogens are expressed on the Earthrsquos surface as mountain ranges Orogens are important in the formation of mineral deposits the collisional process provides heat to generate magmas and hydrothermal fluids and fractures and faults that focus their flow Many types of mineral deposits are spatially and temporally associated with orogenic belts
Parts of some continents are characterized by large tracts of igneous rocks enriched in magnesium and iron (basalt) that are not associated with orogens These igneous rocks along with sedimentary rocks found in long linear fault-bounded valleys may have formed as mantle plumes reached the base of the crust or as tectonic plates moved away from each other As with orogens heat related to magmatism and faulting can give rise to a variety of mineral deposits in this geologic setting
Throughout this report events related to the physical formation and development of the Earth are described using either absolute (chronometric) or relative (chronostratigraphic) time scales Absolute time is reported as numerical ages in billions of years (Ga) or millions of years (Ma) that are measured using radiometric dating methods Relative time is based relations of rock units and fossils that can be recognized globally These relative subdivisions of geologic time have been given names and are grouped hierarchically the boundaries between these units can be calibrated using the absolute time scale (fig 11)
The geologic architecture of the United States uniquely reflects the sequence of geologic events that culminated in the distribution of rocks (fig 12) and mineral deposits (figs 6 8 9 and 10) we see today The more we know about the geologic fabric of each continent and the processes that control the regional and local distribution of mineral deposits the better we can predict where new deposits will be found and what they may contain
Today most of the United States land mass lies on one tectonic plate the North American plate (fig 1) The western margin of this plate is the site of an orogen that started to develop 100s of millions of years ago and is still active today The mountain ranges active volcanoes and earthquakes that are characteristic features of the landscape of the western conterminous United States and Alaska are a result of on-going subduction and transform motion between tectonic plates Magmatic activity at Hawaii and Yellowstone is thought to be the result of mantle plumes However the plates and continents have not always been dispersed around the globe as they are today
The geology of the United States records a long history of tectonic plate and mantle plume interactions (figs 13 and 14) The rocks that make up the interior of the North American continent were assembled by the merger of smaller continental masses during the Early Proterozoic followed by the accretion of younger continental crust during the Middle Proterozoic (Hoffman 1989) The oldest continental crust is exposed in Archean cratons Most of the Archean cratons that make up the interior of the conterminous United States are now covered by younger sedimentary rocks Part of the largest Archean craton in North America the Superior province is exposed in Minnesota Archean rocks of the Wyoming province are exposed in some mountain ranges in Wyoming and Montana Although older rocks are present these cratonic provinces experienced strong compression magmatism and metamorphism between 28 and 26 Ga During the Archean these cratons appear to have been separate continental masses About 19-17 Ga convergence of tectonic plates welded the Superior and Wyoming cratons together the convergent boundary is delineated by the Trans-Hudson orogen
7
Subduction of tectonic plates along the southern margin of the combined Superior and Wyoming provinces created several orogens that added new continental crust to the North American continent The oldest is the Penokean orogen south of Lake Superior Younger orogens (Yavapai Mazatzal Central Plains) developed between 18 and 16 Ga and accreted additional crust to the southern margin of the North American continent Following these events the North American continent experienced no orogenic activity for about 350 million years
Many if not all of the major continents were joined together during the Middle Proterozoic (about 13 to 10 Ga) and the Paleozoic (between about 543 and 248 Ma (millions of years before the present) forming super continents called Rodinia and Pangea respectively (Condie 1997) The Middle Proterozoic Grenville orogen exposed from eastern Canada to Mexico formed during the series of plate collisions that formed Rodinia (fig 13) This supercontinent broke apart between 750 to 550 Ma The Paleozoic Appalachian orogen in the eastern United States and the Ouachita orogen in Arkansas and Texas formed during the assembly of Pangea (figs 12 and 13) Pangea began to break up about 160 Ma In the Middle and Late Jurassic the North American continent split from Africa and Europe to form the North Atlantic Ocean The breakup of the continents was accompanied by igneous activity and the formation of rift-related sedimentary basins
The Cordilleran orogen lies on the western part of the North American continent The orogen developed along a continental margin that formed about 600 Ma during the breakup of the super continent Rodinia This orogen reflects intermittent convergent margin tectonic activity between oceanic and continental plates starting in middle Paleozoic time and continuing to present (Bally and Palmer 1989 Burchfiel and others 1992) The Cordilleran orogen is one of the longest-lived orogenic belts in the world The long history of magmatic and tectonic activity and its young age has resulted in the formation and preservation of a large number of major mineral deposits
About 20 igneous events in the United States are linked to mantle plumes (fig 14 Ernst and Buchan 2001) Many of these events are also associated with the development of continental rifts The igneous rocks associated with these events range in age from a few million years to 29 billion years Examples of geologic provinces related to plume events are the Tertiary Columbia River flood basalt province in Washington Oregon and Idaho the Triassic Wrangellia rocks of Alaska and the Late Proterozoic Keewenawan flood basalt province that extends from Kansas to Minnesota and Michigan (fig 12) These provinces are characterized by the rapid eruption of large volumes of sheet-like lava flows that are enriched magnesium and iron Major mineral deposits are associated with the Keewenawan event and the older Stillwater event in Montana Plume-related magmatic activity also appears to be associated with the tectonic events that resulted in the breakup of the Rodinian and Pangean supercontinents
Principal commodities and deposit types For this report information is organized following usage in USGS Minerals
Yearbooks Metallic and industrial commodities are distinguished with each commodity listed alphabetically and discussed under one of these categories Some mineral deposits produce more than one commodity The discussion for these polymetallic deposits is repeated for each commodity that is present This creates some redundancy in the report
8
however it allows each commodity section to stand alone if the reader wants to relate this discussion to information in the USGS Minerals Yearbooks
Appendix 1 is a compilation of the major mineral deposits in the United States The importance and diversity of mineral deposits as sources of commodities in our modern society is evident from almost 400 major mineral deposits summarized in appendix 1 This table gives the deposit name the commodities produced deposit-type categories and a reference At some level of understanding every mineral deposit is unique However shared characteristics of some deposits allow them to be considered as a group Studies of these groups provide the insight needed to recognize the fundamental processes and controls that lead to the formation of mineral deposits These insights can be formalized as models that give geologists the ability to understand the known distribution of mineral deposits and to predict the location quantity and quality of undiscovered resources Therefore if possible the mineral deposit model (Cox and Singer 1986 Stoeser and Heran 2000) that applies to each deposit is also given
Although the table is comprehensive our discussion focuses on those commodities produced in the United States that constituted at least 5 percent of global production or global reserve base in 2003 (Appendix 3) or had at least $100 million production value in 2001 (table 1) For each commodity the use of the commodity the United States contribution to world production and reserves and the geology of the deposits that account for the majority of the commodity production in the United States are briefly described The geologic discussion focuses on the combination of geologic factors that concentrated the commodity into a deposit A broad genetic classification of mineral deposits is used as the primary framework for discussion Our simple classification includes magmatic hydrothermal metamorphic sedimentary and surficial mineral deposits
9
Metals
Beryllium Beryllium is a hard silvery-white and very light metal with a very high melting
point The combination of its light weight and high melting point make it valuable for making metal alloys which are used in electronic and electrical components and aerospace and defense applications (Mineral Information Institute USGS and American Coal Foundation undated)
Table 2 Beryllium - proportion of world mine production for the United States
[USGS 2004]
Country Percent of world production 2003
Rank of world production
United States 621 1 Known world resources of beryllium have been estimated to be more than 80000
metric tons In 2003 the apparent consumption of beryllium in the United States was 190 metric tons (USGS 2004) About 65 percent of the global beryllium resource is in the United States for the most part concentrated in the Spor Mountain and Gold Hill areas in Utah and the Seward Peninsula area in Alaska The United States produced over 60 percent of the total world output of beryllium in 2003
The deposits in the Spor Mountain region of Utah (fig 15) are the only developed source of beryllium in the United States and North America (Brush Engineered Materials Inc 2003) Proven bertrandite (hydrous beryllium silicate) reserves in Utah total about 16000 metric tons of beryllium These proven ore reservesmdashthe largest in the worldmdashare sufficient to fill the requirements of the worldrsquos beryllium industry for at least the next sixty years based on present production rates
The hydrothermal mineralization at Spor Mountain is associated with a volcano that was active about 20 million years ago The volcanic activity formed a caldera (a large basin-shaped volcanic depression) deposited layers of volcanic fragmental rock or tuff and erupted silica-rich lavas Beryllium mineralization along with fluorite (calcium fluoride) and uranium is found in the volcanic tuff unit (Lindsey 1998) The volcanic complex is part of an east-west trending belt of igneous activity that developed late in the evolution of the Cordilleran orogen and extends from the Sierra Nevada to the Wasatch Range in Utah (Christiansen and Yeats 1992)
10
Cobalt Cobalt is a bluish-gray shiny brittle metallic element Some applications of
cobalt include catalysts cemented carbides for cutting tools and drill bits drying agents for paints magnets and superalloys for jet engine components (Mineral Information Institute USGS and American Coal Foundation undated) Identified world cobalt resources are about 15 million metric tons (USGS 2004) The apparent consumption of cobalt in the United States in 2003 was 10000 metric tons (USGS 2004)
Table 3 Cobalt - proportion of world mine production reserves and reserve base for the
United States
[USGS 2004 reserves and reserve base are defined in Appendix 3]
Country Percent of world production 2003
Rank of world production
Percent of world reserves
Percent of world reserve base
United States
-- -- -- 72
Cobalt can be recovered from mineral deposits developed primarily for their
cobalt content or as a by-product of mining nickel Mines in the United States currently are not producing significant quantities of cobalt However primary cobalt reserves have been identified and are associated with metamorphosed hydrothermal deposits in Idaho (fig 15) By-product cobalt resources also could be recovered if the copper-nickel-PGE deposits associated with the Duluth Complex Minnesota are developed (see discussion under copper nickel or platinum-group elements)
The primary cobalt deposits in Idaho formed when hydrothermal solutions moving along fractures towards the Earthrsquos surface vented into the ocean and formed hot springs (fig 16) The hydrothermal solutions mixed with ocean water and formed layered deposits of sulfide minerals enriched in iron cobalt copper and gold on the seafloor Geologists refer to this type of mineralization as sedimentary exhalative (sedex) deposits The ore minerals were deposited in sedimentary rocks from hydrothermal solutions that may have been generated as water-rich sediments were deeply buried in sedimentary basins within the crust Thin layers of volcanic rock in the sedimentary basins suggest igneous processes also may have had some role in generating the hydrothermal fluids Deposits may have been localized near faults that were active during sedimentation and provided channel ways for the fluids to escape to the surface
Sedimentary-exhalative cobalt deposits occur in a linear trend in east-central Idaho The belt extends for about 55 kilometers and contains at least eleven sediment-hosted copper-cobalt deposits and occurrences (Box and others 1995) Recently Formation Capital has established a cobalt-copper-gold reserveresource on two zones the Sunshine and Ram deposits (Formation Capital undated) The diluted proven and probable reserves and inferred resources for their Idaho Cobalt Project are estimated to be 286 million metric tons grading 0602 percent cobalt 045 percent copper and 05 grams per ton gold (Shedd 2002) Nearby the Blackbird deposit has resources estimated to be 489 million metric tons grading 071 percent cobalt and 124 percent copper (Spanski 2004)
11
The cobalt deposits are hosted in a Proterozoic sedimentary basin (the Belt basin) that is made up of about 16 kilometers of layered sedimentary rocks covers 200000 square kilometers and extends from Idaho Montana and Washington north into Canada (fig 17 Chandler 2000) This basin formed about 15 Ga when a rift developed on a supercontinent that was made up of most of North America along with Siberia Australia or Antarctica filled with sediment (Chandler 2000 Lydon 2000) The high heat flows associated with basins that form as continents are pulled apart or rifted generate hydrothermal fluids that can form sedex deposits (Lydon 1988 Lydon 1996) Sedex deposits with lead and zinc are relatively common and found world-wide (Lydon 1996) those enriched in cobalt and copper have only been described from Idaho
12
Copper Copper is a mineral and an element (Mineral Information Institute USGS and
American Coal Foundation undated) Copper has become a major industrial metal because of its high ductility malleability thermal and electrical conductivity and resistance to corrosion it ranks third after iron and aluminum in terms of quantities consumed About one-half of the copper and copper alloys are used in building construction and about one-half of the remainder is used in electric and electronic products Known land-based resources are estimated to be 16 billion metric tons of copper (USGS 2004) In 2003 the apparent unmanufactured consumption of copper in the United States was 2370000 metric tons (USGS 2004) The United States supplied about 8 percent of the worldrsquos production of copper in 2003 United States copper production largely comes from deposits in Arizona New Mexico and Utah The location of major copper deposits in the United States is shown in figure 18
Table 4 Copper - proportion of world mine production reserves reserve base and
resource base for the United States
[USGS 2004 Singer 1995 reserves and reserve base are defined in Appendix 3]
Country Percent of world production 2003
Rank of world production
Percent of world
reserves
Percent of world reserve
base
Percent of world discovered resources
United States
81 3 74 75 192
Currently most of the copper production in the United States is derived from
large relatively low grade hydrothermal mineral deposits that formed beneath composite volcanoes Important undeveloped hydrothermal copper deposits are hosted by sedimentary rocks in Montana these deposits are also enriched in silver Historically considerable copper production came from hydrothermal deposits associated with plume-related volcanic lava flows in Michigan In the future significant copper production can be expected from magmatic copper-nickel deposits in the Duluth Complex in Minnesota
Porphyry copper deposits Hydrothermal copper mineral deposits associated with composite volcanoes are called porphyry-type deposits by geologists (figs 19 and 20) The name is derived from the close association of mineralization with igneous rock called porphyry Most of the minerals that make up porphyry are too small to discriminate by eye however they also contain conspicuous larger crystals scattered throughout the rock This texture is indicative of crystallization and cooling of magma near the surface of the Earth
Porphyry intrusions and associated hydrothermal copper mineralization form deep beneath composite volcanoes Some magmas that erupt to the Earthrsquos surface create steep-sided symmetrical cone-shaped composite volcanoes comprised of alternating layers of lava flows volcanic ash cinders blocks and bombs (Kious and Tilling 1996) A composite volcano such as Mount Rainier in Washington can rise as much as 2500 meters above the surrounding landscape Magma that crystallizes deep within the volcano forms porphyry intrusions
13
Magma that forms composite volcanoes is typically rich in gases like water and carbon dioxide The release of these gases as the magmas reach the surface can result in explosive eruptions they are also a component of the hydrothermal fluids that are typically associated with these magmas Porphyry copper deposits are derived from hydrothermal fluids released from and driven by the cooling magma As the fluids cool and react with rocks copper is deposited both in the igneous porphyry intrusions as well as adjacent rocks (fig 19) As the hydrothermal fluids move away from the porphyry intrusions mineral deposits rich in lead zinc gold and silver are also formed (figs 19 and 20) An average porphyry copper deposit can contain 140 million metric tons of mineralization with 05 percent copper (Singer and others 2002) Most porphyry copper deposits are found in rocks younger than 300 million years
Composite volcanoes and associated porphyry copper deposits are not randomly distributed over the Earths surface Most are concentrated on the edges of continents or along island chains in the oceans In North and South America more than 270 composite volcanoes have been active in the last 10000 years almost of them occur in linear belts along the western margins of these continents (Siebert and Simkin 2002) The linear belts of modern volcanic activity are clearly associated with the convergence and subduction of tectonic plates Today off the coast of Washington Oregon and northern California the Juan de Fuca tectonic oceanic plate is pushing into and is sinking (being subducted) under the continental part of the North American Plate (fig 1) This convergence of oceanic and continental plates generates the magma that is erupted to form the active composite volcanoes such as Mount Rainier and Mount St Helens in the Cascades Range
For at least the last 300 million years the western margin of the North American continent has been a convergent plate boundary where the Earthrsquos tectonic plates are moving toward each other Subduction and destruction of oceanic crust has created linear belts of igneous rocks on the continental crust that makes up the western side of the North American continent The position duration and intensity of these igneous belts have shifted with time Variable uplift and erosion have cut through the volcanic rocks to expose underlying igneous intrusions that may host copper deposits Subduction may have caused many thousands (millions) of igneous intrusions to be emplaced in the Cordillera orogen of North America so far exploration geologists have found over 200 porphyry copper deposits along the western margin of the North American continent (Singer and others 2002) Approximately 100 porphyry copper deposits occur in the United States and almost half of these are found in southeastern Arizona and southwestern New Mexico
The largest copper-producing operations in the United States are all porphyry copper deposits Eight of the 9 top producers are in southeast Arizona and southwestern New Mexico (National Mining Association 2003a) The remaining deposit is in Utah The largest deposits in the United States are ContinentalButte in Montana and Morenci-Metcalf and Safford in Arizona all three deposits each contained over 32 million metric tons of copper Safford contains over 7 billion metric tons of ore averaging 044 percent copper (Singer and others 2002) These ore bodies also are an important source of molybdenum gold and silver
Revett copper deposits Revett copper deposits are lens-shaped bodies of disseminated copper sulfides with silver that occur in a narrow interval of sedimentary layers in a large sedimentary basin (Hayes and Einaudi 1986 Hayes and others 1989 Hayes 1990 Cox and others 2003) However mineralization does not necessarily
14
conform to sedimentary bedding These deposits form after the host sediment is deposited but in most cases before the sediment is converted into solid rock The ore minerals appear to have been deposited from waters that filled pores between the sediment particles These copper deposits are formed where waters of different composition and temperature mix in the subsurface in porous sediments The distribution of minerals in the rocks that host the deposit indicate that the sulfide minerals were deposited as warm salty metal-bearing water (brine) moved through the porous beds and mixed with cool pre-existing pore water
Revett-type copper deposits occur in quartzite beds (quartz-rich metamorphosed sedimentary rocks) of the Revett Formation in the Belt basin a middle Proterozoic sedimentary basin (fig 21 Harrison 1972) The Belt basin covers 200000 square kilometers and extends from Idaho Montana and Washington north into Canada (fig 17 Chandler 2000) This basin formed about 15 Ga when a rift developed on a supercontinent that was made up of most of North America along with Siberia Australia or Antarctica filled with sediment (Chandler 2000 Lydon 2000) Over 16 kilometers of layered sedimentary rocks were deposited in this basin The sediment layers were originally deposited on the bottom of a lake or an embayment open to the ocean As layers were buried by younger sediments their pore waters become warmer and contained more dissolved components Copper can be one of these dissolved components if ferromagnesian minerals (dark-colored minerals enriched in magnesium andor iron) or mafic rock fragments (rock chiefly composed of ferromagnesian minerals) are present in the sediments The pressure of the overlying sediments and the high geothermal gradients associated with basins that form as continents are pulled apart can ultimately drive these warm brines upwards along faults that were active during deposition of the basin Fluid mixing responsible for mineral deposition occurred as these brines moved vertically through the section and laterally into the porous sediment layers that ultimately were converted into quartzite
Long and others (1998) described 9 significant Revett-type copper deposits 2 deposits are large enough to include in this compilation The median size of a Revett-type sediment-hosted copper deposit is 14 million metric tons with 079 percent copper and 31 grams per ton silver (Cox and others 2003) The largest deposit Rock Lake-Rock Creek contains approximately 300 million metric tons of ore containing 081 percent copper and 71 grams per ton silver
Native copper deposits associated with basalt flows Approximately 11 Ga a mantle plume is thought to have developed under what is now the area around Lake Superior This plume event was associated with the eruption of lavas and emplacement of igneous intrusions between 1109 and 1087 Ma along a linear belt where the earthrsquos crust subsided forming a rift valley The rift extends for more than 2500 kilometers from Kansas northward beneath Lake Superior and then southeast through Michigan (fig 8) however exposures of rocks related to the rift are only found in the Lake Superior region (Schulz and Cannon 1997) Part of the igneous activity involved the voluminous eruption of sheet-like lava flows now consisting of a rock called basalt (an igneous rock enriched in iron and magnesium) Taken together these basalt flows exceed 10 kilometers in thickness Some of these lavas the Portage Lake Volcanics are well-exposed on the Keweenaw Peninsula of upper Michigan (fig 22) Relative to other types of volcanic rocks basalts like those that form the flows in Michigan are enriched in copper Hydrothermal solutions generated deeper in the rift basin leached copper from the basalt flows and deposited copper minerals principally as native copper in thin layers of
15
sediments between lava flows or in the rubble that occurs along the base or top of lava flows Prehistoric Native Americans found and mined native copper from these deposits Before large-scale mining of porphyry copper deposits began early in the 20th century these deposits in basalt flows in Michigan were an important source of copper in the United States Long and others (1998) described 13 significant native copper deposits associated with basalt flows in Michigan 3 are large enough to include in this compilation There are no active mines on these deposits
Magmatic copper-nickel deposits in the Duluth Complex Igneous intrusions formed during the 11 billion Ga mantle plume event in the Lake Superior area also contain copper mineralization The largest of the intrusions occurs in Minnesota and is known as the Duluth Complex (fig 22 Miller Green and others 2002) When this intrusion was emplaced it reacted with the surrounding rocks resulting in the formation and segregation of immiscible liquids containing sulfur iron copper nickel platinum-group elements and cobalt As a result large volumes of rock with a few percent sulfide minerals occur along the western margin the Duluth Complex locally the rocks are made up almost entirely of sulfide minerals Exploration activity has delineated several low-grade copper-nickel deposits in these rocks that have local zones enriched in platinum-group elements At this time no mines are developing these resources Listerud and Meineke (1977) estimate the resources along the western margin of the complex to be 4400 million short tons of rock containing 066 percent copper and 020 percent nickel Subsequent exploration has focused on three deposits ndash Dunka Road (the Northmet project) Babbitt (the Mesaba project) and Maturi An open pit minable resource of 808 million metric tons containing 0432 percent copper 0109 percent nickel 0166 grams per ton platinum 0437 grams per ton palladium 0061 grams per ton gold and 15 grams per ton silver has been defined at the Northmet project (Polymet Mining Corporation 2003) Copper along with platinum-group elements and nickel will be recovered when these deposits are developed Worldwide this type of large tonnage low grade copper-nickel-PGE mineralization is relatively uncommon Similar deposits are known in South Africa Finland Australia Canada and Russia
16
Gold Gold is a metallic element that is beautiful durable easily worked and rare
(Mineral Information Institute USGS and American Coal Foundation undated) It has been used throughout human history for jewelry and as currency It is also chemically stable and as a result seldom combines with other elements It does not corrode or rust and conducts heat and electricity very well Gold is very malleable and ductile Today gold is primarily used in coins and jewelry and is stored by many countries to support their currencies It is also used in dentistry and electrical and electronic applications
About 190000 metric tons of gold has been discovered in the world (Singer 1995) About 10 percent of total gold discovered is in the United States Total world gold resources are currently estimated to be about 100000 metric tons (USGS 2004) The reported consumption of gold in the United States in 2003 was 150 metric tons (USGS 2004) The location of major deposits of gold in the United States is shown in figure 23
Table 5 Gold - proportion of world mine production reserves and reserve base for the
United States
[USGS 2004 reserves and reserve base are defined in Appendix 3]
Country Percent of world production 2003
Rank of world production
Percent of world reserves
Percent of world reserve base
United States
102 3 130 68
Major gold deposits are either hydrothermal or surficial Over 80 percent of the
295 metric tons of gold produced in the United States in 2002 came from mines in Nevada (Price and Meeuwig 2002) These mines also produced 422 metric tons of silver approximately 30 percent of United States output The gold and silver in Nevada are mined from three types of hydrothermal deposits ndash Carlin-type gold deposits distal disseminated gold deposits and epithermal gold deposits
Sedimentary rock-hosted or Carlin-type gold deposits contain most of discovered gold resources in Nevada The gold in these deposits is associated with small amounts (about 5 percent) of pyrite (iron sulfide) that is dispersed through altered sedimentary rocks that contain more than 50 percent carbonate minerals (Hofstra and Cline 2000) The gold grains form particles that are usually less than a millionth of a meter in diameter The hydrothermal fluids that formed these deposits moved upwards along major structures until they encountered units that restricted fluid flow At that point the fluids migrated laterally into sedimentary units that easily allowed the movement of fluids As the fluids reacted with the rock they dissolved carbonate minerals and deposited clay minerals silica and gold-bearing pyrite (iron sulfide) Gold ore is concentrated in areas where faults and fractures intersect rocks that easily react with hydrothermal fluids Most deposits formed at depths of greater than 2 kilometers The vertical extent of gold mineralization in a deposit rarely exceeds 1000 meters more commonly mineralization extends over vertical intervals of 100 to 500 meters The largest example of a Carlin-type deposit Betze-Post contains 1250 metric tons of gold (fig 24 Bettles 2002)
17
These deposits are associated with the processes that formed the Cordilleran orogen specifically when tectonic plate motions changed directions about 43 Ma (Hofstra and Cline 2000) This change in plate motion was associated with the development of an east-west trending subduction related igneous belt that formed at the same time that the Earthrsquos crust was slowly being pulled apart However the gold deposits are not spatially associated with igneous centers instead they are located along old (Late Proterozoic) faults that penetrate deep into the crust (fig 25) Different types of hydrothermal fluids can be generated in this type of setting research on these deposits has not definitively identified the process that generated the ore-forming fluid More than 100 Carlin-like gold deposits and occurrences are now recognized in northern Nevada and northwest Utah with a pre-mining resource of more than 4800 metric tons of gold About 20 percent of this resource had been recovered by the end of the twentieth century (Kerrich and others 2000) Eleven deposits are included in this compilation
Distal disseminated gold deposits are found sedimentary in rocks that may be over a kilometer from igneous intrusions that cooled and crystallized to form porphyry copper deposits (fig 19 see discussion on copper for a description of porphyry copper deposits) These deposits share many of the characteristics of Carlin-type gold deposits except that the hydrothermal fluids are clearly related spatially and genetically to the cooling and crystallization of subduction-related magmas that formed nearby porphyry copper deposits and related replacement and vein deposits (Cox 1992) Gold and silver mineralization is associated with the dissolution of carbonate minerals and the deposition of silica in sedimentary units Silver and gold minerals may be dispersed throughout altered sedimentary rock or be concentrated in narrow veinlets and fractures (Peters and others 2004) Fractures are the most important feature that controlled the flow of hydrothermal fluids and the concentration of gold and silver These deposits have significantly higher silver grades than Carlin-type deposits Long and others (1998) described 25 significant deposits in the United States 1 deposit in Arizona and 4 in Nevada are large enough to include in this compilation Distal disseminated deposits currently being mined in Nevada include McCoy-Cove and Rochester Silver is the dominant commodity in these deposits However they produce significant by-product gold
Epithermal gold deposits form less than a kilometer below the surface of the Earth and typically are found with volcanic rocks that are related to igneous arcs formed at convergent tectonic plate margins (Cooke and Simmons 2000 Hedenquist and others 2000) Typically the volcanic rocks were erupted on the land surface rather than beneath the ocean These deposits commonly are found in young orogens where rocks formed near the surface of the earth are more likely to be preserved These epithermal deposits can be enriched in gold and silver and also can contain minor amounts of zinc lead andor copper
The most common type of deposit forms from hydrothermal fluids that are similar to waters tapped by drilling beneath modern geothermal hot springs In most cases geothermal systems are driven by intrusions located as much as 5 to 6 kilometers below the surface Epithermal gold deposits formed from geothermal systems usually occur several kilometers above the site of the igneous intrusion Gold deposition is initiated as the hydrothermal fluids start to boil when they approach the surface Gold is commonly associated with quartz (silicon oxide) and adularia (potassium aluminum silicate) Gold is concentrated in places where the hydrothermal solutions could easily flow ndash fractures faults and porous volcanic and sedimentary units (fig 26) Ore bodies can extend
18
laterally hundreds or thousands of meters but rarely extend more than 600 meters vertically Clusters of epithermal deposits cover areas that range from a few to several tens of square kilometers If the hydrothermal fluids discharge to the land surface they form boiling hot springs that deposit silica similar to those found today in Yellowstone National Park Long and others (1998) described 129 significant epithermal and hot-spring gold deposits in the United States 11 deposits are large enough to include in this compilation Over 40 percent of the significant and major deposits are in Nevada significant deposits also occur in Alaska Arizona California Colorado Idaho Montana North Carolina New Mexico Oregon South Carolina Utah and Washington Examples of epithermal deposits recently being mined include Round Mountain Mesquite and McLaughlin
Outside of Nevada several other types of major gold deposits are found in the United States Some gold placer deposits and hydrothermal orogenic gold veins were the principle sources of gold production in the 19th and early 20th centuries A belt of hydrothermal porphyry gold deposits is currently being developed in northwestern Canada and south-central Alaska
Orogenic gold veins are associated with major fault zones that occur in orogens formed by convergence of tectonic plates (Hageman and Brown 2000) These fault zones cut regionally metamorphosed rocks of all ages are up to several kilometers wide can be over 100 kilometers long and are nearly vertical These fault zones were the pathways for hydrothermal fluids generated by subduction-related thermal events Scientific studies have not conclusively determined if the hydrothermal fluids have an igneous or metamorphic origin Gold deposition occurred in and near fault zones at depths ranging from 3 to 20 kilometers Gold mineralization is primarily associated with hydrothermal veins that occur near the major fault zones in metamorphic rocks Mineralization in the veins can be traced over 2 kilometers in depth The metamorphic rocks that most commonly host the gold deposits are sedimentary and volcanic rocks that formed at the margins of the converging tectonic plates World-wide quartz-carbonate-gold veins have been found in metamorphic rocks of all ages However most of the mineralized veins in the United States have been found in the Cordilleran orogen in California
The veins are mainly composed of quartz (silicon oxide) with less abundant carbonate minerals Pyrite (iron sulfide) and arsenopyrite (iron arsenic sulfide) constitute less than 5 percent of the veins The main ore mineral in most deposits is native gold The gold in these veins can be abundant coarse-grained and easy to extract However gold is commonly concentrated in rocks next to the veins that are iron-rich and difficult to deform such as banded iron formation (sedimentary rock consisting of alternating iron-rich and silica-rich layers) Examples of quartz-carbonate-gold veins associated with banded iron formation include the Homestake mine in South Dakota
These deposits have been a significant source of historic (and prehistoric) gold production Long and others (1998) described 150 significant orogenic gold deposits primarily in the western United States and Alaska 6 deposits in Alaska California and South Dakota are large enough to include in this compilation Over 70 percent of the significant deposits occur in the western foothills of the Sierra Nevada This belt of quartz-carbonate-gold veins is known as the Mother Lode the discovery of placer gold deposits derived from these veins caused the 1849 gold rush to California
Intrusion-related gold ndash Tintina gold belt Gold exploration has recently focused on igneous intrusions formed at convergent plate margins Upon cooling the magmas generated by subduction at convergent tectonic plate margins can generate hydrothermal
19
fluids that can form porphyry copper deposits (see discussion under copper) or replacement deposits (such as the distal disseminated gold deposits discussed earlier in this section) The association of gold with these particular hydrothermal systems has been known for decades
Recently a new type of gold deposit associated with igneous rocks has been defined (Thompson and Newberry 2000) Like porphyry copper deposits these gold deposits are related to hydrothermal systems formed during the cooling of magmas generated by the convergence and subduction of tectonic plates However the composition of the magma is different from the magmas that are associated with porphyry copper deposits mineralization associated with the hydrothermal systems is characterized by economically significant gold high concentrations of bismuth arsenic antimony and tellurium and low concentrations of copper molybdenum tungsten and tin The best examples of this style of mineralization are associated with a Cretaceous igneous arc in the Cordilleran orogen that extends from the Yukon Territory in Canada to interior Alaska (also known as the Tintina gold belt) However similar gold deposits have been described in subduction-related igneous arcs in Europe central Asia northeast China eastern Australia and Bolivia (Thompson and Newberry 2000) Long and others (1998) described 6 significant intrusion-related gold deposits in the United States (5 in Alaska and 1 in Nevada) 2 deposits Donlin Creek and Fort Knox are large enough to include in this compilation
Placer gold deposits Heavy minerals like gold can be concentrated in sediments by moving water These gold-rich sediments or placers are derived by weathering and erosion of hydrothermal deposits with relatively coarse-grained particles of gold Placer gold deposits can be high grade easy to locate and relatively simple to mine Most of these deposits have been found with little difficulty by prospectors with little or no formal training in geology These deposits usually were the first metal deposits to be discovered and developed in the eastern and western areas of the United States
Placer gold deposits in the United States have produced over 2500 metric tons of gold (Long and others 1998) This represents about 20 percent of the gold production in the United States through 1998 154 significant placer gold deposits have been described in the western conterminous United States and Alaska Most of these deposits are related to the development of the Cordilleran orogen Ten placer deposits in Alaska Arizona California and Wyoming are large enough to include in this compilation (fig 23)
Most placer gold production in the United States came from deposits in California (1170 metric tons) and Alaska (750 metric tons) (Long and others 1998) The largest concentration of gold placer deposits in the United States is along the western side of the Sierra Nevada in California The 1849 gold rush initiated the development of these deposits ultimately producing more than 1000 metric tons of gold These placer deposits as well as some of the larger deposits in Alaska were derived from orogenic gold deposits Most placer gold mining in the United States took place in the 19th and early 20th century Although identified gold resources still remain in placer gold deposits they are unlikely to be developed on a large scale because of the impact to aquatic and riparian environments Small-scale and recreational placer mining will continue to be a minor source of gold production in the United States
Other deposit types Significant quantities of gold are recovered from the porphyry copper deposits in the Cordilleran orogen (see copper discussion) and from volcanogenic massive sulfide deposits in Alaska (see lead-zinc discussion)
20
Iron ore Iron is one of the most abundant elements on Earth but it does not occur in nature
in useful metallic form (Mineral Information Institute USGS and American Coal Foundation undated) Iron ore is the term applied to a natural iron-bearing mineral or rock in which the content of iron is sufficient to be commercially usable Metallic iron from which steel is derived must be extracted from iron ore Iron ore is the source of primary iron for the worlds iron and steel industries Identified world resources are estimated to exceed 800 billion metric tons of crude ore containing more than 230 billion metric tons of iron The United States is ranked seventh in the world in iron ore production and has about 5 percent of the world reserve base (USGS 2004) In 2003 the apparent consumption of useable iron ore in the United States was 56100000 metric tons (USGS 2004) The locations of major iron deposits in the United States are shown in figure 27
Table 6 Iron ore - proportion of world mine production reserves and reserve base for the
United States
[USGS 2004 reserves and reserve base are defined in Appendix 3]
Country Percent of world production 2003
Rank of world production
Percent of world reserves
Percent of world reserve base
United States
45 7 47 46
Most of the iron mined in the United States comes from iron-rich sedimentary
deposits (called banded iron formation or BIF) that occur in Minnesota Michigan and Wisconsin (fig 22) These deposits originally formed flat-lying sedimentary layers but have been tilted and deformed in later orogenic events The most important occurrences are in the Mesabi Marquette and Menominee Ranges (Kuck 1998) Most of the iron production has been from deposits in the Mesabi Range in Minnesota Leading iron producers in 2001 include Hibbing Taconite Co Minntac National Steel Pellet Co and Thunderbird in Minnesota and Empire Iron Mining Partnership and Tilden Mining Co in Michigan (National Mining Association 2003a)
BIF is not unique to this region More than 95 percent of iron resources of the world occur in banded iron formation (Gross 1996a) Banded iron formation is sedimentary rock characterized by alternating iron-rich and silica-rich layers The thickness of individual layers varies from less than a millimeter to meters overall a succession of rock layers may be 100s of meters thick The principal iron minerals are the iron oxides hematite and magnetite Banded iron formation has been found on all continents except Antarctica
Although they are widespread geographically sedimentary iron deposits mostly formed during two periods in the development of the Earth These deposits occur in rocks ranging in age from 38 to about 18 Ga and from 08 to 06 Ga The oldest deposits tend to be smaller and are associated with volcanic rocks The mot extensive deposits of banded iron formation are associated with sedimentary units that formed from oceans during the Late Archean to Early Proterozoic (27 to 19 Ga) Sedimentary iron deposits
21
formed from 08 to 06 Ga are smaller and less widely distributed than the older banded iron formations
The iron resources in BIFrsquos are large because the deposits are laterally extensive The iron minerals formed from ocean water and were deposited uniformly over large areas At the time they were deposited some iron formations and associated sedimentary rocks may have covered over 100000 square kilometers Individual layers in some sequences can be traced for over 100 kilometers The iron-rich deposits may have formed on submerged continental shelves surrounding Archean cratons Younger (Paleozoic) iron-rich sedimentary units ironstones do not show the lamination characteristic of the older banded-iron formations
The origin of banded iron formation is still controversial These deposits are studied because they provide insights into the early evolution of the Earthrsquos atmosphere and oceans (Konhauser and others 2002) They also provide insights on biological processes early in the Earthrsquos history because of the close association of iron and oxygen The iron minerals present today are not those that were chemically precipitated from seawater The present minerals reflect the burial of these rocks in sedimentary basins where the rocks interacted with hydrothermal fluids and grew new minerals as temperature and pressure increased In addition weathering in tropical climates leached silica from some deposits enriching the iron content in these rocks and changing the iron minerals
Iron formation typically contains about 30 percent iron However leaching of silica during weathering can produce iron ores with as much as 66 percent iron From the 1800s until about 1955 most of the iron produced from Minnesota Michigan and Wisconsin was from these naturally-enriched iron ores Since then lower grade iron-formation has been mined and treated to produce taconite pellets The iron formation in Minnesota Michigan and Wisconsin has been metamorphosed In the process grain size of minerals increased and new minerals such as magnetite (iron oxide) formed from pre-existing iron silicate or iron carbonate minerals without significantly changing the amount of iron in the rock Metamorphosed iron formation is called taconite Powerful magnets can concentrate magnetite from pulverized taconite into a rich concentrate containing about 60 percent iron This powder is mixed with clay and water balled and fired in a kiln to make hard pellets The taconite pellets are the product shipped to the foundry to make iron or steel (Schaetzl undated)
Even though iron mining has been important in the upper Great Lakes region for the last 100 years iron-rich resources have not been entirely depleted For example an immense oxidized taconite resource remains undeveloped in the western Mesabi Range (Zanko and others 2003) Economics and advances in non-magnetic iron ore processing technology will help determine if any portion of this resource will be further developed
22
Lead and zinc Lead is a very corrosion-resistant dense ductile malleable blue-gray metal
(Mineral Information Institute USGS and American Coal Foundation undated) The majority of the lead consumed annually is used by the transportation industry mainly for lead-acid batteries Remaining uses include ammunition electrical electronic and communication applications and radiation shields Zinc is also a blue-gray metallic element Because of its anticorrosion properties more than one-half of zinc metal consumed annually is used for galvanizing followed by the production of zinc-based alloys - brass and bronze
About 350 million metric tons of lead has been discovered in the world (Singer 1995) About 20 percent of total lead discovered is in the United States The apparent consumption of lead in the United States in 2003 was 14600000 metric tons (USGS 2004)
Table 7 Lead - proportion of world mine production reserves and reserve base for the
United States
[USGS 2004 reserves and reserve base are defined in Appendix 3]
Country Percent of world production 2003
Rank of world production
Percent of world reserves
Percent of world reserve base
United States
158 3 122 144
About 710 million metric tons of zinc has been discovered (Singer 1995) About
18 percent of total zinc discovered is the United States The apparent consumption of zinc in the United States in 2003 was 1370000 metric tons (USGS 2004)
Table 8 Zinc - proportion of world mine production reserves and reserve base for the
United States
[USGS 2004 reserves and reserve base are defined in Appendix 3]
Country Percent of world production 2003
Rank of world production
Percent of world reserves
Percent of world reserve base
United States
91 5 136 196
Lead and zinc minerals commonly occur together in polymetallic mineral deposits
that form from low-temperature hydrothermal fluids Several types of deposits can be recognized based on the how the hydrothermal fluids were generated and where they moved the distribution of ore minerals in the mineral deposit and the geologic setting The location of major lead and zinc deposits in the United States is shown in figure 28
Two deposit types can form when hydrothermal fluids vent into the ocean For the type geologists call volcanogenic massive sulfide (VMS) deposits cooling of magma
23
either from volcanic rocks erupted on the ocean floor or emplaced in shallow intrusions supplies the heat needed to generate hydrothermal solutions (fig 29) For the type called sedimentary exhalative (sedex) deposits hydrothermal solutions are generated as water-rich sediments are deeply buried in sedimentary basins within the crust (fig 16) For both deposit types hydrothermal solutions move towards the surface along fractures and form hot springs where they vent into the ocean The hydrothermal solutions mix with ocean water and can deposit large quantities of iron zinc lead and copper minerals as mounds and layers on the seafloor
Like porphyry copper deposits VMS deposits are associated with magma that is generated at convergent plate boundaries However these deposits are associated with the eruption of volcanic rocks under water Unlike porphyry copper deposits they are found in rocks of all ages The oldest deposits in Archean rocks have less lead than younger deposits Deposits of all ages also can contain copper gold and silver
VMS deposits are a common deposit type and are widely distributed in orogenic belts around the world Long and others (1998) identifies over 77 significant VMS deposits in the United States They are associated with igneous arcs developed in the Cordilleran orogen (including deposits in the Brooks Range in Alaska in southeast Alaska and the Sierra foothills in California) and the Paleozoic igneous arcs of the Appalachian orogen Proterozoic VMS deposits are associated with orogenic igneous arcs developed in what is now Wisconsin and Arizona However only three deposits Arctic Camp Greens Creek and Crandon were large enough to include in this compilation The deposit at Greens Creek is currently being mined Arctic Camp and Crandon have not been developed
Sedex deposits are found in sedimentary basins characterized by high geothermal gradients (Lydon 1988 Lydon 1996) These basins commonly form as continents are pulled apart or rifted Sedex deposits typically occur in large basins sometimes filled with more than 10 kilometers of sediments Copper is rarely present in sedex deposits but silver may be present in economic amounts Globally sedex deposits are younger than 1800 million years No sedex deposits older than 1300 million years are known from the United States Sedex deposits occur less frequently than VMS deposits Long and others (1998) lists 6 significant sedex deposits in the United States 3 are large enough to include in this report (Red Dog Su-Lik and Pierrepont-Balmat-Edwards) The Red Dog lead-zinc deposit in the Brooks Range of Alaska is the single largest zinc deposit in the world and presently supplies 10 percent of the worlds zinc (Leach undated)
Mississippi Valley-type deposits Another type of lead-zinc deposit also forms from hydrothermal fluids generated in a sedimentary basin However in these deposits the hydrothermal fluids move through underground formations that can store or transmit water until they mix with other fluids and deposit minerals in open cavities in carbonate sedimentary rocks Geologists refer to these mineral bodies as Mississippi Valley-type (MVT) deposits (Sangster 1996) The movement of hydrothermal fluids in the sedimentary basins is driven by plate boundary interactions These deposits form in the relatively undeformed sedimentary rocks that occur inland from orogenic belts formed at convergent plate margins Long and others (1998) described 22 MVT deposits in the United States 6 deposits in Missouri Oklahoma Kansas Tennessee and Kentucky are large enough to include in this compilation Historically MVT deposits accounted for 57 percent of lead and 45 percent of zinc production in the United States
The genesis of MVT lead-zinc ores is directly related to enormous hydrothermal systems generated by the uplift of sedimentary basins that developed as orogens form at
24
convergent tectonic plate boundaries (Leach and others 2001 Leach and Rowan 1986) As orogens develop the crust may subside between the main orogenic belt and the relatively undeformed continental craton (Moores and Twiss 1995 Busby and Ingersoll 1995) This zone of subsidence forms on the side of the orogenic belt away from the zone of active subduction Sediments derived by erosion of the mountains formed during the orogenic process are deposited in this area of crustal subsidence forming sedimentary basins Sedimentary rocks in the basin can reach a thickness of about 10 kilometers near the mountain front Away from the orogen these sedimentary rocks are only slightly deformed However near the mountain front these sedimentary rocks are commonly uplifted and deformed by folds and faults late in the development of the orogen
Uplift of the sedimentary basin allows gravity to drive hydrothermal fluids out of the basin and on to the adjacent platform (fig 30 Leach and others 2001) MVT deposits generally form in carbonate-rich sedimentary rocks that overlie the relatively undeformed continental craton and had some hydrologic connection to the sedimentary basins developed adjacent to the orogenic belts Hydrothermal fluids that formed most MVT mineral deposits have migrated considerable distances into relatively undisturbed rocks The deposits occur where local geological and hydrological features focused the migrating hydrothermal fluids into areas where they could mix with other fluids or react with rocks and precipitate ore minerals
MVT deposits are found world-wide but the largest deposits occur in North America (Leach and others 2001) Most deposits formed in response to hydrothermal systems developed during two large subduction-related tectonic events during the Devonian to Late Permian and again during the Cretaceous and Tertiary The Devonian to Late Permian event is the most important and corresponds to the assembly of the supercontinent known as Pangea During the assembly of Pangea convergence of tectonic plates towards the North American craton formed both the Ouchita and Appalachian orogens In the United States the world-class Viburnum Trend Old Lead Belt and Tri-State MVT deposits are found in the Ozark region north of the Ouachita orogen (fig 31) The Ouchita orogen formed as the result of closure of a Paleozoic ocean basin and the late Paleozoic collision of the Llanorian and North American plates (Leach and Rowan 1986) Sedimentary basins like the Arkoma basin formed on the northern flank of the Ouchita orogen in response to crustal down warping and rapid sedimentation accompanying the orogeny At least 12 kilometers of sediments were deposited on the southern edge of the Arkoma basin Deformation of the Arkoma basin and uplift of the Ouachita Mountains caused hot subsurface brines (water containing at least 100000 parts per million dissolved salts Harben and Kužvart 1996) to migrate onto the southern flank of the North American craton and formed MVT lead-zinc deposits in the Ozark region of Missouri Arkansas Kansas and Oklahoma Other MVT deposits occur intermittently along the west side of the Appalachian orogen and probably formed from hydrothermal systems generated from this orogenic system
25
Molybdenum Molybdenum is a metallic element used principally as an alloying agent in cast
iron steel and super alloys to enhance hardness strength toughness and wear and corrosion resistance (Mineral Information Institute USGS and American Coal Foundation undated) Identified molybdenum resources of the world are about 18 million metric tons (USGS 2004) The apparent consumption of molybdenum in the United States in 2003 was 13900 metric tons The location of major molybdenum deposits in the United States is shown in figure 32
Table 9 Molybdenum - proportion of world mine production reserves and reserve base
for the United States
[USGS 2004 reserves and reserve base are defined in Appendix 3]
Country Percent of world production 2003
Rank of world production
Percent of world reserves
Percent of world reserve base
United States
268 1 314 268
The United States ranks first in world production of molybdenum and has a large
proportion of the world reserve base Generally molybdenum is produced as a byproduct of mining copper in particular porphyry copper deposits
Porphyry copper deposits Hydrothermal copper mineral deposits associated with composite volcanoes are called porphyry-type deposits by geologists (figs 19 and 20) This type of hydrothermal copper mineralization forms deep beneath steep-sided volcanoes that form as magma rises to the surface along subduction zones Porphyry copper deposits are derived from hydrothermal fluids released from and driven by the cooling magma deep within the volcano As the fluids cool and react with rocks copper and other metals such as molybdenum is deposited both in the igneous porphyry intrusions as well as adjacent rocks (fig 19)
Molybdenum is recovered as a by-product of mining copper from porphyry copper deposits Eight of the 9 top producing mines developed on porphyry copper deposits are in southeast Arizona and southwestern New Mexico (National Mining Association 2003a) The remaining deposit is in Utah These ore bodies also are an important source of gold and silver
Porphyry molybdenum deposits Some hydrothermal deposits are mined principally for their molybdenum contents Carten and others (1993) identified 25 molybdenum or molybdenum-copper deposits in the United States that are related to felsic rocks (composed primarily of feldspar (sodium and potassium aluminosilicate) and quartz (silicon oxide)) Thirteen are large enough to include in this compilation Four of these deposits are associated with continental igneous arcs that formed as a result of subduction of tectonic plates analogous to the geologic setting previously described for porphyry copper deposits A complete continuum exists between subduction-related porphyry copper deposits (that contain some molybdenum) and porphyry molybdenum deposits (with some copper) Subduction-related molybdenum-copper deposits tend to be low grade and have low fluorine contents
26
However nine of the hydrothermal molybdenum deposits included in the compilation are associated with magmas that are generated when continental crust is pulled apart These Climax-type molybdenum deposits formed from hydrothermal fluids derived from shallowly-emplaced silica- and fluorine-rich magmas in continental rifts (Carten and others 1993) Magmas associated with the continental rift-associated deposits in the United States do not appear to be related to mantle plumes Instead the magmas are generated as hot mantle rises and melts in areas where continental tectonic plates are being pulled apart following a period of subduction-related magmatism The molybdenum deposits tend to be found far from continental margins in areas of thick continental crust (Ludington 1986) Many of the deposits in this compilation are associated with a Tertiary continental rift Colorado and New Mexico today the Rio Grande River follows this partially-filled rift valley Climax-type molybdenum deposits tend to have higher molybdenum grades than the subduction-related deposits
Like porphyry copper deposits economic porphyry molybdenum deposits (both subduction-related and rift-related) are primarily Cretaceous and Tertiary in age (Carten and others 1993)
27
Platinum-group elements and nickel The platinum-group elements (PGE) are platinum palladium rhodium iridium
ruthenium and osmium In general platinum-group elements exhibit high density high electrical conductivity high melting points and low reactivity (Mineral Information Institute USGS and American Coal Foundation undated) Platinum is used in automobile pollution abatement systems jewelry and catalysts to produce industrial chemicals Palladium is used in automobile pollution abatement systems electronic components process catalysts and dental alloys Identified world resources of platinum-group elements in mineral concentrations that can be mined economically are estimated to total more than 100 million kilograms (USGS 2004) In 2003 the United States imported 111000 kilograms platinum and 73000 kilograms palladium for consumption (USGS 2004) For the same year mine production in the United States was 4100 kilograms platinum and 14600 kilograms palladium
Table 10 Platinum-group elements - proportion of world mine production reserves and
reserve base for the United States
[USGS 2004 reserves and reserve base are defined in Appendix 3]
Country Platinum percent of world
production 2003
Palladium percent of world
production 2003
Palladium Rank of world
production
PGE Percent of world reserves
PGE Percent of world
reserve base United States
22 85 3 13 25
Nickel is a silvery metallic element (Mineral Information Institute USGS and
American Coal Foundation undated International Nickel Study Group undated) About 65 per cent of nickel is used to manufacture stainless steels and 20 per cent in other steel and non-ferrous (including super) alloys often for highly specialized industrial aerospace and military applications About 9 per cent is used in plating and 6 per cent in other uses including coins and a variety of nickel chemicals Globally identified land-based resources averaging 1 percent nickel or greater contain at least 130 million metric tons of nickel (USGS 2004) In 2003 the apparent primary consumption of nickel in the United States was 218000 metric tons (USGS 2004) No mine projection reserves or reserve base of nickel have been reported in the United States (USGS 2004) However magmatic mineral deposits that PGE commonly contain nickel and copper Nickel is recovered from the magmatic PGE deposit in the Stillwater Complex Montana a large resource of nickel is associated with copper and PGE-bearing rocks of the Duluth Complex in Minnesota (figure 15)
Magmatic PGE deposit in the Stillwater Complex Montana A major palladium-platinum deposit in south-central Montana the J-M Reef is currently the sole source of primary PGE production and reserves in the United States This deposit is associated with igneous activity that probably resulted from an Archean mantle plume event (Ernst and Buchan 2001) The only geologic feature that is attributed to this event is an igneous intrusion the Stillwater Complex Layers of igneous rock characterized by different proportions sizes and shapes of igneous minerals formed when this intrusion
28
cooled and crystallized In the Stillwater Complex over 5500 meters of layered rocks are exposed Igneous layering is an uncommon phenomenon the minerals in most igneous intrusions are homogeneously distributed
Layered igneous intrusions like the Stillwater Complex are economically important because they can host magmatic mineral deposits containing economic concentrations of chromium nickel copper titanium and platinum-group elements (Zientek and others 2002) The mineralization can also occur as layers within the intrusion that also may be enriched in chromium or titanium and vanadium sulfide mineralization variably enriched in PGE can also occur in the rocks that crystallized near the margin of the intrusion (fig 33) The palladium-platinum deposit at Stillwater the J-M Reef is a 1- to 3 m-thick layer that contains 05 to 3 volume percent PGE-enriched sulfide minerals The sulfide minerals represent the crystallization products of an immiscible sulfide liquid that formed by the mixing of two magmas in the intrusion The J-M Reef sulfide mineralization has been traced for 42 kilometers along the extent of the intrusion and at least a kilometer down the dip of layering The average grade is 19 grams per ton palladium and platinum with a palladium- to platinum ratio of 34 to 1 Geologic resource estimates range from 116 to 421 million metric tons of ore containing 188 grams per ton palladium plus platinum Two mines the Stillwater mine and the East Boulder mine are developing this deposit
Mineral deposits similar to the J-M Reef in the Stillwater Complex are the major source of platinum in the world (Sutphin and Page 1986 Cawthorn 1999) The largest deposit the Merensky Reef is in South Africa An analogous deposit also is being mined in Zimbabwe Although the J-M Reef is smaller than these deposits in Africa it has the highest overall concentration of platinum-group elements
Magmatic copper-nickel-PGE deposits in the Duluth Complex Approximately 11 Ga a mantle plume is thought to have developed under what is now the area around Lake Superior This plume event was associated with the eruption of lavas and emplacement of igneous intrusions between 1109 and 1087 Ma along a linear belt where the earthrsquos crust subsided forming a rift valley The rift extends for more than 2500 kilometers from Kansas northward beneath Lake Superior and then southeast through Michigan (fig 13) however exposures of rocks related to the rift are only found in the Lake Superior region (Schulz and Cannon 1997) Igneous rocks associated with this event cover more than 160000 square kilometers (Ernst and Buchan 2001) The largest of the intrusions is known as the Duluth Complex (fig 22 Miller Green and others 2002) When this intrusion was emplaced it reacted with the surrounding rocks resulting in the formation and segregation of immiscible liquids containing copper nickel platinum-group elements and cobalt As a result large volumes of rock with a few percent sulfide minerals occur along the western margin the Duluth Complex locally the rocks are made up almost entirely of sulfide minerals Exploration activity has delineated several low-grade nickel-copper deposits in these rocks that have local zones enriched in platinum-group elements At this time no mines are developing these resources Listerud and Meineke (1977) estimate the resources along the western margin of the complex to be 4400 million short tons of rock containing 066 percent copper and 020 percent nickel This represents the largest known nickel resource in the United States and is one of the largest in the world Subsequent exploration has focused on three deposits ndash Dunka Road (the Northmet project) Babbitt (the Mesaba project) and Maturi An open pit minable resource of 808 million metric tons containing 0432 percent copper 0109 percent nickel 0166 grams per ton platinum 0437 grams per ton palladium 0061
29
grams per ton gold and 15 grams per ton silver has been defined at the Northmet project (Polymet Mining Corporation 2003) PGE along with copper and nickel will be recovered when these deposits are developed Worldwide this type of large tonnage low grade copper-nickel-PGE mineralization is relatively uncommon Similar deposits are known in South Africa Finland Australia Canada and Russia
30
Rare-earth elements The rare-earth elements (REE) are a group of 17 elements that include scandium
yttrium and the lanthanides The lanthanides a group of 15 elements with atomic numbers 57 through 71 are lanthanum cerium praseodymium neodymium promethium samarium europium gadolinium terbium dysprosium holmium erbium thulium ytterbium lutetium (Mineral Information Institute USGS and American Coal Foundation undated) The REE are a chemically coherent group of elements with diverse nuclear metallurgical chemical catalytic electrical magnetic and optical properties Uses of REE range from the ordinary such as glass polishing and lighter flints to high-tech such as liquid crystal displays fiber-optic cables and potentially magnetic refrigeration In 2002 the approximate distribution by end use was petroleum refining catalysts 27 percent glass polishing and ceramics 23 percent automotive catalytic converters 21 percent metallurgical additives and alloys 15 percent permanent magnets 5 percent rare-earth phosphors for lighting televisions computer monitors radar and X-ray intensifying film 4 percent and other uses 5 percent (USGS 2004)
REE are relatively abundant in the Earthrsquos crust but minable concentrations are uncommon United States and world resources are contained primarily in the minerals bastnaumlsite a rare-earth fluorocarbonate mineral and monazite a rare-earth phosphate mineral (USGS 2004) Bastnaumlsite deposits in China and the United States make up the largest proportion of the worldrsquos identified economic resources of REE ion-absorption clays are also a significant source of REE in China The remaining resources are monazite deposits located in Australia Brazil China India Malaysia South Africa Sri Lanka Thailand and the United States (USGS 2004) In the United States production is from a single deposit Mountain Pass in California (fig 27) Until the mid-1960s almost all REE production was derived from monazite-bearing placer deposits (Haxel and others 2002) In 1965 bastnaumlsite production began at the Mountain Pass deposit this single deposit dominated world REE supply until the mid-1980s The United States was once largely self-sufficient in REE but has become a net importer in the last decade with more than 90 percent of US industry needs now supplied by deposits mined in China (Haxel and others 2002)
Table 11 Rare-earth elements - proportion of world mine production in 2002 and 2003
reserves and reserve base for the United States
[USGS 2004 reserves and reserve base are defined in Appendix 3]
Country Percent of world production 2002
Percent of world production 2003
Rank of world production 2002
Percent of world
reserves
Percent of world reserve
base United States
51 none 2 148 91
REE in the United States are associated with uncommon and unusual igneous
rocks (carbonatites) and with surficial (placer) deposits Carbonatites The worldrsquos largest REE deposits are associated with igneous
rocks called carbonatites Carbonatites contain more than 50 percent by volume carbonate
31
minerals with calcite (calcium carbonate) and dolomite (calcium magnesium carbonate) most common These carbonate-rich rocks commonly are part of larger complexes of alkaline intrusive and volcanic igneous rocks containing relatively high concentrations of potassium and sodium Magmas that can crystallize large amounts of carbonate minerals are unusual only about 330 carbonatites are known worldwide (Woolley 1989) Igneous intrusions with carbonatite occur mainly on continents they rarely are in an oceanic setting The intrusions generally are found near large fractures in continental crust that formed as plate tectonic activity was stretching or extending the continental crust Weathering of these deposits can generate REE-enriched soils
The most important REE deposit in the United States Mountain Pass in California is associated with carbonatite The REE mineralization is dominated by bastnaumlsite (rare-earth fluorocarbonate) with lesser parasite (a calcium rare-earth fluorocarbonate) monazite (rare-earth phosphate) allanite (rare-earth silicate) and other REE-bearing minerals The economic potential of the Hicks Dome carbonatite in Illinois also has been evaluated At least seven other carbonatites with REE mineralization are known to occur in the US but are not considered to be economically viable sources of REE at the present time
Alkaline deposits other than carbonatites REE occur in a wide variety of alkaline igneous (enriched in sodium and potassium) and hydrothermally-altered rocks other than carbonatite The REE ore minerals in these deposits include eudialyte (hydrated zirconium silicate with sodium calcium rare-earth elements and iron) loparite (titanium-niobium oxide with cerium sodium and calcium) allanite (rare-earth silicate) and REE-bearing zircon (zirconium silicate) These deposits are significant producers of byproduct REE in Russia and byproduct production has occurred from deposits in China and Brazil The United States has resources in this type of deposit at Bokan Mountain and Mt Prindle in Alaska and at Wind Mountain (Cornudas Mountains) and Pajarito Mountain in New Mexico (Woolley 1987)
Placer deposits In placer deposits the action of water tends to concentrate minerals of higher density that are resistant to abrasion through transport and to breakdown by chemical and mechanical action Because many of these minerals are dense and (or) dark colored these placer deposits are referred to as heavy mineral sands or as black sand placers Minerals concentrated in this process include gold ilmenite (iron titanium oxide) cassiterite (tin oxide) rutile (titanium oxide) zircon (zirconium silicate) monazite (rare-earth phosphate) xenotime (yttrium phosphate) and many others Although monazite and xenotime contents of these placers are typically fairly low these minerals have been extracted as byproducts of titanium tin and gold placer mining operations in the past Recovery of byproduct monazite has been discontinued in recent years due to concerns related to the thorium content of most monazite While thorium is not radioactive thorium has radioactive daughter products Historically the United States has produced monazite from Idaho and the southeast United States and significant reserves are still present
32
Silver Silver is a metal that has been used for thousands of years in jewelry ornaments
and utensils and as the basis of many monetary systems (Mineral Information Institute USGS and American Coal Foundation undated) Industrial applications of silver include electrical and electronic products mirrors and photography which is the largest single end use of silver Silvers catalytic properties make it ideal for use as a catalyst in oxidation reactions Over 17 million metric tons of silver has been discovered in the world (Singer 1995) In 2003 the apparent consumption of silver in the United States was 5430 metric tons (USGS 2004) About 21 percent of total silver discovered is in the United States The location of major silver deposits in the United States is shown in figure 34
Table 12 Silver - proportion of world mine production reserves and reserve base for the
United States
[USGS 2004 reserves and reserve base are defined in Appendix 3]
Country Percent of world production 2003
Rank of world production
Percent of world reserves
Percent of world reserve base
United States
68 5 92 141
More than two-thirds of the worldrsquos silver resources are associated with copper
lead and zinc deposits The remainder is associated with hydrothermal gold deposits Historically the largest proportion of silver production in the United States has come from polymetallic replacement deposits Coeur drsquoAlene polymetallic veins and polymetallic veins (Long and others 1998) Remaining resources associated with these deposit types are relatively small and mining has ceased except for two mines on Coeur drsquoAlene polymetallic veins
Currently the largest silver-producing mines in the United States are developed on VMS deposits sedex deposits distal disseminated gold-silver deposits Coeur drsquoAlene polymetallic veins and porphyry copper deposits (Hilliard 2002) The majority of the identified remaining silver resources in the United States are associated with porphyry copper deposits Revett copper deposits and VMS deposits (Long and others 1998) Silver production from epithermal deposits has been and will continue to be important In the following sections VMS and sedex deposits are discussed first followed by sections on Coeur drsquoAlene veins and Revett copper deposits Deposits related to the igneous activity in subduction zones (porphyry copper deposits polymetallic replacement deposits and epithermal deposits) are discussed last
VMS and sedex deposits Lead zinc and silver commonly occur together in mineral deposits that form from low-temperature hydrothermal fluids In particular two different-types of lead zinc and silver deposit types can form when hydrothermal fluids vent into the ocean For the type geologists call volcanogenic massive sulfide (VMS) deposits cooling of magma either from volcanic rocks erupted on the ocean floor or emplaced in shallow intrusions supplies the heat needed to generate hydrothermal solutions (fig 29) For the type called sedimentary exhalative (sedex) deposits
33
hydrothermal solutions are generated as water-rich sediments are deeply buried in sedimentary basins within the crust (fig 16) For both deposit types hydrothermal solutions move towards the surface along fractures and form hot springs where they vent into the ocean The hydrothermal solutions mix with ocean water and can deposit large quantities of iron zinc lead silver and copper minerals as mounds and layers on the seafloor
VMS deposits are associated with magma that is generated at convergent plate boundaries VMS deposits are a common deposit type and are widely distributed in orogenic belts around the world Long and others (1998) identifies over 77 significant VMS deposits in the United States They are associated with igneous arcs developed in the Cordilleran orogen (including deposits in the Brooks Range in Alaska in southeast Alaska and the Sierra foothills in California) and the Paleozoic igneous arcs of the Appalachian orogen Proterozoic VMS deposits are associated with orogenic igneous arcs developed in what is now Wisconsin and Arizona However only three deposits Arctic Camp Greens Creek and Crandon were large enough to include in this compilation The deposit at Greens Creek is currently being mined Arctic Camp and Crandon have not been developed
Sedex deposits are found in sedimentary basins characterized by high geothermal gradients (Lydon 1988 Lydon 1996) These basins commonly form as continents are pulled apart or rifted Sedex deposits typically occur in large basins sometimes filled with more than 10 kilometers of sediments Sedex deposits occur less frequently than VMS deposits Long and others (1998) lists 6 significant sedex deposits in the United States 3 are large enough to include in this report silver is reported in two of these deposits (Red Dog and Su-Lik)
Coeur dAlene-type polymetallic vein deposits - Since the 1880s the Coeur dAlene mining district has produced more than 30000 metric tons of silver more than any silver mining district in the world with the exception of Cerro Rico de Potosi in Bolivia (Long 1998) Total production from the Coeur drsquoAlene district accounts for more than 28 percent of historic production of silver in the United States In addition to silver veins in this district have also produced significant amounts of lead and zinc with lesser amounts of copper gold cadmium and cobalt This style of silver-lead-zinc mineralization is unique to this mining district Long and others (1998) described 26 significant deposits in the Coeur drsquoAlene district in northern Idaho 5 deposits are large enough to include in this compilation Two mines the Galena and the Lucky Friday are still active and ranked 4th and 7th in United States silver production in 2002 (Hilliard 2002) Resources measured for the Lucky Friday mine and the Galena mine are 655 million metric tons containing 538 grams per ton silver 102 percent lead and 16 percent zinc and 63 million metric tons containing 777 grams per ton silver 08 percent copper 015 percent lead and 003 percent antimony respectively (Long 1998)
Coeur dAlene (CDA)-type polymetallic vein deposits are clustered near large faults that cut metamorphosed sedimentary rocks of the Belt basin (Hobbs and Fryklung 1968) The middle Proterozoic Belt basin covers 200000 square kilometers and extends from Idaho Montana and Washington north into Canada (fig 17 Chandler 2000) These faults are the western end of a complex system of faults that extend from northern Idaho to south-central Montana (Smith 1965) These near vertical faults have a long and complex history of movement The zone affected by faulting is up to several kilometers wide The veins occur in fractures that develop near the large faults in any metamorphosed sedimentary rock derived from fragments of older rocks However
34
silver-lead-zinc ore bodies are commonly found in rocks that are relatively more difficult to deform such as quartzite (quartz (silicon oxide)-rich metamorphosed sedimentary rock)
There are literally hundreds of veins both mineralized and barren that belong to the main period of lead-zinc-silver mineralization of the Coeur drsquoAlene district (Hobbs and Fryklung 1968) Most of the veins range in width from a few millimeters up to 3 meters Unmineralized veins are composed mainly of quartz (silicon oxide) and carbonate minerals Mineralized veins also contain various proportions of galena (lead sulfide) sphalerite (zinc-iron sulfide) and tetrahedrite (copper-iron-zinc-silver-antimony sulfide) Some veins are mined mostly for lead and zinc whereas others are mined mostly for silver (Box and others 1995 Long 1998) The mineralized portions of veins are called ore shoots The vertical dimensions of ore shoots are several times longer than their horizontal dimensions Measured horizontally individual ore shoots range in length from several meters to over 1 kilometer The vertical dimension of ore shoots can exceed 2 kilometers
The faults and the veins formed late in the sequence of events that deformed and metamorphosed the sedimentary rocks (Hobbs and Frykland 1968) These veins are deposited from hydrothermal fluids generated by metamorphism of the sedimentary rocks (Fleck and others 2002) Subduction-related magmatism that formed a Cretaceous batholith (large mass of igneous intrusions) in Idaho may have been the thermal event that initiated the metamorphism of the rocks and caused long-distance migration of hydrothermal fluid The fault zones were the pathways that controlled the migration of the hydrothermal fluids
Revett copper deposits Revett copper deposits are lens-shaped bodies of disseminated copper sulfides with silver that occur in a narrow interval of sedimentary layers in a large sedimentary basin (Hayes and Einaudi 1986 Hayes and others 1989 Hayes 1990 Cox and others 2003) However mineralization does not necessarily conform to sedimentary bedding These deposits form after the host sediment is deposited but in most cases before the sediment is converted into solid rock The ore minerals appear to have been deposited from waters that filled pores between the sediment particles These copper deposits are formed where waters of different composition and temperature mix in the subsurface in porous sedimentary rocks The distribution of minerals in the rocks that host the deposit indicate that the sulfide minerals were deposited as warm salty metal-bearing water (brine) moved through the porous beds and mixed with cool pre-existing pore water
Revett-type copper deposits occur in quartzite beds (quartz-rich metamorphosed sedimentary rocks) of the Revett Formation in the Belt basin a middle Proterozoic sedimentary basin (figs 17 and 21 Harrison 1972) This basin formed about 15 Ga when a rift developed on a supercontinent that was made up of most of North America along with Siberia Australia or Antarctica filled with sediment (Chandler 2000 Lydon 2000) The sediment layers were originally deposited on the bottom of a lake or an embayment open to the ocean As layers were buried by younger sediments their pore waters become warmer and contained more dissolved components The pressure of the overlying sediments and the high geothermal gradients associated with basins that form as continents are pulled apart can ultimately drive these warm brines upwards along faults that were active during deposition of the basin Fluid mixing responsible for mineral deposition occurred as these brines moved vertically through the section and laterally into the porous sediment layers that ultimately were converted into quartzite
35
Long and others (1998) described 9 significant Revett-type copper deposits 2 deposits are large enough to include in this compilation The median size of a Revett-type sediment-hosted copper deposit is 14 million metric tons with 079 percent copper and 31 grams per ton silver (Cox and others 2003) The largest deposit Rock Lake-Rock Creek contains approximately 300 million metric tons of ore containing 081 percent copper and 71 grams per ton silver
Porphyry copper deposits Hydrothermal copper mineral deposits associated with composite volcanoes are called porphyry-type deposits by geologists (figs 19 and 20) This type of hydrothermal copper mineralization forms deep beneath steep-sided volcanoes that form as magma rises to the surface along subduction zones Porphyry copper deposits are derived from hydrothermal fluids released from and driven by the cooling magma deep within the volcano As the fluids cool and react with rocks copper and other metals such as silver is deposited both in the igneous porphyry intrusions as well as adjacent rocks (fig 19) Silver along with gold and molybdenum is recovered as a by-product of mining copper from porphyry copper deposits Eight of the 9 top producing mines developed on porphyry copper deposits are in southeast Arizona and southwestern New Mexico (National Mining Association 2003a) The remaining deposit is in Utah
Polymetallic replacement deposits form when hydrothermal solutions generated and driven by the cooling of volcanic rock and shallow igneous intrusions flow into nearby carbonate sedimentary rocks (Nelson 1996) The igneous activity is related to igneous arcs developed by subduction of oceanic crust beneath the western margin of the United States Polymetallic replacement deposits are typically associated with but distal from porphyry copper mineralization (figs 19 and 20) Ore minerals typically galena (lead sulfide) sphalerite (zinc-iron sulfide) tetrahedrite (copper-iron-zinc-silver-antimony sulfide) and other silver sulfosalts (minerals that contain silver a semi-metal such as antimony or arsenic and sulfur) can be deposited along bedding related to dissolution of carbonate sedimentary rocks and fracture zones to form irregularly shaped orebodies that can form horizontal sheets (mantos) parallel to sedimentary bedding or veins or pipes discordant to bedding These deposits are variably enriched in silver lead and zinc Long and others (1998) described 45 significant polymetallic replacement deposits in the United States 8 deposits in Arizona Colorado Nevada and Utah are large enough to include in this compilation The mines on these major deposits are now closed
Distal disseminated gold deposits are found sedimentary rocks that may be over 1 kilometer from igneous intrusions that cooled and crystallized to form porphyry copper deposits (fig 19) Gold and silver mineralization is associated with the dissolution of carbonate minerals and the deposition of silica in sedimentary units Silver and gold minerals may be dispersed throughout altered sedimentary rock or be concentrated in narrow veinlets and fractures (Peters and others 2004) Fractures are the most important feature that controlled the flow of hydrothermal fluids and the concentration of gold and silver Long and others (1998) described 25 significant deposits in the United States 1 deposit in Arizona and 4 in Nevada are large enough to include in this compilation Examples of distal disseminated deposits currently being mined in Nevada include McCoy-Cove and Rochester
Epithermal gold deposits form less than a kilometer below the surface of the Earth and typically are found with volcanic rocks that are related to igneous arcs formed at convergent tectonic plate margins (Cooke and Simmons 2000 Hedenquist and others
36
2000) Typically the volcanic rocks were erupted on the land surface rather than beneath the ocean These deposits commonly are found in young orogens where rocks formed near the surface of the earth are more likely to be preserved These epithermal deposits can be enriched in gold and silver and also can contain minor amounts of zinc lead andor copper
The most common type of deposit forms from hydrothermal fluids that are similar to waters tapped by drilling beneath modern geothermal hot springs In most cases geothermal systems are driven by intrusions located as much as 5 to 6 kilometers below the surface Epithermal gold deposits formed from geothermal systems usually occur several kilometers above the site of the igneous intrusion Gold and silver deposition is initiated as the hydrothermal fluids start to boil when they approach the surface Gold and silver are commonly associated with quartz (silicon oxide) and adularia (potassium aluminum silicate) Gold and silver are concentrated in places where the hydrothermal solutions could easily flow ndash fractures faults and porous volcanic and sedimentary units (fig 26) If the hydrothermal fluids discharge to the land surface they form boiling hot springs that deposit silica similar to those found today in Yellowstone National Park Long and others (1998) described 129 significant epithermal and hot-spring gold deposits in the United States 11 deposits are large enough to include in this compilation Over 40 percent of the significant and major deposits are in Nevada significant deposits also occur in Alaska Arizona California Colorado Idaho Montana North Carolina New Mexico Oregon South Carolina Utah and Washington Examples of epithermal deposits recently being mined include Round Mountain Mesquite and McLaughlin
37
Titanium Titanium is a hard silvery-white metallic element found in the minerals ilmenite
leucoxene and rutile (Mineral Information Institute USGS and American Coal Foundation undated Rio Tinto 2001) Titanium dioxide (TiO2) is worldrsquos premier white pigment in the coatings and plastics industry which accounts for nearly all of its industrial applications Titanium dioxide is non-toxic and biologically inert so is used for coloring in foodstuffs like flour icing sugar sweets cosmetics and toothpaste Titanium metal is strong yet lightweight About 65 percent of the titanium metal is used in aerospace applications the remaining 35 percent is used in medical sporting goods and other applications Ilmenite supplies about 90 percent of the worldrsquos demand for titanium minerals Identified world ilmenite resources total about 1 billion metric tons of titanium dioxide (USGS 2004) Identified world resources of rutile (including anatase) total about 230 million metric tons of contained TiO2 The location of major titanium deposits in the United States is shown in figure 27
Table 13 Titanium concentrate (ilmenite) - proportion of world mine production reserves
and reserve base for the United States
[USGS 2004 reserves and reserve base are defined in Appendix 3]
Country Percent of world production 2003
Rank of world production
Percent of world reserves
Percent of world reserve base
United States
70 5 14 80
Economic titanium mineralization occurs as primary deposits formed by igneous
processes or secondary (surficial) deposits formed by weathering and sedimentary processes In primary deposits concentrations of titanium-enriched minerals form during the crystallization of igneous rocks (Gross 1996b) Production of titanium from primary deposits in the United States is largely of historical interest (Harben and Kužvart 1996) Large reserves of primary titanium minerals occur in an igneous rock called anorthosite in the Adirondack Mountains of New York State However production from these deposits ended in the 1970s Secondary deposits form as titanium-rich minerals are weathered from rocks Titanium-enriched minerals are heavier than many other minerals flowing water will concentrate these heavy minerals in sediments (Harben and Kužvart 1996) Most production and known reserves of titanium in the United States occur in heavy-mineral sand deposits These deposits are known to occur on the United States Atlantic and Gulf coastal plains from New Jersey to Florida (Harben and Kužvart 1996) The deposits formed on the shoreline of the ocean however they are not restricted to the present-day coast Sea-level has risen or lowered many times due to expansion or contraction of the polar ice caps in the last 16 million years As a result heavy-mineral sand deposits can now be found inland 10s of meters above current sea-level or off-shore on the continental shelf
The largest secondary deposit in the United States is Trail Ridge in Florida (fig 35) Trail Ridge is the largest of several long low north-trending heavy-mineral enriched sand ridges in Florida (Force 1991 httptapestryusgsgovfeatures43trailridgehtml
38
accessed May 6 2004) The Trail Ridge deposit is part of a 200-km long sand ridge that extends from north-central Florida to southeastern Georgia (Harben and Kužvart 1996) The commercial section of Trail Ridge is 27 kilometers long and 15 to 3 kilometers wide It has an average thickness of 12 meters and contains on average 35 percent heavy minerals About half of these heavy minerals contain titanium Other heavy-mineral bearing sand ridges in northern Florida and southern Georgia include Green Cove Springs Folkston Boulogne Jacksonville and Mineral City (Ponte Vedra) (fig 35 Harben and Kužvart 1996) These ridges are complexes of sand dunes formed near the shoreline during different stands of sea-level during the Pleistocene The titanium minerals were ultimately derived from rocks in the southern Appalachian Mountains DuPont has extracted heavy minerals from Trail Ridge sands since 1949 (httpwwwtitaniumdupontcomNASAppTTPORTALMediatoraction=230 accessed May 6 2004) Major shoreline deposits of heavy-mineral sands are also mined in Australia and have been discovered in Africa smaller shoreline deposits have been developed in India and Sri Lanka
39
Industrial materials
Barite Barite is a mineral comprised of barium sulfate Barite is relatively soft but is
unusually heavy for a nonmetallic mineral (Mineral Information Institute USGS and American Coal Foundation undated) The high density is responsible for its value in many applications Barite is chemically inert and insoluble Nearly 98 percent of the barite used in the United States is as a weighting agent in oil- and gas-well drilling fluids Because it looks opaque on X-ray film barium is used in medicine to diagnose gastrointestinal problems The worldrsquos identified barite resources are about 2 billion metric tons but only about 740 million metric tons are in identified reserves (USGS 2004) The apparent consumption of crude barite was 2470000 metric tons in 2003 (USGS 2004) The location of major barite deposits in the United States is shown in figure 36
Table 14 Barite - proportion of world mine production reserves and reserve base for the
United States
[USGS 2004 reserves and reserve base are defined in Appendix 3]
Country Percent of world production 2003
Rank of world production
Percent of world reserves
Percent of world reserve base
United States
72 3 131 81
Most barite mined in the United States comes from bedded barite deposits in
Nevada (Harben and Kužvart 1996) These deposits occur in a northeast-trending zone up to 100 kilometers wide that stretches about 480 kilometers across the central part of the state This zone coincides with the extent of the Antler orogenic belt This orogenic event was caused by the convergence of tectonic plates beginning in the Late Devonian it is an early phase of the Cordilleran orogen
Barite deposits occur as layers with organic-rich and silica-rich sedimentary rocks that commonly formed in deep water in ocean basins (Paradis and others 1999) These barite-rich layers may be meters thick and may extend laterally over several square kilometers The bedded barite deposit at the Greystone mine Nevada is about 17 meters thick (Harben and Kužvart 1996)
The bedded barite deposits in Nevada formed around springs where solutions moving through the sediments vented into the ocean These solutions mixed with ocean water and formed layers of barite on the seafloor This process is similar to the formation of sedex deposits (see discussion on cobalt or lead-zinc) however no iron-lead-zinc sulfide minerals are formed Some geologists believe the barite deposits formed from hydrothermal solutions that vented to the seafloor to form sedex lead-zinc deposits (Paradis and others 1999) In this view the iron-lead-zinc sulfide minerals are deposited close to the vent while barite-rich layers are formed at some distance from the vent However others believe the deposits like those in Nevada formed where cold methane- and barium-rich fluids seeped into the oceans (Torres and others 2003) and have no
40
relationship to higher-temperature sedex-forming vent systems Modern barite deposits that are found forming around active methane seeps on the ocean floor support their hypothesis Modern cold seeps are often associated with faults located along continental margins
41
Bentonite Bentonite is a rock consisting of clay minerals (Mineral Information Institute
USGS and American Coal Foundation undated) The most common clay minerals in bentonite are one or more members of the smectite mineral group (most commonly the mineral montmorillonite a hydrous aluminum silicate with some calcium sodium potassium or magnesium) The properties of bentonite are dictated by the properties of the dominant clay minerals For the most part bentonites are divided into sodium bentonite (swelling bentonite) and calcium bentonite (non-swelling bentonite) other varieties of bentonite include palygorskite and hectorite (discussed below Harben and Kužvart 1996) Most bentonites can swell to over 10 times their dry volume with the addition of liquid have the ability to increase the viscosity of a liquid and have good bonding characteristics and high adsorption These properties lead to diverse end uses such as drilling mud pet litter chemical carrier thickeners and fillers Almost half of the world production of bentonites is from the United States The location of major bentonite deposits in the United States is shown in figure 37
Table 15 Bentonite - proportion of world mine production for the United States
[USGS 2004]
Country Percent of world production 2003 Rank of world production United States 392 1
Bentonite deposits can form through a variety of processes that alter volcanic
rocks (commonly tuffs) and on rare occasions other rocks The most extensive deposits are derived the alteration of volcanic ash beds deposited in water Volcanic ash is dust-sized particles of rock ejected from a volcano The dust is transported through the air and ultimately settles as layers on land or is deposited as beds underwater The ash beds that are altered to form bentonite are made up of particles of volcanic rocks derived from magmas that are enriched in silicon and aluminum and would crystallize feldspars and quartz The ash beds deposited in oceans alter to form bentonite only if the water composition is alkaline (contains various soluble salts sufficient to raise the pH value above 70) Bentonite is stable near the surface of the Earth The abundance of this mineral decreases with depth in the crust bentonite is not found at greater than 4 kilometers (Hosterman and Orris 1998ab Weaver 1959) Most deposits are Cretaceous or younger in age
Sedimentary bentonite Sedimentary bentonite forms through the chemical alteration of volcanic ash deposited in or washed into an alkaline ocean environment Calcium bentonite forms where calcium-ions are available Sodium bentonite only forms where calcium-ion concentrations are low and sodium ions are relatively abundant (Hosterman and Orris 1998ab) Deposits range in age from Cretaceous to mid-Tertiary Major sodium bentonite deposits are found in two districts in the western United States the Hardin district (Montana and Wyoming) and the Black Hills district (Montana Wyoming and South Dakota) As much as 90 percent of sodium-bentonite production has come from these two areas In the United States the most significant Ca-bentonite resources are in the Aberdeen-Tipley district in Mississippi
42
Hectorite Hectorite is a lithium-bearing variety of smectite a clay mineral Hectorite deposits occur in a variety of geologic settings Hectorite deposits form by 1) alteration of volcanic glass to lithium-rich smectite 2) precipitation from lake waters andor 3) incorporation of lithium into existing smectites (Asher-Bolinder 1991) All deposits form in arid environments and are associated with alkaline waters enriched in magnesium and lithium volcanic rocks hot-spring travertine deposits and very fine-grained masses of silica (Odom 1992 Asher-Bolinder 1991)
Palygorskite Palygorskite is a clay mineral that can contain up to 50 percent water Palygorskite commonly forms through alteration of smectite clays in sediments in an ocean environment or as a primary precipitate through a reaction between sea water and magnesium-rich sea water (Hosterman 1998) Known deposits in the United States are Tertiary in age
43
Boron Boron is a semi-metallic element that is a dark amorphous (noncrystalline)
nonreactive solid (Mineral Information Institute USGS and American Coal Foundation undated) Borates which are usually boric acid and anhydrous borax are processed from boron minerals Borates have a wide variety of uses such as in ceramic glazes fertilizers fire retardants and soaps and detergents Sales of boron for glass consumption represented 78 percent of domestic demand in 2002 (Lyday 2002) The location of major boron deposits in the United States is shown in figure 38
Table 16 Boron - proportion of world mine production reserves and reserve base for the
United States
[USGS 2004 reserves and reserve base are defined in Appendix 3]
Country Percent of world production 2003
Rank of world production
Percent of world reserves
Percent of world reserve base
United States
244 2 233 196
Four minerals comprise almost 90 percent of the borates used by industry
worldwide they are the hydrated sodium borates borax and kernite the hydrated calcium borate colemanite and the hydrated sodium-calcium borate ulexite These minerals are extracted primarily in California and Turkey and to a lesser extent in Argentina Bolivia Chile China and Peru The majority of boron production in California is from Kern County California with the balance from San Bernardino and Inyo Counties California (Lyday 2002) Large domestic reserves of boron materials occur in California chiefly in sediments and their contained brines Extensive resources also occur in Turkey At current levels of consumption world resources are adequate for the foreseeable future (USGS 2004) In 2003 the apparent consumption of boric oxide in the United States was 488000 metric tons (USGS 2004)
Most of the worldrsquos significant commercial borate deposits were created by the evaporation of shallow lakes that were fed by boron-bearing springs (Harben and Kužvart 1996 Smith 2002) Boron-bearing springs are spatially associated with volcanic activity Boron is leached from hot rock associated with tectonic plate subduction zones and is concentrated in water that moves through geologic formations on its way to the surface where it forms geothermal springs (Smith 2002) If the springs feed into lakes in closed basins characterized by high-evaporation rates boron salts will crystallize and form layers in sediments that accumulate in the lake The boron-bearing salt layers are surrounded by layers of clay minerals that prevent the salt layers from being re-dissolved Almost all important sedimentary borate deposits are less than 20 million years old
The Boron deposit (Kramer district) in California has been the worldrsquos leading source of borates since it opened in 1926 (Harben and Kužvart 1996) The deposit is a sodium-borate bed that occurs in lake deposits near the edge of a large Tertiary sedimentary basin The sodium-borate deposit is more than 3 kilometers long 15
44
kilometers wide and ranges from a meter to 10 meters thick Only the Bigadic Emet and Kirka deposits in Turkey are larger than the Boron deposit (Deeby 2002)
45
Bromine Bromine is a reddish-brown fuming liquid at room temperature it has a very
strong irritating odor and is chemically reactive and rather poisonous (Mineral Information Institute USGS and American Coal Foundation undated) The natural form of bromine is a solution of sodium bromide in natural brines oceans salt lakes and seas Bromine is used in agriculture fire retardants petroleum additives and other applications Resources of bromine are virtually unlimited In 2003 the apparent consumption of bromine in the United States was 211000 metric tons (USGS 2004) The location of the major bromine deposit in the United States is shown in figure 38
Table 17 Bromine - proportion of world mine production for the United States
[USGS 2004]
Country Percent of world production 2003 Rank of world production United States 38 1
The major commercial sources of bromine are seawater (containing an average of
65 parts per million bromine) and surface and subsurface brines (Harben and Kužvart 1996) Subsurface brines in Arkansas contain about 5000 parts per million bromine the brines that make up the Dead Sea contain between 5000 and 10000 parts per million bromine
Brines produced from wells in Arkansas and Michigan are the main source of United States bromine production (Harben and Kužvart 1996) The brines occur in sedimentary layers in the Gulf Coast and Michigan sedimentary basins Both basins contain thick layers of evaporite minerals such as salt (sodium chloride) The brines may represent a mixture of trapped seawater fluids expelled from the salt layers or ground waters that dissolved beds of salt gypsum and carbonate minerals
46
Diatomite Diatomite is a sedimentary rock consisting chiefly of the fossilized silica-rich
skeletons of single celled aquatic plants called diatoms Diatomite is chemically inert and stable This characteristic combined with the varying shapes and sizes of the diatom fossils makes diatomite a popular filter aid Diatomitersquos brightness low bulk density high adsorptive capacity and its high surface area combined with its chemical stability lead to its use as a filler as a carrier (such as for pesticides and herbicides) and as an abrasive Estimated end uses of diatomite in the United States were filter aids (68 percent) absorbents (14 percent) fillers (12 percent) and other (mostly cement manufacture - 6 percent USGS 2004) The location of major diatomite deposits in the United States is shown in figure 37
Table 18 Diatomite - proportion of world mine production and reserves for the United
States
[USGS 2004 reserve is defined in Appendix 3]
Country Percent of world production 2003
Rank of world production
Percent of world reserves
United States
363 1 273
Economic diatomite deposits can be found in sedimentary rocks deposited in
lakes and the ocean Diatoms first became numerous in the Late Cretaceous (Harben and Kužvart 1996) and most commercial deposits are Tertiary in age Formation of high grade deposits requires a large continuous supply of silica clear water and adequate light and nutrients (phosphate and nitrogen) In ocean environments these conditions typically occur in submerged coastal basins and shelves where nutrients and silica are supplied by upwelling ocean waters and limited sediment is derived from surrounding land masses The largest production of high-purity diatomite comes from the extensive deposits near Lompoc California (Harben and Kužvart 1996) These deposits in the Miocene Sisquoc Formation formed from ocean waters and extend in a belt for more than 160 kilometers About 25 minable units occur with in the upper part of the Sisquoc Formation ranging in thickness from 1 to 10 meters A notable example of a diatomite deposit that formed in a fresh water lake in a closed basin occurs near Lovelock Nevada Numerous other deposits occur throughout the United States although most productive deposits are found in the west
47
Garnet Garnet refers to a group of chemically-complex and physically-similar minerals
They are silicate minerals that also contain variable proportions of iron aluminum magnesium and calcium Garnets are all quite hard ndash harder than most common rock-forming minerals including quartz (silicon oxide) but less hard than corundum (aluminum oxide) or diamond (carbon) When broken they fracture into sharp irregular pieces The hardness and irregular fracture of garnet make it a valuable abrasive material The color of garnet is typically deep red but can occur as green or yellow crystals Large clear crystals with few flaws are used in jewelry The vast majority of garnet is used as an abrasive blasting material for water filtration in a process called water jet cutting and to make abrasive powders (Mineral Information Institute USGS and American Coal Foundation undated) The location of major garnet deposits in the United States is shown in figure 36
Table 19 Garnet - proportion of world mine production for the United States
[USGS 2004]
Country Percent of world production 2003 Rank of world production United States 138 3
Garnets are most commonly formed by metamorphism of other rocks Garnets
will form in igneous or sedimentary rocks (containing the appropriate proportions of silicon aluminum iron magnesium and calcium) when temperatures exceed 500˚C and the depth of burial ranges from 6 to 30 kilometers (Bucher and Frey 2002) Large domestic resources of industrial garnet are associated with unique metamorphic rocks found near North Creek New York (USGS 2004) At this locality a metamorphosed igneous rock contains 5 to 20 percent garnet that forms crystals measuring 5 centimeters to nearly a meter in diameter (Harben and Kužvart 1996) When crushed these garnets break into sharp chisel-like fragments It has been estimated that this deposit contributes about 95 percent of the worldrsquos production of high-quality abrasive-grade garnet
Due to its high density garnet can be concentrated into surficial deposits by running water In Idaho and Montana the concentration of garnet is great enough to form a placer garnet deposit than can be economically developed The Emerald Creek placer garnet deposits are currently being mined from modern and ancient stream deposits in Benewah County Idaho (Harben and Kužvart 1996) Garnet in these deposits is derived from metamorphosed sedimentary rocks
48
Gypsum Gypsum (hydrated calcium sulfate) is the most common of the approximately 150
sulfate minerals More than two-thirds of the produced gypsum is used for plaster and wallboard in houses and other buildings (Mineral Information Institute USGS and American Coal Foundation undated) Gypsum is produced from 50 mines located in 19 states (Olson 2002) The location of major gypsum deposits in the United States is shown in figure 38
Table 20 Gypsum - proportion of world mine production for the United States
[USGS 2004]
Country Percent of world production 2003 Rank of world production United States 157 1
Bedded deposits of gypsum in sedimentary rocks are the primary source of
gypsum mined in the United States These gypsum layers are found in sedimentary basins with restricted circulation where brines formed as the result of the evaporation ocean or lake water The first minerals to crystallize from evaporated water are gypsum and carbonates (Guilbert and Park 1986) If evaporation continues salt (halite or sodium-chloride) and potash (sylvite or potassium chloride) will precipitate followed by a variety of salts of potassium sodium magnesium chlorine and bromine late in the evaporation process The actual proportions of minerals that precipitate are determined by the unique conditions that developed for each basin
Several sedimentary basins host major bedded gypsum deposits in the United States (fig 38 Harben and Kužvart 1996) Silurian rocks host gypsum deposits at two localities on the northwest margin of the Appalachian Basin in New York and Ohio In the Michigan basin Mississippian rocks with gypsum deposits are found in Michigan and Indiana Gypsum deposits in the Permian Basin are mined in Oklahoma Texas and Kansas In California gypsum deposits occur in the Miocene Salton (or Guaymas) basin The thickness of the gypsum beds mined in these deposits range from 1 to 35 meters
49
Kaolin Kaolin is a term for a group of clays that might best be described as kaolinite-
bearing clays This group of clays includes commercial varieties (or subgroups) such as ball clay halloysite kaolin and fire or refractory clay Although best known as the main component in porcelain and other ceramics kaolin has diverse uses in the production of paper refractories cosmetics and other products Many of its uses are determined by its whiteness and composition (Mineral Information Institute USGS and American Coal Foundation undated USGS 2004) The location of major kaolin deposits in the United States is shown in figure 37
Table 21 Kaolin - proportion of world mine production for the United States
[USGS 2004]
Country Percent of world production 2003 Rank of world production United States 178 1
Sedimentary kaolin Sedimentary hi-alumina kaolins such as those found in
Georgia formed in temperate climates when atmospheric-derived water containing weak acids percolated through feldspar (calcium-potassium-sodium aluminosilicate)-rich rocks and converted the feldspar to kaolinite (hydous aluminosilicate) or halloysite (hydrous aluminosilicate forming tubular or spherical particles) The clays were then eroded and deposited in tidal flats or estuaries Some deposits also may have formed in-place by weathering of older clay-rich sediments (Hosterman and Orris 1998c) In the eastern United States a belt of kaolin-bearing rocks extends almost 400 kilometers from Aiken South Carolina to Eufaula Alabama and contains 7 to 10 billion metric tons of sedimentary kaolin (Harben and Kužvart 1996) Ninety percent of United States kaolin production is concentrated in a 240 kilometers long segment of this belt that extends from Macon Georgia to Aiken South Carolina The kaolin deposits occur as lenses in quartz (silicon oxide) sands and may be up to 13 meters thick and 2 kilometers long (Harben and Kužvart 1996)
Ball clay contains abundant organic matter and has high plasticity and dry strength it is the dominant type of kaolin in Tennessee Ball clay originates in rivers and is deposited in shallow lakes with abundant organics and particles of sand (Hosterman and Orris 1998d) Fire clay used in refractories is hard nonplastic and homogeneous kaolin that fractures with long smooth surfaces like broken glass These kaolins form when clay minerals undergo severe leaching of potassium and silica in acidic swamps (Hosterman and Orris 1998e) Fire clay is produced in Missouri and Pennsylvania
Hydrothermal kaolin Hydrothermal kaolin (including halloysite) is formed from the alteration of feldspar-rich rocks by acidic hydrothermal solutions that leach the alkalies from the host rock (Hosterman and Orris 1998f) This type of kaolin is typically used for ceramics and filler
50
Phosphate rock Phosphorus is an essential element for plant and animal nutrition It is mined in
the form of phosphate rock Most production is converted to phosphate fertilizers The location of major phosphate rock deposits in the United States is shown in figure 37
Table 22 Phosphate rock - proportion of world mine production reserves and reserve
base for the United States
[USGS 2004 reserves and reserve base are defined in Appendix 3]
Country Percent of world production 2003
Rank of world production
Percent of world reserves
Percent of world reserve base
United States
242 1 56 80
About 80 percent of the worldrsquos phosphate production comes from bedded
sedimentary deposits called phosphorites that formed from ocean water These phosphate-rich deposits form extensive layers that can cover thousands of square kilometers These rocks formed near middle to low latitude margins of continents where organic productivity was high and the flux of other sediments was low (Harben 2002 Harben and Kužvart 1996) The phosphorus-bearing mineral carbonate fluorapatite occurs in very thin layers pellets or nodules and as fragments of shell or bone
Weathered rocks are the ultimate source of most of the phosphorus in the ocean phosphorus derived from the weathering of rocks on the continents enters the oceans through rivers (Benitez-Nelson 2000) However the primary source of phosphorus in phosphorites is plankton and other fauna found in the oceans (Hein and others 2004) Phosphorus is an essential nutrient for the growth and development of all organisms and is concentrated in their tissues and skeletons relative to seawater (Rusch and others 1996)
Where enough light is available to support photosynthesis biological activity depletes the phosphorus content of near-surface ocean water Below this zone of depletion and up to a depth of approximately 1000 m phosphorus concentrations go up with increasing depth of the water Below 1000 m phosphorus concentrations are relatively constant and are about 10 times higher than surface water (Benitez-Nelson 2000)
Biological productivity is stimulated when upwelling currents carry phosphorus-rich cold waters from deeper ocean levels (Kesler 1994) Most phosphorite deposits are found where these nutrient-rich cold waters mix with shallow ocean water with a limited influx of sediment derived from nearby landmasses Upwelling and the resultant high biological activity occurs at certain coastal locations determined by the interplay of major winds ocean currents and the distribution of continents (Chandler and Christie 1996) Upon death of the organisms their remains sink to the ocean floor Phosphate is leached from some of the remains and concentrated in the pore waters of sediments The subsequent growth of carbonate fluorapatite from pore waters of organic-rich sediment is the predominant mechanism for formation of phosphorite (Hein and others 2004) Ocean currents that move material along the sea floor and chemical changes that take place as
51
the sediments change into rocks have important roles in concentrating these phosphate mineral precipitates into deposits (Rusch and others 1996) Weathering can further concentrate the phosphorus contents of the rocks (Kesler 1994)
Major phosphorite deposits in the United States are related to zones of oceanic upwelling that took place along the western coast of North America in the Permian (forming the western phosphate field in Wyoming Idaho Montana and Utah) and off the southeast North American coast in the Miocene (forming the phosphate deposits in Florida and Carolina fig 39)
52
Potash Potash refers to a group of water-soluble salts that contain the element
potassium (Mineral Information Institute USGS and American Coal Foundation undated) Potassium like phosphorus is an essential element for animal and plant nutrition Potassium is present in every living cell and is an essential nutrient for plant growth for that reason over 95 percent of potash production is used for fertilizers Potash is also used in medicine in the chemical industry and to produce decorative color effects on brass bronze and nickel Estimated world resources total about 250 billion metric tons (USGS 2004) In 2003 apparent consumption in the United States was 5300000 metric tons K2O equivalent The location of major potash deposits in the United States is shown in figure 38
Table 23 Potassium - proportion of world mine production reserves and reserve base for
the United States
[USGS 2004 reserves and reserve base are defined in Appendix 3]
Country Percent of world production 2003
Rank of world production
Percent of world reserves
Percent of world reserve base
United States
40 7 11 18
Sedimentary potash deposits form by the evaporation of seawater As evaporation
proceeds and carbonate minerals and gypsum (hydrated calcium sulfate) have crystallized salt (halite or sodium-chloride) and potash (sylvite or potassium chloride) will form The actual proportions of minerals that precipitate are determined by the unique conditions that developed for each basin
Five sedimentary basins host major potash deposits in the United States (fig 40 Harben and Kužvart 1996) They are the Silurian Salina Basin (also called the Michigan-Appalachian basin) that covers part of Michigan New York Ohio Pennsylvania and West Virginia the Permian-Jurassic Gulf Coast Basin that covers parts of Alabama Arkansas Florida Mississippi eastern Texas Louisiana and extends into Mexico the Permian Permian Basin that covers parts of Colorado Kansas New Mexico Oklahoma and western Texas the Middle Pennsylvanian-Permian Paradox Basin that covers parts of Utah and Colorado and the Ordovician-Permian Williston Basin that covers part of North and South Dakota and extends into Canada
Most domestic production is from evaporite deposits in the Permian Basin near Carlsbad New Mexico The estimated potash reserves in this district amount to more than 502 million metric tons (USGS 2002) Beds mined for potash range in thickness from 14 meters to more than 3 meters Estimated domestic potash resources total about 6 billion metric tons (USGS 2004) Most of this resource lies at depths between 1800 and 3100 meters in a 3110-square-kilometer area of Montana and North Dakota These potash deposits occur in the Williston Basin and are extensions of the potash deposits in Saskatchewan Canada The Paradox Basin in Utah contains approximately 2 billion metric tons mostly at depths of more than 1200 meters A large potash resource lies about 2100 meters under central Michigan in the Michigan Basin
53
Salt (halite) Salt (sodium chloride) is necessary to support life As a mineral salt is called
halite The chemical industry uses about 40 percent of salt produced (chlorine is a major product) and highway de-icing for about 35 percent (Mineral Information Institute USGS and American Coal Foundation undated) World continental resources of salt are practically unlimited and the salt content in the oceans is virtually inexhaustible (USGS 2004) The location of major salt deposits and the sedimentary basins hosting the deposits in the United States are shown in figure 38
Table 24 Salt - proportion of world mine production for the United States
[USGS 2004]
Country Percent of world production 2003
Rank of world production
United States 196 1 The United States is the worlds largest salt producer producing 45 million metric
tons a year nearly half of that in the form of brines produced by solution mines located at the site of chemical plants The remaining is dry salt produced using three basic technologies solar evaporation of seawater or saline lake water solution mining and vacuum pan evaporation and underground mining Currently the United States salt industry operates 48 salt production plants with major production sites in Louisiana Ohio New York Kansas Michigan Utah Texas and California (Salt Institute undated)
Sedimentary salt deposits form by the evaporation of seawater As evaporation proceeds and carbonate minerals and gypsum (hydrated calcium sulfate) have crystallized salt (halite or sodium-chloride) and potash (sylvite or potassium chloride) will form The actual proportions of minerals that precipitate are determined by the unique conditions that developed for each basin
Four sedimentary basins host major rock salt deposits in the United States and are some of the largest accumulations of salt in the world (fig 40 Harben and Kužvart 1996) They are the Silurian Salina Basin (also called the Michigan-Appalachian basin) that covers part of Michigan New York Ohio Pennsylvania and West Virginia the Permian-Jurassic Gulf Coast Basin that covers parts of Alabama Arkansas Florida Mississippi eastern Texas Louisiana and extends into Mexico the Permian Permian Basin that covers parts of Colorado Kansas New Mexico Oklahoma and western Texas and the Ordovician-Permian Williston Basin that covers part of North and South Dakota and extends into Canada
The salt can occur as relatively flay-lying layers with other sedimentary rocks - typically carbonates shales or other evaporite layers Individual rock salt layers in the Gulf Coast basin are 2 to 3 meters thick and cover 460000 square kilometers The aggregate thickness of salt layers exceeds 600 meters for the Salina group in the Michigan basin and is over 1000 meters in part of the Permian Basin (Johnson 2002)
Salt is less dense than the surrounding sedimentary rocks When buried deeply salt layers will deform and flow forming salt domes that rise up towards the surface Louisiana and Texas are the leading salt producing states (Harben and Kužvart 1996) In
54
these states most production comes from salt domes either by underground or solution mining
55
Soda ash (sodium carbonate) Soda ash is the trade name for sodium carbonate (Mineral Information Institute
USGS and American Coal Foundation undated) Natural soda ash is refined from the mineral trona (hydrated sodium carbonate) or sodium-carbonate-bearing brines Synthetic soda ashrdquo is manufactured from one of several chemical processes Worldwide synthetic production of about 22 million metric tons is about twice that of natural production Most soda ash in the United States is used in the manufacture of glass It is also used to make a variety of chemicals soap and powdered detergents in medicine as a food additive in cleaning compounds in paper and paper pulp production and water treatment At least 62 natural sodium carbonate deposits have been identified worldwide Although soda ash can be manufactured from salt and limestone both of which are practically inexhaustible synthetic soda ash is more costly to produce and generates environmentally harmful wastes
Table 25 Soda ash - proportion of world mine production reserves and reserve base for
the United States
[USGS 2004 reserves and reserve base are defined in Appendix 3]
Country Percent of world production 2003
(natural)
Percent of world production 2003
(natural and synthetic)
Rank of world production
(natural)
Percent of world
reserves (natural)
Percent of world reserve base (natural)
United States
95 28 1 95 98
All United States soda ash production (unlike Europe) is natural and comes
from sodium carbonate mines in Wyoming and Colorado and from brine in California the United States produces more than 95 percent of the worlds natural soda ash (USGS 2004) The largest known trona deposit in the world is in the Green River Basin of Wyoming This deposit alone could produce as much as 47 billion metric tons of soda ash In California Searles Lake and Owens Lake are soda brine lakes that are estimated to contain 815 million metric tons of soda ash The location of major sodium carbonate deposits in the United States is shown in figure 38
The deposits in the Green River Basin of Wyoming are part of the Eocene Green River Formation The sediments that make up the Green River Formation were deposited in two large lakes that occupied several structural basins in Colorado Wyoming and Utah (fig 41) Lake Gosiute occupied the Green River Washakie and Sand Wash Basins Lake Uinta occupied the Uinta and Piceance Creek Basins in Utah and Colorado Much of the time the lakes were closed with no outlets During arid periods evaporation of lake water caused large quantities of sodium salts to form either directly from the lake waters or from waters within the sediments
The Green River Formation contains world-class resources of oil shale and sodium-carbonate minerals (Dyni 1996) The formation contains the worlds largest known resource of natural sodium carbonate as bedded trona in southwest Wyoming As many as 42 beds of trona have been described in Green River Formation in the Green
56
River Basin in Sweetwater County southwest Wyoming (Dyni 1996) The thickest and economically most important of these beds are numbered from 1 to 25 in ascending order Twenty-two of the 25 numbered beds are estimated to contain a total of 115 billion metric tons of trona ore Trona bed 17 is one of the most important in the district The bed where it is more than 4 feet (12 m) thick underlies about 775 square miles (2007 square kilometers) and ranges from 4 to 17 feet (12 to 52 m) in thickness (fig 42) The second largest known resource of sodium carbonate occurs as bedded and nodular nahcolite (sodium bicarbonate) in northwest Colorado Four companies currently mine beds of trona in Wyoming and one company mines a bed of nahcolite in Colorado The Wyoming trona district currently produces about 15 million metric tons per year (83 million metric tons of refined soda ash Kostick 2004)
57
Talc Talc is an extremely soft hydrous magnesium silicate mineral Soapstone and
steatite are rocks composed primarily of the mineral talc Talc is used commercially because of its fragrance retention luster purity softness and whiteness Other commercially important properties of talc are its chemical inertness high dielectric strength high thermal conductivity low electrical conductivity and oil and grease adsorption Ground talc is used as an ingredient in ceramics paper paint roofing plastics and cosmetics (such as talcum and baby powders) (Mineral Information Institute USGS and American Coal Foundation undated) The location of major talc deposits in the United States is shown in figure 36
Table 26 Talc - proportion of world mine production for the United States
[USGS 2004]
Country Percent of world production 2003 United States 9
Nine mines in five States produced talc in 2003 Most domestic production came
from mines in Montana New York Texas and Vermont (USGS 2004) Montana has been the leading talc-producing state for more than 20 years supplying more than a third of the United States talc production in recent years The largest producing mine in Montana and in the United States is the Yellowstone mine near Ennis (Virta and others 2000)
Talc deposits form when hydrothermal solutions react with rocks enriched in magnesium at relatively high temperatures (Harben and Kužvart 1996) Magnesium-enriched rocks include dolomite (a sedimentary rock rich in carbonate minerals) and ultramafic igneous rocks (very enriched in magnesium and iron minerals and low in silica) that represent fragments of oceanic crust that have been faulted into continental crust near plate tectonic boundaries The deposits may be adjacent to major fault zones which provide a pathway for the introduction of hydrothermal fluids or near contacts between magnesium-enriched and silica-enriched rocks (Simandl and Ogden 1999 Simandl and Paradis 1999) For deposits hosted in carbonate rocks the hydrothermal fluids provided silica for ultramafic-rock hosted deposits the hydrothermal fluids supplied carbon dioxide In the United States most of the talc deposits except those in Vermont are associated with carbonate rocks (Harben and Kužvart 1996) The deposits in Vermont are associated with ultramafic igneous rocks The hydrothermal fluids may be generated by the emplacement and cooling of magma or by regional metamorphism The deposits in Montana appear to be related to the continental rifting that formed the Belt Basin (fig 17 Brady and others 1998 also see discussion on cobalt copper and silver) Continental rifting and associated emplacement of magma into dikes elevated the temperature of the sequence of rocks containing the carbonate units The talc deposits formed when seawater circulated into these rocks along fault zones
58
Regional exploration history and significant recent discoveries Information needed to directly monitor and assess all mineral exploration
activities in the United States is not readily available in the public domain Some information is available for Federally-managed land but exploration activity elsewhere is not systematically recorded However trends in minerals exploration activities can be ascertained by reviewing information in trade literature the number of active mining claims on Federal lands and the number of operating mines When plotted by year for a given area this type of information can reveal cyclic as well as systematic patterns of activity Some of these cycles and trends appear to be in response to global economic social and political events others are only regional
Exploration sites Minerals-related exploration activity reported in trade journals and other literature can be used to discuss regional trends in exploration and variations with time Because states are not the same size the density of exploration sites in a state (number of sites divided by the area of the state) is used to discuss trends The density of exploration sites is illustrated in figure 43 is based on information compiled from 1995 to 2003 (David Wilburn written communication 2003) These values are estimates ndash not all exploration sites are described in literature and not all commodities may be represented However if the same information sources and compilation criteria are used the estimates provided here should reveal trends in exploration activity The states with the highest density of exploration sites are those covering the Cordilleran orogen and Precambrian rocks near Lake Superior Nevada by far has the highest density of exploration sites reported Western states in the conterminous United States show a similar pattern of activity ndash a peak around 19971998 a low in 20002001 and higher numbers in 20022003 Other states show different patterns The density of sites in Alaska peaked in 19992000 activity in Minnesota has been steadily increasing from 1997 to 2003
Mining claims The number of active mining claims held on Federally-owned lands from 1976 to 2003 is illustrated in figure 44 This information is summarized from information available from the Bureau of Land Management Land and Mineral Records ndash LR2000 system (httpwwwblmgovlr2000 accessed June 23 2004 DC Causey written communication 2004) The number of claims peaked around 1980 and again around 1988 before dropping dramatically in 1993 A minor peak in 1997 is followed by decreasing number of claims through to 2003
Number of active mines The number of active mines is illustrated in figure 45 These data are summarized from information collected by the Mine Safety and Health Administration (National Mining Association 2003b) With the exception of sand and gravel and stone operations the number of active mines has systematically decreased in the United States from 1979 to 2001 The number of stone and sand and gravel mining operations has increased during the same time period This increase largely reflects construction needs in the United States especially in coastal urban areas
To understand these patterns we need to briefly discuss the factors that control exploration activity Minerals exploration activity can be divided into two components (Singer and Kouda 1999) Lower risk minerals exploration focuses on finding extensions to existing deposits or new ore bodies near previously discovered large deposits This type of exploration activity is often driven by the depletion of reserves at known deposits Exploration has added additional resources to known gold deposits in Nevada zinc-lead-silver deposits in Alaska palladium-platinum deposits in Montana and silver deposits in
59
Idaho In the 1990s a new porphyry copper deposit Resolution was found in a well explored area in southeastern Arizona known for its major porphyry copper deposits (Manske and Paul 2002) The last discovery of a major copper deposit in this area occurred over 20 years ago This high-grade porphyry copper deposit is covered by younger rocks and lies at depths between 1500 and 2100 meters rock pressures at that depth are high and temperatures are approximately 77ordmC (Ducote 2004) Higher-risk exploration looks for mineral deposits where none have been previously discovered Some discoveries are made as the result of model-driven exploration programs Others are found serendipitously However low versus high risk exploration does not explain the cyclic patterns of mineral activity
Cyclic patterns of exploration activity and resource development have been described around the world (Dummett 2000) A cycle of exploration is followed by a wave of discovery which is succeeded by a period of production Cycles of exploration are driven by events A new period of exploration activity can be initiated by innovation (new use of a commodity new information new technology new concepts) change in commodity metal price a change in market conditions or a changes in public policy Some examples relevant to the United States are discussed below
Changes in monetary policy and technology innovations in the 1970s and 1980s and the emergence of new geologic concepts lead to the discovery and development of one of the worldrsquos major gold provinces in northern Nevada In the early 1970s the United States government removed restrictions on the price of gold and allowed its citizens to buy and hold gold (Amey 1998) In an eight year period the price of gold rose from $38 per ounce to approximately $850 per ounce About the same time cyanide leaching technology developed by the US Bureau of Mines in the 1950s was refined to allow the processing of lower-grade gold ore at low costs (httpwwwmmestatevausDMRDOCSMinResGOLDextracthtml accessed May 20 2004) Cyanide heap leaching technology involves spraying a cyanide-bearing leach solution over a pile of crushed or pulverized rock that contains minute particles of native gold The solution moves through the pile and dissolves the gold and silver The solution collected at the base of the pile is stripped of precious metals with activated carbon or other electrochemical exchange processes Large mobile conveyors have been developed that can produce heap leach piles 900 meters in diameter and 18 meters high
Fine-grained gold mineralization was discovered in northern Nevada in the 1930s (Bettles 2002) However the style of mineralization was not economic to develop until the price of gold increased and a low-cost method of extraction was developed Effective exploration techniques were then developed and dozens of previously unknown gold deposits were discovered Gold production started soon thereafter Exploration continues in Nevada focusing on extensions to known deposits and targets at depth As these deposits were developed and studied new deposit models and exploration concepts were developed that have guided successful exploration programs in other places (Hofstra and Cline 2000) Northern Nevada is now recognized as containing one of the largest concentrations of gold in the world Annual gold production in Nevada around 1970 was less than 500000 oz (15550 kg) per year since 2000 over 8 million ounces (250000 kg) of gold are produced annually
A cycle of mineral exploration can result in the discovery of a previously unknown style of mineralization The successful discovery and development of the gold deposits in Nevada initiated a world-wide search for gold deposits that could be mined using cyanide heap leach technology Geologists took their experience and exploration
60
technologies to new areas The peak in mining claim activity in the late 1980s largely reflects this phase of gold exploration programs being conducted around the United States In Alaska the gold deposits at Fort Knox Donlin Creek and Pogo were discovered in the 1990s Geologists realized that these gold deposits were unlike those in Nevada They appeared to be associated with subduction-related igneous activity but were unlike porphyry copper-gold deposits found elsewhere Geologists defined a new type of gold deposit and were able to relate this style of mineralization to an igneous arc that extended from the Yukon Territory to interior Alaska during the Cretaceous This then stimulated a phase of new exploration throughout the geologic terrane for this type of gold deposit This activity may be the cause of increase in the number of exploration sites in Alaska up to 2000
Exploration activity for nickel-copper-platinum-group element (PGE) mineralization has been driven by metal price new exploration concepts and a new process to extract minerals from ore Between 1997 and 2000 the price of palladium increased from less than $200 per ounce to over $1000 per ounce (Johnson Matthey 2004) Throughout the 1990s geologists were able to develop new exploration models for magmatic mineral deposits Important events included the discovery in 1994 of the Voiseyrsquos Bay nickel deposit in Labrador and research projects that allowed western geologists to study the major Norilrsquosk-Talnakh nickel-copper-PGE deposits in Siberia In addition a new process called PLATSOLtrade was developed to dissolve copper nickel gold and the PGErsquos from low-grade sulfide concentrates (Fleming undated) Taken together these events lead to a surge in exploration activity in areas where platinum-group element enriched deposits could be found In United States this activity was principally focused in Montana Minnesota and Wisconsin Although palladium prices have subsequently dropped platinum prices have recently increased along with demand and this probably will sustain interest in exploration for the platinum-group elements
Changes in technology have been especially important for some industrial minerals that occur in natural brines or that can be mined by solution methods Improved brine processing technology has allowed the development of some previously sub-economic deposits and led to the closure of other more traditional mining operations Within the last decade lower cost production of lithium from brines associated with desert lakes has displaced much of the traditional production of lithium from igneous rocks The Fort Cady borate deposit lies at a depth of more than 400 m development was possible through the use of an in-situ leaching technique Other industrial mineral commodities for which brine mining (including sea water) and (or) in-situ leaching are or might in the future be significant include rock salt magnesium sodium carbonate sodium sulfate potash borates lithium iodine and bromine
New information that could stimulate exploration activity also includes systematic collection of new data in an area with mineral potential Work supported by government industry and universities is generating the scientific infrastructure needed by the mining industry to find new deposits For example the airborne geophysicalgeological mineral inventory sponsored by the Alaska Division of Geological and Geophysical Surveys is a multi-year project to expand the knowledge base of Alaskarsquos mineral resources as a catalyst to private sector investment (Burns undated) This effort focuses on Alaska state lands the BLM in Alaska funds similar work focused on Federal lands in Alaska
Finally government policies and programs can have a significant impact on minerals exploration and development As previously discussed governments can create scientific information useful to the minerals exploration industry However laws on
61
mineral rights ownership taxation and environmental protection have the strongest affect on stimulating or discouraging minerals exploration Global events in the early 1990s also had a significant impact on exploration activities in the United States In 1992 Chile Mexico and Peru initiated comprehensive mining law reforms Starting with the collapse of communist regimes throughout Eastern Europe in 1989 and culminating with the end of the USSR in 1991 the Cold War was brought to an end In 1994 free multiracial elections were held in South Africa These and other events profoundly changed the global minerals economy by removing restrictions on where exploration activity investment and development could take place At the same time tougher environmental laws and permitting requirements were put in place in the United States In 1993 regulations for hard-rock mining claims on Federal lands were changed Prior to 1993 exploration expenditures could be used to maintain rights to mining claims After 1993 a fee of $100 per mining claim was required to paid to the government in order to hold a mining claim Even though the geology of an area may be favorable for the discovery of new mineral deposits exploration companies generally are unwilling to invest if laws and regulations make it difficult or expensive to develop mineral resources The global change in the minerals economy the changing attitude towards mineral development in the United States and the change in mining regulation is reflected in the precipitous drop of the number of active mining claims in the United States in 1993
The declining number of mining operations in the United States may be an early reflection of the decreased exploration activity in the United States starting in the 1990s The deposits being mined today were mostly discovered decades ago Decreased exploration will mean fewer discoveries which will lead to fewer mines in the United States in the years to come
Potential for undiscovered mineral resources Despite the high level of exploration activity that has occurred in parts of the
United States undiscovered mineral resources remain to be found Mineral resources are currently being produced from world class mineral deposits The mere presence of a mineral deposit suggests that others are likely to exist because the processes that result in mineralization commonly form clusters and linear belts of mineral deposits In this section the following discussion will address where new deposits will be found the commodities that will be present and the difficulty in finding them
From our discussion of mineral commodities we hope the reader has come away with these points 1) Mineral deposits are associated with large scale geologic processes that reoccur in time and place The decay of radioactive elements deep within the Earth provides the heat needed to drive the movement of materials in the Earthrsquos mantle and tectonic plates This movement of materials generates the magmas and hydrothermal fluids fractures and faults mountain ranges and sedimentary basins that are locally and critically important to localizing mineral deposits 2) Mineral deposits do not occur randomly their distribution is intimately related to the geologic history of each continent The movement of material in the mantle and tectonic plates is responsible for the development of cratons orogens and rifts that are characteristic of continental crust The geologic architecture of each continent uniquely reflects the sequence of events that culminated in the distribution of rocks and mineral deposits we see today The more we know about the geologic fabric of each continent and
62
the processes that control the regional and local distribution of mineral deposits the better we can address where new deposits may be found and what they may contain
Our ability to find undiscovered mineral deposits is affected by many factors For example how well has the geology of the continent been mapped There are still parts of the world where the geologic framework of the continents is poorly mapped or largely unknown Terrain and access can limit field investigations in other regions thick vegetation soils and younger deposits conceal the underlying geology In other cases the policies of governments have restricted access to information about geology and mineral resources The less that is known about an area the more likely mineral deposits are left to be discovered Alaska remains an exploration frontier the basic geologic framework has been established but the remoteness of the area and the prevalence of overlying deposits obscure much detail Geochemical surveys routinely used to explore for mineral deposits are more difficult to interpret because unconsolidated material transported by glaciers is harder to trace to a bedrock source
How well do we understand the type of mineral deposit for which we are searching Robust exploration models can be developed from the shared characteristics and associations of many deposits If geologists understand the ore forming process a variety of geologic geochemical and geophysical tools can be developed to identify areas where undiscovered mineral deposits may occur Porphyry copper deposits and volcanogenic massive sulfide deposits are well understood styles of mineralization in part because many deposits of these types have been discovered and studied in detail Effective deposit models are hard to create for styles of mineralization only known from one or two deposits (such as the hydrothermal beryllium mineralization at Spor Mountain) The search for more mineral deposits represented by these rare occurrences will be more complicated and less certain
How difficult will it be to find them The approach that involves the least risk to the exploration geologist is to search in lsquomaturersquo areas with known mineral deposits well characterized geology and an experience base that has identified which exploration techniques have been successful However the expected returns may be lower because the remaining concealed deposits will be harder to find and may not be as large as those found first The most exciting discoveries and some of the largest are in areas where no mineral deposits have been found previously The opportunities for these ldquograss-rootsrdquo discoveries are usually in those areas for which the least amount of information is available
However ultimately it still comes back to the geology The basic requirements to form a mineral deposit involve source and process There must be a source area of the material a mechanism to transport it and a means to concentrate it If any part of this is missing a mineral deposit will not be formed Certain types of mineral deposits only are found in specific geologic settings If that setting is not present the associated mineral deposit will not be found The geologic evolution of each continent has developed with characteristic environments in which mineral deposits may be found Some of the major geologic areas in the United States that constrain the types and distribution of mineral deposits that could be expected include
bull The geologically-young Cordilleran orogen has considerable potential for undiscovered hydrothermal deposits of copper molybdenum gold lead zinc and silver related to emplacement and cooling of igneous rocks
63
bull The Appalachian orogen has potential for undiscovered volcanogenic massive sulfide deposits and pluton-associated gold deposits
bull Carbonate sedimentary rocks adjacent to the Ouchita and Appalachian orogens and throughout Alaska may host undiscovered Mississippi Valley Type zinc-lead deposits
bull Hydrothermal fluids generated in sedimentary basins formed during the extension of continental crust can vent to the seafloor to form sedex zinc-lead deposits Undiscovered deposits of this type may occur in the Belt basin in Montana and Idaho and the northern Brooks Range in Alaska
bull Sedimentary basins also contain large deposits of minerals formed by the evaporation of lake or seawater These deposits are commonly covered by younger layers of sediment and many basins have not been drilled to great depths These deposits are easily developed by solution mining
bull Large provinces of magnesium- and iron-rich igneous rocks emplaced on the continent during mantle upwelling events have resulted in the rapid emplacement of large volumes of volcanic flows and igneous intrusions over large parts of North America These igneous rocks are not directly related to the development of continental orogens Undiscovered nickel copper and platinum-group element deposits may be associated with these igneous rocks One event formed a belt of Mesozoic rocks extending from British Columbia through the Yukon Territory to Alaska Another belt of Proterozoic igneous rocks extends from Kansas through Minnesota Michigan and Wisconsin
In 1998 the USGS estimated the gold silver copper lead and zinc in undiscovered deposits in the United States (US Geological Survey National Mineral Resource Assessment Team 2000) The identified resources and past production of these five metals were also estimated Assessment results include the following
bull 18000 metric tons of gold 460000 metric tons of silver 290000000 metric tons of copper 85000000 metric tons of lead and 210000000 metric tons of zinc are estimated to be present in undiscovered deposits minable with existing technology
bull 15000 metric tons of gold 160000 metric tons of silver 260000000 metric tons of copper 51000000 metric tons of lead and 55000000 metric tons of zinc remain in identified resources
bull Past production from the largest identified resources of gold silver copper lead and zinc is estimated to be 12000 metric tons of gold 170000 metric tons of silver 91000000 metric tons of copper 41000000 metric tons of lead and 44000000 metric tons of zinc These deposits account for about 99 percent of cumulative domestic production in the United States
From this assessment about as much gold silver copper lead or zinc is left to be discovered in the United States as has already been found However finding new minable mineral deposits will be challenging given that undiscovered deposits are not exposed access is more difficult environmental regulations impose constraints on the techniques used to find and develop mineral deposits landownership is more fragmented than in the past and the constant competition from low-cost foreign producers
64
References cited Amey EB 1998 Annual average gold price US Geological Survey Metal prices in
the United States through 1998 p 49-53 ONLINE Available httpmineralserusgsgovmineralspubscommoditygold300798pdf [Accessed May 20 2004]
Anstett TF Krauss UH Ober JA and Schmidt HW 1990 International strategic mineral inventory summary report ndash lithium US Geological Survey Circular 930-I 28 p
Asher-Bolinder Sigrid 1991 Descriptive model of lithium in smectites of closed basins in Orris GJ and Bliss JD eds Some industrial mineral deposit models Descriptive deposit models US Geological Survey Open-File Report 91-11A p 9-10
Atkinson Jr WW and Einaudi MT 1978 Skarn formation and mineralization in the contact aureole at Carr Fork Bingham Utah Economic Geology v 73 p 1326-1365
Austin G S Kottlowski FE Siemers WT 1982 Industrial minerals of New Mexico in 1981 in Austin GS comp Industrial rocks and minerals of the Southwest New Mexico Bureau of Mines and Mineral Resources Circular 182 p 9-16
Bally AW and Palmer AR 1989 The Geology of North America An overview Geological Society of America The Geology of North America volume A 619 p
Bally AW Scotese CR and Ross MI 1989 North America Plate tectonic setting and tectonic elements in Bally AW and Palmer AR The Geology of North America An overview Geological Society of America The Geology of North America volume A p 1-16
Bauer RR Copeland JR and Santini Ken 1994 Wollastonite in Carr DD ed Industrial minerals and rocks Littleton Colorado Society for Mining Metallurgy and Exploration p 1119-1128
Benitez-Nelson Claudia 2000 The biogeochemical cycling of phosphorus in marine systems Earth-Science Reviews v 51 p 109-135
Bettles Keith 2002 Exploration and geology 1962 to 2002 at the Goldstrike property Carlin Trend Nevada in Goldfarb RJ and Nielsen RL eds Integrated methods for discovery global exploration in the twenty-first century Society of Economic Geologists Special Publication 9 p 275-298
Box S E Bookstrom A A Zientek M L Derkey P D Ashley R P Elliott J E and Peters S G 1995 Assessment of undiscovered mineral resources in the Pacific Northwest a contribution to the Interior Columbia Basin Ecosystem Management Project US Geological Survey Open-File Report 95-682 415 p
Brady JB Cheney JT Rhodes AL Vasquez Angela Green Chris Duvall Mathieu Kogut Ari Kaufman Lewis and Kovaric Dana 1998 Isotope geochemistry of Proterozoic talc occurrences in Archean marbles of the Ruby Mountains southwest Montana USA Geological Materials Research vol 1 p 1-41
Briskey JA Schulz KJ Mosesso JP Horwitz LR and Cunningham CG 2001 Itrsquos time to know the planetrsquos mineral resources Geotimes v 46 no 3 (March) p 14-19
Briskey JA Schulz KJ Mosesso JP Horwitz LR and Cunningham CG 2002 Environmental planning issues and a conceptual global assessment of undiscovered nonfuel mineral resources in Briskey JA and Schulz KJ eds Agenda extended abstracts and bibliographies for a Workshop on Deposit Modeling Mineral Resources
65
Assessment and Their Role in Sustainable Development - 31st International Geological Congress Rio de Janeiro Brazil [extended abstract] U S Geological Survey Open-File Report 02-423 p 7-10
British Sulphur Corporation Limited 1964 A world survey of phosphate deposits London The British Sulphur Corporation Limited 206 p
British Sulphur Corporation Limited 1979 World survey of potash resources London The British Sulphur Corporation Limited 138 p
British Sulphur Corporation Limited 1985 World survey of potash resources London The British Sulphur Corporation Limited 144 p
British Sulphur Corporation Limited 1987 A world survey of phosphate deposits London The British Sulphur Corporation Limited 274 p
Brobst DA and Pratt WP eds 1973 United States mineral resources US Geological Survey Professional Paper 820 722 p
Brush Engineered Materials Inc 2003 Brush Resources a Brush Engineered Materials IncCompany ONLINE Available httpwwwbrushresourcescom [Accessed February 14 2004]
Buchan KL and Ernst RE 2001 Introduction in Ernst RE and Buchan KL eds Mantle plumes their identification through time and space Geological Society of America Special Paper 352 p 1-4
Bucher Kurt and Frey Martin 2002 Petrogenesis of metamorphic rocks 7th edition Berlin Springer 341 p
Burchfiel BC Lipman PW and Zoback ML 1992 Introduction in Burchfiel BC Lipman PW and Zoback ML eds The Cordilleran orogen Geological Society of America The Geology of North America v G-3 p 1-7
Burns Laurel undated Airborne geophysicalgeological inventory Alaska Division of Geological and Geophysical Surveys 1 p ONLINE Available httpwwwdggsdnrstateakusBriefing03M_FY03_CouncilGeophyspdf [Accessed May 21 2004]
Busby CJ and Ingersoll RV eds 1995 Tectonics of sedimentary basins Cambridge Massachusetts Blackwell Science 579 p
Cannon WF Kress TH Sutphin DM Morey GB Meints Joyce and Barber-Delach RD 1997 Digital Geologic Map and Mineral Deposits of Minnesota Wisconsin and Michigan (Version 30) US Geological Survey Open-File Report 97-455
Carr DD Rooney LF and Freas RC 1994 Limestone and dolomite in Carr DD ed Industrial minerals and rocks 6th edition Littleton Colorado Society for Mining Metallurgy and Exploration Inc p 605-629
Carten RB White WH and Stein HJ 1993 High-grade granite-related molybdenum systems classification and origin in Kirkham RV Sinclair WD Thorpe RI and Duke JM eds Mineral deposit modeling Geological Association of Canada Special Paper 40 p 521-554
Cathcart JB Sheldon RP and Gulbransen RA 1984 Phosphate-rock resources of the United States US Geological Survey Circular 888 48 p
Cawthorn RG 1999 The platinum and palladium resources of the Bushveld Complex South African Journal of Science v 95 p 481-489
Chandler FW 2000 The Belt-Purcell Basin as a low-latitude passive riftmdashImplications for the geological environment of Sullivan-type deposits in Lydon JW and others eds The Geological Environment of the Sullivan Deposit British Columbia
66
Geological Association of Canada Mineral Deposits Division Special Publication No 1 p 82-112
Chandler FW and Christie RL 1996 Stratiform phosphate in Eckstrand OR Sinclair WD and Thorpe RI eds Geology of Canadian Mineral Deposit Types Geological Survey of Canada Geology of Canada no 8 p 33-40
Chernoff CB and Orris GJ 2002 Data set of world phosphate mines deposits and occurrences Part A Geologic data US Geological Survey Open-File Report 02-0156A 352 p
Christiansen RL and Yeats RS 1992 Post-Laramide geology of the US Cordilleran region in Burchfiel BC Lipman PW and Zoback ML eds The Cordilleran orogen Conterminous US Geological Society of America The Geology of North America volume G-3 p 261-406
Coffin MF and Eldholm Olav 1993 Large igneous provinces Scientific American October 1993 p 42- 49
Condie KC 1997 Plate Tectonics and Crustal Evolution Fourth Edition Butterworth-Heinemann Oxford UK 282 p
Condie KC 2001 Mantle plumes and their record in Earth history Cambridge University Press Cambridge 306 p
Cooke DR and Simmons SF 2000 Characteristics and genesis of epithermal gold deposits in Hageman SG and Brown PE eds Gold in 2000 Society of Economic Geologists Review in Economic Geology v 13 p 221-244
Courtillot Vincent Davaille Anne Besse Jean and Stock Joann 2002 Three distinct types of hotspots in the Earthrsquos mantle Earth and Planetary Science Letters v 205 p 295-308
Cox DP 1992 Descriptive model of distal disseminated Ag-Au in Bliss JD editor Developments in mineral deposit modeling US Geological Survey Bulletin 2004 p 19
Cox DP and Singer DA eds 1986 Mineral deposit models US Geological Survey Bulletin 1693 379 p
Cox DP Lindsay DA Singer DA and Diggles MF 2003 Sediment-hosted copper deposits of the world Deposit models and database US Geological Survey Open-File Report 03-107 1 CD-ROM
Crockett RN and Sutphin DM 1993 International strategic mineral inventory summary report ndash niobium (columbium) and tantalum US Geological Survey Circular 930-M 36 p
Dawson KM 1996 Skarn zinc-lead-silver in Eckstrand OR Sinclair WD and Thorpe RIeds Geology of Canadian Mineral Deposit Types Geological Survey of Canada Geology of Canada no 8 p 448-459
Deeby DJ 2002 Borate deposits of California past present and future in Scott PW and Bristow CM eds Industrial minerals and extractive industry geology Geological Society of London London p 87-92
Ducote Richard 2004 Copper find at Superior enormous Arizona Daily Star published May 2 2004 ONLINE Available httpwwwdailystarcomdailystarprintDS20375php [Accessed May 19 2004]
Dummett HT 2000 Mineral resource development ndash our new challenges Mining Engineering v 52 p 37-42
Dyni JR 1996 Sodium carbonate resources of the Green River Formation US Geological Survey Open-File Report 96-729 39 p
67
Edwards AF and others 1992 The geology of Main Pass sulphur and oil deposit Society of Mining Engineers Preprint 92-254 14 p
Ernst RE and Buchan KL 2001 Large mafic magmatic events through time and links to mantle-plume heads in Ernst RE and Buchan KL eds Mantle plumes their identification through time Geological Society of America Special Paper 352 p 483-575
Evans JR Taylor GC and Rapp JS 1976 Mines and mineral deposits in Death Valley National Monument California California Division of Mines and Geology Special Report 125 61 p
Eyde TH and Eyde DT 1987 The Bowie chabazite deposit in Pierce HW ed Proceedings of the 21st Forum on the Geology of Industrial Minerals Arizona Bureau of Geology and Mineral Technology Geological Survey Branch Special Paper 4 p 133
Fleck RJ Criss RE Eaton GF Cleland RW Wavra CS and Bond WD 2002 Age and origin of base and precious metal veins of the Coeur drsquoAlene mining district Idaho Economic Geology v 97 p 23-42
Fleming Chris undated Platsoltrade process provides a viable alternative to smelting reprinted from African Mining 4 p ONLINE Available httpwwwlakefieldcompdfmetservicesPaper202002-120AM20Jan-Feb20220Platsolpdf [Accessed May 20 2004]
Foose MP 1993 Digital metallogenic data set for North America and South America US Geological Survey Open-File Report 93-328
Force ER 1991 Geology of titanium-mineral deposits Geological Society of America Special Paper 259 112 p
Formation Capital undated US Projects ONLINE Available httpwwwformcapcomfrus1htm [Accessed April 7 2004]
Foster HL 1969 Asbestos occurrence in the Eagle C-4 quadrangle Alaska US Geological Survey Circular 611 7 p
Garrett DE 1992 Natural soda ash occurrences processing and use New York Van Nostrand Reinhold Publishing Company 636 p
Garrett DE 1996 Potash deposits processing properties and uses New York Kluwer Academic Publishers 752 p
Garrett DE 2001 Sodium sulfate handbook of deposits processing and use San Diego Academic Press 365 p
Geological Survey of Canada 1995 Generalized geological map of the World and linked databases Geological Survey of Canada Open File 2715d CD-ROM
Gluskoter HJ Rice DD and Taylor RB eds 1991 Economic geology US Geological Society of America The Geology of North America volume P-2 622 p
Griffiths JB 1995 Industrial Minerals Directory A world guide to producers and processors London Industrial Minerals Information Ltd 553 p
Gross GA 1996a Lake Superior-type iron-formations in Eckstrand OR Sinclair WD and Thorpe RI eds Geology of Canadian Mineral Deposit Types Geological Survey of Canada Geology of Canada no 8 p54-66
Gross GA 1996b Mafic intrusion-hosted titanium-iron in Eckstrand OR Sinclair WD and Thorpe RI eds Geology of Canadian Mineral Deposit Types Geological Survey of Canada Geology of Canada no 8 p573-582
Guilbert JM and Park Jr CF 1986 The geology of ore deposits New York WH Freeman and Company 985 p
68
Hageman SG and Brown PE 2000 Gold in 2000 ndash An introduction in Hageman SG and Brown PE eds Gold in 2000 Society of Economic Geologists Review in Economic Geology v 13 p 1-7
Ham WE and Curtis NM Jr 1958 Gypsum in the Weatherford-Clinton district Oklahoma Oklahoma Geological Survey Mineral Report 5 32 p
Hansen WR 1991 Suggestions to authors of the reports of the United States Geological Survey seventh edition US Government Printing Office 289 p
Haq BU and Van Eysinga FWB 1998 Geological Time Table Fifth revised enlarged and updated edition Amsterdam The Netherlands Elsevier Science BV
Harben PW 2002 The industrial minerals handybook - 4th Edition A guide to markets specifications amp prices Surrey UK Industrial Minerals Information 412 p
Harben PW and Bates RL 1984 Geology of the nonmetallics New York Metal Bulletin Inc 392 p
Harben PW and Bates RL 1990 Industrial minerals geology and world deposits Metal Bulletin Inc 312 p
Harben PW and Kužvart Milǒs 1996 Industrial minerals A global geology London Industrial Minerals Information Ltd 462 p
Harrison JE 1972 Precambrian Belt basin of northwestern United States Its geometry sedimentation and copper occurrences Geological Society of America Bulletin v 83 p 1215-1240
Haxel GB Hedrick JB and Orris GJ 2002 Rare earth elementsmdashCritical resources for high technology US Geological Survey Fact Sheet 087-02 4 p
Hayes TS 1990 A preliminary study of thermometry and metal sources of the Spar Lake stratabound copper-silver deposit Belt Supergroup Montana US Geological Survey Open File Report 90-0484 30 p
Hayes TS and Einaudi MT 1986 Genesis of the Spar Lake strata-bound copper-silver deposit Montana Part 1 Controls inherited from sedimentation and preore diagenesis Economic Geology v 81 p 1899-1931
Hayes TS Rye RO Whelan JF and Landis GP1989 Geology and sulfur isotope geothermometry of the Spar Lake stratabound copper-Ag deposit in the Belt Supergroup Montana in Boyle RW Brown AC Jefferson CW Jowett EC and Kirkham RV eds Sediment-hosted Stratiform Copper Deposits Geological Association of Canada Special Paper 36 p 319-338
Hedenquist JW Arribas R Antonio Gonzalez-Urien Eliseo 2000 Exploration for epithermal gold deposits in Hageman SG and Brown PE eds Gold in 2000 Society of Economic Geologists Review in Economic Geology v 13 p 245-277
Hein JR Perkins RB and McIntyre BR 2004 Evolution of thought concerning the origin of the Phosphoria Formation western US phosphate field in Hein JR Life cycle of the Phosphoria Formation From deposition to post-mining environment Handbook of Exploration and Environmental Geochemistry v 8 Elsevier BV Amstersdam p 19-42
Hilliard HE 2002 Silver - 2002 US Geological Survey Minerals Yearbook - 2002 13 p ONLINE Available httpmineralsusgsgovmineralspubscommoditysilversilvemyb02pdf [Accessed April 7 2004]
Hite R J 1964 Salines in Mineral and water resources of Utah Utah Geological and Mineral Survey Bulletin 73 p 206-215
69
Hite RJ 1967 Distribution and geologic habitat of marine halite and associated potash deposits US Geological Survey Open-File Report 67-113 52 p
Hobbs SW and Fryklund Jr VC 1968 The Coeur drsquoAlene mining district Idaho in Ridge JD ed Ore deposits of the United States 1933-1967 (Graton-Sales volume) New York American Institute of Mining Metallurgical and Petroleum Engineers v 2 p 1417-1435
Hoffman PF 1989 Precambrian geology and tectonic history of North America in Bally AW and Palmer AR eds The Geology of North America An overview Geological Society of America The Geology of North America volume A p 447-512
Hofstra AH and Cline JS 2000 Characteristics and models for Carlin-type gold deposits in Hageman SG and Brown PE eds Gold in 2000 Society of Economic Geologists Reviews in Economic Geology v 13 p 163-220
Holmes DA 1994 Zeolites in Carr DD ed Industrial minerals and rocks Littleton Colorado Society for Mining Metallurgy and Exploration p 1129-1158
Hosterman JW 1998 Preliminary descriptive model for palygorskite in Orris GJ ed Additional descriptive models of industrial mineral deposits US Geological Survey Open-File Report 98-505 p 39-40
Hosterman JW and Orris GJ 1998a Preliminary descriptive model of sedimentary bentonite Deposit subtype Sodium Bentonite in Orris GJ ed Additional descriptive models of industrial mineral deposits US Geological Survey Open-File Report 98-505 p 24-26
Hosterman JW and Orris GJ 1998b Preliminary descriptive model of sedimentary bentonite Deposit subtype Calcium Bentonite in Orris GJ ed Additional descriptive models of industrial mineral deposits US Geological Survey Open-File Report 98-505 p 27-29
Hosterman JW and Orris GJ 1998c Preliminary descriptive model of sedimentary kaolinmdashdeposit subtype kaolin in Orris GJ ed Additional descriptive models of industrial mineral deposits US Geological Survey Open-File Report 98-505 p 36-38
Hosterman JW and Orris GJ 1998d Preliminary descriptive model of sedimentary kaolinmdashdeposit subtype Ball Clay in Orris GJ ed Additional descriptive models of industrial mineral deposits US Geological Survey Open-File Report 98-505 p 30-32
Hosterman JW and Orris GJ 1998e Preliminary descriptive model of sedimentary kaolinmdashdeposit subtype Fire Clay in Orris GJ ed Additional descriptive models of industrial mineral deposits US Geological Survey Open-File Report 98-505 p 33-35
Hosterman JW and Orris GJ 1998f Preliminary descriptive model of hydrothermal kaolin in Orris GJ ed Additional descriptive models of industrial mineral deposits US Geological Survey Open-File Report 98-505 p 21-23
Hosterman JW and Patterson SH 1992 Bentonite and fullers earth resources of the United States U S Geological Survey Professional Paper 1522 45 p
Industrial Minerals 1987 Merlins rare earths venture in Company News Industrial Minerals no 243 p 92
Industrial Minerals 1992 Baroid to reopen Rossi barytes operation Industrial Minerals no 301 p 16
Industrial Minerals 1995 Newcomer to nepheline syenite Industrial Minerals no 332 p 17
Industrial Minerals 1999a Montana vermiculite production planned Industrial Minerals no 376 p 8
70
Industrial Minerals 1999b American Soda plans soda ash production from nahcolite Industrial Minerals no 378 p 19
Industrial Minerals 1999c AZCO invests in Arizona muscovite mica project Industrial Minerals no 380 p 15-16
Industrial Minerals 2002 AZCO secures $8m for 10000 tpa mica project Industrial Minerals no 412 p 15
Industrial Minerals 2003 Minsand update Industrial Minerals no 431 p 12-13 Industrial Minerals 2004a April start for Atlas halloysite mine Industrial Minerals no
439 p 31 Industrial Minerals 2004b Bear River Zeolite sales up Industrial Minerals no 439 p
33 International Nickel Study Group undated The world of nickel ONLINE Available
httpwwwinsgorgnickelhtm [ January 25 2004] Jackson WD and Christiansen Grey 1993 International strategic mineral inventory
summary report ndash rare-earth oxides US Geological Survey Circular 930-N 68 p Jasinski SM 1998 Phosphate rock- 1998 US Geological Survey Minerals Yearbook
1998 p 571-5713 Jasinski SM 2000 Phosphate rock - 2000 US Geological Survey Minerals Yearbook
2000 pp581-5812 Johnson Matthey 2004 Platinum Today Price Charts ONLINE Available
httpwwwplatinummattheycompricesprice_chartshtml [January 31 2004] Johnson KS 2002 Salt resources and production in the United States in Scott PW
and Bristow CM eds Industrial minerals and extractive industry geology Geological Society of London London p 83-86
Kerrich Robert Goldfarb Richard Groves David and Garwin Steven 2000 The geodynamics of world-class gold deposits characteristics space-time distribution and origins in Hageman SG and Brown PE eds Gold in 2000 Society of Economic Geologists Review in Economic Geology v 13 p 501-551
Kesler SE 1994 Mineral resources economics and the environment New York Macmillan College Publishing Company Inc 391 p
Kious WJ and Tilling RI 1996 This dynamic Earth The story of plate tectonics version 10 ONLINE Available httppubsusgsgovpublicationstextdynamichtmlanchor19309449 [January 30 2004]
Kirkham RV and Sinclair W D 1996a Porphyry copper gold molybdenum tungsten tin silver in Eckstrand OR Sinclair WD and Thorpe RI eds Geology of Canadian Mineral Deposit Types Geological Survey of Canada Geology of Canada no 8 p 421-446
Kirkham RV 1996 Volcanic redbed copper in Eckstrand OR Sinclair WD and Thorpe RI eds Geology of Canadian Mineral Deposit Types Geological Survey of Canada Geology of Canada no 8 p 241-252
Kirkham RV and Sinclair WD 1996b Vein copper in Eckstrand OR Sinclair WD and Thorpe RI eds Geology of Canadian Mineral Deposit Types Geological Survey of Canada Geology of Canada no 8 p 399-408
Konhauser KO Hamade Tristan Raiswell Rob Morris RC Ferris FG Southam Graham and Canfield DE 2002 Could bacteria have formed the Precambrian banded iron formations Geology v 30 p 1079-1082
71
Kostick DS 2004 Soda ash US Geological Survey Mineral Commodity Summaries January 2004 p 152-153 ONLINE Available httpmineralsusgsgovmineralspubscommoditysoda_ashsodaamcs04pdf [Accessed April 9 2004]
Krauss UH Saam HG and Schmidt HW 1984 International strategic mineral inventory summary report ndash phosphate US Geological Survey Circular 930-C 41 p
Kuck Peter 1998 Iron ore US Geological Survey Statistical Compendium ONLINE Available httpmineralsusgsgovmineralspubscommodityiron_orestat [Accessed February 28 2004]
Laznicka Peter 1999 Quantitative relationships among giant deposits of metals Economic Geology v 94 p 455-473
Leach DL and Rowan EL 1986 Genetic link between Ouchita foldbelt tectonism and the Mississippi Valley-type lead-zinc deposits of the Ozarks Geology v 14 p 931-935
Leach DL and Sangster DF 1993 Mississippi Valley-type lead-zinc deposits in Kirkham RV Sinclair WD Thorpe RI and Duke JM eds Mineral deposit modeling Geological Association of Canada Special Paper 40 p 289-314
Leach DL Bradley Dwight Lewchuck MT Symons DTA de Marsily Ghislain and Brannon Joyce 2001 Mississippi Valley-type lead-zinc deposits through geologic time implications from recent age-dating research Mineralium Deposita v 36 p 711-740
Leach David undated The giant Red Dog massive sulfide deposit Brooks Range Alaska Discovery geology geochemistry and genesis ONLINE Available httpwwwcpggufbabrmetalogeneseLeach1htm [Accessed May 21 2004]
Lindsey DA 1998 Slides of the fluorspar beryllium and uranium deposits at Spor Mountain Utah US Geological Survey Open-File Report 98-524 ONLINE Available httppubsusgsgovof1998ofr-98-0524HOMEHTM [Accessed April 7 2004]
Listerud WH and Meineke DG 1977 Mineral resources of a portion of the Duluth Complex and adjacent rocks in St Louis and Lake Counties northeastern Minnesota Minnesota Department of Natural Resources Division of Minerals Report 93 49 p
Long KC DeYoung JH Jr and Ludington SD 1998 Database of significant deposits of gold silver copper lead and zinc in the United States US Geological Survey Open-File Report 98-206 Part A Database description and analysis 60 p and Part B Excel spreadsheet and references
Long KL 1998 Grade-tonnage models for Coeur drsquoAlene-type polymetallic veins US Geological Survey Open-File Report 98-583 28 p
Ludington SD 1986 Descriptive model of Climax Mo deposits in Cox DP and Singer DA eds Ore deposit models US Geological Survey Bulletin 1693 p 73
Lyday PA 2002 Boron - 2002 US Geological Survey Minerals Yearbook - 2002 14 p ONLINE Available httpmineralsusgsgovmineralspubscommodityboronboromyb02pdf [Accessed April 7 2004]
Lydon JW 1988 Volcanogenic massive sulphide deposits part 1 A descriptive model in Roberts RG and Sheahan PA eds Ore Deposit Models Geoscience Canada Reprint Series 3 p 145-153
72
Lydon JW 1996 Sedimentary exhalative sulphides (sedex) in Eckstrand OR Sinclair WD and Thorpe RI eds Geology of Canadian Mineral Deposit Types Geological Survey of Canada Geology of Canada no 8 p 130-152
Lydon JW 2000 A synopsis of the current understanding of the geological environment of the Sullivan deposit Chapter 3 in Lydon JW and others eds The Geological Environment of the Sullivan Deposit British Columbia Geological Association of Canada Mineral Deposits Division Special Publication No 1 p 12-31
Manske SLand Paul AH 2002 Geology of a major new porphyry copper center in the Superior (Pioneer) district Arizona Economic Geology v 97 p 197-220
McFaul EJ Mason GT Jr Ferguson WB and Lipin BR 2000 U S Geological Survey mineral databases MRDS and MASMILS US Geological Survey Digital Data Series DDS 52 CD-ROM
Miller JD Jr Severson MJ and Hauck SA 2002 History of geologic mapping and mineral exploration in the Duluth Complex in Miller JD Jr Green JC Severson MJ Chandler VW Hauck SA Peterson DM and Wahl TE eds Geology and mineral potential of the Duluth Complex and related rocks of northeastern Minnesota Minnesota Geological Survey Report of Investigations 58 p 21- 51
Miller JD Jr Green JC Severson MJ Chandler VW Hauck SA Peterson DM and Wahl TE 2002 Geology and mineral potential of the Duluth Complex and related rocks of northeastern Minnesota Minnesota Geological Survey Report of Investigations 58 207 p
Mineral Information Institute USGS and American Coal Foundation undated Minerals in your world Mineral Information Institute Golden Colorado CD ROM
Moores EM and Twiss RJ 1995 Tectonics New York WH Freeman and Company 415 p
Mutschler FE Ludington Steve and Bookstrom AA 1999 Giant porphyry-related metal camps of the world ndash a database US Geological Survey Open-File Report 99-556 Online Version 10 Available httpgeopubswrusgsgovopen-fileof99-556 [Accessed July 15 2004]
National Mining Association 2003a Leading nonfuel mining operations in the United States by crude ore output in 2001 National Mining Association 1 p ONLINE Available httpwwwnmaorgpdfm_mining_operationspdf [Accessed April 8 2004]
National Mining Association 2003b Mine Safety and Health Administrationrsquos number of coal and nonfuel mineral operations in the United States 1979-2002 2p ONLINE Available httpwwwnmaorgpdfm_number_operationspdf [Accessed April 8 2004]
National Mining Association undated Mining in the United States National Mining Association 2 p ONLINE Available httpwwwnmaorgpdfstates_01us2001pdf [Accessed May 18 2004
Neary CR and Highley DE 1984 The economic importance of the rare earth elements in Henderson P ed Rare earth element geochemistry New York Elsevier Developments in Geochemistry 2 p 423-466
Nelson JL 1996 Polymetallic mantos Ag-Pb-Zn in Lefebure DV and Hoy T eds Selected British Columbia mineral deposit profiles Volume 2 ndash Metallic deposits British Columbia Ministry of Employment and Investment Open-File 1996-13 p 101-104
73
New York State Department of Environmental Conservation undated Mining data ONLINE Available httpwwwdecstatenyuswebsitedmnminedatahtm [Accessed June 23 2004]
Newmont 2003 Information handbook 2003 Newmont Mining Corporation ONLINE Available wwwnewmontcomenpdfinfohandbookHB2003-Completepdf [February 16 2004]
Odom IE 1992 Hectorite deposits properties and use in Griffiths JB ed Proceedings 10th Industrial Minerals International Congress San Francisco Metal Bulletin plc p 105-111
ODriscoll Mike 1990 Minerals in the US South-West breaking rocks in the hot sun Industrial Minerals no 272 p 52-83
ODriscoll Mike 1993 Garnet--Set for blast off Industrial Minerals no 304 p 19-33 Olson DW 2002 Gypsum - 2002 US Geological Survey Minerals Yearbook - 2002
14 p ONLINE Available httpmineralsusgsgovmineralspubscommoditygypsumgypsumyb02pdf [Accessed April 7 2004]
Orris GJ 1985 Beddedstratiform barite deposits Geologic and grade-tonnage data including a partial bibliography US Geological Survey Open-File Report 85-447 32 p
Orris GJ and Bliss JD 1985 Geologic and grade-volume data on 330 gold placer deposits US Geological Survey Open-File Report 85-213 167 p
Orris GJ and Chernoff CB 2002 Data set of world phosphate mines deposits and occurrences Part B Location and mineral economic data US Geological Survey Open-File Report 02-0156B 328 p
Orris GJ and Chernoff CB 2004 Review of world sedimentary phosphate deposits and occurrences in Hein JR Life cycle of the Phosphoria Formation From deposition to post-mining environment Handbook of Exploration and Environmental Geochemistry v 8 Elsevier BV Amsterdam p 559-573
Papke KG 1984 Barite in Nevada Nevada Bureau of Mines and Geology Bulletin 98 125 p
Papke KG 1987 Gypsum deposits in Nevada Nevada Bureau of Mines and Geology Bulletin 103 26 p
Paradis S Simandl GJ MacIntyre D and Orris GJ 1999 Sedimentary-hosted stratiform barite in Simandl GJ Zdenek DH and Lefebure DV Selected British Columbia mineral deposit profiles Volume 3 ndash Industrial minerals and gemstones British Columbia Ministry of Energy and Mines Mineral Resources Division Geological Geological Survey Branch Open File 1999-10 p 43-46
Pearson Karine 1999 A TiO2 feedstock review Industrial Minerals no 378 p 42-53 Peters SG Mihalasky MJ and Theodore TG 2004 Assessment for sedimentary
rock-hosted Au-Ag deposits in Wallace AR Ludington S Mihalasky MJ Peters SG Theodore TG Ponce DA John DA and Berger BR Assessment of metallic mineral resources in the Humboldt River Basin northern Nevada with a section on PGE potential of the Humboldt mafic complex by ML Zientek GB Sidder and RA Zierenberg US Geological Survey Bulletin 2218 p 189-239
Pirkle FL Pirkle EC Reynolds JG Pirkle WA Henry JA and Rice WJ 1993 The Folkston West and Amelia heavy mineral deposits of Trail Ridge southeastern Georgia Economic Geology v 88 p 961-971
74
Placer Dome Inc 2002a PDG Placer Dome Operations Cortez mine Placer Dome Gold Inc ONLINE Available httpwwwplacerdomecomoperationscortezcortezhtml [March 1 2004]
Placer Dome Inc 2002b PDG Placer Dome Operations Turquoise Ridge mine Placer Dome Gold Inc ONLINE Available httpwwwplacerdomecomoperationsgetchellgetchellhtml [March 1 2004]
Polymet Mining Corporation 2003 The Northmet project ONLINE Available httpwwwpolymetminingcomnorthmetpdf [Accessed April 6 2004]
Price JG and Meeuwig RO 2002 Overview in the Mineral Industry of Nevada Nevada Bureau of Mines and Geology Special Publication MI-2002 p 3-11
Price RA and Sears JW 2000 Preliminary palinspasthic map of the Belt-Purcell Supergroup Implications for tectonic setting and structural evolution in Lydon JW and others eds The Geological Environment of the Sullivan Deposit British Columbia Geological Association of Canada Mineral Deposits Division Special Publication No 1 p 61-81
Riggs SR 1979 Phosphate sedimentation in Florida ndash a model phosphogenic system Economic Geology v 74 p 285-314
Riggs SR 1989 Phosphate deposits of the North Carolina coastal plan continental shelf and adjacent Blake Plateau USA in Notholt AJG Sheldon RP and Davidson DR eds Phosphate deposits of the world volume 2 phosphate rock resources Cambridge Cambridge University Press 42-52 p
Rio Tinto 2001 Fact sheet series Industrial Minerals ONLINE Available httpwwwriotintocomlibraryreportsPDFscorpPub_FactSheet_IndustMinpdf [January 26 2004]
Robert Francois 1996 Quartz-carbonate vein gold in Eckstrand OR Sinclair WD and Thorpe RI eds Geology of Canadian Mineral Deposit Types Geological Survey of Canada Geology of Canada no 8 p 350-366
Roberts RG 1988 Archean lode gold deposits in Roberts RG and Sheahan PA eds Ore deposit models Geoscience Canada Reprint Series 3 p 1-20
Roskill Information Services 1983 The economics of salt 4th ed London Roskill Information Services Ltd 183 p plus appendices
Roskill Information Services 1988 The economics of rare earths amp yttrium seventh edition London Roskill Information Services 359 p plus appendices
Roskill Information Services 1989 The economics of potash London Roskill Information Services variously paginated
Roskill Information Services 1992 The economics of gypsum and anhydrite 1992 6th ed London Roskill Information Services Ltd 168 p plus appendices
Roskill Information Services 1993 The economics of boron 7th ed London Roskill Information Services Ltd 156 p
Roskill Information Services 1994 The economics of iodine 1994 6th ed London Roskill Information Services Ltd 98 p plus appendices
Rusch TL Sankar R Scharf JE Follmi KB 1996 The phosphorus cycle phosphogenesis and marine phosphate-rich deposits Earth-Science Reviews v 40 p 55-124
Russell Alison 1988 Potash- Long haul recovery under way Industrial Minerals no 244 p 16-34
Salt Institute undated About the salt industry ONLINE Available httpwwwsaltinstituteorg3html [ accessed May 10 2004]
75
Sangster D F 1996 Mississippi Valley-type lead-zinc in Eckstrand OR Sinclair WD and Thorpe RI eds Geology of Canadian Mineral Deposit Types Geological Survey of Canada Geology of Canada no 8 p 253-261
Sawkins FJ 1984 Metal deposits in relation to plate tectonics Berlin Springer-Verlag 325 p
Schaetzl RJ undated Iron mining today GEO 333 Geography of Michigan and Great Lakes region ndash a course at the Michigan State University ONLINE Available httpwwwgeomsuedugeo333iron_iiihtml [Accessed February 28 2004]
Schulz and Cannon 1997 Potential for new nickel-copper sulfide deposits in the Lake Superior region Available ONLINE httppubsusgsgovinfomwni_cu [Accessed April 6 2004]
Shedd KB 2002 Cobalt - 2002 US Geological Survey Minerals Yearbook - 2002 21 p ONLINE Available httpmineralsusgsgovmineralspubscommoditycobaltcobalmyb02pdf [Accessed April 7 2004]
Siebert L and Simkin T 2002 Volcanoes of the World an illustrated catalog of Holocene volcanoes and their eruptions Smithsonian Institution Global Volcanism Program Digital Information Series GVP-3 ONLINE Available httpwwwvolcanosiedugvpworld [January 16 2004]
Simandl GJ and Ogden D 1999 Ultramafic-hosted talc-magnesite in Simandl GJ Zdenek DH and Lefebure DV Selected British Columbia mineral deposit profiles Volume 3 ndash Industrial minerals and gemstones British Columbia Ministry of Energy and Mines Mineral Resources Division Geological Geological Survey Branch Open File 1999-10 p 65-68
Simandl GJ and Paradis S 1999 Carbonate-hosted talc in Simandl GJ Zdenek DH and Lefebure DV Selected British Columbia mineral deposit profiles Volume 3 ndash Industrial minerals and gemstones British Columbia Ministry of Energy and Mines Mineral Resources Division Geological Geological Survey Branch Open File 1999-10 p 35-38
Singer DA 1995 World class base and precious metal deposits ndash a quantitative analysis Economic Geology v 90 p 88-104
Singer DA and Kouda Ryoichi 1999 Examining risk in mineral exploration Natural Resources Research v 8 p 111-122
Singer DA Berger VI and Moring BC 2002 Porphyry copper deposits of the World database maps and preliminary analysis US Geological Survey Open-File Report 02-268 ONLINE Available httpgeopubswrusgsgovopen-fileof02-268 [Accessed July 15 2004]
Singer DA Mosier DL and Menzie DW 1993 Digital grade and tonnage data for 50 types of mineral deposits US Geological Survey Open-File Report 93-280 ONLINE Available httppubsusgsgovof1993ofr-93-0280 [Accessed July 15 2004]
Smith JG 1965 Fundamental transcurrent faulting in the northern Rocky Mountains Bulletin of the American Association of Petroleum Geologists v 49 p 1398-1409
Smith RA 2002 Basic geology and chemistry of borate American Ceramic Society Bulletin v 81 no 8 6 p
Spanski GT 2004 Inventory of significant mineral deposit occurrences in the Headwaters project area in Idaho western Montana and extreme eastern Oregon and Washington US Geological Survey Open-File Report 2004-1038 13 p
76
St John B 2000 Sedimentary provinces of the World (BG) including GIS layer for giant oil amp gas fields AAPG Datapages Digital Product Digital Map Product Code 52 CD-ROM
Stoeser DB and Heran WD 2000 USGS deposit models US Geological Survey Digital Data Series DDS-064 version 10 CD-ROM
Sutphin DM and Page NJ 1986 International Strategic Minerals Inventory Summary Report - Platinum-group metals US Geological Survey Circular 930-E 34 p
Taylor Lindsey 2004 Clear winners Industrial Minerals no 436 p 45-49 Thompson JFH and Newberry RJ 2000 Gold deposits related to reduced granitic
intrusions in Hagemann SG and Brown PE eds Gold in 2000 Society of Economic Geologists Reviews in Economic Geology v 13 p 377-400
Tingley JV 2002 Major precious-metal deposits in the Mineral Industry of Nevada Nevada Bureau of Mines and Geology Special Publication MI-2002 p 26-41
Torres ME Bohrman Gerhard Dube TE and Poole FG 2003 Formation of modern and Paleozoic stratiform barite at cold methane seeps on continental margins Geology v 31 p 897-400
Towner RR 1992 International strategic mineral inventory summary report ndash zirconium US Geological Survey Circular 930-L 47 p
Towner RR Gray J M and Porter LM 1988 International strategic mineral inventory summary report ndash titanium US Geological Survey Circular 930-G 58 p
US Geological Survey National Mineral Resource Assessment Team 2000 1998 assessment of undiscovered deposits of gold silver copper lead and zinc in the United States US Geological Survey Circular 1178 21 p and CD-ROM
USGS 1997 Active mines and mineral plants in the US ONLINE Available httptinerusgsgovmineplant [Accessed July 1 2004]
USGS 2002 The mineral industry of New Mexico US Geological Survey Minerals Yearbook 10 p ONLINE Available httpmineralsusgsgovmineralspubsstate2002nmstmyb02pdf [Accessed May 17 2004]
USGS 2004 Mineral Commodity Summaries 2004 US Government Printing Office Washington DC 197 p Available httpmineralsusgsgovmineralspubsmcs2004mcs2004pdf [January 30 2004]
Van Kauwenbergh SJ and McClellan GH 1990 Comparative geology and mineralogy of the southeastern United States and Togo phosphorites Geological Society Special Publication 52 p 139-155
Van Kauwenbergh SJ Cathcart JB and McClellan GH 1990 Mineralogy and alteration of the phosphate deposits of Florida US Geological Survey Bulletin 1914 46 p
Virta RL van Gosen BS and Berg RB 2000 Industrial minerals of the United States US talc ndash baby powder and much more US Geological Survey Fact Sheet FS-065-00 2 p ONLINE Available httppubsusgsgovfsfs-0065-00fs-0065-00pdf [Accessed May 13 2004]
Warren John 1999 Evaporites-- their evolution and economics Malden Massachussetts Blackwell Science 438 p
Weaver CE 1959 The clay petrology of sediments Clays and Clay Minerals v 6 p 154-187
77
Williams-Stroud SC Searls JP and Hite RJ 1994 Potash resources in Carr DD ed Industrial minerals and rocks Littleton Colorado Society for Mining Metallurgy and Exploration p 783-802
Woolley AR 1987 Alkaline rocks and carbonatites of the world Part 1 North and South America University of Texas Press Austin Texas 216 p
Woolley AR 1989 The spatial and temporal distribution of carbonatites in Bell Keith ed Carbonatites genesis and evolution Unwin Hyman Boston p 15-37
Yeats CJ and Vanderhor Fop 1998 Archaean lode-gold deposits AGSO Journal of Australian Geology and Geophysics v 17 no 4 p 253-258
Zanko LM Severson MJ Oreskovich JA Heine JJ Hauck SA 2003 Oxidized taconite geological resources for a portion of the western Mesabi Range (west half of the Arcturus mine to the east half of the Canisteo mine) Itasca County Minnesota ndash a GIS-based resource analysis for land-use planning University of Minnesota Duluth Natural Resources Research Institute NRRITR-2001-40 86 p
Zientek ML Cooper RW Corson SR and Geraghty EP 2002 Platinum-group element mineralization in the Stillwater Complex Montana in Cabri LJ The geology geochemistry mineralogy and mineral beneficiation of platinum-group elements Canadian Institute of Mining Metallurgy and Petroleum Special Volume 54 p 459-481
78
Figures
Figure 1 Map of the World showing the areas covered by this series of regional reports tectonic plate boundaries and ocean bathymetry Continental shelves are shown in yellow in oceans increasing water depth is indicated by darker shades of blue Tectonic plate boundaries (black lines) from httpmapngdcnoaagovwebsiteseghazardsviewerhtm [Accessed May 23 2005] Plate names from httpwwwigutexaseduresearchprojectsplatesplateshtm [Accessed May 23 2005] Ocean bathymetry from derived from ETOPO2 (httpwwwngdcnoaagovmggimage2minreliefhtml [Accessed May 23 2005])
79
Core
Lithosphere(crust and upper-most solid mantle)
Mantle
Liquid
Solid
Crust 5-100km thick
Outer core
Inner core
Mantle
Crust
To scale
Not to scale
Figure 2 Sketches showing the layered internal structure of the Earth The three major layers (crust mantle and core) comprising the Earth are schematically portrayed in the sectional wedge (not to scale) The cutaway view in the lower right shows the layers drawn to scale Modified from Kious and Tilling (1996)
80
ConvergentPlate Boundary Transform
Plate Boundary
Hotspot
Asthenosphere
Lithosphere
TrenchStrato-volcano
Shieldvolcano
Oceanicspreading
ridge
DivergentPlate Boundary
ConvergentPlate Boundary
Continental Rift Zone(Young Plate Boundary)
Oceanic crust Continental crust
Subductingplate
Islandarc
Subducting
plate
TransformPlate Boundary
DivergentPlate Boundary
ConvergentPlate Boundary
area ofmagma
generationarea ofmagma
generation
Figure 3 Perspective diagram and cross section of the uppermost layers of the Earth illustrating the main types of tectonic plate boundaries Modified from Kious and Tilling (1996)
81
Innercore
Rotation axis
Primary plume
Secondary plumes
Tertiary plumes
Subduction zone
Spreading center
Figure 4 A schematic cross-section of the Earth illustrating three types of mantle plumes lsquoPrimaryrsquo or main deeper plumes possibly come from the lowermost mantle boundary layer lsquoSecondaryrsquo plumes possibly come from the top of domes near the depth of the transition zone between the lower and upper mantle lsquoTertiaryrsquo hotspots may have a near surface origin linked to tensile stresses in the lithosphere and decompression melting Dashed lines with arrows show flow directions of rock within the layers Modified from Courtillot and others (2002)
82
North AtlanticVolcanic Province
KarooBasalts
DeccanTraps
SiberianTrapsColumbia
River FloodBasalts
Hawaii
AfarBasalts
ParanaBasalts
Figure 5 A map of the globe showing the distribution of the igneous rocks associated with selected large igneous provinces (red regions) that formed in the last 250 million years These rocks are related to mantle plumes and are widely distributed on both continental and oceanic crust Modified from Coffin and Eldholm (1993)
83
))))
))
)
)
)
)) ))
))
)
)
)))
) )
)
)
)
))
120deg130deg 110deg 100deg 90deg 80deg 70deg
30deg
40deg
)
180deg170degE 170degW 150deg 130deg 120deg
50deg
60deg
70deg
160deg 140deg
EXPLANATIONMajor mineral deposits) Magmatic
) Metamorphic
Rock typeMainly sedimentary terraneMainly volcanic terrraneMixed sedimentary-volcanic terranePlutonic terrraneMetamorphic andor plutonic terraneMelange schist or tectonite belt
9000 1800 KILOMETERS
9000 1800 KILOMETERS
Figure 6 Map showing the location of the major magmatic and metamorphic mineral deposits of United States listed in appendix 1 Geologic base is derived from Geological Survey of Canada (1995)
84
ConvergentPlate Boundary
Hotspot
Asthenosphere
Lithosphere
Shieldvolcano
DivergentPlate Boundary
ConvergentPlate Boundary
ContinentalRift Zone
Oceanic crust Continental crust
Subductingplate
Islandarc
Subducting
plate
Continentalarc
Spreadingcenter
Volcanogenicmassive sulfide
deposits
PorphyrydepositsPorphyry
deposits
Epithermaldeposits
Epithermaldeposits
Polymetallicreplacement
deposits
Sedimentary-exhalativesediment-hosted copperand evaporite deposits
Orogenic goldvein depositsVolcanogenic
massive sulfidedeposits MVT
depositsVolcanogenic
massive sulfidedeposits
Figure 7 Cross section of the uppermost layers of the Earth illustrating the distribution of mineral deposits in relation to the main types of tectonic plate boundaries
85
[
[
[[[
[
[
[
[[[[[
[
[[
[
[[[
[[
[
[[
[
[
[
[
[
[
[
[[
[
[
[
[
[
[
[
[[
[
[[[ [
[[ [
[[[[[[[
[
[
[[
[
[
[
[
[
[
[
[
[
[
[
[
[
[
[
[[[
[
[
[
[[[ [
[
[[
[
[[[[[
[
[
[[[[[ [
[[[ [
[[
[
[
[[
[
[[
[[[
[
[
[
[[
[[[[[[[[[[[
[
[
[[[[
[
[[
120deg130deg 110deg 100deg 90deg 80deg 70deg
30deg
40deg
[
[[
[[
[[
[
[
[
[[[
[
50deg
60deg
70deg
180deg170deg E 170deg W 150deg 130deg 120deg160deg 140deg
EXPLANATIONMajor mineral deposits
[ Hydrothermal
Rock typeMainly sedimentary terrane
Mainly volcanic terrane
Mixed sedimentary-volcanic terrane
Plutonic terrane
Metamorphic andor plutonic terrane
Melange schist or tectonite belt
9000 1800 KILOMETERS
9000 1800 KILOMETERS
Figure 8 Map showing the location of the major hydrothermal mineral deposits of United States listed in appendix 1 Geologic base is derived from Geological Survey of Canada (1995)
86
Figure 9 Map showing the location of the major sedimentary mineral deposits of United States listed in appendix 1 The map also shows the extent of sedimentary basins mentioned in the report Geologic base is derived from Geological Survey of Canada (1995) and sedimentary basins are from St John (2000)
87
WW
W
WW
WWW
W
WWW
XW
WW
W
W
WWW
XW
W
XW
W
WWWW
130deg 120deg 110deg 100deg 90deg 80deg 70deg
30deg
40deg
50deg
WWW
50deg
60deg
70deg
180deg170deg E 160deg 140deg 120deg 110deg130deg150deg170deg W
EXPLANATION
Rock typeMainly sedimentary terraneOther rock types
Major mineral depositsW Surficial placer
XW Surficial residual
9000 1800 KILOMETERS
9000 1800 KILOMETERS
Figure 10 Map showing the location of the major surficial mineral deposits of United States listed in appendix 1 Geologic base is derived from Geological Survey of Canada (1995)
88
Holocene
Pleistocene
Pliocene
Miocene
Oligocene
Eocene
Paleocene
Neo
gene
Cen
ozoi
c
Pale
ogen
e
Phanerozoic
Late
EarlyCretaceous
Mesozoic
Prec
ambr
ian
Late
Early
Late
Early
Late
Early
Late
Early
Late
Early
Middle
Late
Early
Middle
Terti
ary
Quaternary
Eon Era PeriodSubperiod Epoch Age
Late
Early
MiddleJurassic
Triassic
Late
EarlyPermian
Late
Early
001
076
18
36
5
11
165
24
34
285
55
37
49
61
65
160
144
97
205
180
228
242
248
256
295
304
311
324
340
354
372
416
391
442
495
544
458
470
505
518
2400
1600
900
3000
3400
3800
422
Millionsof Years
Late
Early
Middle
Paleozoic
Late
Early
MiddlePennsylvanian
Mississippian
Late
Early
MiddleDevonian
Late
Early
Middle
Late
Early
Late
Early
MiddleCambrian
Ordovician
Silurian
Late
Early
Middle
Late
Early
Middle
Proterozoic
Archean
None defined
Figure 11 Relative geologic time units used in this report (modified from Hansen 1991 and Haq and Van Eysinga 1998)
89
Figure 12 Simplified geologic map of North America Modified from Bally and others (1989) and Hoffman (1989) White labels are CRB ndash Columbia River flood basalt province K ndash Keweenawan flood basalt province and W Wrangellia flood basalts
90
Figure 13 Map of North American showing the geology of the North American craton underlying the sedimentary rocks that cover much of the continent Modified from Hoffman (1989)
91
Westernmargin of
craton
Interior ofcraton
Southeasternmargin of
craton
Easternmargin of
craton
Breakup ofPangea
Breakup ofRodinia
Assembly of theNorth Americancraton
Assembly of thesupercontinentRodinia
Assembly of thesupercontinentPangea
Igneous eventslinked to
mantle plumes
Geo
logi
c tim
em
illion
s of
yea
rbe
fore
pre
sent
s
0
100
1200
1100
1000
900
800
700
600
500
400
300
200
Gulf ofMexicoBasin
Cordilleranorogen
Ouachitaorogen
Rifting
Rift basinsEastern USA
Appalachianorogen
Willistonbasin
Grenvilleorogen
Rifting
1500
1400
1300
Belt basin
Rifting
Michiganbasin
2000
1900
1800
1700
1600
Trans-Hudsonorogen
Wrangellia
Columbia River
Central AtlanticMagmatic Province
Moyie
Pecos
Keweenawan
SW USAdiabaseprovince
Gunbarrel
Wichita Mountains
Late Central-Iapetus
Middle Central-Iapetus
Early Central-Iapetus
Yavapai Mazatal andCentral plains orogens
Penokeanorogen
Mid-continentrift
Figure 14 Summary of selected geologic events and features for the North American craton in the last 2000 million years Large igneous events from Ernst and Buchan (2001)
92
)))
JJJ
JJ
H
120deg130deg 110deg 100deg 90deg 80deg 70deg
30deg
40deg
9000 1800 KILOMETERS
9000 1800 KILOMETERS
180deg170deg E 170deg W 150deg 130deg 120deg
50deg
60deg
70degEXPLANATION
Rock typeMainly sedimentary terrane
Mainly volcanic terrane
Mixed sedimentary-volcanic terrane
Plutonic terrane
Metamorphic andor plutonic terrane
Melange schist or tectonite belt
Major mineral depositsBeryllium
Copper-cobalt
Copper-nickel-PGE
Palladium-platinum
132
4
160deg 140deg
Figure 15 Map showing the location of the major beryllium copper-cobalt copper-nickel-PGE and platinum-palladium mineral deposits of United States listed in appendix 1 Geologic base is derived from Geological Survey of Canada (1995) Numbered deposits are discussed in the report 1 ndash Babbitt Dunka Road and Maturi 2 ndash Idaho Cobalt belt (Blackbird Ram and Sunshine) 3 ndash East Boulder and Stillwater mines and 4 ndash Spor Mountain
93
Bedded ores
averagescale in meters
0 1000
20
Fault
Ore in fractures
Broken rock
Sediments
Water
Figure 16 Cross section schematically illustrating the characteristic features of an idealized sedimentary-exhalative (sedex) mineral deposit Modified from Lydon (1996)
94
118deg 116deg 114deg
112deg
47deg
45deg
51deg
HelenaMissoula
Libby
SullivanALBERTA
MONTANA
BRITISH COLUMBIAWASHINGTON
MONTANAIDAHO
WASHINGTONOREGON
CalgaryBelt-PurcellSupergroup
Cretaceousgranitic plutons
Rock Creek-Rock Lake
Spar Lake
Coeur dAlenemining district
IdahoCu-Co Belt
Figure 17 Simplified geologic map showing the distribution of metamorphosed sedimentary rocks (Belt-Purcell Supergroup) deposited in the Middle Proterozoic Belt basin and Cretaceous igneous rocks related to the Cordilleran orogen Mineral deposits shown in this diagram are discussed in the text Modified from Price and Sears (2000)
95
H
HHHHHHH
H
H
H
H
H
HHH
H
H
H
HH
H H
H
HH
H
HH
HHH
H
H
HHHHH
H
HH
H H
H
H
H
HH
HHHHH
HHHH
120deg130deg 110deg 100deg 90deg 80deg 70deg
30deg
40deg
HH
H
H
50deg
60deg
70deg
180deg170deg E 170deg W 150deg 130deg 120deg140deg160deg
EXPLANATION
Major copper deposits
H Copper with other metals
Other metals with some copper
Rock typeMainly sedimentary terrane
Mainly volcanic terrane
Mixed sedimentary-volcanic terrane
Plutonic terrane
Metamorphic andor plutonic terrane
Melange schist or tectonite belt
1
2 3
4
56
9000 1800 KILOMETERS
9000 1800 KILOMETERS
Figure 18 Map showing the location of the major copper mineral deposits of United States listed in appendix 1 Geologic base is derived from Geological Survey of Canada (1995) Numbered deposits are discussed in the report 1 ndash Rock CreekRock Lake 2 ndash ContinentalButte 3 ndash Babbit Dunka Road and Maturi 4 ndash Bingham Canyon 5 ndash MorenciMetcalf and 6 ndash Safford
96
0Kilometers
1
2
3
4
5
6
Volcanic rocks of a stratovolcano
Intrusive igneous rocks (quartz monzonite)
Breccia
Pre-volcanic basement rocks
Limestone beds
Mineralized veins
Mineralized rock
Older Rocks
Mineralization
Igneous rocks associated withhydrothermal ore deposits Elements
Ag - silverAs - arsenicAu - goldCu - copperHg - mercuryMn - manganeseMo - molybdenumPb - leadS - sulfurSb - antimonyZn - zinc
PbZnAg
Cu
CuMo
Mo Cu
Pb-Zn
Cu
ZnPbAgMn
AuAgSAsSbHgNative sulfur
AuAgCu
Porphyrycopper
Epithermal veins
Hot springs
fumerolesHigh-temperature
Distaldisseminated
Polymetallicreplacement
lead-zinc
Figure 19 Cross section through an idealized stratovolcano showing various styles of related mineralization
97
Figure 20 Map illustrating changes in metal content of mineralized rock and ore deposits in the Bingham district Utah The map was created by vertically projecting underground features to the surface Copper and copper+molybdenum mineralization is associated with a porphyry copper deposit The igneous intrusion responsible for forming these hydrothermal deposits is labeled as QMP on the map Hydrothermal solutions related to the porphyry copper deposit moved into and reacted with adjacent sedimentary rocks to form copper deposits and lead-zinc-silver deposits Modified from Atkinson and Einaudi (1978)
98
Figure 21 Map showing the distribution of the Middle Proterozoic Revett Formation and associated hydrothermal copper-silver mineralization in northwestern Montana and northern Idaho
99
94deg 93deg 92deg 91deg 90deg 89deg 88deg 87deg
46deg
47deg
48deg
EXPLANATIONSelected rock units
iron-formation
Portage Lake Volcanics
Duluth Complex
Deposit typeBasaltic Cu
Duluth Cu-Ni-PGE
Superior Fe
0 50 100 KILOMETERS
Mesabi Range
Gunflint RangeCANADA
CuyunaRange
MarquetteRange
MenomineeRange
Penokee-GogebecRange
MIN
NE
SO
TAW
ISC
ON
SIN MICHIGAN
Lake Superior7
65
43
21
8
KeweenawPeninsula
Figure 22 Map showing selected geologic features and the location of major sedimentary iron deposits (banded iron formation) magmatic copper-nickel-PGE deposits and hydrothermal copper deposits in basalt Map derived from Cannon and others (1997) Numbered deposits are discussed in the report 1 ndash Birch Lake 2 ndash Maturi 3 ndash Dunka Road 4 ndash Thunderbird 5 ndash Minntac 6 ndash Hibbing Taconite 7 ndash National Steel and 8 ndash Empire and Tilden
100
H
H
HHH
HH
H
H
H
H
H
H
H
H
H
HH
H
H
H
H
H
HH
H
H
H
H
H
H
H
H
H
H
H
HHHHH
HHHHH
H
HH
H
H
H
H
H
H
H
H
120deg130deg 110deg 100deg 90deg 80deg 70deg
30deg
40deg
180deg170deg E 170deg W 150deg 130deg 120deg
50deg
60deg
70deg
EXPLANATION
Major gold depositsH Gold with other metals
Other metals with gold
Rock typeMainly sedimentary terrane
Mainly volcanic terrane
Mixed sedimentary-volcanic terrane
Plutonic terrane
Metamorphic andor plutonic terrane
Melange schist or tectonite belt
1
2
3
9
74
58
6
9000 1800 KILOMETERS
H
HH
HHH
HH
H
160deg 140deg
9000 1800 KILOMETERS
Figure 23 Map showing the location of the major gold mineral deposits of United States listed in appendix 1 Geologic base is derived from Geological Survey of Canada (1995) Numbered deposits are discussed in the report 1 ndash Fort Knox 2 ndash Donlin Creek 3 ndash Homestake 4 ndash BetzePost 5 ndash McCoyCove 6 ndash Rochester 7 ndash McLaughlin 8 ndash Round Mountain and 9 ndash Mesquite
101
Quaternary - Tertiary units
Jurassic igneous rocks (diorite)
Devonian - Silurian sedimentary rocks
Silurian - Ordovician sedimentary rocks
Extent of gold deposit
Roberts Mountain Thrust
Meikle
Griffin
Rodeo
Post
Blue Star
Beast
Genesis
Banshee
Skarn Hill
GoldenApril
Betze
WinstonGoldstrikeIntrusion
LittleBoulderBasinStock
Deep PostScreamer
Bazza PointWest Bazza
North Star
Bobcat
DeepStar
9
Shalosky
0 1
KILOMETER
Figure 24 Map showing the distribution of sedimentary rock-hosted gold deposits and mineralization of the Blue-Star area of the Carlin Trend Nevada The extent of the gold deposits and igneous intrusions on the map was created by vertically projecting underground features to the surface Modified from Bettles (2002)
102
Archean crust
Golconda Allochthon
Roberts Mountain Allochthon
Oceanic crust
Proterozoic-Cambrianclastic sedimentary rocks
Jurassic and Triassic continental sedimentary rocks
Cambrian-Devoniancarbonate sedimentaryrocks
fault
Mississippian toPermian siliciclasticand carbonatesedimentary rocks
gold deposit
fault
Figure 25 Schematic east-west cross section of northern Nevada and northwest Utah showing the location of Carlin-type gold deposits in relation to large tectonic features The transition from Archean crust to oceanic crust formed during the breakup of the supercontinent Rodinia Rifting that led to the development of a new continental margin formed large faults that progressively thin the continental crust to the west Different sequences of sediments were deposited or faulted on this rifted continental margin Allochthons are packages of rocks that have been transported away from their origin site of origin along faults Later deformation caused the rift-related faults to move and break through the younger rocks Sedimentary rock-hosted ore deposits in northern Nevada appear to be clustered along linear trends that overlie these older faults Modified from Hofstra and Cline (2000)
103
Silica deposited fromwater flowing from
hot springs
Hot springs
50-100
0 50-100METERS
Rock alteredby steam
Silica depositedat the water table
Permeablelithology
Watertable
Gold oreconcentrated
in veins
Gold ore dispersedthroughout a
permeable lithology
Altered rockdominated byclay minerals
Strongly altered rockdominated by clay minerals
with some potassiumaluminosilicate minerals
Altered rockwith clay minerals
and calcium carbonate
Figure 26 Schematic cross section that illustrates generalized patterns of alteration and mineralization of epithermal gold deposits Modified from Hedenquist and others (2000)
104
lt
)
lt lt
)))))
)))
lt
lt
J
lt
)
)))
)
lt
120deg130deg 110deg 100deg 90deg 80deg 70deg
30deg
40deg
180deg170deg E 170deg W 150deg 130deg 120deg
50deg
60deg
70deg EXPLANATION
Rock typeMainly sedimentary terrane
Mainly volcanic terrane
Mixed sedimentary-volcanic terrane
Plutonic terrane
Metamorphic andor plutonic terrane
Melange schist or tectonite belt
Major mineral deposits Iron
lt Niobium rare-earth elements and other metals
lt
Rare-earth elements and other metals
J Titanium and iron
) Titanium zirconium and other materials
1 2
3
160deg 140deg
9000 1800 KILOMETERS
9000 1800 KILOMETERS
Figure 27 Map showing the location of the major iron niobium rare-earth metals and titanium mineral deposits of United States listed in appendix 1 Geologic base is derived from Geological Survey of Canada (1995) Numbered deposits are discussed in the report 1 ndash Mountain Pass 2 ndash Hicks Dome and 3 ndash Trail Ridge
105
H
H
HH HH
HH
H
H
H
120deg130deg 110deg 100deg 90deg 80deg 70deg
30deg
40deg
HH
50deg
60deg
70deg
EXPLANATION
Rock typeMainly sedimentary terrane
Mainly volcanic terrane
Mixed sedimentary-volcanic terrane
Plutonic terrane
Metamorphic andor plutonic terrane
Melange schist or tectonite belt
Major lead and zinc depositsH Lead and zinc with other metals
Other metals with lead and zinc
180deg170deg E 170deg W 150deg 130deg 120deg
12
3
4 5
67
9000 1800 KILOMETERS
9000 1800 KILOMETERS
140deg160deg
Figure 28 Map showing the location of the major lead and zinc mineral deposits of United States listed in appendix 1 Geologic base is derived from Geological Survey of Canada (1995) Numbered deposits are discussed in the report 1 ndash Red Dog and Su-Lik 2 ndash Arctic Camp 3 ndash Greens Creek 4 ndash Crandon 5 ndash PierreBalmatEdwards 6 ndash Viburnum Trend and Old Lead Belt and 7 ndash Tri-State
106
Fractured Zone
Disseminated copper ore
Disseminated iron zincand lead ore
Massive sulfide lens
Older volcanic rocks
Zinc- and lead-rich ore
Copper-rich ore
Younger volcanic orsedimentary rocksRocks rich in silica
and iron that weredeposited fromseawater
Figure 29 Cross section illustrating the essential features of an idealized volcanogenic massive sulfide deposit Modified from Lydon (1988)
107
Figure 30 Map showing the location of MVT lead-zinc districts in the Ozark region of the United States Arrows refer to inferred flow direction of ore fluid believed to have been derived from the Ouachita fold belt Modified from Leach and Sangster (1993)
108
Outcrops of Precambrianigneous rocks
Cambrian and Ordoviciansedimentary rocks
Area of intensivemineralization
Area of weak (trace)mineralization
Mine shaft
Old Lead Belt
St FrancoisMountains
0 10
ViburnumTrend
ViburnumMines
MagmontBuick
Brushy Creek
Fletcher
OzarkLead
MISSOURI
KILOMETERS
Figure 31 Map of southeast Missouri showing location of major Mississippi Valley ore districts surrounding outcrops of Precambrian igneous rocks in the St Francois Mountains The extent of mineralization associated with the Viburnum Trend shown on the map was created by vertically projecting underground features to the surface Modified from Sawkins (1984)
109
H
H
HHH
H
H
H
H
H
H
H
120deg130deg 110deg 100deg 90deg 80deg 70deg
30deg
40deg
H
50deg
60deg
70deg
EXPLANATION
Rock typeMainly sedimentary terrane
Mainly volcanic terrane
Mixed sedimentary-volcanic terrane
Plutonic terrane
Metamorphic andor plutonic terrane
Melange schist or tectonite belt
Major molybdenum depositsH Molybdenum with other metals
Other metals with molybdenum
180deg170deg E 170deg W 150deg 130deg 120deg
9000 1800 KILOMETERS
9000
160deg 140deg
1800 KILOMETERS
Figure 32 Map showing the location of the major molybdenum mineral deposits of United States listed in appendix 1 Geologic base is derived from Geological Survey of Canada (1995)
110
mafic lava flows5 km
10 km
sedimentary rocks
chromite seamPGE reef
titaniferousmagnetite layer
ultramafic rocksmafic rocks
basement rocks
feeder dike
marginal rocks(border phase)
disseminated tomassive sulfides
Figure 33 Idealized section through an ultramafic-to-mafic layered igneous intrusion showing the distribution of magmatic ore deposits
111
HHHH
H
H
H
H
H
H
H
H
H
H
H
H
120deg130deg 110deg 100deg 90deg 80deg 70deg
30deg
40deg
H
H
50deg
60deg
70deg
EXPLANATION
Rock typeMainly sedimentary terrane
Mainly volcanic terrane
Mixed sedimentary-volcanic terrane
Plutonic terrane
Metamorphic andor plutonic terrane
Melange schist or tectonite belt
Major silver depositsH Silver with other metals
Other metals with some silver
180deg170deg E 170deg W 150deg 130deg 120deg
12
3
45
6
78
910
11
140deg160deg
9000 1800 KILOMETERS
9000 1800 KILOMETERS
Figure 34 Map showing the location of the major silver mineral deposits of United States listed in appendix 1 Geologic base is derived from Geological Survey of Canada (1995) Numbered deposits are discussed in the report 1 ndash Red Dog and Su-Lik 2 ndash Arctic Camp 3 ndash Greens Creek 4 ndash Rock CreekRock Lake 5 ndash Galena and Lucky Friday mines Coeur drsquoAlene mining district 6 ndash Crandon 7 ndash McLaughlin and 8 ndash Rochester 9 ndash McCoyCove 10 ndash Round Mountain and 11 - Mesquite
112
AT
LAN
TIC
O
CE
AN
GEORGIAFLORIDA
JesupAmelia
Altama
Mineral City(Ponte Vedra)
Arlington
Brunswick
Jacksonville
Folkston
Waycross
Lake City Ridge
Starke
HighlandMaxville
TrailRidge
BaywoodPromontory
GreenCove
Springs
OkefenokeeSwamp
Yulee
FolkstonWest
Boulougne
CabinBluff
TrailRidge
WaycrossRidge
Heavy mineral concentrations
Sand ridges
0 20MILES
0 32KILOMETERS
FL
GA
Figure 35 Map showing heavy mineral deposits in northeastern Florida and southeastern Georgia Sand ridges are shown in yellow Heavy mineral concentrations are colored red Modified from Pirkle and others (1993)
113
H
J
H
Jltltltlt
HHHHHH
JJ
120deg130deg 110deg 100deg 90deg 80deg 70deg
30deg
40deg
180deg170deg E 170deg W 150deg 130deg 120deg
50deg
60deg
70deg
EXPLANATION
Rock typeMainly sedimentary terrane
Mainly volcanic terrane
Mixed sedimentary-volcanic terrane
Plutonic terrane
Metamorphic andor plutonic terrane
Melange schist or tectonite belt
Major mineral depositsH Barite
J Garnet
lt Talc
1
2
3
4
9000 1800 KILOMETERS
9000 1800 KILOMETERS
160deg 140deg
Figure 36 Map showing the location of the major barite garnet and talc mineral deposits of United States listed in appendix 1 Geologic base is derived from Geological Survey of Canada (1995) Numbered deposits are discussed in the report 1 ndash Emerald Creek 2 ndash Yellowstone 3 ndash Greystone and 4 ndash North Creek
114
J
H
JH
JJ
J
JJJJJJJJJJJJJJJJJ
JJJ
J J
JJJJ
J
JJJJ
J
lt
H
HH
J
JJ
JJJ
J
JJJ
J
J
J
J
J
lt
lt
120deg130deg 110deg 100deg 90deg 80deg 70deg
30deg
40deg
J
50deg
60deg
70deg
EXPLANATION
Rock typeMainly sedimentary terrane
Other rock types
Major mineral deposits
lt
Sodium-bentonite
J Phosphate rock
H Diatomite
J Kaolin and other clay minerals
Sepiolite bentonite saponite hectorite
180deg170deg E 170deg W 150deg 130deg 120deg
1
2
4
3
lt
9000 1800 KILOMETERS
9000 1800 KILOMETERS
160deg 140deg
Figure 37 Map showing the location of the major sodium bentonite phosphate rock diatomite kaolin and limestone mineral deposits of United States listed in appendix 1 Geologic base is derived from Geological Survey of Canada (1995) Numbered deposits are discussed in the report 1 ndash Hardin 2 ndash Western Phosphate field 3 ndash Lovelock and 4 ndash Lompoc
115
lt
J
C
(
(
((
(
lt
JJJJ
HJH HJ
J
H
HHHHHHHH
J
J
H
J
H
H
HHlt
ltltltltltlt
120deg130deg 110deg 100deg 90deg 80deg 70deg
30deg
40deg
180deg170deg E 170deg W 150deg 130deg 120deg
50deg
60deg
70deg
EXPLANATION
Rock typeMainly sedimentary terrane
Other rock types
Major mineral deposits Gypsum or anhydrite
( Boron
C Bromine
J Salt (halite) with other evaporite minerals
H Potash with other evaporite minerals
lt Sodium carbonate
lt
Sodium sulfate with other evaporite minerals
Sedimentary basin
1
160deg 140deg
Williston
Anadarko
Michigan
Appa
lachia
n
MississippiLouisiana
Arkoma
SouthTexas
Permian
Gulf Coast
WashakieGreenRiver
Uinta
Paradox
Salton
Sand WashOwens Lake
Searles Lake
9000 1800 KILOMETERS
9000 1800 KILOMETERS
Figure 38 Map showing the location of the major gypsum boron bromine salt potash and sodium carbonate mineral deposits of United States listed in appendix 1 Geologic base is derived from Geological Survey of Canada (1995) Sedimentary basins are shown in color labeled basins are discussed in the text Sedimentary basins from St John (2000) Numbered deposit is discussed in the report 1 ndash Boron
116
Phosphate Districts 1 - South Florida 2 - Central Florida 3 - North Central Florida 4 - North Florida 5 - South Georgia 6 - East Florida 7 - St Augustine 8 - Savannah 9 - Beaufort10 - Frying Pan11 - Pungo River12 - Ocala Hard Rock
ATLANTICOCEAN
Upland areas
Coastal marine environments
Areas of major phosphoritesedimentation
Depositional basins - intermediatewater depths
Depositional basins - deep water
7
6
1
2
34
5
9
10
8
11
12
100200
100200
200MILES0
Bathymetric contours in meters
0 322KILOMETERS
Figure 39 Map showing the location of the major phosphorite deposits relative to the Miocene geologic framework of the southeast Atlantic Coastal Plain-continental shelf system Modified from Riggs (1979)
117
0 1000MILES
Gypsum
Halite
Sylvite andother salts
0 1600KILOMETERS
Gulf Coast Basin
PermianBasin
ParadoxBasin
WillistonBasin
MichiganBasin
AppalachianBasin
MaritimesBasin
Figure 40 Map showing the distribution the location of major salt and potash deposits in evaporite basins in North America showing Modified from Kesler (1994)
118
WYOMING
IDAHO
UTAH
COLORADO0 100
KILOMETERS
Bedded Trona(hydrated sodium carbonate )Nahcolite (sodium bicarbonate )
Bedded halite and sodium carbonate salts
GrandJunction
Salt Lake City
Green River Formation
Uinta Basin
PiceanceCreekBasin
Green RiverBasin
Great DivideBasin
WashakieBasin
FossilBasin
107deg113deg
38deg
43deg
GreenRiver
Figure 41 Map showing the distribution of the Green River Formation and the location of sodium carbonate deposits in Utah Colorado and Wyoming Modified from Dyni (1996)
119
14
12
12
10
6
610
6
0 15 10
KILOMETERS
Green River
OrientalChemicalTG Soda
Ash
GeneralChemical
FMC5
SolvayMinerals
UN
ITA
CO
S
WE
ETW
ATE
R C
O
LIN
CO
LN C
O
BLMknown sodiumleasing area
6
10
12
gt14
Trona Bed 17Thickness in Feet
Figure 42 Map showing the thickness of trona bed 17 and Wyoming state mine permit areas Modified from Dyni (1996)
120
Figure 43 Charts showing the density of exploration sites for selected regions of the United States The density represents the number of sites for a state as described in literature from 1994 to 2003 divided by the area of the state A) Density of sites in Nevada Alaska Arizona California Idaho Montana and New Mexico B) Density of sites in Alaska relative to Arizona California Idaho Montana and New Mexico (combined) C) Density of sites in Alaska and Minnesota Source of information ndash D Wilburn (written comm 2003)
121
Figure 44 Graph showing the number of active mining claims held on public lands in the United States from 1976 to 2003 Source of information ndash DC Causey (written comm 2004)
122
Figure 45 Graph showing the number of active mining operations in the United States from 1979 to 2002 A) Total number of metal and nonmetal mines B) Total number of stone and surface sand and gravel mines Data from National Mining Association (2003b)
123
Appendix 1 Major mineral deposits in the United States [The information in this table is organized first by class then commodity and finally by deposit name Latitude and longitude are given in decimal degrees
Positive and negative values of latitude are in the northern and southern hemisphere respectively Positive and negative values of longitude are in the eastern and
western hemispheres respectively ldquoCommoditiesrdquo is a list of the major metals and materials associated with each deposit The most important commodities are
listed first The terms in ldquoClassrdquo broadly group the mineral deposits based on how they form the terms in deposit type are descriptive names given to groups of
mineral deposits that form in specific geologic settings ldquoModel Nordquo and ldquoModel namerdquo are the number and name of descriptive deposit models published by the
US Geological Survey (Stoeser and Heran 2000) ldquoReferencerdquo provides brief citations for additional information for the mineral deposit]
Deposit name State Latitude Longitude Commodities Class Deposit type Model No
Model name Reference
Spor Mountain Utah 39707 -113217 beryllium hydrothermal Epithermal beryllium deposit
na no model Harben and Kužvart (1996)
Kennecott Alaska 61528 -142840 copper hydrothermal Copper sulfide mineral deposit associated with carbonate sedimentary rocks
-- Kennecott Cu US Geological Survey National Mineral Resource Assessment Team (2000) Kirkham (1996)
Allouez Michigan 47289 -88404 copper hydrothermal Native copper deposits associated with basalt flows
23 Basaltic Cu Kirkham (1996)
Baltic Michigan 47065 -88634 copper hydrothermal Native copper deposits associated with basalt flows
23 Basaltic Cu Kirkham (1996)
Calumet - Hecla Michigan 47246 -88450 copper hydrothermal Native copper deposits associated with basalt flows
23 Basaltic Cu Kirkham (1996)
Appendix 1 Major mineral deposits in the United States ndash continued
Deposit name State Latitude Longitude Commodities Class Deposit type Model No
Model name Reference
Spor Mountain Utah 39707 -113217 beryllium hydrothermal Epithermal beryllium deposit
na no model Harben and Kužvart (1996)
Kearsarge Michigan 47278 -88418 copper hydrothermal Native copper deposits associated with basalt flows
23 Basaltic Cu Kirkham (1996)
Kingston Conglomerate
Michigan 47291 -88385 copper hydrothermal Native copper deposits associated with basalt flows
23 Basaltic Cu Long and others (1998)
Osceola Michigan 47225 -88459 copper hydrothermal Native copper deposits associated with basalt flows
23 Basaltic Cu Kirkham (1996)
Pewabic Michigan 47133 -88567 copper hydrothermal Native copper deposits associated with basalt flows
23 Basaltic Cu Kirkham (1996)
Bond Creek - Orange Hill
Alaska 62200 -142767 copper hydrothermal Porphyry copper deposit
17 Porphyry Cu Mutschler and others (1999)
Glacier Peak Washington 48198 -120979 copper hydrothermal Porphyry copper deposit
17 Porphyry Cu Singer and others (2002) Long and others (1998)
Lakeshore (Cyprus Casa Grande Cyprus Tohono)
Arizona 32520 -111880 copper hydrothermal Porphyry copper deposit
17 Porphyry Cu Singer and others (2002) Long and others (1998)
Miami East Arizona 33420 -110740 copper hydrothermal Porphyry copper deposit
17 Porphyry Cu Long and others (1998)
Poston Butte (Florence)
Arizona 33117 -111417 copper hydrothermal Porphyry copper deposit
17 Porphyry Cu Singer and others (2002) Long and others (1998)
Red Mountain Arizona 31490 -110720 copper hydrothermal Porphyry copper deposit
17 Porphyry Cu Singer and others (2002)
Santa Cruz Arizona 32890 -111860 copper hydrothermal Porphyry copper deposit
17 Porphyry Cu Long and others (1998)
Santa Cruz (Casa Grande) Sacaton
Arizona 32867 -111950 copper hydrothermal Porphyry copper deposit
17 Porphyry Cu Mutschler and others (1999)
126
Appendix 1 Major mineral deposits in the United States ndash continued
Deposit name State Latitude Longitude Commodities Class Deposit type Model No
Model name Reference
Spor Mountain Utah 39707 -113217 beryllium hydrothermal Epithermal beryllium deposit
na no model Harben and Kužvart (1996)
Sheep Mountain Arizona 34080 -112460 copper hydrothermal Porphyry copper deposit
17 Porphyry Cu Singer and others (2002)
Superior East (Pinal Ranch)
Arizona 33378 -110999 copper hydrothermal Porphyry copper deposit
17 Porphyry Cu Singer and others (2002)
Yerington Nevada 38983 -119183 copper hydrothermal Porphyry copper deposit
17 Porphyry Cu Mutschler and others (1999)
Kona Dolomite Michigan 46533 -87450 copper hydrothermal Sediment-hosted copper deposit
30b2 Sediment-hosted copper reduced-facies subtype
Cox and others (2003) Long and others (1998)
White Pine Michigan 46767 -89567 copper hydrothermal Sediment-hosted copper deposit
30b2 Sediment-hosted copper reduced-facies subtype
Cox and others (2003) Long and others (1998)
Blackbird Idaho 45121 -114339 copper cobalt
hydrothermal Sedimentary exhalative copper-cobalt deposit
24d Blackbird Co-Cu
Spanski (2004)
Iron Creek Idaho 44962 -114115 copper cobalt
hydrothermal Sedimentary exhalative copper-cobalt deposit
24d Blackbird Co-Cu
Spanski (2004)
Ram (Idaho Cobalt Project)
Idaho 45140 -114360 copper cobalt
hydrothermal Sedimentary exhalative copper-cobalt deposit
24d Blackbird Co-Cu
Spanski (2004)
Ajo (New Cornelia)
Arizona 32360 -112850 copper gold hydrothermal Porphyry copper deposit
17 Porphyry Cu Singer and others (2002) Long and others (1998)
Dos Pobres Arizona 32970 -109650 copper gold hydrothermal Porphyry copper deposit
20c Porphyry Cu-Au
Long and others (1998)
Ely (Robinson Ruth)
Nevada 39260 -114999 copper gold hydrothermal Porphyry copper deposit
17 Porphyry Cu Singer and others (2002) Mutschler and others (1999)
127
Appendix 1 Major mineral deposits in the United States ndash continued
Deposit name State Latitude Longitude Commodities Class Deposit type Model No
Model name Reference
Spor Mountain Utah 39707 -113217 beryllium hydrothermal Epithermal beryllium deposit
na no model Harben and Kužvart (1996)
Lone Star Arizona 32930 -109600 copper gold hydrothermal Porphyry copper deposit
20c Porphyry Cu-Au
Long and others (1998)
Margaret (Earl) Washington 46356 -122081 copper gold hydrothermal Porphyry copper deposit
17 Porphyry Cu Singer and others (2002) Long and others (1998)
Pebble Copper (Pebble Beach)
Alaska 59898 -155296 copper gold hydrothermal Porphyry copper deposit
20c Porphyry Cu-Au
Singer and others (2002)
Safford (Lone Star includes Dos Pobres San Juan)
Arizona 32933 -109600 copper gold hydrothermal Porphyry copper deposit
20c Porphyry Cu-Au
Singer and others (2002) Long and others (1998)
Bagdad Arizona 34580 -113170 copper molybdenum silver gold
hydrothermal Porphyry copper deposit
21a Porphyry Cu-Mo
Singer and others (2002)
Bingham Canyon
Utah 40540 -112140 copper molybdenum silver gold
hydrothermal Porphyry copper deposit
21a Porphyry Cu-Mo
Long and others (1998)
Butte (Continental Berkeley etc)
Montana 46020 -112526 copper molybdenum silver gold
hydrothermal Porphyry copper deposit
21a Porphyry Cu-Mo
Long and others (1998)
Casa Grande West (Santa Cruz)
Arizona 32867 -111950 copper molybdenum silver gold
hydrothermal Porphyry copper deposit
21a Porphyry Cu-Mo
Singer and others (2002)
Esperanza - Sierrita
Arizona 31869 -111120 copper molybdenum silver gold
hydrothermal Porphyry copper deposit
21a Porphyry Cu-Mo
Singer and others (2002)
Miami - Inspiration (includes Bluebird Copper Cities Globe Van Dyke)
Arizona 33420 -110740 copper molybdenum silver gold
hydrothermal Porphyry copper deposit
21a Porphyry Cu-Mo
Singer and others (2002) Long and others (1998)
128
Appendix 1 Major mineral deposits in the United States ndash continued
Deposit name State Latitude Longitude Commodities Class Deposit type Model No
Model name Reference
Spor Mountain Utah 39707 -113217 beryllium hydrothermal Epithermal beryllium deposit
na no model Harben and Kužvart (1996)
Mineral Park Arizona 35367 -114150 copper molybdenum silver gold
hydrothermal Porphyry copper deposit
21a Porphyry Cu-Mo
Kirkham and Sinclair (1996a)
Morenci - Metcalf
Arizona 33090 -109340 copper molybdenum silver gold
hydrothermal Porphyry copper deposit
21a Porphyry Cu-Mo
Singer and others (2002) Long and others (1998)
Pinto Valley - Castle Dome
Arizona 33400 -110950 copper molybdenum silver gold
hydrothermal Porphyry copper deposit
21a Porphyry Cu-Mo
Long and others (1998)
Ray Arizona 33160 -110970 copper molybdenum silver gold
hydrothermal Porphyry copper deposit
21a Porphyry Cu-Mo
Singer and others (2002) Long and others (1998)
San Manuel - Kalamazoo
Arizona 32670 -110670 copper molybdenum silver gold
hydrothermal Porphyry copper deposit
21a Porphyry Cu-Mo
Singer and others (2002) Long and others (1998)
Taurus Alaska 63521 -141324 copper molybdenum silver gold
hydrothermal Porphyry copper deposit
21a Porphyry Cu-Mo
Long and others (1998)
Twin Buttes Arizona 31880 -111030 copper molybdenum silver gold
hydrothermal Porphyry copper deposit
21a Porphyry Cu-Mo
Singer and others (2002)
Tyrone New Mexico 32633 -108367 copper molybdenum silver gold
hydrothermal Porphyry copper deposit
21a Porphyry Cu-Mo
Singer and others (2002)
Bisbee (Warren) Arizona 31433 -109900 copper silver hydrothermal Porphyry copper deposit
17 Porphyry Cu Mutschler and others (1999)
Castle Dome (Pinto Valley includes Carlota - Cactus)
Arizona 33400 -110950 copper silver hydrothermal Porphyry copper deposit
17 Porphyry Cu Singer and others (2002)
129
Appendix 1 Major mineral deposits in the United States ndash continued
Deposit name State Latitude Longitude Commodities Class Deposit type Model No
Model name Reference
Spor Mountain Utah 39707 -113217 beryllium hydrothermal Epithermal beryllium deposit
na no model Harben and Kužvart (1996)
Hannover Mountains (Fierro - Hannover)
New Mexico 32833 -108083 copper silver hydrothermal Porphyry copper deposit
17 Porphyry Cu Singer and others (2002)
Helvetia (Rosemont includes Rosemont Peach - Elgin Broadtop Butte and Copper World)
Arizona 31830 -110760 copper silver hydrothermal Porphyry copper deposit
17 Porphyry Cu Singer and others (2002)
Mission - Pima - San Xavier
Arizona 31983 -111067 copper silver hydrothermal Porphyry copper deposit
17 Porphyry Cu Singer and others (2002) Long and others (1998)
Rosemont - Peach - Elgin - Broadtop Butte
Arizona 31830 -110760 copper silver hydrothermal Porphyry copper deposit
18a Porphyry Cu skarn-related
Long and others (1998)
Rock Creek (includes Rock Lake Montanore Copper Gulch Horizon Basin Rock Peak)
Montana 48079 -115677 copper silver hydrothermal Revett copper deposit
30b4 Revett Cu Cox and others (2003) Long and others (1998)
Spar Lake (Troy mine)
Montana 48230 -115905 copper silver hydrothermal Revett copper deposit
30b4 Revett Cu Cox and others (2003)
Bingham Canyon (skarn)
Utah 40540 -112140 copper silver gold
hydrothermal Copper skarn deposit
18b Skarn Cu Long and others (1998)
Robinson Nevada 39260 -115000 copper silver gold
hydrothermal Porphyry copper deposit
18a Porphyry Cu skarn-related
Long and others (1998)
130
Appendix 1 Major mineral deposits in the United States ndash continued
Deposit name State Latitude Longitude Commodities Class Deposit type Model No
Model name Reference
Spor Mountain Utah 39707 -113217 beryllium hydrothermal Epithermal beryllium deposit
na no model Harben and Kužvart (1996)
Santa Rita (Chino includes Groundhog - Pewabic - Empire (skarns))
New Mexico 32792 -108067 copper silver gold
hydrothermal Porphyry copper deposit
17 Porphyry Cu Singer and others (2002)
Magma Arizona 33306 -111093 copper silver gold
hydrothermal Porphyry-related copper veins
gsc17 Vein polymetallic porphyry Cu-related
Kirkham and Sinclair (1996b)
Butte (Veins) Montana 46020 -112530 copper silver zinc gold lead
hydrothermal Porphyry-related copper veins
gsc17 Vein copper deposits (Vein polymetallic porphyry Cu-related)
Long and others (1998)
Donlin Creek Alaska 62075 -158217 gold hydrothermal Intrusion-related gold deposit
43 Plutonic porphyry Au
Long and others (1998)
Fort Knox Alaska 64967 -147367 gold hydrothermal Intrusion-related gold deposit
43 Plutonic porphyry Au
Long and others (1998)
Pogo (Liese zone)
Alaska 64283 -144883 gold hydrothermal Intrusion-related gold deposit
43 Plutonic porphyry Au
Mutschler and others (1999)
Alaska - Juneau (AJ Perseverance)
Alaska 58308 -134345 gold hydrothermal Orogenic gold veins
36a Low-sulfide Au-quartz vein
Long and others (1998)
Empire - North Star
California 39206 -121045 gold hydrothermal Orogenic gold veins
36a Low-sulfide Au-quartz vein
Long and others (1998)
Homestake South Dakota
44360 -103770 gold hydrothermal Orogenic gold veins
36b Homestake Au
Long and others (1998)
Idaho - Maryland - Eureka - Brunswick
California 39224 -121038 gold hydrothermal Orogenic gold veins
36a Low-sulfide Au-quartz vein
Long and others (1998)
131
Appendix 1 Major mineral deposits in the United States ndash continued
Deposit name State Latitude Longitude Commodities Class Deposit type Model No
Model name Reference
Spor Mountain Utah 39707 -113217 beryllium hydrothermal Epithermal beryllium deposit
na no model Harben and Kužvart (1996)
Jamestown California 37946 -120437 gold hydrothermal Orogenic gold veins
36a Low-sulfide Au-quartz vein
Long and others (1998)
Kensington - Jualin
Alaska 58866 -135087 gold hydrothermal Orogenic gold veins
36a Low-sulfide Au-quartz vein
Long and others (1998)
Candelaria Nevada 38150 -118080 gold silver hydrothermal Distal disseminated gold deposit
19c Distal disseminated Ag-Au
Long and others (1998)
Hardshell Arizona 31460 -110720 gold silver hydrothermal Distal disseminated gold deposit
19c Distal disseminated Ag-Au
Long and others (1998)
Lone Tree - Stonehouse
Nevada 40830 -117210 gold silver hydrothermal Distal disseminated gold deposit
19c Distal disseminated Ag-Au
Long and others (1998) Tingley (2002)
McCoy - Cove Nevada 40340 -117210 gold silver hydrothermal Distal disseminated gold deposit
19c Distal disseminated Ag-Au
Long and others (1998)
Rochester Nevada 40280 -118150 gold silver hydrothermal Distal disseminated gold deposit
19c Distal disseminated Ag-Au
Long and others (1998)
Bald Mountain (Wharf Trojan Portland)
South Dakota
44344 -103842 gold silver hydrothermal Epithermal gold deposit
22b Alakaline Au-Te (Au-Ag-Te veins)
Long and others (1998)
Black Hills Tertiary (includes Gilt Edge Golden Reward Annie Creek (Foley Ridge) Richmond Hill Green Mountain)
South Dakota
44333 -103767 gold silver hydrothermal Epithermal gold deposit
25a-d Epithermal vein
Mutschler and others (1999)
132
Appendix 1 Major mineral deposits in the United States ndash continued
Deposit name State Latitude Longitude Commodities Class Deposit type Model No
Model name Reference
Spor Mountain Utah 39707 -113217 beryllium hydrothermal Epithermal beryllium deposit
na no model Harben and Kužvart (1996)
Comstock Lode Nevada 39320 -119590 gold silver hydrothermal Epithermal gold deposit
25c Epithermal vein Comstock
Long and others (1998)
Cripple Creek Colorado 38717 -105133 gold silver hydrothermal Epithermal gold deposit
22b Alakaline Au-Te (Au-Ag-Te veins)
Long and others (1998)
Goldbanks Nevada 40465 -117604 gold silver hydrothermal Epithermal gold deposit
25a Hot-spring Au-Ag
Long and others (1998)
Golden Sunlight Montana 45906 -112014 gold silver hydrothermal Epithermal gold deposit
22b Alakaline Au-Te (Au-Ag-Te veins)
Long and others (1998) Mutschler and others (1999)
Goldfield Nevada 37710 -117210 gold silver hydrothermal Epithermal gold deposit
25e Epithermal quartz-alunite Au
Long and others (1998)
Ken Snyder (Midas) mine (Gold Circle district)
Nevada 41250 -116790 gold silver hydrothermal Epithermal gold deposit
25c Epithermal vein Comstock
Long and others (1998) Tingley (2002)
McDonald Montana 47000 -112525 gold silver hydrothermal Epithermal gold deposit
25a Hot-spring Au-Ag
Long and others (1998)
McLaughlin California 38836 -122357 gold silver hydrothermal Epithermal gold deposit
25a Hot-spring Au-Ag
Long and others (1998)
Mesquite California 33098 -114963 gold silver hydrothermal Epithermal gold deposit
25a Hot-spring Au-Ag
Long and others (1998)
Oatman Arizona 35100 -114447 gold silver hydrothermal Epithermal gold deposit
25c Epithermal vein Comstock
Long and others (1998)
Ortiz Mountains (Old Placers)
New Mexico 35317 -106167 gold silver hydrothermal Epithermal gold deposit
25a-d Epithermal vein
Mutschler and others (1999)
Republic District (Knob Hill etc)
Washington 48673 -118758 gold silver hydrothermal Epithermal gold deposit
25c Epithermal vein Comstock
Long and others (1998)
133
Appendix 1 Major mineral deposits in the United States ndash continued
Deposit name State Latitude Longitude Commodities Class Deposit type Model No
Model name Reference
Spor Mountain Utah 39707 -113217 beryllium hydrothermal Epithermal beryllium deposit
na no model Harben and Kužvart (1996)
Round Mountain Nevada 38700 -117080 gold silver hydrothermal Epithermal gold deposit
25a Hot-spring Au-Ag
Long and others (1998)
Sleeper Nevada 41330 -118050 gold silver hydrothermal Epithermal gold deposit
25a Hot-spring Au-Ag
Long and others (1998) Tingley (2002)
Tonopah Nevada 38070 -117230 gold silver hydrothermal Epithermal gold deposit
25c Epithermal vein Comstock
Long and others (1998)
Zortman - Landusky
Montana 47929 -108586 gold silver hydrothermal Epithermal gold deposit
22b Alakaline Au-Te (Au-Ag-Te veins)
Long and others (1998)
Battle Mountain (Tomboy - Minnie - Fortitude - Northeast Ext - Iron Canyon - Midas - Phoenix)
Nevada 40530 -117120 gold silver hydrothermal Gold skarn deposit 18f Skarn Au Long and others (1998) Mutschler and others (1999) Tingley (2002) Newmont (2003)
Betze - Post (Betze Screamer and Deep Post)
Nevada 40977 -116358 gold silver hydrothermal Sediment-hosted gold deposit
26a1 Sediment-hosted Au
Long and others (1998) Bettles (2002)
Carlin - Hardie Nevada 40912 -116320 gold silver hydrothermal Sediment-hosted gold deposit
26a1 Sediment-hosted Au
Long and others (1998)
Chimney Creek South - Rabbit Creek
Nevada 41280 -117157 gold silver hydrothermal Sediment-hosted gold deposit
26a1 Sediment-hosted Au
Singer and others (1993)
Cortez (Cortez Pipeline South Pipeline Pediment Gap Gold Acres and Horse Canyon)
Nevada 40248 -116740 gold silver hydrothermal Sediment-hosted gold deposit
26a1 Sediment-hosted Au
Long and others (1998) Tingley (2002) Placer Dome (2002a)
134
Appendix 1 Major mineral deposits in the United States ndash continued
Deposit name State Latitude Longitude Commodities Class Deposit type Model No
Model name Reference
Spor Mountain Utah 39707 -113217 beryllium hydrothermal Epithermal beryllium deposit
na no model Harben and Kužvart (1996)
Genesis - Blue Star - Beast - Bobcat - Northstar
Nevada 40952 -116352 gold silver hydrothermal Sediment-hosted gold deposit
26a1 Sediment-hosted Au
Long and others (1998) Bettles (2002)
Getchell (Getchell Turquoise Ridge North Zone)
Nevada 41210 -117260 gold silver hydrothermal Sediment-hosted gold deposit
26a1 Sediment-hosted Au
Long and others (1998) Placer Dome (2002b)
Gold Quarry South Layback (Maggie Creek district)
Nevada 40825 -116225 gold silver hydrothermal Sediment-hosted gold deposit
26a1 Sediment-hosted Au
Long and others (1998) Newmont (2003)
Jerritt Canyon (Burns Basin Enfield Bell Pattani Springs)
Nevada 41340 -116010 gold silver hydrothermal Sediment-hosted gold deposit
26a1 Sediment-hosted Au
Long and others (1998)
Leeville (West Leeville Four Corners Turf)
Nevada 40930 -116320 gold silver hydrothermal Sediment-hosted gold deposit
26a1 Sediment-hosted Au
Long and others (1998) Newmont (2003)
Meikle (Purple Vein) (Meikle South Meikle Griffin and Rodeo)
Nevada 41010 -116360 gold silver hydrothermal Sediment-hosted gold deposit
26a1 Sediment-hosted Au
Long and others (1998) Bettles (2002)
Twin Creeks (Chimney Creek and Rabbit Creek)
Nevada 41280 -117170 gold silver hydrothermal Sediment-hosted gold deposit
26a1 Sediment-hosted Au
Long and others (1998)
Goodsprings Nevada 35850 -115500 gold silver zinc lead
hydrothermal Polymetallic replacement deposit
19a Polymetallic replacement
Long and others (1998)
135
Appendix 1 Major mineral deposits in the United States ndash continued
Deposit name State Latitude Longitude Commodities Class Deposit type Model No
Model name Reference
Spor Mountain Utah 39707 -113217 beryllium hydrothermal Epithermal beryllium deposit
na no model Harben and Kužvart (1996)
Pride of the Mountains
Washington 47981 -121369 gold silver zinc lead copper
hydrothermal Polymetallic veins 22c Polymetallic veins
Long and others (1998)
Dragon Mine Utah 39918 -112104 halloysite (clay mineral with tube-like crystals)
hydrothermal Hydrothermal kaolin (halloysite) deposit
25l2 Hydrothermal kaolin
Industrial Minerals (2004a)
Hector California 34755 -116431 hectorite (lithium-rich clay mineral)
hydrothermal Hydrothermal lithium-rich clay deposit
25l3 Lithium -rich clays
Harben and Kužvart (1996)
Montana Mountains
Nevada 41767 -118108 hectorite (lithium-rich clay mineral)
hydrothermal Hydrothermal lithium-rich clay deposit
25l3 Lithium -rich clays
Odom (1992)
Eagle Mountain California 33883 -115542 iron hydrothermal Iron skarn deposit 18d Skarn Fe Singer and others (1993)
Iron Springs Utah 37683 -113250 iron hydrothermal Iron skarn deposit 18d Skarn Fe Singer and others (1993)
Benson New York 44179 -75006 iron hydrothermal Magnetite deposits in volcanic rocks
25i Volcanic-hosted magnetite
Singer and others (1993)
Pea Ridge Missouri 38125 -91042 iron hydrothermal Magnetite deposits in volcanic rocks
25i Volcanic-hosted magnetite
Singer and others (1993)
Burkesville Kentucky 36775 -85335 lead zinc hydrothermal Mississippi Valley-type deposit (MVT)
32b Mississippi Valley Appalachian Zn
Long and others (1998)
Tri - state (Galena Joplin Picher)
Kansas Missouri Oklahoma
37083 -94650 lead zinc hydrothermal Mississippi Valley-type deposit (MVT)
32a Mississippi Valley SE Missouri Pb-Zn
Long and others (1998)
136
Appendix 1 Major mineral deposits in the United States ndash continued
Deposit name State Latitude Longitude Commodities Class Deposit type Model No
Model name Reference
Spor Mountain Utah 39707 -113217 beryllium hydrothermal Epithermal beryllium deposit
na no model Harben and Kužvart (1996)
Star - Morning Idaho 47468 -115812 lead zinc silver
hydrothermal Coeur d Alene-type polymetallic vein
-- Coeur d Alene-type polymetallic vein Revett-St Regis subtype
Long and others (1998)
Old Lead Belt Missouri 37842 -90534 lead zinc silver
hydrothermal Mississippi Valley-type deposit (MVT)
32a Mississippi Valley SE Missouri Pb-Zn
Long and others (1998)
Viburnum Trend Missouri 37583 -91167 lead zinc silver copper
hydrothermal Mississippi Valley-type deposit (MVT)
32a Mississippi Valley SE Missouri Pb-Zn
Long and others (1998)
Big Ben - Niehart
Montana 46950 -110733 molybdenum hydrothermal Climax-type molybdenum deposit
16 Climax Mo Mutschler and others (1999)
Cave Peak Texas 31433 -104883 molybdenum hydrothermal Climax-type molybdenum deposit
16 Climax Mo Mutschler and others (1999)
Climax Colorado 39367 -106167 molybdenum hydrothermal Climax-type molybdenum deposit
16 Climax Mo Mutschler and others (1999)
Henderson - Urad
Colorado 39750 -105833 molybdenum hydrothermal Climax-type molybdenum deposit
16 Climax Mo Mutschler and others (1999)
Mount Emmons - Redwell Basin
Colorado 38883 -107067 molybdenum hydrothermal Climax-type molybdenum deposit
16 Climax Mo Mutschler and others (1999)
Mount Hope Nevada 39783 -116167 molybdenum hydrothermal Climax-type molybdenum deposit
16 Climax Mo Mutschler and others (1999)
137
Appendix 1 Major mineral deposits in the United States ndash continued
Deposit name State Latitude Longitude Commodities Class Deposit type Model No
Model name Reference
Spor Mountain Utah 39707 -113217 beryllium hydrothermal Epithermal beryllium deposit
na no model Harben and Kužvart (1996)
Pine Grove Utah 38336 -113606 molybdenum hydrothermal Climax-type molybdenum deposit
16 Climax Mo Singer and others (1993)
Quartz Hill Alaska 55400 -130467 molybdenum hydrothermal Climax-type molybdenum deposit
16 Climax Mo Mutschler and others (1999) Singer and others (1993)
Questa New Mexico 36683 -105500 molybdenum hydrothermal Climax-type molybdenum deposit
16 Climax Mo Mutschler and others (1999)
Thompson Creek Idaho 44333 -114583 molybdenum hydrothermal Porphyry molybdenum deposit
21b Porphyry Mo Low-F
Mutschler and others (1999)
Buckingham Nevada 40617 -117075 molybdenum copper
hydrothermal Porphyry molybdenum deposit
21b Porphyry Mo Low-F
Long and others (1998)
Cumo Idaho 44000 -115783 molybdenum copper
hydrothermal Porphyry molybdenum deposit
21b Porphyry Mo Low-F
Mutschler and others (1999)
Mount Tolman Washington 48050 -118700 molybdenum copper
hydrothermal Porphyry molybdenum deposit
21b Porphyry Mo Low-F
Mutschler and others (1999)
Copper Queen Arizona 31430 -109910 silver copper gold zinc lead
hydrothermal Polymetallic replacement deposit
19a Polymetallic replacement
Long and others (1998)
Arctic Camp Alaska 67181 -156386 silver copper zinc
hydrothermal Volcanogenic massive sulfide deposit (VMS)
28a Massive sulfide Kuroko
Long and others (1998)
Rocky Range Utah 38450 -113063 silver gold copper
hydrothermal Copper skarn deposit
18b Skarn Cu Long and others (1998)
Leadville Colorado 39250 -106250 silver gold lead zinc copper
hydrothermal Polymetallic replacement deposit
19a Polymetallic replacement
Long and others (1998)
138
Appendix 1 Major mineral deposits in the United States ndash continued
Deposit name State Latitude Longitude Commodities Class Deposit type Model No
Model name Reference
Spor Mountain Utah 39707 -113217 beryllium hydrothermal Epithermal beryllium deposit
na no model Harben and Kužvart (1996)
Greens Creek Alaska 58077 -134619 silver gold zinc lead
hydrothermal Volcanogenic massive sulfide deposit (VMS)
28a Massive sulfide Kuroko
Long and others (1998)
Red Mountain - Sneffels - Telluride
Colorado 37958 -107750 silver gold zinc lead copper
hydrothermal Polymetallic veins 22c Polymetallic veins
Long and others (1998)
Presidio Texas 29810 -104330 silver lead hydrothermal Polymetallic replacement deposit
19a Polymetallic replacement
Long and others (1998)
Bunker Hill - Last Chance
Idaho 47536 -116138 silver lead zinc
hydrothermal Coeur d Alene-type polymetallic vein
-- Coeur d Alene-type polymetallic vein Revett-St Regis subtype
Long and others (1998)
Galena Idaho 47477 -115965 silver lead zinc
hydrothermal Coeur d Alene-type polymetallic vein
-- Coeur d Alene-type polymetallic vein Revett-St Regis subtype
Long and others (1998)
Lucky Friday Idaho 47471 -115780 silver lead zinc
hydrothermal Coeur d Alene-type polymetallic vein
-- Coeur d Alene-type polymetallic vein Revett-St Regis subtype
Long and others (1998)
Creede (Amethyst Bulldog etc veins)
Colorado 37875 -106933 silver lead zinc
hydrothermal Epithermal gold deposit
25b Epithermal vein Creede
Long and others (1998)
Aspen Colorado 39167 -106833 silver lead zinc
hydrothermal Polymetallic replacement deposit
19a Polymetallic replacement
Long and others (1998)
139
Appendix 1 Major mineral deposits in the United States ndash continued
Deposit name State Latitude Longitude Commodities Class Deposit type Model No
Model name Reference
Spor Mountain Utah 39707 -113217 beryllium hydrothermal Epithermal beryllium deposit
na no model Harben and Kužvart (1996)
Sunshine Idaho 47501 -116068 silver lead zinc copper
hydrothermal Coeur d Alene-type polymetallic vein
-- Coeur d Alene-type polymetallic vein Revett-St Regis subtype
Long and others (1998)
Bingham Canyon (polymetallic replacement)
Utah 40540 -112140 silver lead zinc gold copper
hydrothermal Polymetallic replacement deposit
19a Polymetallic replacement
Long and others (1998)
Park City Utah 40620 -111510 silver lead zinc gold copper
hydrothermal Polymetallic replacement deposit
19a Polymetallic replacement
Long and others (1998)
Tintic - East Tintic
Utah 39910 -112100 silver lead zinc gold copper
hydrothermal Polymetallic replacement deposit
19a Polymetallic replacement
Long and others (1998)
Crandon Wisconsin 45483 -88926 silver zinc gold copper lead
hydrothermal Volcanogenic massive sulfide deposit (VMS)
28a Massive sulfide Kuroko
Long and others (1998)
Beaverhead Montana 45224 -112301 talc hydrothermal Hydrothermal talc deposit
18m Metasomatic and metamorphic replacement talc
Spanski (2004)
Regal (Keystone)
Montana 45172 -112425 talc hydrothermal Hydrothermal talc deposit
18m Metasomatic and metamorphic replacement talc
Spanski (2004)
Treasure (Treasure State Treasure Chest
Montana 45228 -112309 talc hydrothermal Hydrothermal talc deposit
18m Metasomatic and metamorphic replacement talc
Spanski (2004)
140
Appendix 1 Major mineral deposits in the United States ndash continued
Deposit name State Latitude Longitude Commodities Class Deposit type Model No
Model name Reference
Spor Mountain Utah 39707 -113217 beryllium hydrothermal Epithermal beryllium deposit
na no model Harben and Kužvart (1996)
Yellowstone (Johnny Gulch Cyprus Cameron Montana Talc)
Montana 45077 -111730 talc hydrothermal Hydrothermal talc deposit
18m Metasomatic and metamorphic replacement talc
Spanski (2004)
Franklin New Jersey 41120 -74590 zinc hydrothermal Sedimentary exhalative zinc-lead deposit
31a Sedimentary exhalative Zn-Pb
Long and others (1998)
Sterling Hill New Jersey 41080 -74600 zinc hydrothermal Sedimentary exhalative zinc-lead deposit
31a Sedimentary exhalative Zn-Pb
Long and others (1998)
Fountain Run Kentucky 36704 -85943 zinc lead hydrothermal Mississippi Valley-type deposit (MVT)
32b Mississippi Valley Appalachian Zn
Long and others (1998)
Mascot - Jefferson City
Tennessee 36400 -83350 zinc lead hydrothermal Mississippi Valley-type deposit (MVT)
32b Mississippi Valley Appalachian Zn
Long and others (1998)
Pierrepont Edwards and Balmat
New York 44252 -75400 zinc lead hydrothermal Sedimentary exhalative zinc-lead deposit
31a Sedimentary exhalative Zn-Pb
Long and others (1998)
Lik - Su Alaska 68167 -163200 zinc lead silver
hydrothermal Sedimentary exhalative zinc-lead deposit
31a Sedimentary exhalative Zn-Pb
Long and others (1998)
Red Dog Alaska 68067 -162824 zinc lead silver
hydrothermal Sedimentary exhalative zinc-lead deposit
31a Sedimentary exhalative Zn-Pb
Long and others (1998)
Gilman Colorado 39533 -106376 zinc silver copper lead
hydrothermal Lead-zinc skarn deposit
18c Skarn Zn-Pb Dawson (1996)
Birch Lake Minnesota 47817 -91733 copper magmatic Magmatic copper-nickel deposit near base of mafic igneous intrusion
5a Duluth Cu-Ni-PGE
Long and others (1998)
141
Appendix 1 Major mineral deposits in the United States ndash continued
Deposit name State Latitude Longitude Commodities Class Deposit type Model No
Model name Reference
Spor Mountain Utah 39707 -113217 beryllium hydrothermal Epithermal beryllium deposit
na no model Harben and Kužvart (1996)
Babbit (Minnamax) - Mesaba project
Minnesota 47641 -91883 copper nickel PGE
magmatic Magmatic copper-nickel deposit near base of mafic igneous intrusion
5a Duluth Cu-Ni-PGE
Long and others (1998) Miller Severson and others (2002)
Dunka Road - Northmet project
Minnesota 47610 -91960 copper nickel PGE
magmatic Magmatic copper-nickel deposit near base of mafic igneous intrusion
5a Duluth Cu-Ni-PGE
Long and others (1998) Cannon and others (1997)
Maturi Minnesota 47801 -91756 copper nickel PGE
magmatic Magmatic copper-nickel deposit near base of mafic igneous intrusion
5a Duluth Cu-Ni-PGE
Long and others (1998) Miller Severson and others (2002)
Bessemer City South Carolina
35333 -81167 lithium magmatic Pegmatite 13b Li pegmatites Anstett and others (1990)
Kings Mountain North Carolina
35250 -81342 lithium mica magmatic Pegmatite rich in lithium
13b Li pegmatites Harben and Kužvart (1996)
Black Canyon Arizona 34120 -112210 mica feldspathic sand
magmatic Pegmatite rich in mica
13f Mica pegmatites
Industrial Minerals (1999c) Industrial Minerals (2002)
Wind Mountain New Mexico 32025 -105515 nepheline syenite
magmatic Igneous rock rich in nepheline
na no model Industrial Minerals (1995)
McClure Mountain Complex
Colorado 38350 -105467 niobium magmatic Mineralization associated with carbonatite igneous complex
10 carbonatite Crockett and Sutphin (1993)
142
Appendix 1 Major mineral deposits in the United States ndash continued
Deposit name State Latitude Longitude Commodities Class Deposit type Model No
Model name Reference
Spor Mountain Utah 39707 -113217 beryllium hydrothermal Epithermal beryllium deposit
na no model Harben and Kužvart (1996)
Iron Hill (Powderhorn Cebolla Creek)
Colorado 38250 -107050 niobium rare-earth elements barium fluorite phosphorus titanium
magmatic Mineralization associated with carbonatitealkalic igneous complex
10 carbonatite Woolley (1987)
Deep Creek Oregon 42050 -119950 niobium rare-earth elements phosphorus fluorium stronium
magmatic Mineralization associated with carbonatite igneous complex
10 carbonatite Woolley (1987)
J - M Reef - East Boulder mine
Montana 45403 -110007 palladium platinum
magmatic Reef-type PGE deposit
2b Merensky Reef PGE
Spanski (2004) Zientek and others (2002)
J - M Reef - Stillwater mine
Montana 45389 -109874 palladium platinum
magmatic Reef-type PGE deposit
2b Merensky Reef PGE
Spanski (2004) Zientek and others (2002)
Gem Park Colorado 38267 -105550 phosphorus niobium vermiculite rare-earth elements thorium copper barium
magmatic Mineralization associated with carbonatitealkalic igneous complex
10 carbonatite Woolley (1987)
Mountain Pass California 35483 -115533 rare-earth elements barium
magmatic Mineralization associated with carbonatite igneous complex
10 carbonatite Woolley (1987)
143
Appendix 1 Major mineral deposits in the United States ndash continued
Deposit name State Latitude Longitude Commodities Class Deposit type Model No
Model name Reference
Spor Mountain Utah 39707 -113217 beryllium hydrothermal Epithermal beryllium deposit
na no model Harben and Kužvart (1996)
Hicks Dome Illinois 37600 -88400 rare-earth elements fluorite
magmatic Mineralization associated with carbonatite igneous complex
10 carbonatite Jackson and Christiansen (1993)
Bear Lodge Mountains (southern)
Wyoming 44483 -104450 rare-earth elements thorium
magmatic Mineralization associated with carbonatite igneous complex
10 carbonatite Woolley (1987)
Tucker - Poplar Lake deposit
Minnesota 48167 -90667 titanium magnetite
magmatic Layers of ilmentite and titanomagnetite in ferrogabbroic and anothositic rocks
3 Bushveld Fe-Ti-V
Towner and others (1988)
Hamilton Montana 46262 -113888 vermiculite magmatic Vermiculite associated with ultramafic igneous rocks
na no model Industrial Minerals (1999a)
Zonolite (Rainy Creek Vermiculite Mountain Libby)
Montana 48434 -115406 vermiculite magmatic Vermiculite associated with ultramafic igneous rocks
na no model Spanski (2004)
Eagle (Slate Creek)
Alaska 64567 -142500 asbestos metamorphic Asbestos in metamorphosed ultramafic igneous rock
8d Serpentine-hosted asbestos
Foster (1969)
Gore Mountain New York 43679 -74054 garnet metamorphic Garnet in metamorphosed igneous rocks
na no model Harben and Kužvart (1996) New York State Department of Environmental Conservation (undated)
144
Appendix 1 Major mineral deposits in the United States ndash continued
Deposit name State Latitude Longitude Commodities Class Deposit type Model No
Model name Reference
Spor Mountain Utah 39707 -113217 beryllium hydrothermal Epithermal beryllium deposit
na no model Harben and Kužvart (1996)
Ruby Mountain Quarry
New York 43736 -74112 garnet metamorphic Garnet in metamorphosed igneous rocks
na no model New York State Department of Environmental Conservation (undated)
Addie (Smoky Mtns)
North Carolina
35399 -83159 olivine metamorphic Dunite na no model Harben and Kužvart (1996)
Twin Sisters Mountain (Cascade Mtns)
Washington 48708 -121958 olivine metamorphic Dunite na no model Harben and Kužvart (1996)
Hunter Mountain California 36533 -117517 wollastonite metamorphic Wollastonite in metamorphosed sedimentary rocks
18g Skarn wollastonite
Bauer and others (1994)
Oak Hill Mine Site
New York 44304 -73580 wollastonite metamorphic Wollastonite in metamorphosed sedimentary rocks
18g Skarn wollastonite
New York State Department of Environmental Conservation (undated) Bauer and others (1994)
Willsboro Mine (Fox Knoll Mine)
New York 44346 -73432 wollastonite garnet
metamorphic Wollastonite in metamorphosed sedimentary rocks
18g Skarn wollastonite
New York State Department of Environmental Conservation (undated) Harben and Kužvart (1996)
145
Appendix 1 Major mineral deposits in the United States ndash continued
Deposit name State Latitude Longitude Commodities Class Deposit type Model No
Model name Reference
Spor Mountain Utah 39707 -113217 beryllium hydrothermal Epithermal beryllium deposit
na no model Harben and Kužvart (1996)
Meigs - Attapulgus - Quincy district
Georgia Florida
30667 -84417 attapulgite (palygorskite fullers earth)
sedimentary 34e Palygorskite Harben and Kužvart (1996) Hosterman and Patterson (1992)
Argenta Nevada 40633 -116733 barite sedimentary Marine exhalative deposit -barite
31b Bedded barite Orris (1985) Papke (1984)
Greystone Nevada 40281 -116901 barite sedimentary Marine exhalative deposit -barite
31b Bedded barite Orris (1985) Papke (1984)
Mountain Springs
Nevada 40315 -117041 barite sedimentary Marine exhalative deposit -barite
31b Bedded barite Orris (1985) Papke (1984)
Rossi Nevada 40599 -116719 barite sedimentary Marine exhalative deposit -barite
31b Bedded barite Orris (1985) Industrial Minerals (1992)
Snoose Creek Nevada 41502 -115039 barite sedimentary Marine exhalative deposit -barite
31b Bedded barite Harben and Kužvart (1996)
Stormy Creek Nevada 41523 -115198 barite sedimentary Marine exhalative deposit -barite
31b Bedded barite Harben and Kužvart (1996)
Basalt Nevada 38011 -118219 diatomite sedimentary Lacustrine biogenic deposit - diatomite
31s Lacustrine diatomite
Taylor (2004)
Burney California 41033 -121683 diatomite sedimentary Lacustrine biogenic deposit - diatomite
31s Lacustrine diatomite
Taylor (2004)
Fernley Nevada 39600 -119250 diatomite sedimentary Lacustrine biogenic deposit - diatomite
31s Lacustrine diatomite
Taylor (2004)
Lovelock Nevada 40267 -118797 diatomite sedimentary Lacustrine biogenic deposit - diatomite
31s Lacustrine diatomite
Taylor (2004)
Vale Oregon diatomite sedimentary Lacustrine biogenic deposit - diatomite
31s Lacustrine diatomite
Taylor (2004)
Lompoc California 34582 -120345 diatomite sedimentary Marine biogenic deposit - diatomite
na no model Taylor (2004)
146
Appendix 1 Major mineral deposits in the United States ndash continued
Deposit name State Latitude Longitude Commodities Class Deposit type Model No
Model name Reference
Spor Mountain Utah 39707 -113217 beryllium hydrothermal Epithermal beryllium deposit
na no model Harben and Kužvart (1996)
Black River Falls Wisconsin 44293 -90725 iron sedimentary Banded iron formation
34a Superior Fe Cannon and others (1997)
Gogebic Range - Eureka - Asteroid Mine
Michigan 46476 -89984 iron sedimentary Banded iron formation
34a Superior Fe Cannon and others (1997)
Gogebic Range - Plymouth Mine
Michigan 46470 -89957 iron sedimentary Banded iron formation
34a Superior Fe Cannon and others (1997)
Gogebic Range - Sunday Lake Group Mines
Michigan 46483 -89920 iron sedimentary Banded iron formation
34a Superior Fe Cannon and others (1997)
Gogebic Range - Wakefield Mine
Michigan 46469 -89951 iron sedimentary Banded iron formation
34a Superior Fe Cannon and others (1997)
Gogebic Range - West Gogebic Taconite Deposit
Wisconsin 46297 -90653 iron sedimentary Banded iron formation
34a Superior Fe Cannon and others (1997)
Marquette Range - Empire Mine
Michigan 46461 -87597 iron sedimentary Banded iron formation
34a Superior Fe Cannon and others (1997)
Marquette Range - Tilden Mine
Michigan 46447 -87642 iron sedimentary Banded iron formation
34a Superior Fe Cannon and others (1997)
Menominee Range - Buck Mine
Michigan 46059 -88618 iron sedimentary Banded iron formation
34a Superior Fe Cannon and others (1997)
Menominee Range - Cannon Mine
Michigan 46077 -88615 iron sedimentary Banded iron formation
34a Superior Fe Cannon and others (1997)
Menominee Range - Groveland Mine
Michigan 45993 -87981 iron sedimentary Banded iron formation
34a Superior Fe Cannon and others (1997)
Menominee Range - Hiawatha Mine 1
Michigan 46075 -88645 iron sedimentary Banded iron formation
34a Superior Fe Cannon and others (1997)
147
Appendix 1 Major mineral deposits in the United States ndash continued
Deposit name State Latitude Longitude Commodities Class Deposit type Model No
Model name Reference
Spor Mountain Utah 39707 -113217 beryllium hydrothermal Epithermal beryllium deposit
na no model Harben and Kužvart (1996)
Menominee Range - Homer Mine
Michigan 46116 -88657 iron sedimentary Banded iron formation
34a Superior Fe Cannon and others (1997)
Menominee Range - Iron River - Sherwood Mine
Michigan 46112 -88641 iron sedimentary Banded iron formation
34a Superior Fe Cannon and others (1997)
Menominee Range - Wauseca - Aronson Mine (Konwinski)
Michigan 46111 -88647 iron sedimentary Banded iron formation
34a Superior Fe Cannon and others (1997)
Mesabi Range - Gross - Nelson Mine
Minnesota 47478 -92564 iron sedimentary Banded iron formation
34a Superior Fe Cannon and others (1997)
Mesabi Range - Hibbing Taconite
Minnesota 47460 -92958 iron sedimentary Banded iron formation
34a Superior Fe Cannon and others (1997)
Mesabi Range - Mckinley Mine
Minnesota 47522 -92400 iron sedimentary Banded iron formation
34a Superior Fe Cannon and others (1997)
Mesabi Range - Minntac Mine
Minnesota 47545 -92654 iron sedimentary Banded iron formation
34a Superior Fe Cannon and others (1997)
Mesabi Range - Minorca Mine
Minnesota 47543 -92519 iron sedimentary Banded iron formation
34a Superior Fe Cannon and others (1997)
Mesabi Range - National Steel Pellet Plant Mine
Minnesota 47423 -93069 iron sedimentary Banded iron formation
34a Superior Fe Cannon and others (1997)
Mesabi Range - Peter Mitchell Mine
Minnesota 47666 -91917 iron sedimentary Banded iron formation
34a Superior Fe Cannon and others (1997)
Mesabi Range - Plummer Mine
Minnesota 47321 -93396 iron sedimentary Banded iron formation
34a Superior Fe Cannon and others (1997)
Mesabi Range - Rana Mine
Minnesota 47520 -92744 iron sedimentary Banded iron formation
34a Superior Fe Cannon and others (1997)
148
Appendix 1 Major mineral deposits in the United States ndash continued
Deposit name State Latitude Longitude Commodities Class Deposit type Model No
Model name Reference
Spor Mountain Utah 39707 -113217 beryllium hydrothermal Epithermal beryllium deposit
na no model Harben and Kužvart (1996)
Mesabi Range - Rouchleau Mine
Minnesota 47511 -92523 iron sedimentary Banded iron formation
34a Superior Fe Cannon and others (1997)
Mesabi Range - Sherman Mine
Minnesota 47483 -92831 iron sedimentary Banded iron formation
34a Superior Fe Cannon and others (1997)
Mesabi Range - Thunderbird Mine
Minnesota 47482 -92548 iron sedimentary Banded iron formation
34a Superior Fe Cannon and others (1997)
Mesabi Range - Whitney Mine
Minnesota 47448 -92910 iron sedimentary Banded iron formation
34a Superior Fe Cannon and others (1997)
Mesabi Range - Wyoming Mine
Minnesota 47531 -92507 iron sedimentary Banded iron formation
34a Superior Fe Cannon and others (1997)
Atlantic coastal plain phosphate province
Florida 27888 -82036 phosphate rock
sedimentary Marine biogenic-chemical sediment - phosphate rock
34d Phosphate warm current type
Van Kauwenbergh and others (1990)
Atlantic coastal plain phosphate province Blake PlateauCharleston Bump
South Carolina
31500 -79000 phosphate rock
sedimentary Marine biogenic-chemical sediment - phosphate rock
34d Phosphate warm current type
Riggs (1989)
Atlantic coastal plain phosphate province Charleston - Beaufort District
South Carolina
32750 -80000 phosphate rock
sedimentary Marine biogenic-chemical sediment - phosphate rock
34d Phosphate warm current type
British Sulphur Corporation (1964)
Atlantic coastal plain phosphate province East Florida phosphate district
Florida 27800 -80781 phosphate rock
sedimentary Marine biogenic-chemical sediment - phosphate rock
34d Phosphate warm current type
149
Appendix 1 Major mineral deposits in the United States ndash continued
Deposit name State Latitude Longitude Commodities Class Deposit type Model No
Model name Reference
Spor Mountain Utah 39707 -113217 beryllium hydrothermal Epithermal beryllium deposit
na no model Harben and Kužvart (1996)
Atlantic coastal plain phosphate province Gardinier Mine (Cargill Mine)
Florida 27667 -81763 phosphate rock
sedimentary Marine biogenic-chemical sediment - phosphate rock
34d Phosphate warm current type
Van Kauwenbergh and others (1990)
Atlantic coastal plain phosphate province Hopewell
Florida 27925 -82106 phosphate rock
sedimentary Marine biogenic-chemical sediment - phosphate rock
34d Phosphate warm current type
Orris and Chernoff (2002) Chernoff and Orris (2002)
Atlantic coastal plain phosphate province Land Pebble district Fort Green
Florida 27668 -82007 phosphate rock
sedimentary Marine biogenic-chemical sediment - phosphate rock
34d Phosphate warm current type
Van Kauwenbergh and others (1990)
Atlantic coastal plain phosphate province Land Pebble district Fort Meade Mine (Mobil)
Florida 27766 -81807 phosphate rock
sedimentary Marine biogenic-chemical sediment - phosphate rock
34d Phosphate warm current type
Van Kauwenbergh and others (1990)
Atlantic coastal plain phosphate province Land Pebble district Four Corners
Florida 27664 -82091 phosphate rock
sedimentary Marine biogenic-chemical sediment - phosphate rock
34d Phosphate warm current type
Van Kauwenbergh and others (1990)
Atlantic coastal plain phosphate province Land Pebble district Haynsworth Mine
Florida 27758 -82014 phosphate rock
sedimentary Marine biogenic-chemical sediment - phosphate rock
34d Phosphate warm current type
Van Kauwenbergh and others (1990)
150
Appendix 1 Major mineral deposits in the United States ndash continued
Deposit name State Latitude Longitude Commodities Class Deposit type Model No
Model name Reference
Spor Mountain Utah 39707 -113217 beryllium hydrothermal Epithermal beryllium deposit
na no model Harben and Kužvart (1996)
Atlantic coastal plain phosphate province Land Pebble district Hookers Prairie
Florida 27781 -81939 phosphate rock
sedimentary Marine biogenic-chemical sediment - phosphate rock
34d Phosphate warm current type
Van Kauwenbergh and others (1990)
Atlantic coastal plain phosphate province Land Pebble district Payne Creek
Florida 27690 -81941 phosphate rock
sedimentary Marine biogenic-chemical sediment - phosphate rock
34d Phosphate warm current type
Jasinski (1998)
Atlantic coastal plain phosphate province Land Pebble district Rockland
Florida 27754 -81867 phosphate rock
sedimentary Marine biogenic-chemical sediment - phosphate rock
34d Phosphate warm current type
Van Kauwenbergh and others (1990)
Atlantic coastal plain phosphate province Land Pebble district Saddle Creek
Florida 28033 -81834 phosphate rock
sedimentary Marine biogenic-chemical sediment - phosphate rock
34d Phosphate warm current type
Van Kauwenbergh and others (1990)
Atlantic coastal plain phosphate province Land Pebble district Silver City
Florida 27800 -81903 phosphate rock
sedimentary Marine biogenic-chemical sediment - phosphate rock
34d Phosphate warm current type
British Sulphur Corporation (1987)
Atlantic coastal plain phosphate province Land Pebble district South Fort Meade
Florida 27667 -81763 phosphate rock
sedimentary Marine biogenic-chemical sediment - phosphate rock
34d Phosphate warm current type
Griffiths (1995)
151
Appendix 1 Major mineral deposits in the United States ndash continued
Deposit name State Latitude Longitude Commodities Class Deposit type Model No
Model name Reference
Spor Mountain Utah 39707 -113217 beryllium hydrothermal Epithermal beryllium deposit
na no model Harben and Kužvart (1996)
Atlantic coastal plain phosphate province Noranda
Florida phosphate rock
sedimentary Marine biogenic-chemical sediment - phosphate rock
34d Phosphate warm current type
Van Kauwenbergh and McClellan (1990)
Atlantic coastal plain phosphate province North Carolina district Lee Creek Mine
North Carolina
35384 -76794 phosphate rock
sedimentary Marine biogenic-chemical sediment - phosphate rock
34d Phosphate warm current type
Van Kauwenbergh and McClellan (1990)
Atlantic coastal plain phosphate province North Carolina district North Carolina Phosphate Corp
North Carolina
35333 -76771 phosphate rock
sedimentary Marine biogenic-chemical sediment - phosphate rock
34d Phosphate warm current type
Riggs (1989)
Atlantic coastal plain phosphate province North Florida - South Georgia district Swift Creek Mine
Florida Georgia
30452 -82857 phosphate rock
sedimentary Marine biogenic-chemical sediment - phosphate rock
34d Phosphate warm current type
Van Kauwenbergh and others (1990)
Atlantic coastal plain phosphate province Ona
Florida 27520 -81980 phosphate rock
sedimentary Marine biogenic-chemical sediment - phosphate rock
34d Phosphate warm current type
Jasinski (2000)
Atlantic coastal plain phosphate province Onslow EmbaymentFrying Pan Phosphate District
North Carolina
33750 -77500 phosphate rock
sedimentary Marine biogenic-chemical sediment - phosphate rock
34d Phosphate warm current type
Riggs (1989)
152
Appendix 1 Major mineral deposits in the United States ndash continued
Deposit name State Latitude Longitude Commodities Class Deposit type Model No
Model name Reference
Spor Mountain Utah 39707 -113217 beryllium hydrothermal Epithermal beryllium deposit
na no model Harben and Kužvart (1996)
Atlantic coastal plain phosphate province Onslow EmbaymentNortheast Onslow Bay District
North Carolina
34500 -76750 phosphate rock
sedimentary Marine biogenic-chemical sediment - phosphate rock
34d Phosphate warm current type
Riggs (1989)
Atlantic coastal plain phosphate province Pine Level
Florida 27250 -81991 phosphate rock
sedimentary Marine biogenic-chemical sediment - phosphate rock
34d Phosphate warm current type
Jasinski (2000)
Atlantic coastal plain phosphate province Raine
Florida 27725 -81811 phosphate rock
sedimentary Marine biogenic-chemical sediment - phosphate rock
34d Phosphate warm current type
Van Kauwenbergh and others (1990)
Atlantic coastal plain phosphate province Savannah District
Georgia 32050 -81083 phosphate rock
sedimentary Marine biogenic-chemical sediment - phosphate rock
34d Phosphate warm current type
British Sulphur Corporation (1964)
Atlantic coastal plain phosphate province South Florida phosphate district
Florida 27519 -82208 phosphate rock
sedimentary Marine biogenic-chemical sediment - phosphate rock
34d Phosphate warm current type
McFaul and others (2000)
Atlantic coastal plain phosphate province Suwanee River Mine
Florida Georgia
30437 -82777 phosphate rock
sedimentary Marine biogenic-chemical sediment - phosphate rock
34d Phosphate warm current type
Van Kauwenbergh and others (1990)
Aurora District North Carolina
35500 -76500 phosphate rock
sedimentary Marine biogenic-chemical sediment - phosphate rock
34d Phosphate warm current type
Griffiths (1995)
153
Appendix 1 Major mineral deposits in the United States ndash continued
Deposit name State Latitude Longitude Commodities Class Deposit type Model No
Model name Reference
Spor Mountain Utah 39707 -113217 beryllium hydrothermal Epithermal beryllium deposit
na no model Harben and Kužvart (1996)
Lisburne Group Alaska 68633 -155750 phosphate rock
sedimentary Marine biogenic-chemical sediment - phosphate rock
Cathcart and others (1984)
Western Phosphate Field Uinta Mountains Park City Formation Vernal
Utah 40607 -109491 phosphate rock
sedimentary Marine biogenic-chemical sediment - phosphate rock
34c Phosphate upwelling type
Jasinski (2000)
Atlantic coastal plain phosphate province Bronson (East Ocala Hard Rock) District
Florida 29333 -82500 phosphate rock
sedimentary Marine biogenic-chemical sediment - phosphate rock residual enrichment
34d Phosphate warm current type
British Sulphur Corporation (1964)
Atlantic coastal plain phosphate province Ridgeland Basin - Beaufort District
South Carolina
32583 -80917 phosphate rock
sedimentary Marine biogenic-chemical sediment - phosphate rock residual enrichment
34d Phosphate warm current type
British Sulphur Corporation (1964)
Atlantic coastal plain phosphate province Steinhatchee (N Ocala Hard Rock) District
Florida 29900 -83317 phosphate rock
sedimentary Marine biogenic-chemical sediment - phosphate rock residual enrichment
34d Phosphate warm current type
Foose (1993)
Western Phosphate Field Phosphoria Formation Conda
Idaho 42728 -111527 phosphate rock
sedimentary Marine biogenic-chemical sediment - phosphate rock residual enrichment
34c Phosphate upwelling type
McFaul and others (2000)
154
Appendix 1 Major mineral deposits in the United States ndash continued
Deposit name State Latitude Longitude Commodities Class Deposit type Model No
Model name Reference
Spor Mountain Utah 39707 -113217 beryllium hydrothermal Epithermal beryllium deposit
na no model Harben and Kužvart (1996)
Western Phosphate Field Phosphoria Formation Deseret Basin - - Laketown
Utah 41827 -111290 phosphate rock
sedimentary Marine biogenic-chemical sediment - phosphate rock residual enrichment
34c Phosphate upwelling type
McFaul and others (2000)
Western Phosphate Field Phosphoria Formation Enoch Valley
Idaho 42881 -111407 phosphate rock
sedimentary Marine biogenic-chemical sediment - phosphate rock residual enrichment
34c Phosphate upwelling type
Jasinski (1998) Jasinski (2000)
Western Phosphate Field Phosphoria Formation Montana phosphate district
Montana 45041 -111957 phosphate rock
sedimentary Marine biogenic-chemical sediment - phosphate rock residual enrichment
34c Phosphate upwelling type
McFaul and others (2000)
Western Phosphate Field Phosphoria Formation Smoky Canyon
Idaho 42670 -111130 phosphate rock
sedimentary Marine biogenic-chemical sediment - phosphate rock residual enrichment
34c Phosphate upwelling type
Jasinski (1998)
Amargosa Valley
Nevada 36450 -116433 sepiolite bentonite saponite hectorite
sedimentary Altered volcanic ash beds
na no model Harben and Kužvart (1996)
Hardin district Wyoming 44580 -108170 sodium-bentonite
sedimentary Altered volcanic ash beds
28e1 Sedimentary bentonite sodium
Harben and Kužvart (1996)
Northern Black Hills district
Wyoming South Dakota
44580 -108170 sodium-bentonite
sedimentary Altered volcanic ash beds
28e1 Sedimentary bentonite sodium
Harben and Kužvart (1996)
155
Appendix 1 Major mineral deposits in the United States ndash continued
Deposit name State Latitude Longitude Commodities Class Deposit type Model No
Model name Reference
Spor Mountain Utah 39707 -113217 beryllium hydrothermal Epithermal beryllium deposit
na no model Harben and Kužvart (1996)
Sublette Range (combined)
Wyoming 42200 -110983 vanadium phosphate rock
sedimentary Marine biogenic-chemical sediment - banasium-rich phosphate rock
British Sulphur Corporation (1987)
Ash Meadows California 35950 -116250 zeolite sedimentary Lacustrine deposit - zeolite
25o2 Sedimentary zeolites Zeolites in tuffs of saline alkaline-lake deposits
Holmes (1994)
Bear River Idaho 42424 -111381 zeolite sedimentary Lacustrine deposit - zeolite
25o2 Sedimentary zeolites Zeolites in tuffs of saline alkaline-lake deposits
Industrial Minerals (2004b)
Bowie Arizona 32450 -109367 zeolite sedimentary Lacustrine deposit - zeolite
25o2 Sedimentary zeolites Zeolites in tuffs of saline alkaline-lake deposits
Eyde and Eyde 1987
Harney Lake Oregon 43228 -118943 zeolite sedimentary Lacustrine deposit - zeolite
25o2 Sedimentary zeolites Zeolites in tuffs of saline alkaline-lake deposits
Holmes (1994)
Atlas Utah 38337 -113141 halloysite (clay mineral with tube-like crystals)
sedimentary and residual
Sedimentary kaolin (halloysite) deposit
na no model Industrial Minerals (2004a)
156
Appendix 1 Major mineral deposits in the United States ndash continued
Deposit name State Latitude Longitude Commodities Class Deposit type Model No
Model name Reference
Spor Mountain Utah 39707 -113217 beryllium hydrothermal Epithermal beryllium deposit
na no model Harben and Kužvart (1996)
Aiken district South Carolina
33642 -81628 kaolin sedimentary and residual
Laterites developed on sedimentary deposits sedimentary deposits derived from laterites
31k Sedimentary kaolin
Harben and Kužvart (1996)
Andersonville district
Georgia 32200 -84133 kaolin sedimentary and residual
Laterites developed on sedimentary deposits sedimentary deposits derived from laterites
31k Sedimentary kaolin
Harben and Kužvart (1996)
Augusta district Georgia 33467 -81967 kaolin sedimentary and residual
Laterites developed on sedimentary deposits sedimentary deposits derived from laterites
31k Sedimentary kaolin
Harben and Kužvart (1996)
Macon district Georgia 32833 -83633 kaolin sedimentary and residual
Laterites developed on sedimentary deposits sedimentary deposits derived from laterites
31k Sedimentary kaolin
Harben and Kužvart (1996)
Wrens district Georgia 33182 -82675 kaolin sedimentary and residual
Laterites developed on sedimentary deposits sedimentary deposits derived from laterites
31k Sedimentary kaolin
Harben and Kužvart (1996)
157
Appendix 1 Major mineral deposits in the United States ndash continued
Deposit name State Latitude Longitude Commodities Class Deposit type Model No
Model name Reference
Spor Mountain Utah 39707 -113217 beryllium hydrothermal Epithermal beryllium deposit
na no model Harben and Kužvart (1996)
Eufaula district Alabama 31754 -85272 kaolin bauxite
sedimentary and residual
Laterites developed on sedimentary deposits sedimentary deposits derived from laterites
31k Sedimentary kaolin
Harben and Kužvart (1996)
Irwinton district Georgia 32812 -83174 kaolin bauxite
sedimentary and residual
Laterites developed on sedimentary deposits sedimentary deposits derived from laterites
31k Sedimentary kaolin
Harben and Kužvart (1996)
Brown - rock phosphate district
Tennessee 35659 -87185 phosphate rock
sedimentary and residual
Marine biogenic-chemical sediment - phosphate rock residual enrichment
Krauss and others (1984)
Anadarko Basin - Weatherford - Clinton district
Oklahoma 35540 -98930 anhydrite sedimentary brines and evaporites
Marine evaporite deposit - anhydrite
Ham and Curtis (1958)
Death Valley California 36342 -116684 boron sedimentary brines and evaporites
Lacustrine evaporite deposit - borate
35b3 Lacustrine borates
Harben and Bates (1990) Evans and others (1976)
Fort Cady California 34754 -116402 boron sedimentary brines and evaporites
Lacustrine evaporite deposit - borate
35b3 Lacustrine borates
ODriscoll (1990)
Gerstley I II California 36018 -116232 boron sedimentary brines and evaporites
Lacustrine evaporite deposit - borate
35b3 Lacustrine borates
Evans and others (1976)
Kramer (Boron) California 35041 -117687 boron sedimentary brines and evaporites
Lacustrine evaporite deposit - borate
35b3 Lacustrine borates
Roskill Information Services (1993)
158
Appendix 1 Major mineral deposits in the United States ndash continued
Deposit name State Latitude Longitude Commodities Class Deposit type Model No
Model name Reference
Spor Mountain Utah 39707 -113217 beryllium hydrothermal Epithermal beryllium deposit
na no model Harben and Kužvart (1996)
Rho (Kramer Junction)
California 34767 -117547 boron sedimentary brines and evaporites
Lacustrine evaporite deposit - borate
35b3 Lacustrine borates
Evans and others (1976)
Smackover Formation
Arkansas 33220 -92660 bromine sedimentary brines and evaporites
Bromine in connate water (brine)
35a14 Naturally occurring bromine brines
Harben and Kužvart (1996)
Apex Nevada 36221 -114880 gypsum sedimentary brines and evaporites
Lacustrine evaporite deposit - gypsum
35b4 Lacustrine gypsum
Papke (1987)
Anadarko Basin - Blaine Formation
Oklahoma 35925 -98364 gypsum sedimentary brines and evaporites
Marine evaporite deposit - gypsum
35a5 Bedded gypsum marine evaporite gypsum
Harben and Bates (1984)
Anadarko Basin - Cloud Chief Formation
Oklahoma 34832 -98255 gypsum sedimentary brines and evaporites
Marine evaporite deposit - gypsum
35a5 Bedded gypsum marine evaporite gypsum
Harben and Bates (1984)
Fort Dodge area Iowa 42493 -94156 gypsum sedimentary brines and evaporites
Marine evaporite deposit - gypsum
35a5 Bedded gypsum marine evaporite gypsum
Harben and Kužvart (1996)
Michigan Basin - Tawas
Michigan 44263 -83675 gypsum sedimentary brines and evaporites
Marine evaporite deposit - gypsum
35a5 Bedded gypsum marine evaporite gypsum
Roskill Information Services (1992)
159
Appendix 1 Major mineral deposits in the United States ndash continued
Deposit name State Latitude Longitude Commodities Class Deposit type Model No
Model name Reference
Spor Mountain Utah 39707 -113217 beryllium hydrothermal Epithermal beryllium deposit
na no model Harben and Kužvart (1996)
Plaster City California 33033 -116088 gypsum sedimentary brines and evaporites
Marine evaporite deposit - gypsum
35a5 Bedded gypsum marine evaporite gypsum
Harben and Kužvart (1996)
White Mesa New Mexico 35520 -106797 gypsum sedimentary brines and evaporites
Marine evaporite deposit - gypsum
35a5 Bedded gypsum marine evaporite gypsum
Austin and others (1982)
Appalachian Basin
New York Pennsylvania Ohio West Virginia
41233 -79533 halite (salt) sedimentary brines and evaporites
Marine evaporite deposit - salt
35a3 Bedded salt marine evaporite salt
Harben and Kužvart (1996)
Appalachian Basin - Retsoff
New York 42778 -77858 halite (salt) sedimentary brines and evaporites
Marine evaporite deposit - salt
35a3 Bedded salt marine evaporite salt
Roskill Information Services (1983) Harben and Kužvart (1996)
Mississippi Basin
Mississippi 31460 -89210 halite (salt) sedimentary brines and evaporites
Marine evaporite deposit - salt dome
35a4 Salt domes diapiric salt structures
Harben and Kužvart (1996)
Texas - Louisiana Coastal Basin - Avery Island
Louisiana 29893 -91909 halite (salt) sedimentary brines and evaporites
Marine evaporite deposit - salt dome
35a4 Salt domes diapiric salt structures
Roskill Information Services (1983)
Texas - Louisiana Coastal Basin - Belle Isle (Patterson)
Louisiana 29709 -91351 halite (salt) sedimentary brines and evaporites
Marine evaporite deposit - salt dome
35a4 Salt domes diapiric salt structures
Roskill Information Services (1983)
160
Appendix 1 Major mineral deposits in the United States ndash continued
Deposit name State Latitude Longitude Commodities Class Deposit type Model No
Model name Reference
Spor Mountain Utah 39707 -113217 beryllium hydrothermal Epithermal beryllium deposit
na no model Harben and Kužvart (1996)
Texas - Louisiana Coastal Basin - Jefferson Island
Louisiana 29971 -91969 halite (salt) sedimentary brines and evaporites
Marine evaporite deposit - salt dome
35a4 Salt domes diapiric salt structures
Roskill Information Services (1983)
Texas - Louisiana Coastal Basin
Louisiana Texas
29600 -91817 halite (salt) gypsum
sedimentary brines and evaporites
Marine evaporite deposit - salt dome
35a4 Salt domes diapiric salt structures
Harben and Kužvart (1996)
Michigan Basin - Detroit River Group
Michigan 44241 -86180 halite (salt) gypsum magnesia bromine
sedimentary brines and evaporites
Marine evaporite deposit - salt
35a3 Bedded salt marine evaporite salt
Harben and Kužvart (1996)
Michigan Basin Michigan Indiana
43617 -84233 halite (salt) gypsum potash bromine iodine magnesia
sedimentary brines and evaporites
Marine evaporite deposit and brine
35a3 Bedded salt marine evaporite salt
Hite (1967) Harben and Kužvart (1996)
Michigan Basin - Salina
Michigan halite (salt) potash
sedimentary brines and evaporites
Marine evaporite deposit - salt
35a3 Bedded salt marine evaporite salt
British Sulphur Corporation (1979)
Supai Salt Basin Arizona 33537 -112338 halite (salt) potash
sedimentary brines and evaporites
Marine evaporite deposit - salt
35a3 Bedded salt marine evaporite salt
Garrett (1996)
South Texas Basin - Palangana Salt Dome
Texas 27648 -98394 halite (salt) potash
sedimentary brines and evaporites
Marine evaporite deposit - salt dome
35a4 Salt domes diapiric salt structures
Williams-Stroud and others (1994)
Anadarko Basin - Morrowan Formation
Oklahoma 36433 -99383 iodine sedimentary brines and evaporites
Iodine in connate water (brine)
35a13 Naturally occurring iodine brines
Harben and Kužvart (1996) Roskill Information Services (1994)
161
Appendix 1 Major mineral deposits in the United States ndash continued
Deposit name State Latitude Longitude Commodities Class Deposit type Model No
Model name Reference
Spor Mountain Utah 39707 -113217 beryllium hydrothermal Epithermal beryllium deposit
na no model Harben and Kužvart (1996)
Silver Peak (Clayton Valley)
Nevada 37750 -117633 lithium potash
sedimentary brines and evaporites
Playa brine - lithium and potash
35b13
Lithium-rich Playa brines
Garrett (1996)
Searles Lake California 35777 -118400 lithium potash sodium carbonate boron
sedimentary brines and evaporites
Lacustrine evaporite deposit
35b13
Li-rich playa brine
British Sulphur Corporation (1985) Russell (1988) Roskill Information Services (1989)
Michigan Basin - Manistee Operation
Michigan 44243 -86308 magnesia sedimentary brines and evaporites
Magesia from brine associated with marine evaporite deposit
na no model Harben and Kužvart (1996)
Cane Creek (Moab Salt Operation)
Utah 38523 -109658 potash sedimentary brines and evaporites
Marine evaporite deposit - potash
35a2 Potash-bearing bedded salt
Garrett (1996)
Carlsbad Potash District
New Mexico 32490 -103938 potash sedimentary brines and evaporites
Marine evaporite deposit - potash
35a2 Potash-bearing bedded salt
Garrett (1996)
Carlsbad Potash District - Eddy County Mine
New Mexico 32542 -103878 potash sedimentary brines and evaporites
Marine evaporite deposit - potash
35a2 Potash-bearing bedded salt
British Sulphur Corporation (1985)
Carlsbad Potash District - Hobbs
New Mexico 32505 -103780 potash sedimentary brines and evaporites
Marine evaporite deposit - potash
35a2 Potash-bearing bedded salt
Roskill Information Services (1989)
Carlsbad Potash District - IMC Mine (T22S R29E)
New Mexico 32413 -103937 potash sedimentary brines and evaporites
Marine evaporite deposit - potash
35a2 Potash-bearing bedded salt
Garrett (1996)
Carlsbad Potash District - IMC Mine (T23S R30E)
New Mexico potash sedimentary brines and evaporites
Marine evaporite deposit - potash
35a2 Potash-bearing bedded salt
Garrett (1996)
162
Appendix 1 Major mineral deposits in the United States ndash continued
Deposit name State Latitude Longitude Commodities Class Deposit type Model No
Model name Reference
Spor Mountain Utah 39707 -113217 beryllium hydrothermal Epithermal beryllium deposit
na no model Harben and Kužvart (1996)
Carlsbad Potash District - Lea Mine
New Mexico 32571 -103552 potash sedimentary brines and evaporites
Marine evaporite deposit - potash
35a2 Potash-bearing bedded salt
Garrett (1996)
Carlsbad Potash District - MCC
New Mexico 32490 -103938 potash sedimentary brines and evaporites
Marine evaporite deposit - potash
35a2 Potash-bearing bedded salt
Roskill Information Services (1989)
Carlsbad Potash District - Nash Draw
New Mexico 32337 -103832 potash sedimentary brines and evaporites
Marine evaporite deposit - potash
35a2 Potash-bearing bedded salt
Garrett (1996)
Carlsbad Potash District - New Mexico Potash
New Mexico potash sedimentary brines and evaporites
Marine evaporite deposit - potash
35a2 Potash-bearing bedded salt
Garrett (1996)
Carlsbad Potash District - Western Ag - Minerals (T20SR30E)
New Mexico potash sedimentary brines and evaporites
Marine evaporite deposit - potash
35a2 Potash-bearing bedded salt
Garrett (1996)
Carlsbad Potash District - Western Ag - Minerals (T22SR29E)
New Mexico potash sedimentary brines and evaporites
Marine evaporite deposit - potash
35a2 Potash-bearing bedded salt
Garrett (1996)
Michigan Basin - Hershey
Michigan 43825 -85425 potash sedimentary brines and evaporites
Marine evaporite deposit - potash
35a2 Potash-bearing bedded salt
Roskill Information Services (1989)
Paradox Basin Utah Colorado Arizona
37960 -109670 potash sedimentary brines and evaporites
Marine evaporite deposit - potash
35a2 Potash-bearing bedded salt
Hite (1967)
Salt Valley Anticline
Utah 38922 -109836 potash sedimentary brines and evaporites
Marine evaporite deposit - potash
35a2 Potash-bearing bedded salt
Hite (1964)
Williston Basin Montana North Dakota
47250 -101750 potash sedimentary brines and evaporites
Marine evaporite deposit - potash
35a2 Potash-bearing bedded salt
British Sulphur Corporation (1979)
163
Appendix 1 Major mineral deposits in the United States ndash continued
Deposit name State Latitude Longitude Commodities Class Deposit type Model No
Model name Reference
Spor Mountain Utah 39707 -113217 beryllium hydrothermal Epithermal beryllium deposit
na no model Harben and Kužvart (1996)
Michigan Basin - Midland Operation
Michigan 43600 -84232 potash bromine iodine magnesia
sedimentary brines and evaporites
Marine evaporite - potash-rich brine
35a2 Potash-bearing bedded salt
British Sulphur Corporation (1979)
Michigan Basin - Ludington Operation
Michigan 43939 -86433 potash bromine lithium magnesia
sedimentary brines and evaporites
Marine evaporite - potash-rich brine
35a2 Potash-bearing bedded salt
British Sulphur Corporation (1979)
Great Salt Lake Utah 40914 -112733 potash magnesia lithium sodiuum sulfate
sedimentary brines and evaporites
Lacustrine evaporite deposit
na no model Warren (1999)
Sevier Lake Utah 38813 -113201 potash sodium sulfate sodium chloride
sedimentary brines and evaporites
Playa brine na no model Garrett (1996)
Green River Formation
Wyoming 41528 -109368 sodium carbonate
sedimentary brines and evaporites
Lacustrine evaporite deposit - sodium carbonate
35b1 Sodium carbonate in bedded lacustrine evaporites Green River
Garrett (1992)
Green River Formation FMC Westvaco Mine 12
Wyoming 41622 -109814 sodium carbonate
sedimentary brines and evaporites
Lacustrine evaporite deposit - sodium carbonate
35b1 Sodium carbonate in bedded lacustrine evaporites Green River
USGS (1997)
164
Appendix 1 Major mineral deposits in the United States ndash continued
Deposit name State Latitude Longitude Commodities Class Deposit type Model No
Model name Reference
Spor Mountain Utah 39707 -113217 beryllium hydrothermal Epithermal beryllium deposit
na no model Harben and Kužvart (1996)
Green River Formation General Chemical Corp Allied Chemical
Wyoming 41599 -109740 sodium carbonate
sedimentary brines and evaporites
Lacustrine evaporite deposit - sodium carbonate
35b1 Sodium carbonate in bedded lacustrine evaporites Green River
USGS (1997)
Green River Formation OCI Chemical Corp Big Island
Wyoming 41718 -109692 sodium carbonate
sedimentary brines and evaporites
Lacustrine evaporite deposit - sodium carbonate
35b1 Sodium carbonate in bedded lacustrine evaporites Green River
USGS (1997)
Green River Formation Solvay Minerals Inc
Wyoming 41500 -109760 sodium carbonate
sedimentary brines and evaporites
Lacustrine evaporite deposit - sodium carbonate
35b1 Sodium carbonate in bedded lacustrine evaporites Green River
USGS (1997)
Green River Formation Texas Gulf Inc
Wyoming 41679 -109908 sodium carbonate
sedimentary brines and evaporites
Lacustrine evaporite deposit - sodium carbonate
35b1 Sodium carbonate in bedded lacustrine evaporites Green River
USGS (1997)
Piceance Creek Colorado 39957 -108360 sodium carbonate
sedimentary brines and evaporites
Lacustrine evaporite deposit - sodium carbonate
35b1 Sodium carbonate in bedded lacustrine evaporites Green River
Garrett (1992) Industrial Minerals (1999b)
165
Appendix 1 Major mineral deposits in the United States ndash continued
Deposit name State Latitude Longitude Commodities Class Deposit type Model No
Model name Reference
Spor Mountain Utah 39707 -113217 beryllium hydrothermal Epithermal beryllium deposit
na no model Harben and Kužvart (1996)
Uinta Basin Utah 40225 -109542 sodium carbonate
sedimentary brines and evaporites
Lacustrine evaporite deposit - sodium carbonate
35b1 Sodium carbonate in bedded lacustrine evaporites Green River
Garrett (1992)
Camp Verde Arizona 34545 -111874 sodium sulfate halite (salt) gypsum
sedimentary brines and evaporites
Lacustrine evaporite deposit
na no model Garrett (2001)
Texas - Louisiana Coastal Basin - Main Pass
Louisiana 29275 -88772 sulfur sedimentary brines and evaporites
Marine evaporite deposit - salt dome
35a7 Salt dome sulfur
Edwards and others (1992)
Alder Gulch Montana 45324 -112002 garnet surficial placer
Fluvial placer garnet deposit
na no model ODriscoll (1993)
Emerald Creek - Carpenter Creek Emerald Placers
Idaho 47072 -116326 garnet surficial placer
Fluvial placer garnet deposit
na no model Spanski (2004)
Columbia California 38061 -120319 gold surficial placer
Placer gold deposit 39a Placer Au-PGE
Long and others (1998)
Fairbanks Alaska 64917 -146500 gold surficial placer
Placer gold deposit 39a Placer Au-PGE
Long and others (1998)
Folsom California 38684 -121175 gold surficial placer
Placer gold deposit 39a Placer Au-PGE
Long and others (1998)
Greaterville Arizona 31763 -110753 gold surficial placer
Placer gold deposit 39a Placer Au-PGE
Long and others (1998)
Hammonton California 39204 -121415 gold surficial placer
Placer gold deposit 39a Placer Au-PGE
Long and others (1998)
Kougarok Alaska 65750 -164830 gold surficial placer
Placer gold deposit 39a Placer Au-PGE
Long and others (1998)
Manhatten Alluvial Fan
Nevada 38533 -117150 gold surficial placer
Placer gold deposit 39a Placer Au-PGE
Orris and Bliss (1985)
166
Appendix 1 Major mineral deposits in the United States ndash continued
Deposit name State Latitude Longitude Commodities Class Deposit type Model No
Model name Reference
Spor Mountain Utah 39707 -113217 beryllium hydrothermal Epithermal beryllium deposit
na no model Harben and Kužvart (1996)
Nome Alaska 64500 -165500 gold surficial placer
Placer gold deposit 39a Placer Au-PGE
Long and others (1998)
North Bloomfield
California 39394 -120915 gold surficial placer
Placer gold deposit 39a Placer Au-PGE
Long and others (1998)
Oregon Gulch Wyoming 42317 -108833 gold surficial placer
Placer gold deposit 39a Placer Au-PGE
Long and others (1998)
Pass Peak Formation
Wyoming 43988 -110292 gold surficial placer
Placer gold deposit 39a Placer Au-PGE
Long and others (1998)
Ruby Meadows Idaho 45233 -115881 rare-earth elements gold titanium
surficial placer
Fluvial placer deposit
na no model Industrial Minerals (1987)
Gold Fork - Little Valley
Idaho 44683 -115967 titanium zirconium garnet gold rare-earth elements
surficial placer
Fluvial placer deposit
na no model Jackson and Christiansen (1993)
Bear Valley Idaho 44350 -115400 titanium zirconium garnet niobium rare-earth elements
surficial placer
Fluvial placer deposit
na no model Jackson and Christiansen (1993)
Natchez Trace deposit
Tennessee 35833 -88200 titanium zirconium rare-earth elements
surficial placer
Ancient marine titanium placer deposit
39c Shoreline placer Ti
Towner (1992)
North Camden (Kerr - McGee deposit)
Tennessee 36117 -88183 titanium zirconium rare-earth elements
surficial placer
Ancient marine titanium placer deposit
39c Shoreline placer Ti
Towner (1992)
167
Appendix 1 Major mineral deposits in the United States ndash continued
Deposit name State Latitude Longitude Commodities Class Deposit type Model No
Model name Reference
Spor Mountain Utah 39707 -113217 beryllium hydrothermal Epithermal beryllium deposit
na no model Harben and Kužvart (1996)
Oak Grove Tennessee 36383 -88167 titanium zirconium rare-earth elements
surficial placer
Ancient marine titanium placer deposit
39c Shoreline placer Ti
Jackson and Christiansen (1993)
Old Hickory (Stony Creek)
Virginia 36917 -77567 titanium zirconium rare-earth elements
surficial placer
Ancient marine titanium placer deposit
39c Shoreline placer Ti
Pearson (1999)
Pearsol Creek Idaho 44517 -116083 titanium zirconium rare-earth elements
surficial placer
Fluvial placer deposit
na no model Jackson and Christiansen (1993)
San Gabriel Mountains - Soledad Canyon
California 34434 -118375 titanium zirconium rare-earth elements
surficial placer
Fluvial placer deposit
no model Roskill Information Services (1988)
Boulougne Florida 30734 -81984 titanium zirconium rare-earth elements
surficial placer
Marine titanium placer
39c Shoreline placer Ti
Neary and Highley (1984)
Cumberland Island
Georgia 30900 -81450 titanium zirconium rare-earth elements
surficial placer
Marine titanium placer
39c Shoreline placer Ti
Jackson and Christiansen (1993)
Green Cove Springs - Maxville
Florida 29867 -81717 titanium zirconium rare-earth elements
surficial placer
Marine titanium placer
39c Shoreline placer Ti
Jackson and Christiansen (1993)
Hilton Head Island
South Carolina
32200 -80733 titanium zirconium rare-earth elements
surficial placer
Marine titanium placer
39c Shoreline placer Ti
Jackson and Christiansen (1993)
168
x 1 Major mineral deposits in the United States ndash continued
169
Deposit name State Latitude Longitude Commodities Class Deposit type Model No
Model name Reference
Spor Mountain Utah 39707 -113217 beryllium hydrothermal Epithermal beryllium deposit
na
Appendi
no model Harben and Kužvart (1996)
Lulaton Georgia 31217 -81900 titanium zirconium rare-earth elements
surficial placer
Marine titanium placer
39c Shoreline placer Ti
Industrial Minerals (2003)
Trail Ridge Florida 30033 -82033 titanium zirconium rare-earth elements
surficial placer
Marine titanium placer
39c Shoreline placer Ti
Towner (1992)
Cartersville district
Georgia 34150 -84767 barite surficial residual
Residual na no model Harben and Kužvart (1996)
Washington County
Missouri 38250 -90833 barite surficial residual
Residual na no model Harben and Kužvart (1996)
Spruce Pine North Carolina
35933 -82133 feldspar mica kaolin niobium tantalum
surficial residual
Igneous residual 38h Residual kaolin
Harben and Kužvart (1996)
York Montana 46721 -111750 gold unclassified Unclassified Unclassified Long and others (1998)
Mike Nevada 40806 -116247 gold copper unclassified Unclassified Unclassified Long and others (1998)
Hahns Peak Colorado 40842 -106929 silver lead zinc
unclassified Unclassified Unclassified Long and others (1998)
Mountain Green Utah 41150 -111783 zeolite Holmes (1994) Rome Oregon 42867 -117700 zeolite No Agua Peaks (El Grande Tres Piedras)
New Mexico 36750 -105950 perlite Volcanic rock na no model Harben and Kužvart (1996)
Appendix 2 Selected criteria used to identify major mineral deposits listed in Table 2 of this report
Commodity Amount of contained metal (in metric tons)
Reference
Cobalt 10000 This study Copper 2000000 Giant deposit category Singer (1995) Gold 100 Giant deposit category Singer (1995) Iron ore 56142000
(metric tons iron) 75th percentile of iron for deposits in Singer and others (1993) or large deposit in Cannon and others (1997)
Lead 1000000 Giant deposit category Singer (1995) Molybdenum 300000 Giant deposit category Long (written comm) Nickel 1262300 This study Platinum-group elements
520 Medium-large deposit Laznicka (1999)
Silver 2400 Giant deposit category Singer (1995) Tin 200000 Giant camp Mutschler and others (1999) Tungsten 100000 Giant camp Mutschler and others (1999) Zinc 1700000 Giant deposit category Singer (1995)
171
Appendix 3 Resource-reserves definitions (USGS 2004) ResourcemdashA concentration of naturally occurring solid liquid or gaseous material in or on the Earthrsquos crust in such form and amount that economic extraction of a commodity from the concentration is currently or potentially feasible Identified ResourcesmdashResources whose location grade quality and quantity are known or estimated from specific geologic evidence Reserve BasemdashThat part of an identified resource that meets specified minimum physical and chemical criteria related to current mining and production practices including those for grade quality thickness and depth ReservesmdashThat part of the reserve base which could be economically extracted or produced at the time of determination The term reserves need not signify that extraction facilities are in place and operative
172
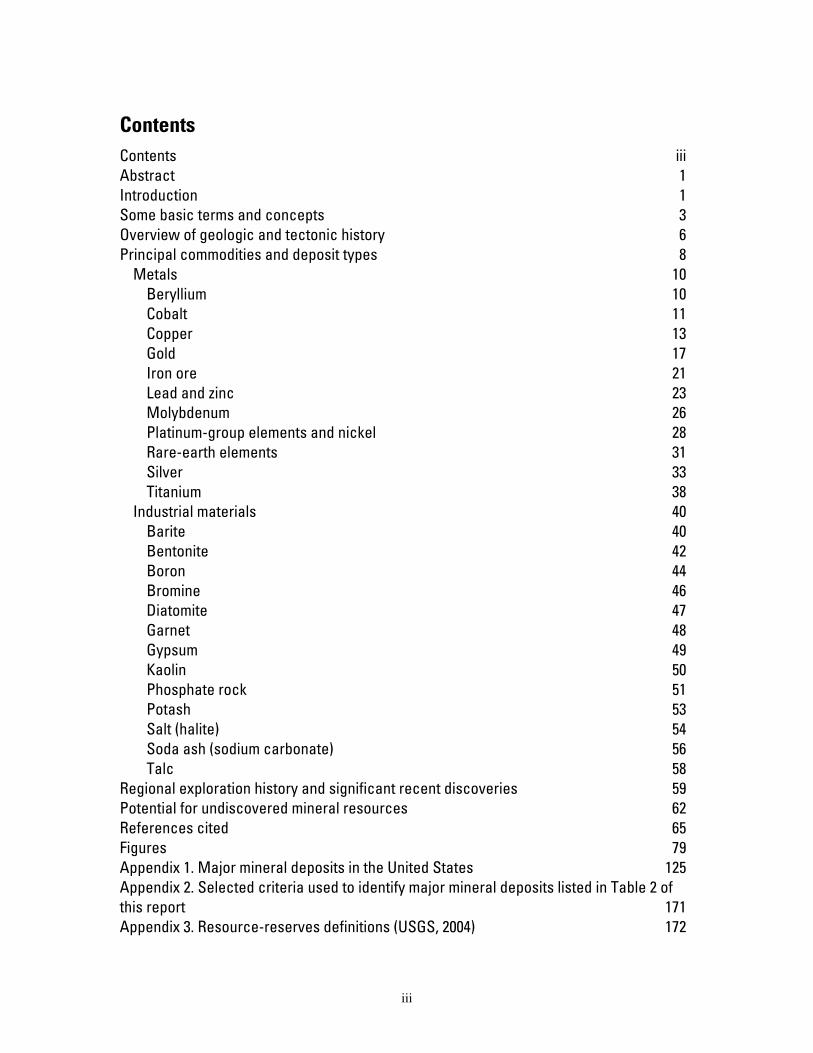