Embed Size (px)
Citation preview
GUIDEBOOK 2010 - 2
STATE OF ARKANSAS
MIKE BEEBE, GOVERNOR
ARKANSAS GEOLOGICAL SURVEY BEKKI WHITE, STATE GEOLOGIST AND DIRECTOR
Geology of the DeGray Spillway, Arkansas: A Geologic Excursion Through Rocks Deposited in an
Ancient Ocean Basin
by
Roger M. Slatt University of Oklahoma
Charles G. Stone
Arkansas Geological Commission (ret.)
Little Rock, Arkansas
2010
STATE OF ARKANSAS Mike Beebe, Governor
Arkansas Geological Survey Bekki White, State Geologist and Director
COMMISSIONERS
Dr. Richard Cohoon, Chairman………………………………………………...…..Russellville William Willis,Vice Chairman………………………………………………….…...Hot Springs David J. Baumgardner………………………………………………….…………….Little Rock Brad DeVazier…………………………………………………………………….…..Forest City Keith DuPriest……………………………………………………………………..……Magnolia Quin Baber……………………………………………………………………………..….Benton David Lumbert…………………………………………………………..…………….Little Rock
Little Rock, Arkansas
2010

CONTENTS Foreword…………………………………………………………………………………………..iii Introduction……………………………………………………………………………………....1 The Jackfork Group in Arkansas and eastern Oklahoma…………………………….........2 The DeGray Lake Spillway……………………………………………………………………..2 Reading the Rocks……………………………………………………………………………...5 Rock types at the DeGray Spillway section…………………………………………………11 Depositional history of the DeGray Spillway section………………………………………26 References……………………………………………………………………………………..29
ii
FOREWORD
The outcrop you are about to see is a truly unique section of sedimentary rocks. More
than one thousand feet of rock section is continuously exposed in the spillway at Lake DeGray.
The Geo-Trek Interpretive Trail is provided by the U.S. Army Corp of Engineers and the Clark
County Strategic Plan. Geologic interpretation (of this section) of exposed rock is provided by
the Arkansas Geological Survey, Little Rock, Arkansas and the University of Oklahoma,
Norman, Oklahoma.
The U.S. Army Corp of Engineers water project at DeGray Lake has additional value as
a geologic workshop. The spillway, dam, and associated structures are viewed by many people
yearly. This group includes geologist, engineers, students of all ages, and rock enthusiast.
Many visitors will return more than once. In fact, the spillway exposure is considered as a world
class example of deep water sedimentary deposition. Much study has gone into the geologic
interpretation of these exposures. Many similarities exist between the Pennsylvanian Jackfork
Formation and the deep water sedimentary deposits being explored for oil and gas today.
Special thanks to Charles G. Stone, Geologist Supervisor, retired, Arkansas Geological Survey,
for his nearly 50 years of service and dedication to the Arkansas Geological Survey and the
people of Arkansas. Also, thanks to Dr. Roger Slatt, Director, School of Geology and
Geophysics and Director of the Institute of Reservoir Characterization, University of Oklahoma,
who authored this guidebook with contributions from Mr. Charles G. Stone. Much geologic
knowledge and information can be attributed to these champions of the geosciences.
Enjoy the visit and the outstanding exposures in the DeGray Lake spillway. There are
things of interest here for everyone.
Arkansas Geological Survey
Bekki White, Director and State Geologist
iii
Introduction
As any geologist will tell you studying rocks is like reading a detective novel. Armed with
a rock hammer, hand lens, hiking boots and some geo-education, the geologist can
enthusiastically descend upon a set of rocks and root out the clues which reveal its origin and
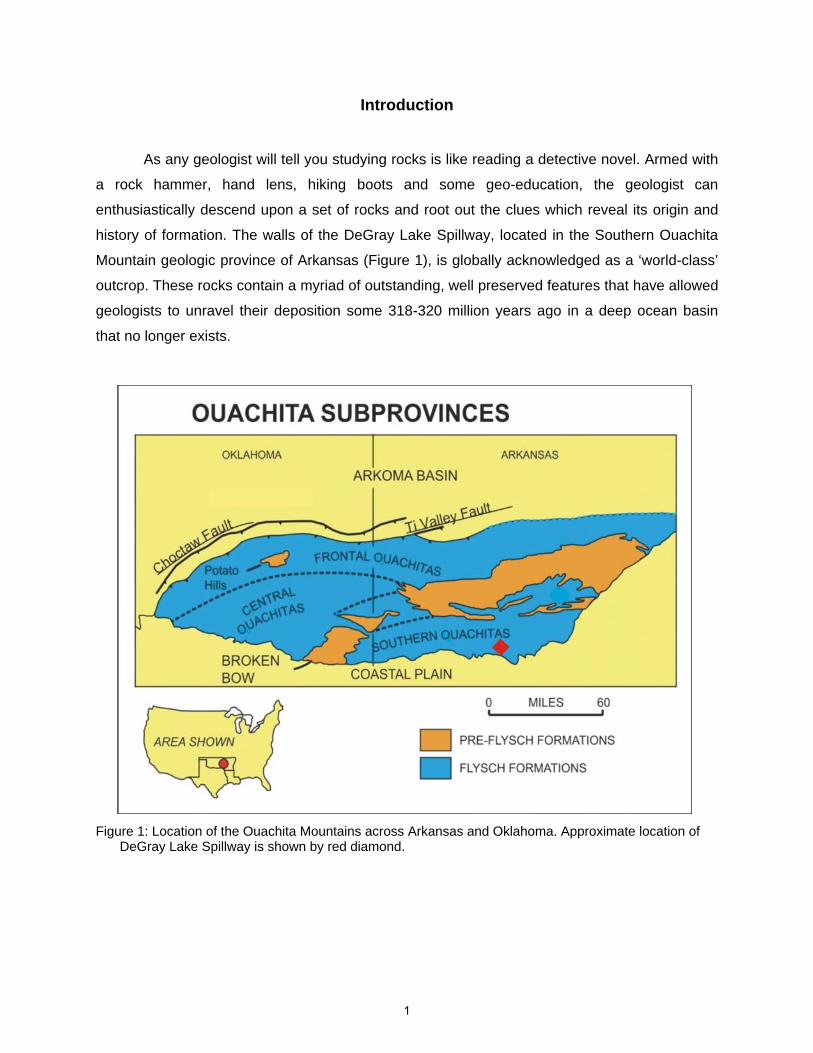
history of formation. The walls of the DeGray Lake Spillway, located in the Southern Ouachita
Mountain geologic province of Arkansas (Figure 1), is globally acknowledged as a ‘world-class’
outcrop. These rocks contain a myriad of outstanding, well preserved features that have allowed
geologists to unravel their deposition some 318-320 million years ago in a deep ocean basin
that no longer exists.
Figure 1: Location of the Ouachita Mountains across Arkansas and Oklahoma. Approximate location of
DeGray Lake Spillway is shown by red diamond.
1
The Spillway was blasted from a hard-rock ridge in the 1960’s as part of construction of
the DeGray Lake and Dam. The blasting effort revealed a treasure trove of geologic features
that have been studied, written about, and debated by many geoscientists since that time. Each
year academicians, students and petroleum industry personnel visit the Spillway to learn how to
read these rocks and to apply the knowledge gained to similar rocks in other parts of the world.
The Spillway is truly a geologic detective novel, worthy of reading and studying. In this paper we
have compiled some of the more interesting geologic features that can be easily reached by foot
and examined by both amateur and professional alike. There are many other features which
await the keen eye of the ‘detective’. Take the excursion and keep a sharp eye out for additional
clues!!
The Jackfork Group in Arkansas and eastern Oklahoma
The sequence of rocks exposed at DeGray Lake Spillway form what has been formally
named the Jackfork Group. Jackfork Group rocks exhibit many similarities to rocks that were
deposited during other geologic times in different parts of the world that now contain oil and gas
reserves. Thus, by understanding how to identify the processes and environments of deposition
of these rocks---and from that information---the size and trends of the sandstone bodies in 3D
space, then it is possible to interpret the size and trend of similar rock bodies that are today
buried to great depths beneath the continental landmasses and ocean basins. This information
is extremely important for petroleum companies that spend many millions of dollars drilling for
oil and gas in these similar rock types. It is for this reason that so many professional exploration
and production geoscientists and engineers visit these outcrops annually. Also, similar Jackfork
strata are significant gas producers in parts of eastern Oklahoma.
The DeGray Lake Spillway
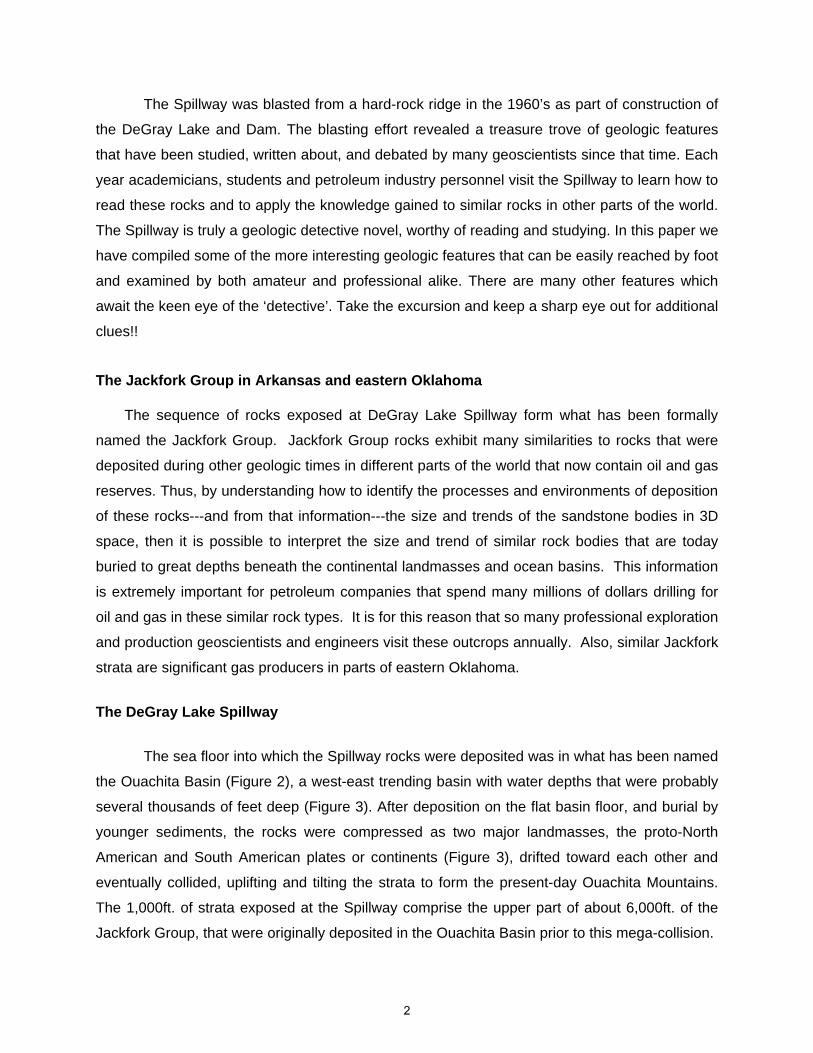
The sea floor into which the Spillway rocks were deposited was in what has been named
the Ouachita Basin (Figure 2), a west-east trending basin with water depths that were probably
several thousands of feet deep (Figure 3). After deposition on the flat basin floor, and burial by
younger sediments, the rocks were compressed as two major landmasses, the proto-North
American and South American plates or continents (Figure 3), drifted toward each other and
eventually collided, uplifting and tilting the strata to form the present-day Ouachita Mountains.
The 1,000ft. of strata exposed at the Spillway comprise the upper part of about 6,000ft. of the
Jackfork Group, that were originally deposited in the Ouachita Basin prior to this mega-collision.
2
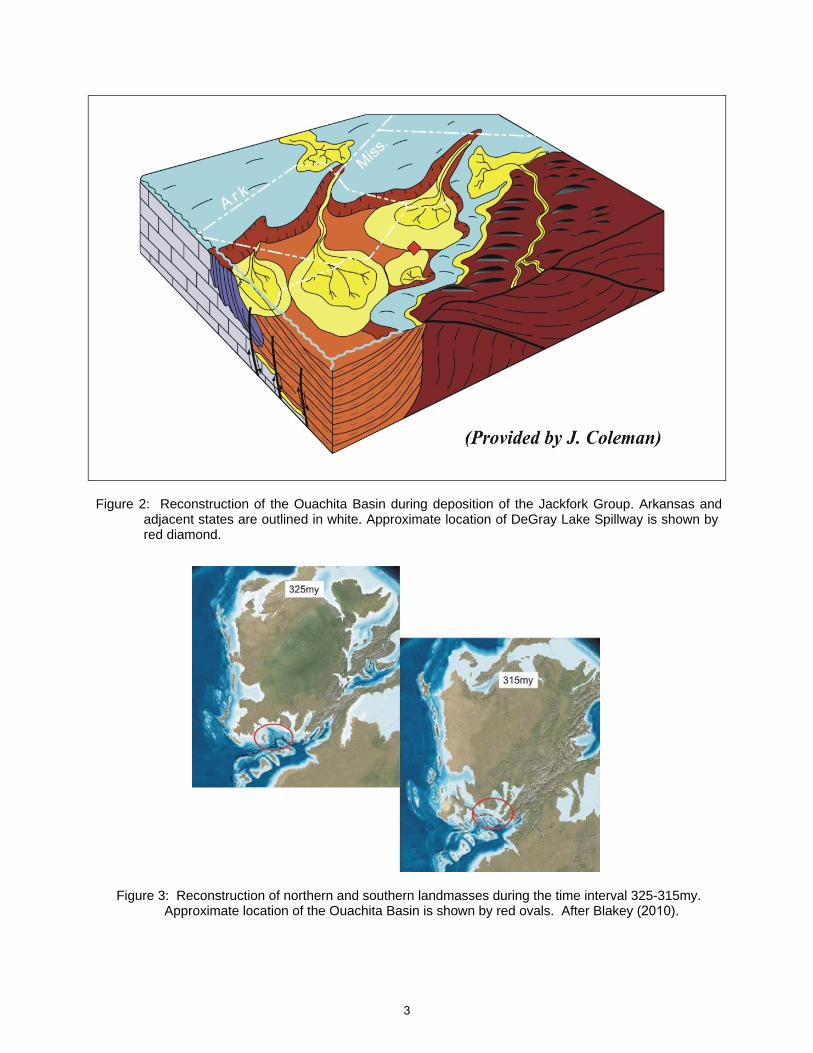
Figure 2: Reconstruction of the Ouachita Basin during deposition of the Jackfork Group. Arkansas and adjacent states are outlined in white. Approximate location of DeGray Lake Spillway is shown by red diamond.
Figure 3: Reconstruction of northern and southern landmasses during the time interval 325-315my. Approximate location of the Ouachita Basin is shown by red ovals. After Blakey (2010).
3

As a consequence of collision-induced compression, strata in the Spillway, though
deposited on a relatively flat sea floor, now dip 55o toward the south (Figure 4) and trend west-
east to form elongate ridges and valleys across the area (Figure 5). Ridges are hard, brittle
sandstones and conglomerates that are more resistant to modern-day weathering, and the
valleys are underlain by less-resistant shales.
Figure 4: The lower several hundred feet of the Jackfork Group strata at DeGray Lake Spillway. The
rocks are tilted 55o to the south due to compressional tectonic forces after deposition. Rocks beome younger from north to south. The red oval is the area shown in Figures 32-33.
4
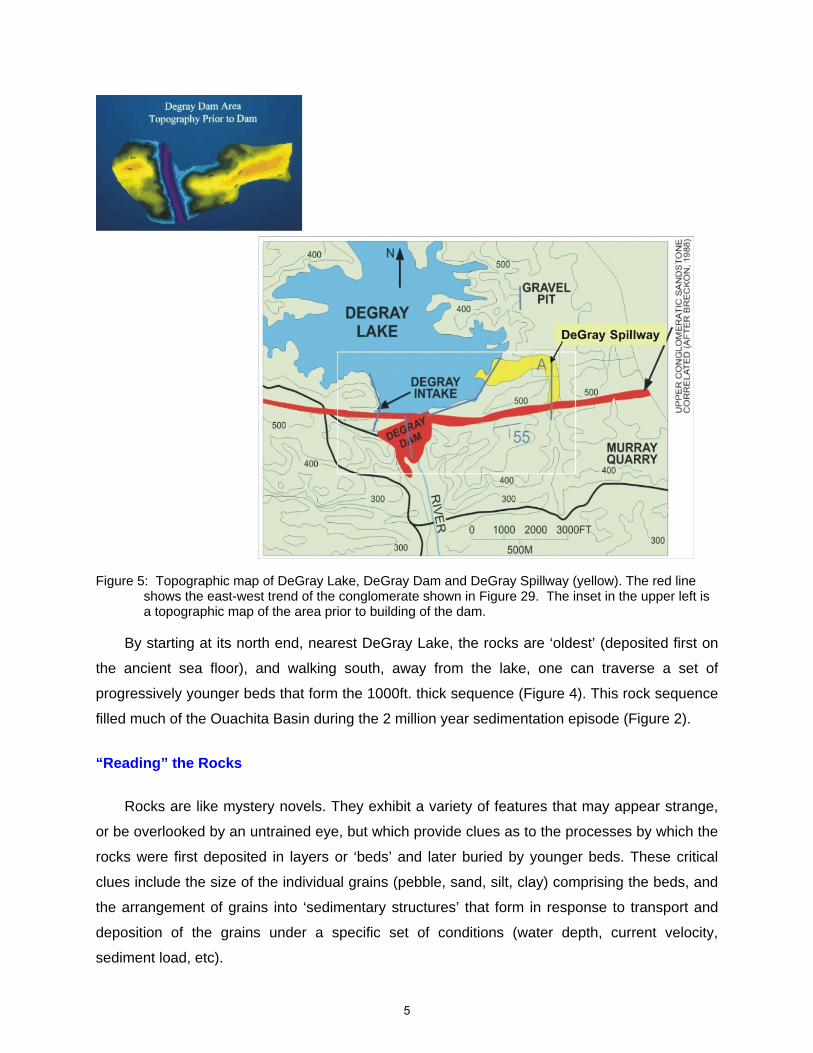
Figure 5: Topographic map of DeGray Lake, DeGray Dam and DeGray Spillway (yellow). The red line
shows the east-west trend of the conglomerate shown in Figure 29. The inset in the upper left is a topographic map of the area prior to building of the dam.
By starting at its north end, nearest DeGray Lake, the rocks are ‘oldest’ (deposited first on
the ancient sea floor), and walking south, away from the lake, one can traverse a set of
progressively younger beds that form the 1000ft. thick sequence (Figure 4). This rock sequence
filled much of the Ouachita Basin during the 2 million year sedimentation episode (Figure 2).
“Reading” the Rocks
Rocks are like mystery novels. They exhibit a variety of features that may appear strange,
or be overlooked by an untrained eye, but which provide clues as to the processes by which the
rocks were first deposited in layers or ‘beds’ and later buried by younger beds. These critical
clues include the size of the individual grains (pebble, sand, silt, clay) comprising the beds, and
the arrangement of grains into ‘sedimentary structures’ that form in response to transport and
deposition of the grains under a specific set of conditions (water depth, current velocity,
sediment load, etc).
5
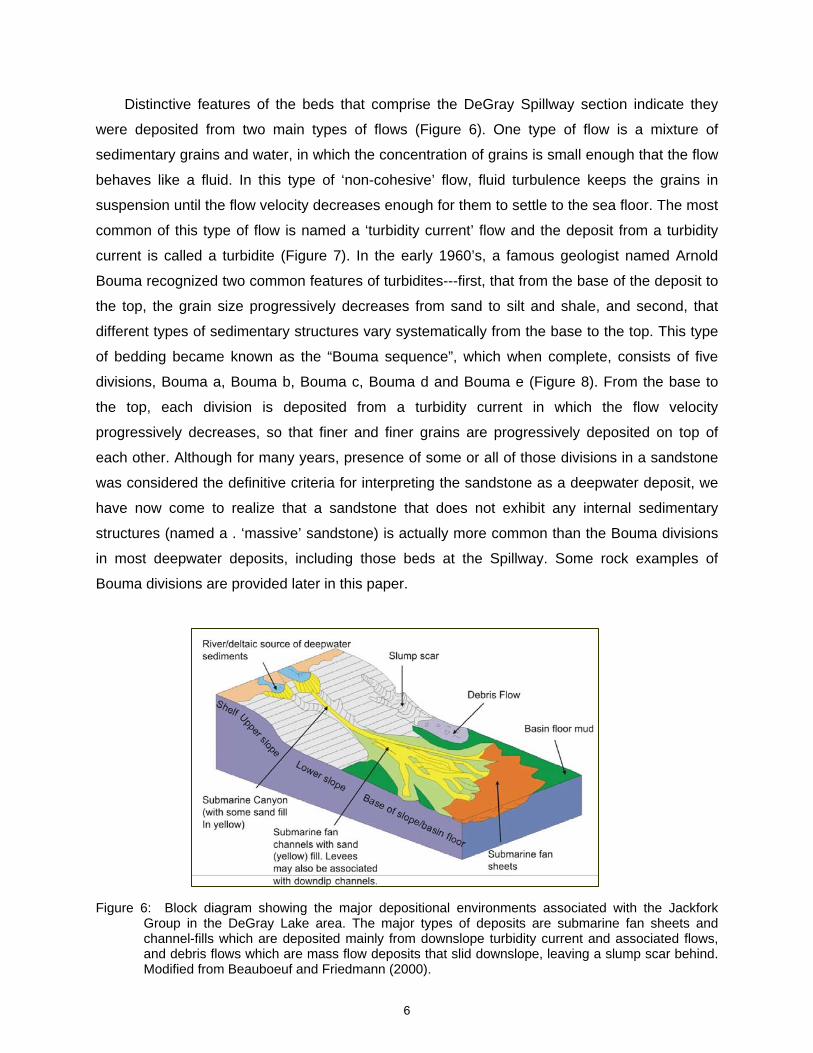
Distinctive features of the beds that comprise the DeGray Spillway section indicate they
were deposited from two main types of flows (Figure 6). One type of flow is a mixture of
sedimentary grains and water, in which the concentration of grains is small enough that the flow
behaves like a fluid. In this type of ‘non-cohesive’ flow, fluid turbulence keeps the grains in
suspension until the flow velocity decreases enough for them to settle to the sea floor. The most
common of this type of flow is named a ‘turbidity current’ flow and the deposit from a turbidity
current is called a turbidite (Figure 7). In the early 1960’s, a famous geologist named Arnold
Bouma recognized two common features of turbidites---first, that from the base of the deposit to
the top, the grain size progressively decreases from sand to silt and shale, and second, that
different types of sedimentary structures vary systematically from the base to the top. This type
of bedding became known as the “Bouma sequence”, which when complete, consists of five
divisions, Bouma a, Bouma b, Bouma c, Bouma d and Bouma e (Figure 8). From the base to
the top, each division is deposited from a turbidity current in which the flow velocity
progressively decreases, so that finer and finer grains are progressively deposited on top of
each other. Although for many years, presence of some or all of those divisions in a sandstone
was considered the definitive criteria for interpreting the sandstone as a deepwater deposit, we
have now come to realize that a sandstone that does not exhibit any internal sedimentary
structures (named a . ‘massive’ sandstone) is actually more common than the Bouma divisions
in most deepwater deposits, including those beds at the Spillway. Some rock examples of
Bouma divisions are provided later in this paper.
Figure 6: Block diagram showing the major depositional environments associated with the Jackfork Group in the DeGray Lake area. The major types of deposits are submarine fan sheets and channel-fills which are deposited mainly from downslope turbidity current and associated flows, and debris flows which are mass flow deposits that slid downslope, leaving a slump scar behind. Modified from Beauboeuf and Friedmann (2000).
6
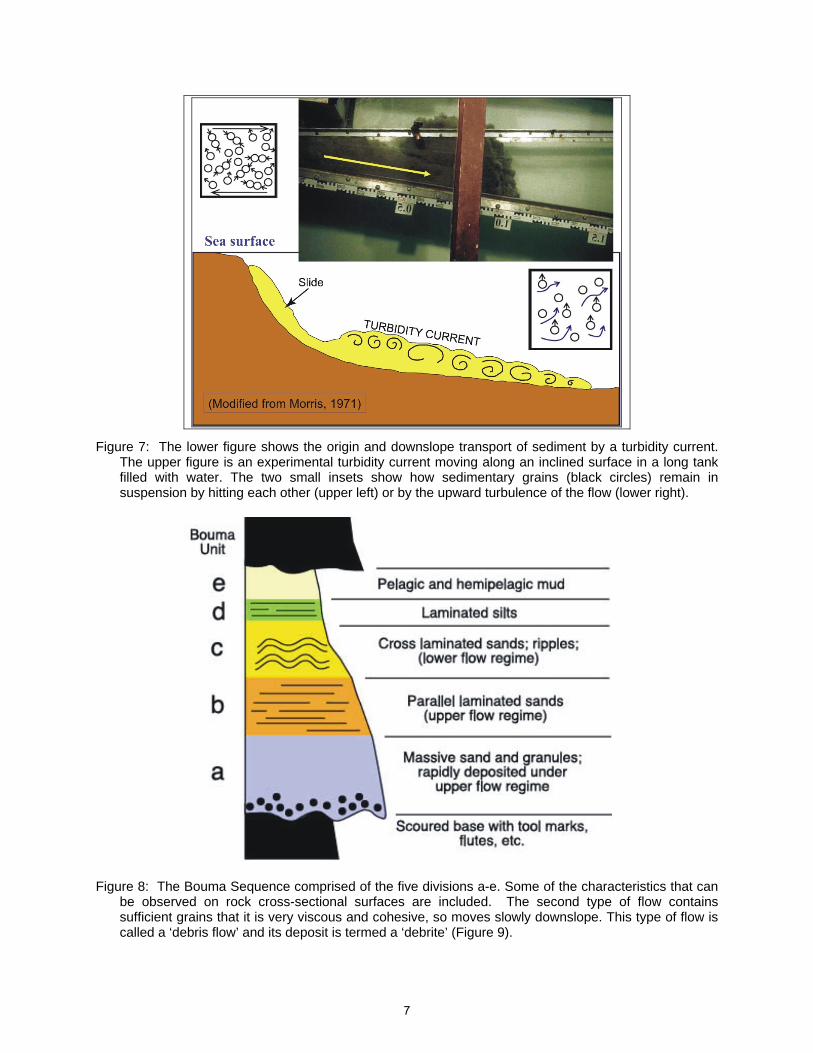
Figure 7: The lower figure shows the origin and downslope transport of sediment by a turbidity current. The upper figure is an experimental turbidity current moving along an inclined surface in a long tank filled with water. The two small insets show how sedimentary grains (black circles) remain in suspension by hitting each other (upper left) or by the upward turbulence of the flow (lower right).
Figure 8: The Bouma Sequence comprised of the five divisions a-e. Some of the characteristics that can be observed on rock cross-sectional surfaces are included. The second type of flow contains sufficient grains that it is very viscous and cohesive, so moves slowly downslope. This type of flow is called a ‘debris flow’ and its deposit is termed a ‘debrite’ (Figure 9).
7
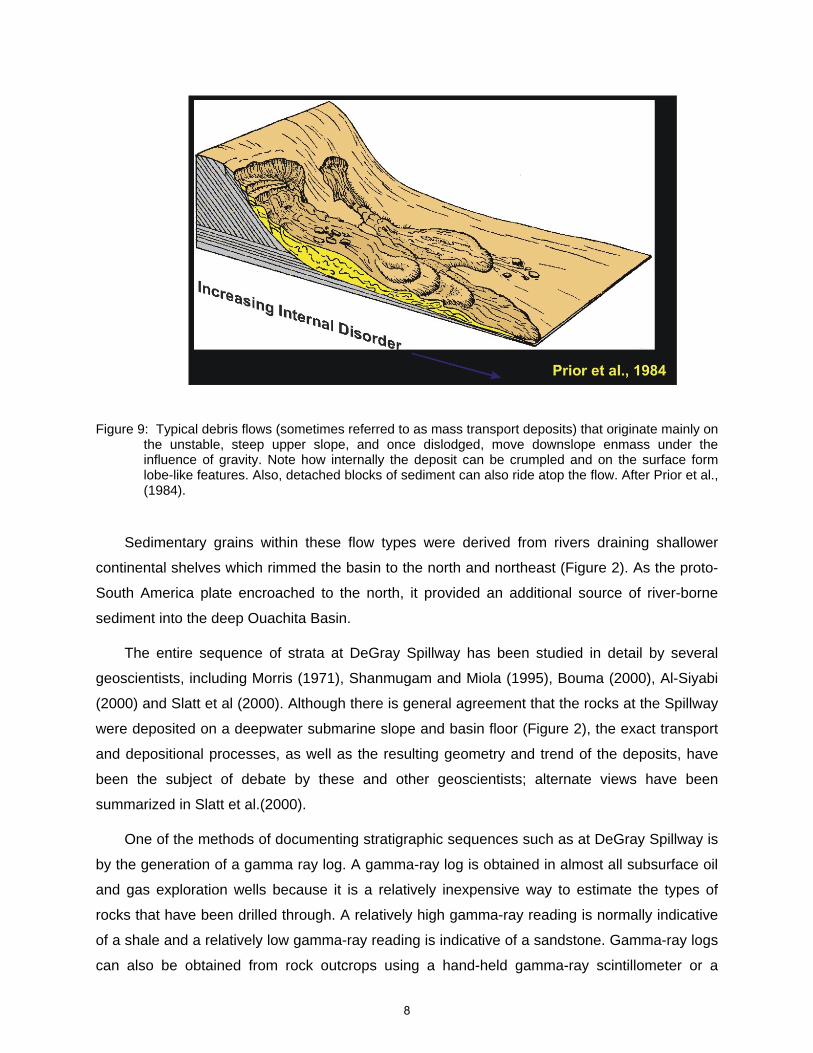
Figure 9: Typical debris flows (sometimes referred to as mass transport deposits) that originate mainly on the unstable, steep upper slope, and once dislodged, move downslope enmass under the influence of gravity. Note how internally the deposit can be crumpled and on the surface form lobe-like features. Also, detached blocks of sediment can also ride atop the flow. After Prior et al., (1984).
Sedimentary grains within these flow types were derived from rivers draining shallower
continental shelves which rimmed the basin to the north and northeast (Figure 2). As the proto-
South America plate encroached to the north, it provided an additional source of river-borne
sediment into the deep Ouachita Basin.
The entire sequence of strata at DeGray Spillway has been studied in detail by several
geoscientists, including Morris (1971), Shanmugam and Miola (1995), Bouma (2000), Al-Siyabi
(2000) and Slatt et al (2000). Although there is general agreement that the rocks at the Spillway
were deposited on a deepwater submarine slope and basin floor (Figure 2), the exact transport
and depositional processes, as well as the resulting geometry and trend of the deposits, have
been the subject of debate by these and other geoscientists; alternate views have been
summarized in Slatt et al.(2000).
One of the methods of documenting stratigraphic sequences such as at DeGray Spillway is
by the generation of a gamma ray log. A gamma-ray log is obtained in almost all subsurface oil
and gas exploration wells because it is a relatively inexpensive way to estimate the types of
rocks that have been drilled through. A relatively high gamma-ray reading is normally indicative
of a shale and a relatively low gamma-ray reading is indicative of a sandstone. Gamma-ray logs
can also be obtained from rock outcrops using a hand-held gamma-ray scintillometer or a
8
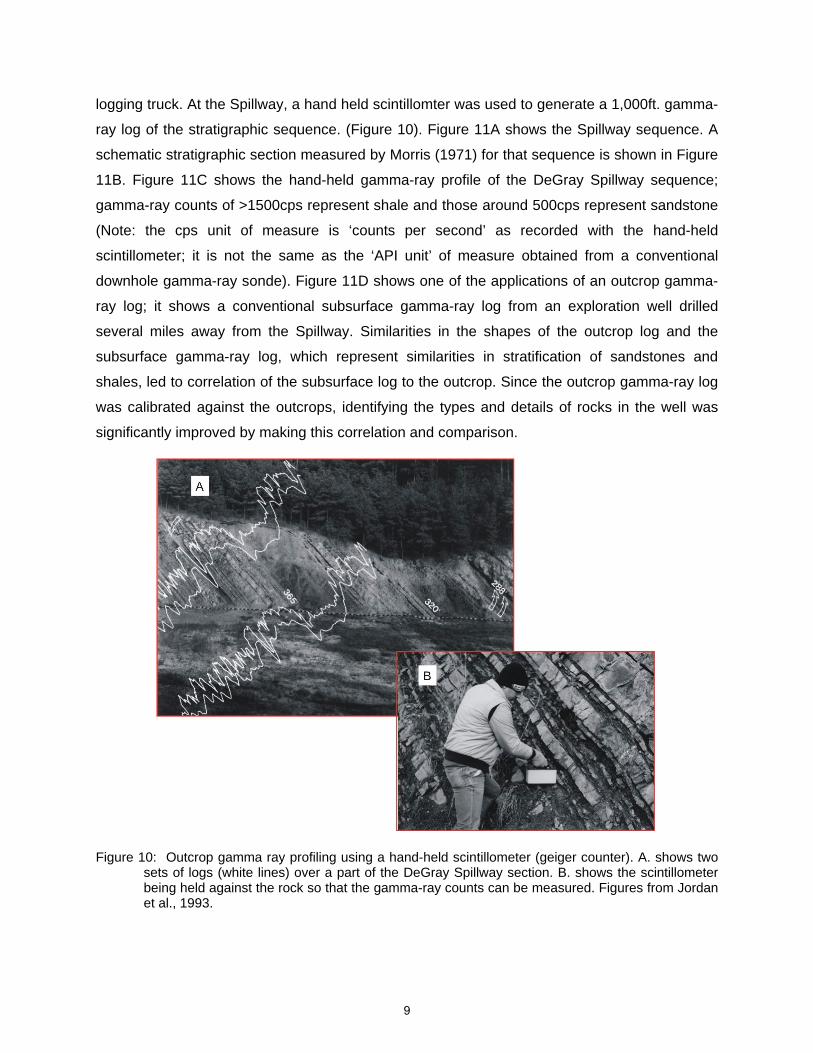
logging truck. At the Spillway, a hand held scintillomter was used to generate a 1,000ft. gamma-
ray log of the stratigraphic sequence. (Figure 10). Figure 11A shows the Spillway sequence. A
schematic stratigraphic section measured by Morris (1971) for that sequence is shown in Figure
11B. Figure 11C shows the hand-held gamma-ray profile of the DeGray Spillway sequence;
gamma-ray counts of >1500cps represent shale and those around 500cps represent sandstone
(Note: the cps unit of measure is ‘counts per second’ as recorded with the hand-held
scintillometer; it is not the same as the ‘API unit’ of measure obtained from a conventional
downhole gamma-ray sonde). Figure 11D shows one of the applications of an outcrop gamma-
ray log; it shows a conventional subsurface gamma-ray log from an exploration well drilled
several miles away from the Spillway. Similarities in the shapes of the outcrop log and the
subsurface gamma-ray log, which represent similarities in stratification of sandstones and
shales, led to correlation of the subsurface log to the outcrop. Since the outcrop gamma-ray log
was calibrated against the outcrops, identifying the types and details of rocks in the well was
significantly improved by making this correlation and comparison.
Figure 10: Outcrop gamma ray profiling using a hand-held scintillometer (geiger counter). A. shows two sets of logs (white lines) over a part of the DeGray Spillway section. B. shows the scintillometer being held against the rock so that the gamma-ray counts can be measured. Figures from Jordan et al., 1993.
9

Figure 11: A. Upper several hundred feet of DeGray Lake Spillway section. B. Distribution of sandstone (yellow) and shale (brown) in the section (after Morris, 1971). C. Outcrop gamma ray log of the Spillway section. D. Subfurface gamma ray log of the Shell Rex Timber well, drilled six miles to the southwest of the Spillway. The stratigraphy expressed on the two logs has been correlated (red arrows). Red oval highlights the stratigrapihc section shown in Figure 12.
10
Rock types at the DeGray Spillway section:
Several different rock types, deposited by a range of sedimentary processes, can be
identified at the Spillway. These are briefly described below and intervals where they can be
seen at the Spillway are provided in figure captions.
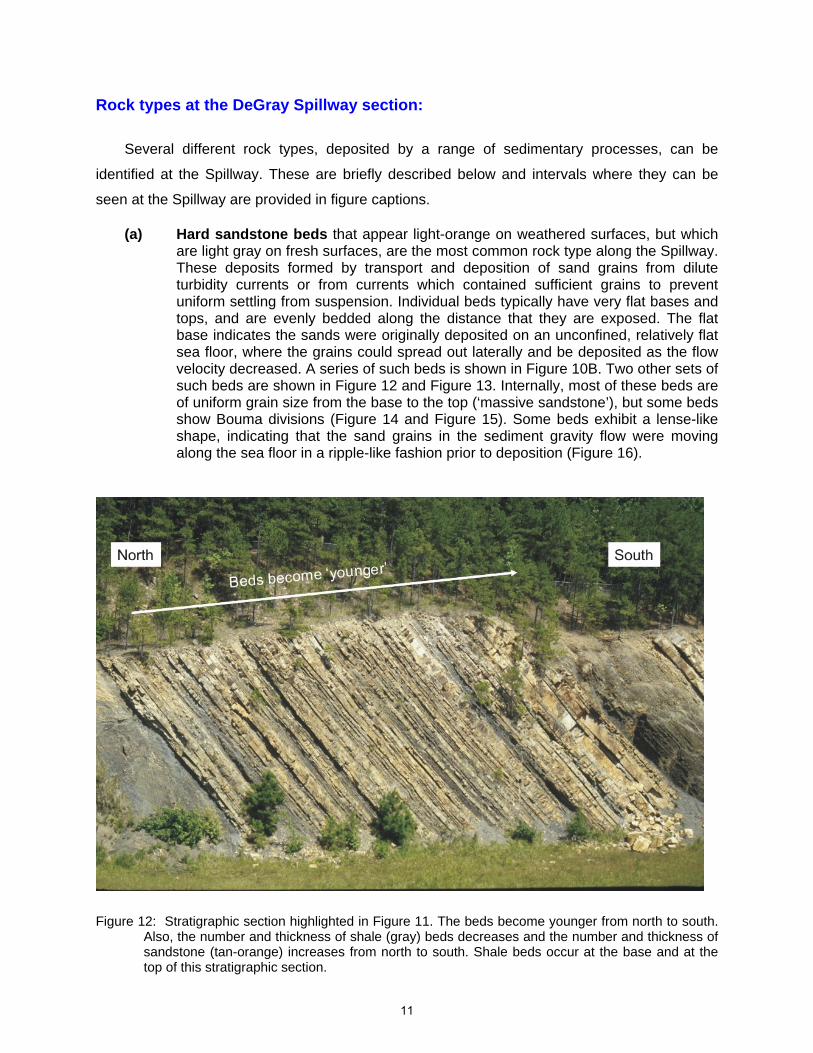
(a) Hard sandstone beds that appear light-orange on weathered surfaces, but which are light gray on fresh surfaces, are the most common rock type along the Spillway. These deposits formed by transport and deposition of sand grains from dilute turbidity currents or from currents which contained sufficient grains to prevent uniform settling from suspension. Individual beds typically have very flat bases and tops, and are evenly bedded along the distance that they are exposed. The flat base indicates the sands were originally deposited on an unconfined, relatively flat sea floor, where the grains could spread out laterally and be deposited as the flow velocity decreased. A series of such beds is shown in Figure 10B. Two other sets of such beds are shown in Figure 12 and Figure 13. Internally, most of these beds are of uniform grain size from the base to the top (‘massive sandstone’), but some beds show Bouma divisions (Figure 14 and Figure 15). Some beds exhibit a lense-like shape, indicating that the sand grains in the sediment gravity flow were moving along the sea floor in a ripple-like fashion prior to deposition (Figure 16).
Figure 12: Stratigraphic section highlighted in Figure 11. The beds become younger from north to south. Also, the number and thickness of shale (gray) beds decreases and the number and thickness of sandstone (tan-orange) increases from north to south. Shale beds occur at the base and at the top of this stratigraphic section.
11
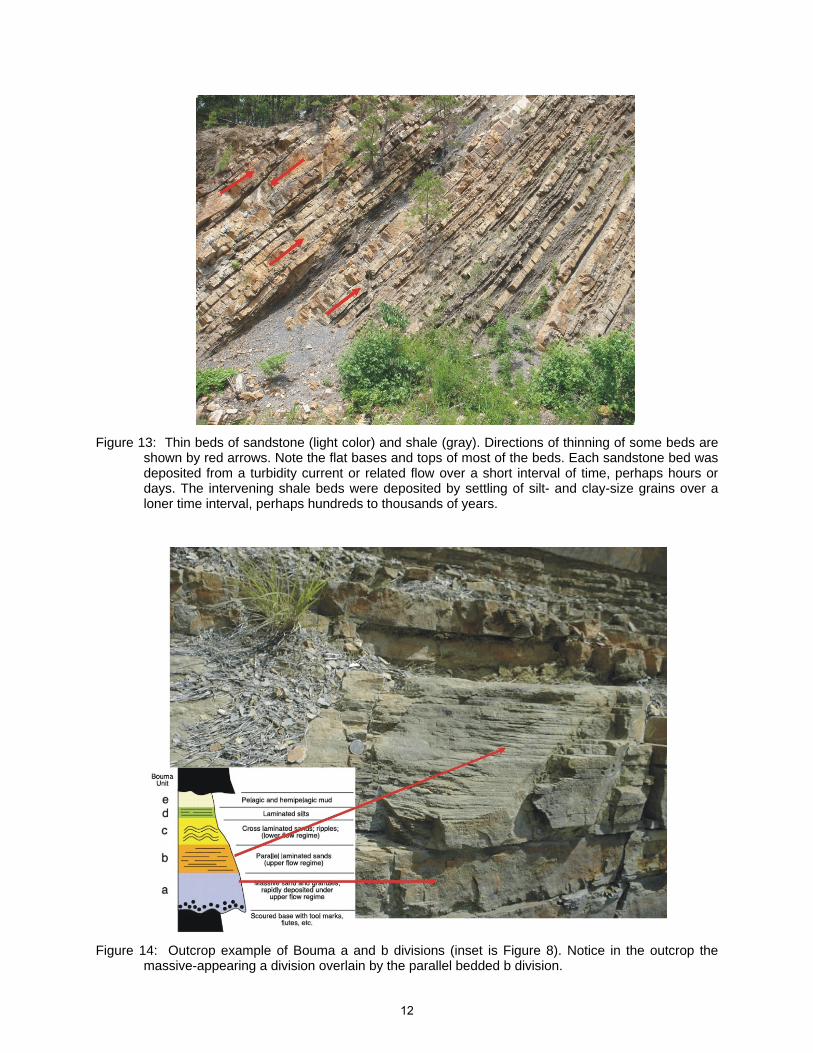
Figure 13: Thin beds of sandstone (light color) and shale (gray). Directions of thinning of some beds are
shown by red arrows. Note the flat bases and tops of most of the beds. Each sandstone bed was deposited from a turbidity current or related flow over a short interval of time, perhaps hours or days. The intervening shale beds were deposited by settling of silt- and clay-size grains over a loner time interval, perhaps hundreds to thousands of years.
Figure 14: Outcrop example of Bouma a and b divisions (inset is Figure 8). Notice in the outcrop the
massive-appearing a division overlain by the parallel bedded b division.
12
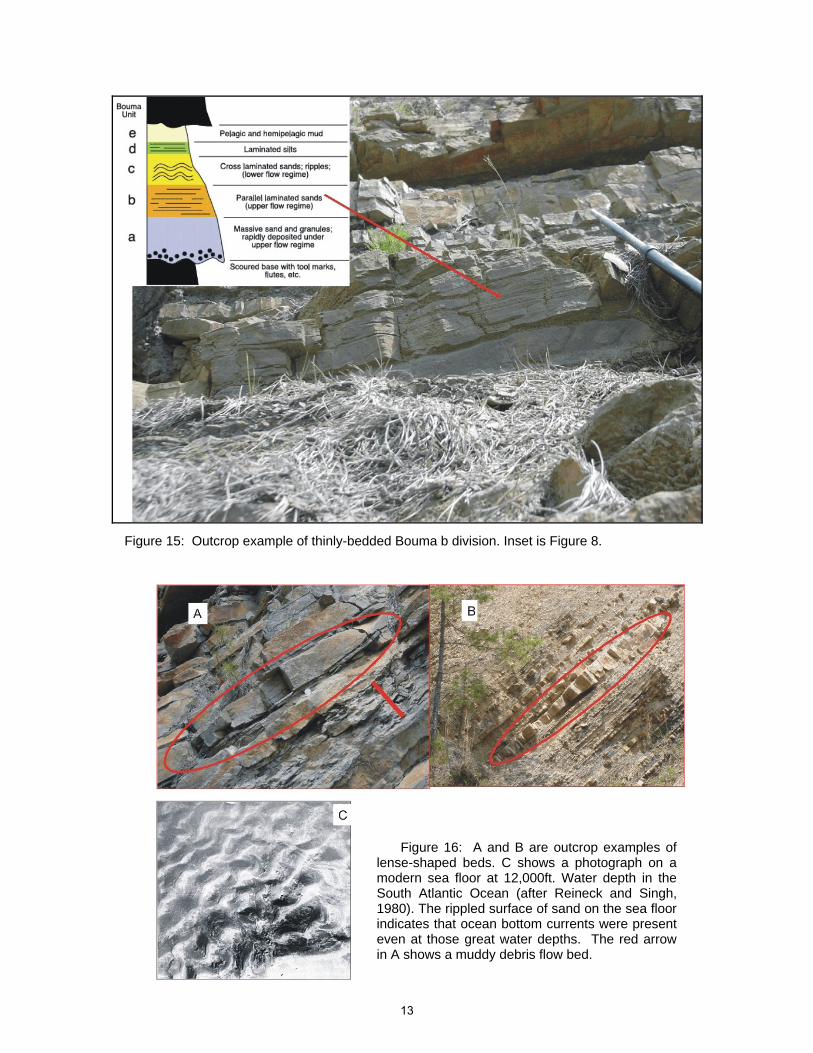
Figure 15: Outcrop example of thinly-bedded Bouma b division. Inset is Figure 8.
Figure 16: A and B are outcrop examples of lense-shaped beds. C shows a photograph on a modern sea floor at 12,000ft. Water depth in the South Atlantic Ocean (after Reineck and Singh, 1980). The rippled surface of sand on the sea floor indicates that ocean bottom currents were present even at those great water depths. The red arrow in A shows a muddy debris flow bed.
13
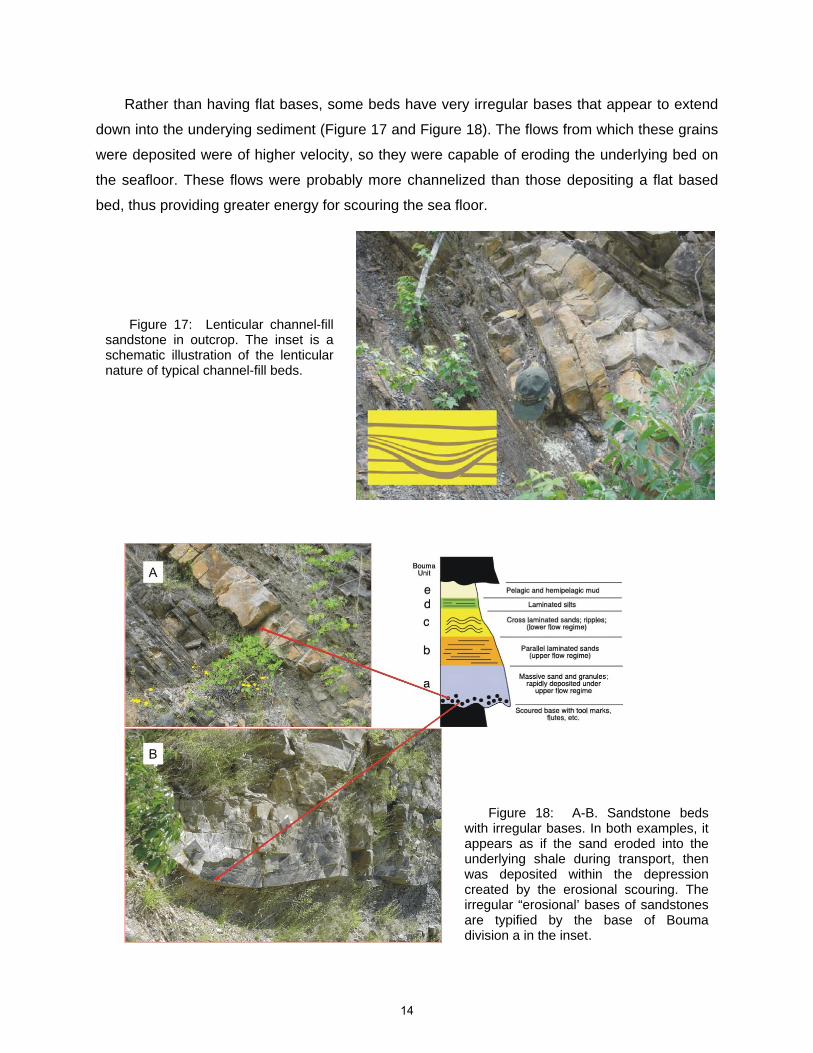
Rather than having flat bases, some beds have very irregular bases that appear to extend
down into the underying sediment (Figure 17 and Figure 18). The flows from which these grains
were deposited were of higher velocity, so they were capable of eroding the underlying bed on
the seafloor. These flows were probably more channelized than those depositing a flat based
bed, thus providing greater energy for scouring the sea floor.
Figure 17: Lenticular channel-fill sandstone in outcrop. The inset is a schematic illustration of the lenticular nature of typical channel-fill beds.
Figure 18: A-B. Sandstone beds with irregular bases. In both examples, it appears as if the sand eroded into the underlying shale during transport, then was deposited within the depression created by the erosional scouring. The irregular “erosional’ bases of sandstones are typified by the base of Bouma division a in the inset.
14
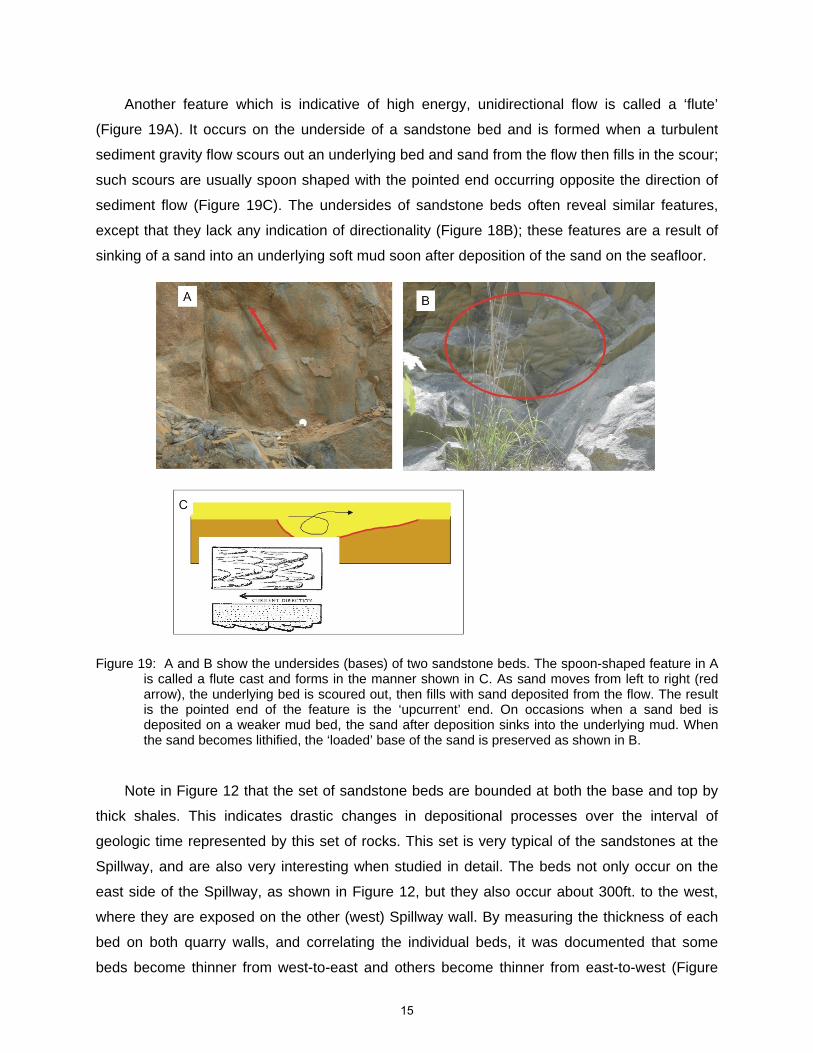
Another feature which is indicative of high energy, unidirectional flow is called a ‘flute’
(Figure 19A). It occurs on the underside of a sandstone bed and is formed when a turbulent
sediment gravity flow scours out an underlying bed and sand from the flow then fills in the scour;
such scours are usually spoon shaped with the pointed end occurring opposite the direction of
sediment flow (Figure 19C). The undersides of sandstone beds often reveal similar features,
except that they lack any indication of directionality (Figure 18B); these features are a result of
sinking of a sand into an underlying soft mud soon after deposition of the sand on the seafloor.
Figure 19: A and B show the undersides (bases) of two sandstone beds. The spoon-shaped feature in A is called a flute cast and forms in the manner shown in C. As sand moves from left to right (red arrow), the underlying bed is scoured out, then fills with sand deposited from the flow. The result is the pointed end of the feature is the ‘upcurrent’ end. On occasions when a sand bed is deposited on a weaker mud bed, the sand after deposition sinks into the underlying mud. When the sand becomes lithified, the ‘loaded’ base of the sand is preserved as shown in B.
Note in Figure 12 that the set of sandstone beds are bounded at both the base and top by
thick shales. This indicates drastic changes in depositional processes over the interval of
geologic time represented by this set of rocks. This set is very typical of the sandstones at the
Spillway, and are also very interesting when studied in detail. The beds not only occur on the
east side of the Spillway, as shown in Figure 12, but they also occur about 300ft. to the west,
where they are exposed on the other (west) Spillway wall. By measuring the thickness of each
bed on both quarry walls, and correlating the individual beds, it was documented that some
beds become thinner from west-to-east and others become thinner from east-to-west (Figure
15
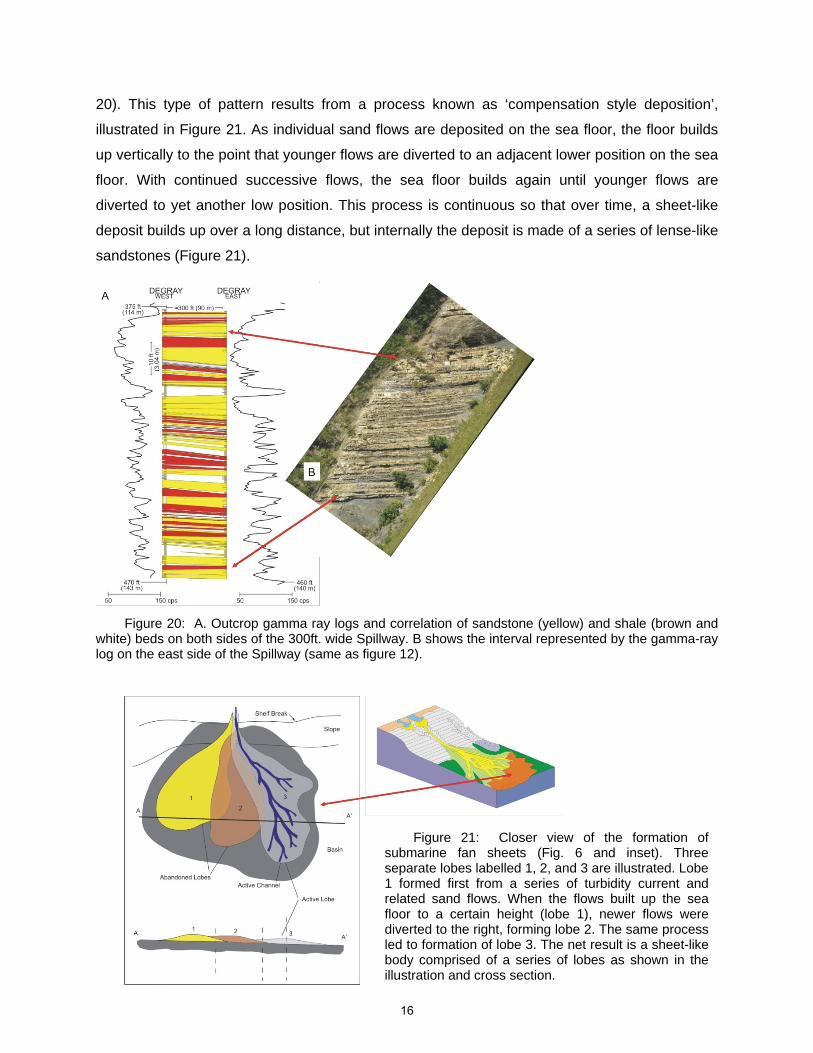
20). This type of pattern results from a process known as ‘compensation style deposition’,
illustrated in Figure 21. As individual sand flows are deposited on the sea floor, the floor builds
up vertically to the point that younger flows are diverted to an adjacent lower position on the sea
floor. With continued successive flows, the sea floor builds again until younger flows are
diverted to yet another low position. This process is continuous so that over time, a sheet-like
deposit builds up over a long distance, but internally the deposit is made of a series of lense-like
sandstones (Figure 21).
Figure 20: A. Outcrop gamma ray logs and correlation of sandstone (yellow) and shale (brown and
white) beds on both sides of the 300ft. wide Spillway. B shows the interval represented by the gamma-ray log on the east side of the Spillway (same as figure 12).
Figure 21: Closer view of the formation of submarine fan sheets (Fig. 6 and inset). Three separate lobes labelled 1, 2, and 3 are illustrated. Lobe 1 formed first from a series of turbidity current and related sand flows. When the flows built up the sea floor to a certain height (lobe 1), newer flows were diverted to the right, forming lobe 2. The same process led to formation of lobe 3. The net result is a sheet-like body comprised of a series of lobes as shown in the illustration and cross section.
16
The process of compensation style deposition can occur at all geological scales, from
individual beds up to stratigraphic sequences 100’s to 1,000’s of feet thick. For example, the set
of beds in Figure 12 have been correlated with a set of beds in the subsurface exploration well
drilled more than 6 miles to the southwest, where it is more than twice as thick (Figure 11).
Thus, the entire set of beds also has a lense- or wedge-like geometry, and is at least several
miles in horizontal extent in the subsurface.
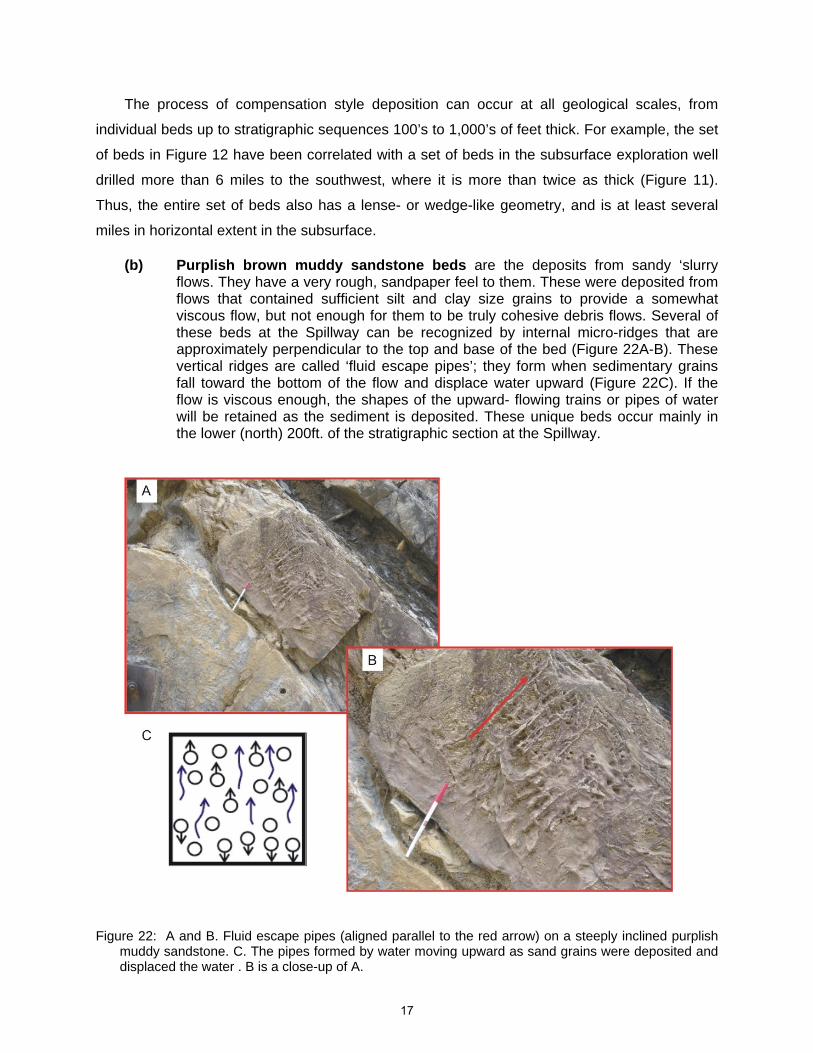
(b) Purplish brown muddy sandstone beds are the deposits from sandy ‘slurry flows. They have a very rough, sandpaper feel to them. These were deposited from flows that contained sufficient silt and clay size grains to provide a somewhat viscous flow, but not enough for them to be truly cohesive debris flows. Several of these beds at the Spillway can be recognized by internal micro-ridges that are approximately perpendicular to the top and base of the bed (Figure 22A-B). These vertical ridges are called ‘fluid escape pipes’; they form when sedimentary grains fall toward the bottom of the flow and displace water upward (Figure 22C). If the flow is viscous enough, the shapes of the upward- flowing trains or pipes of water will be retained as the sediment is deposited. These unique beds occur mainly in the lower (north) 200ft. of the stratigraphic section at the Spillway.
Figure 22: A and B. Fluid escape pipes (aligned parallel to the red arrow) on a steeply inclined purplish muddy sandstone. C. The pipes formed by water moving upward as sand grains were deposited and displaced the water . B is a close-up of A.
17
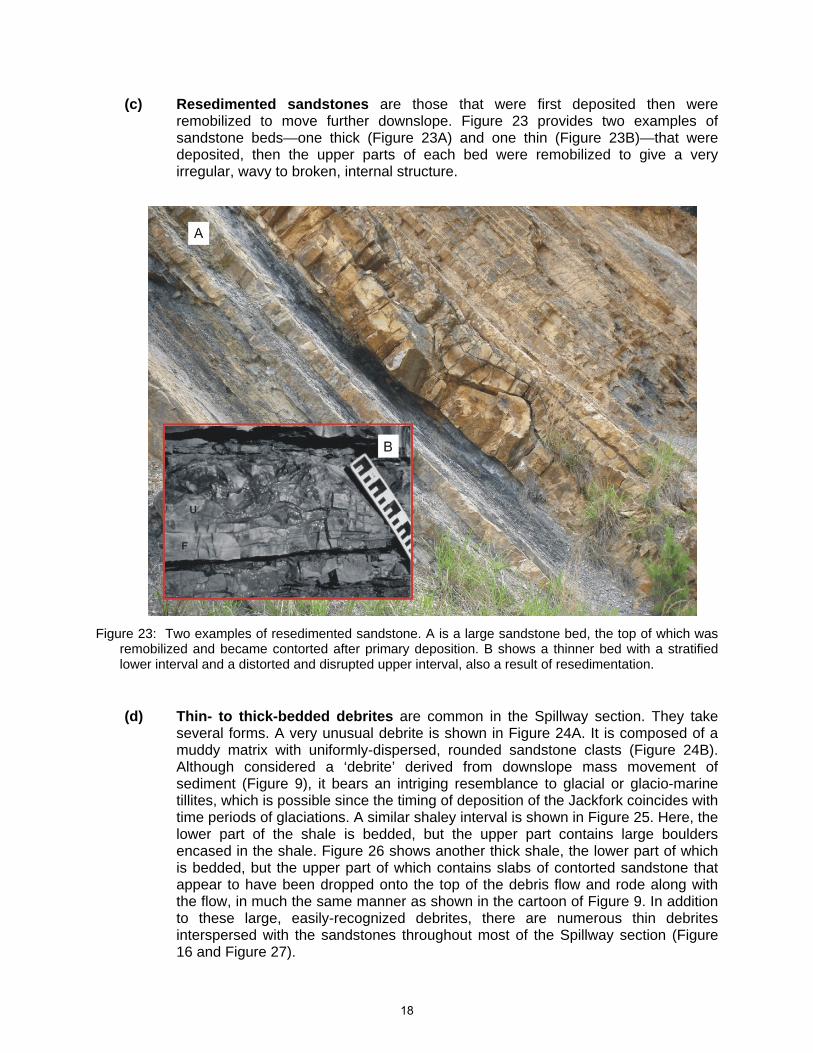
(c) Resedimented sandstones are those that were first deposited then were remobilized to move further downslope. Figure 23 provides two examples of sandstone beds—one thick (Figure 23A) and one thin (Figure 23B)—that were deposited, then the upper parts of each bed were remobilized to give a very irregular, wavy to broken, internal structure.
Figure 23: Two examples of resedimented sandstone. A is a large sandstone bed, the top of which was
remobilized and became contorted after primary deposition. B shows a thinner bed with a stratified lower interval and a distorted and disrupted upper interval, also a result of resedimentation.
(d) Thin- to thick-bedded debrites are common in the Spillway section. They take several forms. A very unusual debrite is shown in Figure 24A. It is composed of a muddy matrix with uniformly-dispersed, rounded sandstone clasts (Figure 24B). Although considered a ‘debrite’ derived from downslope mass movement of sediment (Figure 9), it bears an intriging resemblance to glacial or glacio-marine tillites, which is possible since the timing of deposition of the Jackfork coincides with time periods of glaciations. A similar shaley interval is shown in Figure 25. Here, the lower part of the shale is bedded, but the upper part contains large boulders encased in the shale. Figure 26 shows another thick shale, the lower part of which is bedded, but the upper part of which contains slabs of contorted sandstone that appear to have been dropped onto the top of the debris flow and rode along with the flow, in much the same manner as shown in the cartoon of Figure 9. In addition to these large, easily-recognized debrites, there are numerous thin debrites interspersed with the sandstones throughout most of the Spillway section (Figure 16 and Figure 27).
18
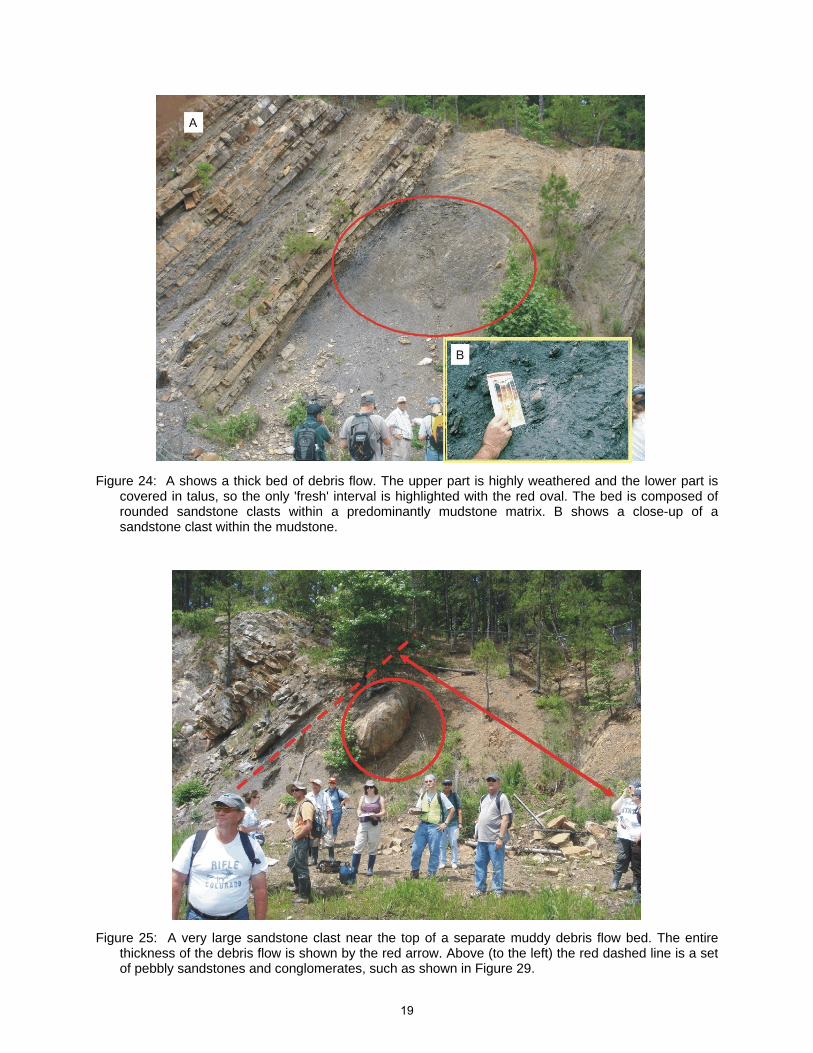
Figure 24: A shows a thick bed of debris flow. The upper part is highly weathered and the lower part is
covered in talus, so the only 'fresh' interval is highlighted with the red oval. The bed is composed of rounded sandstone clasts within a predominantly mudstone matrix. B shows a close-up of a sandstone clast within the mudstone.
Figure 25: A very large sandstone clast near the top of a separate muddy debris flow bed. The entire
thickness of the debris flow is shown by the red arrow. Above (to the left) the red dashed line is a set of pebbly sandstones and conglomerates, such as shown in Figure 29.
19

Figure 26: Thick, dark colored, shaley debris flow beneath very thick-bedded, clean (matrix-free)
sandstones. At the top of the debris flow there are displaced slabs of sandstone that apparently rode along the top of the debris flow in the manner shown in the inset (same as Figure 9).
Figure 27: Thinly bedded muddy debris flow (red arrow) spaced between several sandstone beds.
20
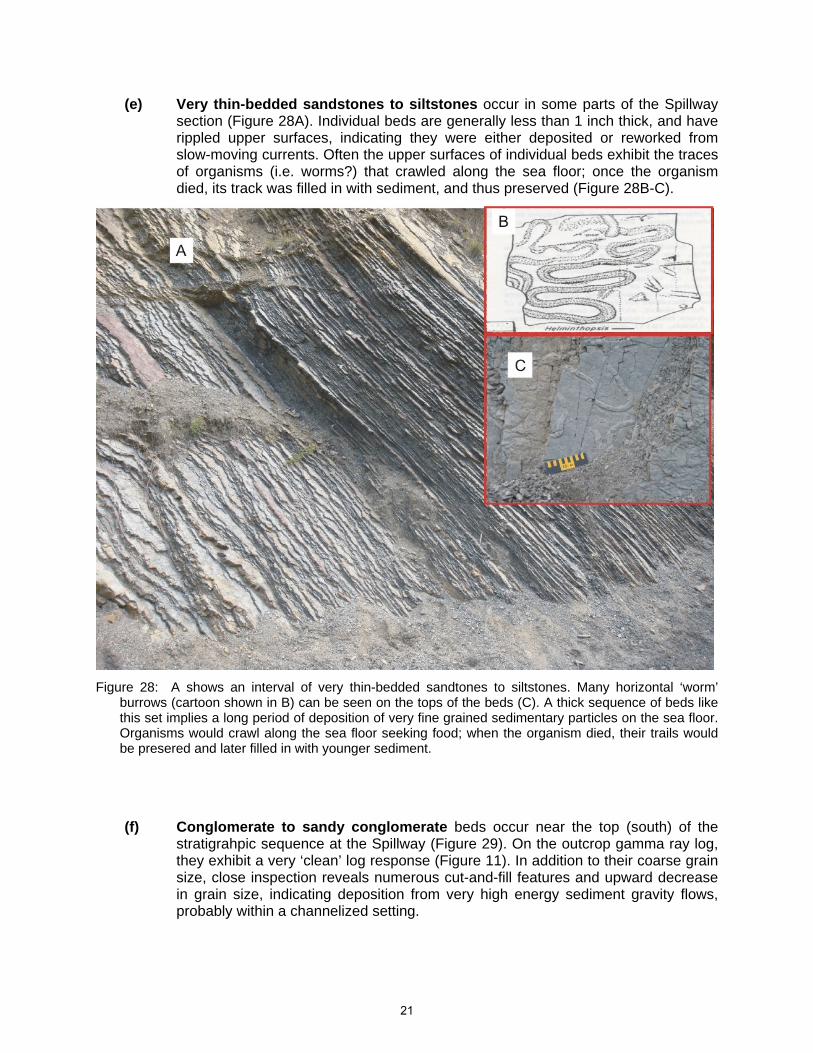
(e) Very thin-bedded sandstones to siltstones occur in some parts of the Spillway section (Figure 28A). Individual beds are generally less than 1 inch thick, and have rippled upper surfaces, indicating they were either deposited or reworked from slow-moving currents. Often the upper surfaces of individual beds exhibit the traces of organisms (i.e. worms?) that crawled along the sea floor; once the organism died, its track was filled in with sediment, and thus preserved (Figure 28B-C).
Figure 28: A shows an interval of very thin-bedded sandtones to siltstones. Many horizontal ‘worm’
burrows (cartoon shown in B) can be seen on the tops of the beds (C). A thick sequence of beds like this set implies a long period of deposition of very fine grained sedimentary particles on the sea floor. Organisms would crawl along the sea floor seeking food; when the organism died, their trails would be presered and later filled in with younger sediment.
(f) Conglomerate to sandy conglomerate beds occur near the top (south) of the stratigrahpic sequence at the Spillway (Figure 29). On the outcrop gamma ray log, they exhibit a very ‘clean’ log response (Figure 11). In addition to their coarse grain size, close inspection reveals numerous cut-and-fill features and upward decrease in grain size, indicating deposition from very high energy sediment gravity flows, probably within a channelized setting.
21
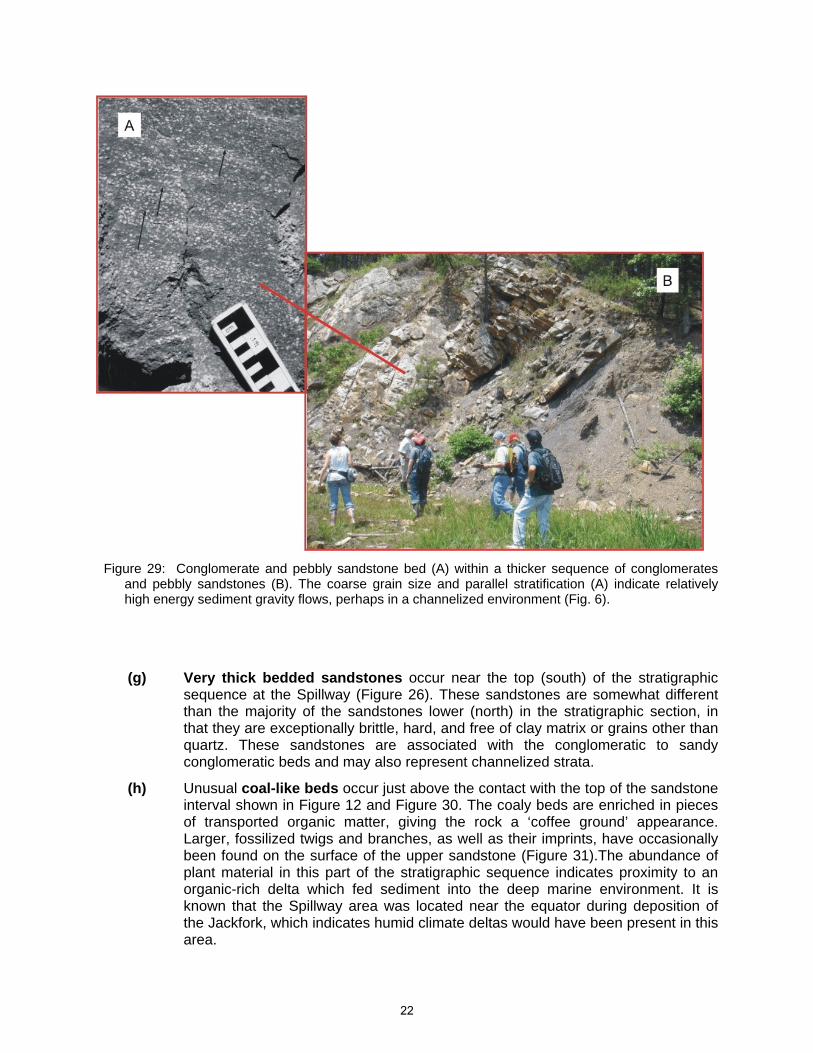
Figure 29: Conglomerate and pebbly sandstone bed (A) within a thicker sequence of conglomerates
and pebbly sandstones (B). The coarse grain size and parallel stratification (A) indicate relatively high energy sediment gravity flows, perhaps in a channelized environment (Fig. 6).
(g) Very thick bedded sandstones occur near the top (south) of the stratigraphic sequence at the Spillway (Figure 26). These sandstones are somewhat different than the majority of the sandstones lower (north) in the stratigraphic section, in that they are exceptionally brittle, hard, and free of clay matrix or grains other than quartz. These sandstones are associated with the conglomeratic to sandy conglomeratic beds and may also represent channelized strata.
(h) Unusual coal-like beds occur just above the contact with the top of the sandstone interval shown in Figure 12 and Figure 30. The coaly beds are enriched in pieces of transported organic matter, giving the rock a ‘coffee ground’ appearance. Larger, fossilized twigs and branches, as well as their imprints, have occasionally been found on the surface of the upper sandstone (Figure 31).The abundance of plant material in this part of the stratigraphic sequence indicates proximity to an organic-rich delta which fed sediment into the deep marine environment. It is known that the Spillway area was located near the equator during deposition of the Jackfork, which indicates humid climate deltas would have been present in this area.
22
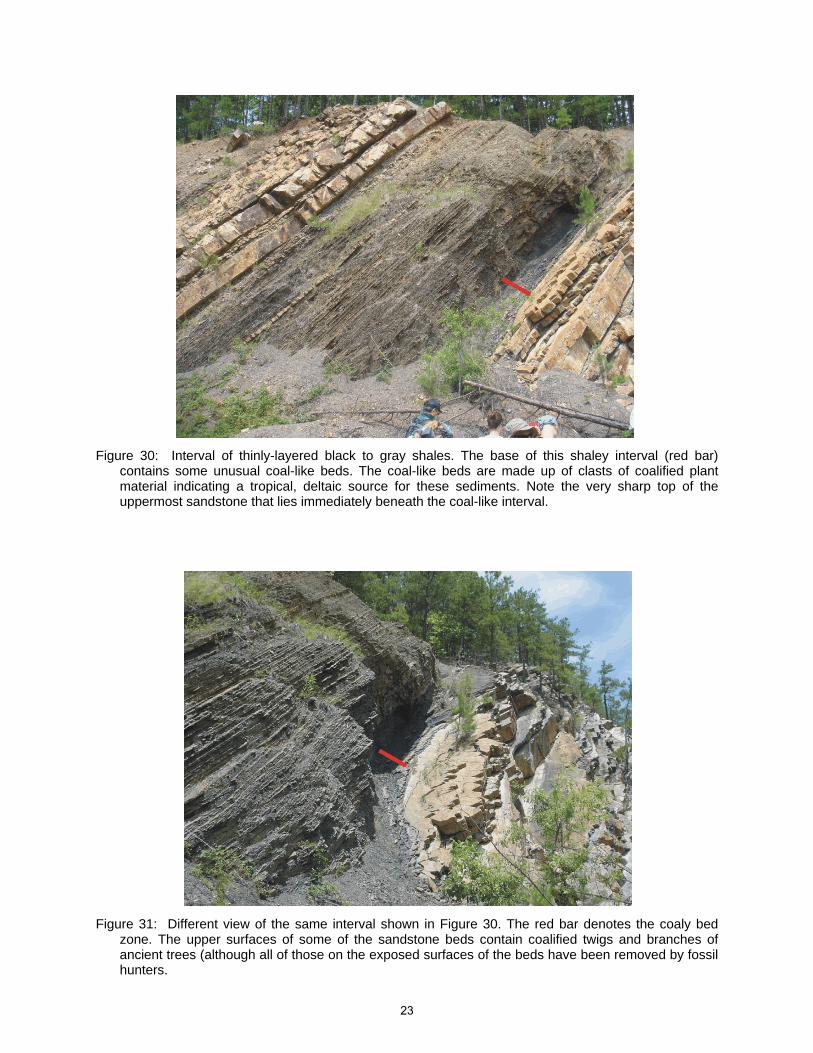
Figure 30: Interval of thinly-layered black to gray shales. The base of this shaley interval (red bar)
contains some unusual coal-like beds. The coal-like beds are made up of clasts of coalified plant material indicating a tropical, deltaic source for these sediments. Note the very sharp top of the uppermost sandstone that lies immediately beneath the coal-like interval.
Figure 31: Different view of the same interval shown in Figure 30. The red bar denotes the coaly bed
zone. The upper surfaces of some of the sandstone beds contain coalified twigs and branches of ancient trees (although all of those on the exposed surfaces of the beds have been removed by fossil hunters.
23
(h) Thinly-layered, black to gray shales, deposited by slow settling of silt- and clay-size particles through the sea water column over a long period of time, occur in relatively thick sections (Figure 30 and Figure 31). Occasionally somewhat coarser, thin beds are present which are probably the very distal ends of turbidity current deposits. Because of the slow rate at which particles settled to the sea floor, marine, bottom-dwelling organisms such as certain worms, could live on the muddy sea floor and crawl around seeking food; fossilized traces of their crawl tracks (not the worms themselves) can be seen on the surfaces of many of these shale beds (such as the one shown in Figure 28B-C).
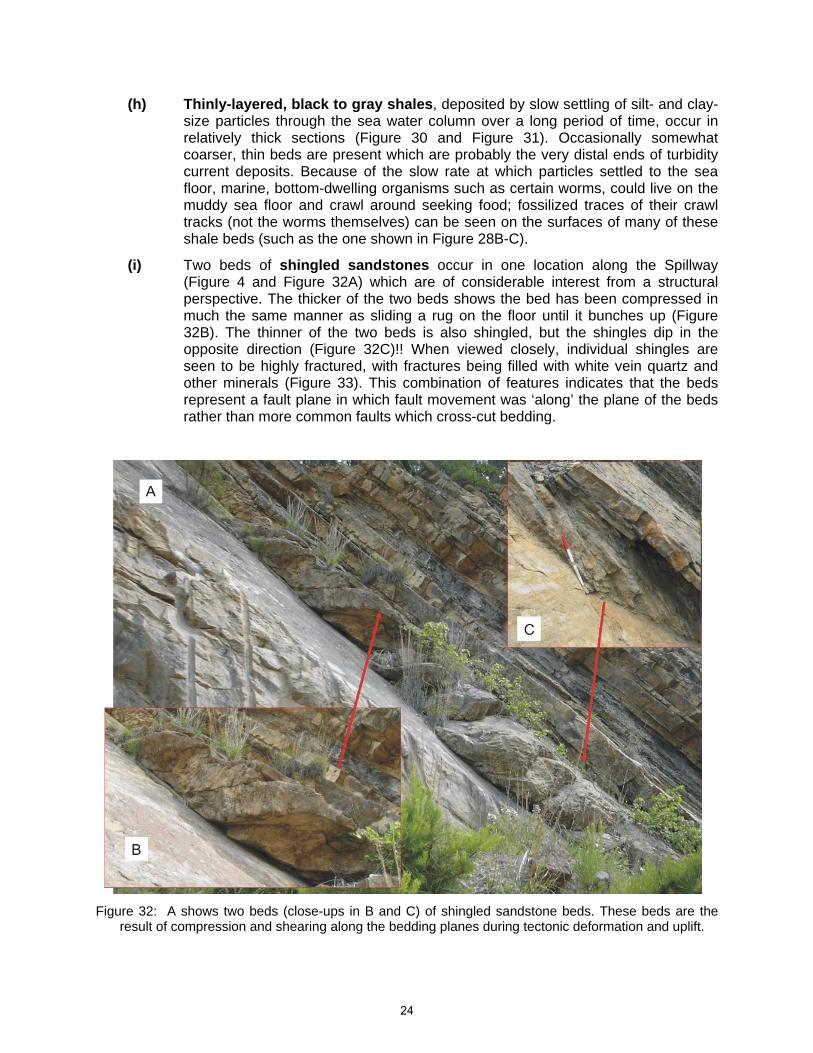
(i) Two beds of shingled sandstones occur in one location along the Spillway (Figure 4 and Figure 32A) which are of considerable interest from a structural perspective. The thicker of the two beds shows the bed has been compressed in much the same manner as sliding a rug on the floor until it bunches up (Figure 32B). The thinner of the two beds is also shingled, but the shingles dip in the opposite direction (Figure 32C)!! When viewed closely, individual shingles are seen to be highly fractured, with fractures being filled with white vein quartz and other minerals (Figure 33). This combination of features indicates that the beds represent a fault plane in which fault movement was ‘along’ the plane of the beds rather than more common faults which cross-cut bedding.
Figure 32: A shows two beds (close-ups in B and C) of shingled sandstone beds. These beds are the
result of compression and shearing along the bedding planes during tectonic deformation and uplift.
24
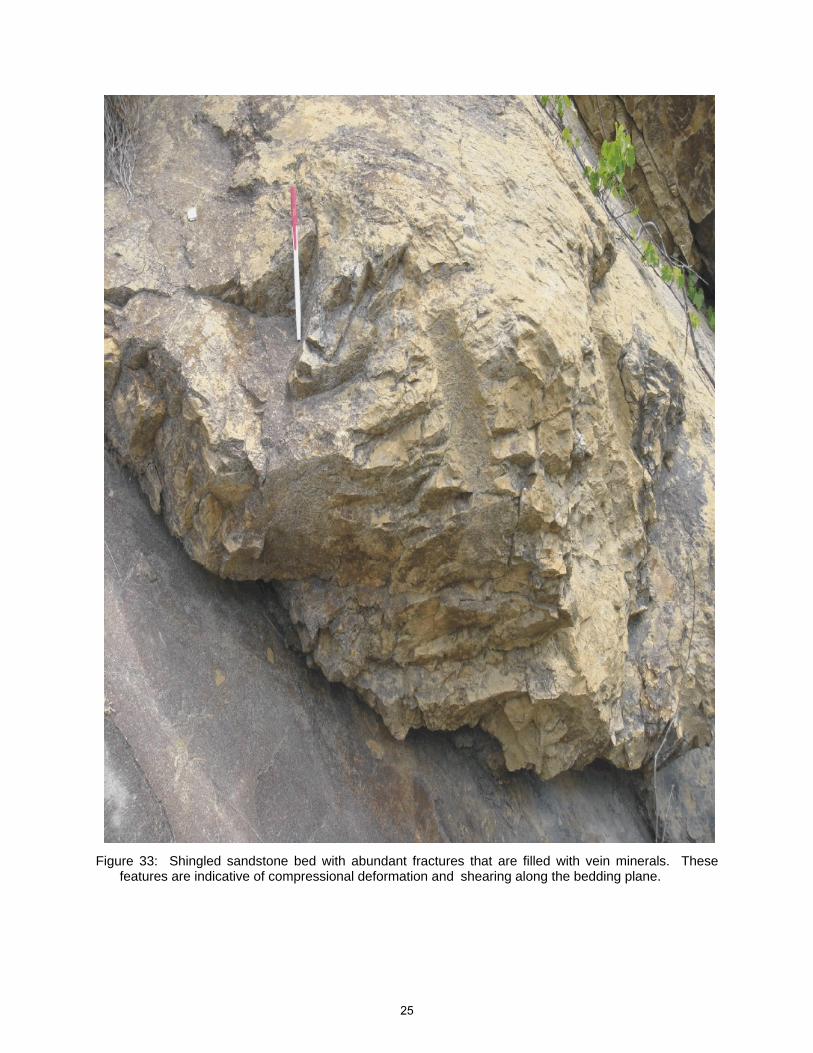
Figure 33: Shingled sandstone bed with abundant fractures that are filled with vein minerals. These
features are indicative of compressional deformation and shearing along the bedding plane.
25
Depositional history of the DeGray Spillway section:
Even though the sedimentary beds at the DeGray Spillway are now tilted 55o to the south,
they were originally deposited horizontally on the floor of the Ouachita Basin (Figure 6). Each
bed was deposited on top of the bed beneath it, so that as one walks up the 1,000ft. thick
stratigraphic section along the Spillway (from north to south), the beds are progressively
‘younger’.
However, the character of the beds is different in different parts of the stratigraphic section,
as discussed above. This means that the transport and depositional processes which supplied
the sediment to the basin and the characteristics of the receiving basin floor must have changed
several times over the interval of time during which the entire 1,000ft. of strata were deposited.
In fact, geologists who have studied this area have been able to determine that there were
both periodic tectonic movements in the earth’s crust in this area as well as periodic changes in
the volume of water in the ocean basin due to periods of glaciation. During glacial periods,
ocean water becomes locked in ice, so that the ocean level drops. Conversely, during periods of
de-glaciation the ice melts and ocean level rises. Such changes in ocean level due to glacial or
interglacial processes are called glacio-eustatic changes.
The variability in rock type and layering through the strata are a result of both the tectonic
and glacio-eustatic changes that occurred within the Ouachita Basin (Figure 2 and Figure 3).
During periods of lowered sea level resulting from either tectonic or glacio-eustatic processes,
sandy and gravelly sediment was supplied to the sea floor in large volumes. The opposite was
true during periods of higher sea level; during such times, only mud was deposited on the deep
ocean floor.
On the basis of ‘reading’ these changes in the rocks (and gamma ray log) and how the
rocks are stacked one upon the other, the depositional history of the Spillway strata has been
reconstructed (Figure 34). The positions within the stratigraphic sequence of some of the key
beds and features mentioned earlier have been labeled on Figure 34. When reading the rocks
to understand transport and depositional processes, geologists typically search for dramatic
changes in rock type, such as those that have been highlighted in Figure 34 by ‘SB’. Each one
of these labeled surfaces marks a specific geologic time in which the sea level dropped either
through tectonics or glacio-eustacy, so that thick volumes of sand and/or gravel were deposited
in the basin. Beneath each of these surfaces are thick shales, either bedded or debris flows,
which were deposited during periods of relatively higher sea level (i.e. sand was not deposited
far out into the basin). The interpreted depositional history of the 1,000ft. thick stratigraphic
26
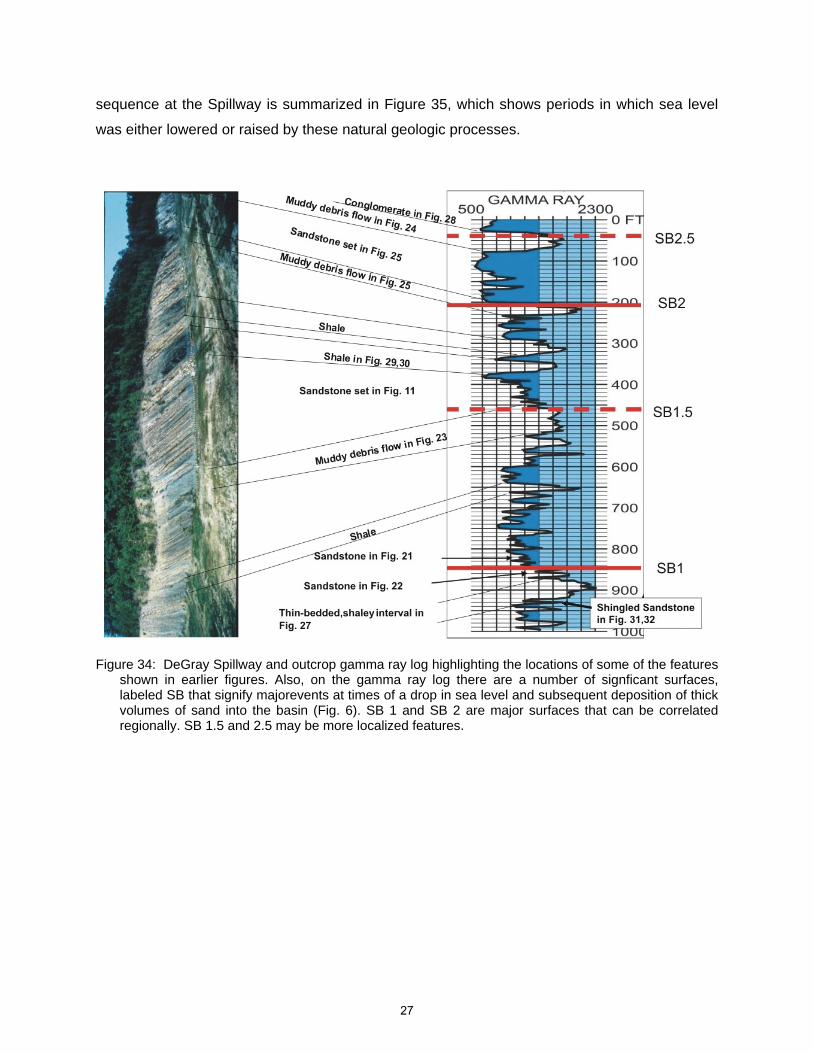
sequence at the Spillway is summarized in Figure 35, which shows periods in which sea level
was either lowered or raised by these natural geologic processes.
Figure 34: DeGray Spillway and outcrop gamma ray log highlighting the locations of some of the features shown in earlier figures. Also, on the gamma ray log there are a number of signficant surfaces, labeled SB that signify majorevents at times of a drop in sea level and subsequent deposition of thick volumes of sand into the basin (Fig. 6). SB 1 and SB 2 are major surfaces that can be correlated regionally. SB 1.5 and 2.5 may be more localized features.
27
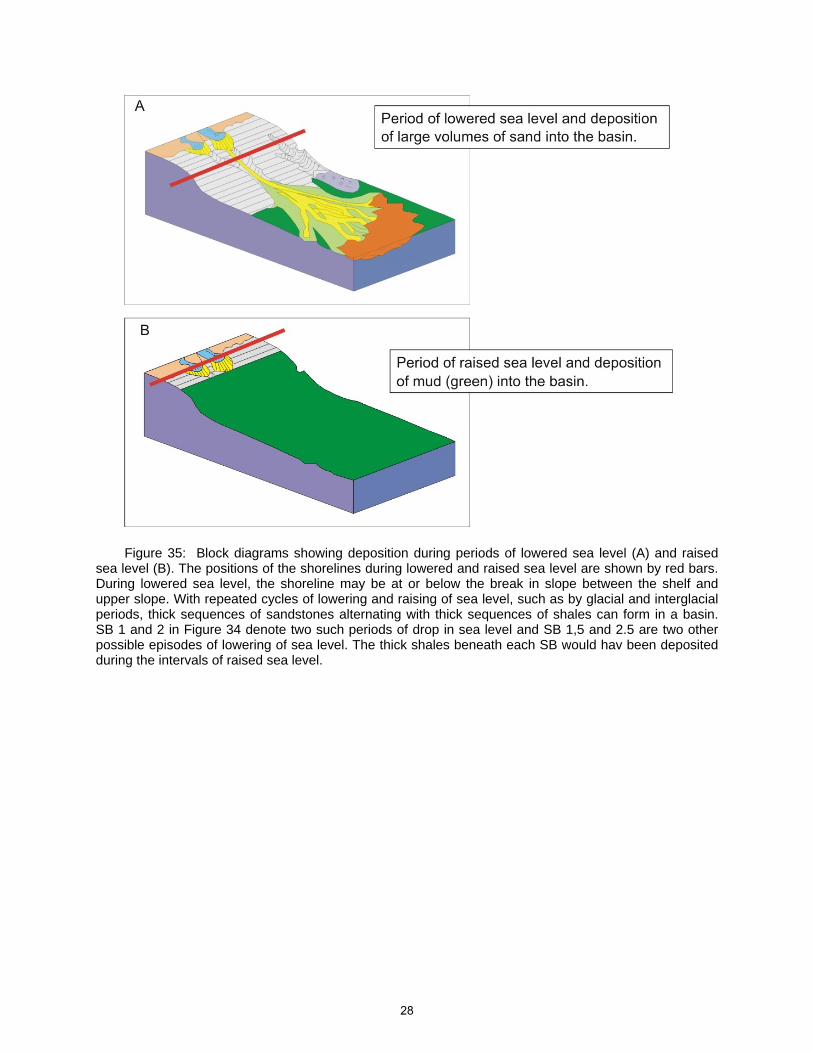
Figure 35: Block diagrams showing deposition during periods of lowered sea level (A) and raised sea level (B). The positions of the shorelines during lowered and raised sea level are shown by red bars. During lowered sea level, the shoreline may be at or below the break in slope between the shelf and upper slope. With repeated cycles of lowering and raising of sea level, such as by glacial and interglacial periods, thick sequences of sandstones alternating with thick sequences of shales can form in a basin. SB 1 and 2 in Figure 34 denote two such periods of drop in sea level and SB 1,5 and 2.5 are two other possible episodes of lowering of sea level. The thick shales beneath each SB would hav been deposited during the intervals of raised sea level.
28
Blakey, R., 2010, Global Paleogeographic views of earth history-Late Precambrian to recent,
http://jan.ucc.nau.edu/~rcb7/globaltext2.html Bouma, A.H., 2000. Fine-grained , mud-rich turbidite systems: model and comparison with
coarse-grained, sand-rich systems, in A.H. Bouma and C.H. Stone, eds., Fine-grained turbidite systems: AAPG Memoir 72/SEPM Special Publication 68, p. 9-20.
Breckon, C.E.,1988. Sedimentology and facies of the Pennsylvanian Jackfork Group in the
Caddo Valley and DeGray Quadrangles, Clark County, Arkansas, Ph.D. dissertation, The University of Tulsa, 134p.
Jordan, D.W., D.R. Lowe, R.M. Slatt, C.G. Stone, A.D’Agostino, M.H. Scheihing, and R. H.
Gillespie, 1993. Scales of geological heterogeneity of Pennsylvanian Jackfork Group, Ouachita Mountains, Arkansas: Applications to field development and exploration for deep-water sandstones, Ark. Geol. Comm. Field Guidebook 93-1, 141p.
Morris, R.C., 1971. Stratigraphy and sedimentology of the Jackfork Group, Arkansas, Amer.
Assoc. Petrol. Geologists Bull., v. 55, p. 387-402. Reineck, H.E. and I.B. Singh, 1980. Depositional sedimentary environments, New York,
Springer-Verlag, 549p. Shanmugam, G. and R.J. Moiola, 1995. Reinterpretation of depositional processes in a classic
flysch sequence (Pennsylvanian Jackfork Group), Ouachita Mountains, Arkansas and Oklahoma: AAPG Bull. V. 79, p. 672-695.
Slatt, R.M., C.G. Stone, and P. Weimer, 2000, Characterization of slope and basin facies tracts,
Jackfork Group, Arkansas, with applications to deepwater (turbidite) reservoir management, in, Gulf Coast Sec. Soc. Sed. Geol. 20th Ann. Res. Conf., Deep water reservoirs of the world, Houston, p. 940-980.
REFERENCES
Al-Siyabi, H.A., 2000. Anatomy of a Type II turbidite depositional system: upper Jackfork Group, DeGray Lake area, Arkansas, in , Gulf Coast Sec. Soc. Sed. Geol. 20th Ann. Res. Conf., Deep water reservoirs of the world, Houston, p. 245-262.
Beaubouef, R.T. and S.J. Friedmann, 2000. High resolution seismic/sequence stratigrahic
framework for the evolution of Pleistocene intraslope bsins, western Gulf of Mexico: depositional models and reservoir analogs, in P. Weimer, R.M. Slatt, J.L. Coleman, N. Rosen, C.H. Nelson, A.H. Bouma, M. Styzen, and D.T. Lawrence, eds. Global deep-water reservoirs: Gulf Coast Section-SEPM Bob F. Perkins 20th Annual Research Conference, p. 40-60.
29