Embed Size (px)
Citation preview
SSC-160
GEOMETRIC EFFECTS OF PLATE THICKNESS
BY
R. D. STOUTC. R. ROPER
and
D.A. MAGEE
SHIP STRUCTURE COMMITTEE
SHIP STRUCTURE COMMITTEE
,liE,lfBEkAGENCIES, ADDRESS CORRESPONDENCE TO:
BUREAU ., SHIPS, DEPT, o. N.”, s....,.. ”
MILITARY S<A TRA. SPO.7A710N s.. ”,.., t)..,. ., .,”” s.,. . . . . . . . . . co..,,,..
UNITE. 5,,,. s COAST G...., ,... s..” D.., u. s. . ..s. G.,!?. H . . ..”......
M..,,,.. A.t4, N,,TR#, T,0N, D.,,, 0. c...,... w.,.,..,.. 25, D. c.
,.,.,... . . . . . . 0, SHIP,,..
February 7, 1964
Dear Sir:
The Ship Structure Committee is sponsoring, at
Lehigh University, a research project entitled “Selection
ofSteels forHeavy-Section Ship Plate.” The purpose is to
determine experimentally the optimum composition and/or
heat treatment for steelplates upto 4-in. thicknesses in-
tended for ship construction.
Herewith is the First Progress Report by R. D.
Stout, C. R. Roper and D. A. Magee, entitled Geometric
Effects of Plate Thickness.
The project is conducted under the advisory guid-
ance of the Committee on Ship Steel of the National Acad-
emy of Sciences-National Research Council.
Comments on this report would be welcomed and
should be addressed to the Secreta~, Ship Structure Com-
mittee.
Yours sincerely,
x‘j’2AizT. J. FABIK
Rear Admiral, U. S. Coast Guard
Chairman, Ship Structure
Committee
SSC-160
FirstProgress Reportof
ProjectSR-162“Selectionof Steels forHeavy-Section Ship Plate”
to the
Ship StructureCommittee
GEOMETRIC EFFECTS OF PLATE THICKNESS
by
R. D. Stout, C. R, Roper and D. A. Magee
Lehigh University
under
Department of the NavyBureau of Ships Contract NObs-84829
Washington, D . C .
National Academy of Sciences-National Research CouncilFebruary 7, 1964
NATIONAL ACADEMY OF SCIENCES-NATIONAL RESEARCH COUNCIL
Division of Engineering & IndustrialResearch
SR-16Z ProjectAdvisow Committee“Selectionof Steels forHeavy-Section Ship Plate”
forthe
Ship Hull Research Committee
C hairman:
Mr. T. T. Watson
Lukens SteelCompany
Members:
Mr. Samuel EPsteinBethlehem SteelCompany
Mr. Walter FleischmannKnollsAtomic Power Laboratory
General ElectricCo.
Dr. John GrossU. S . SteelCorporation
CONTENTS
Introduction . . . . . . . . . . . . . . . . . . . . . . . . . . . . .
Experimental Program . . . . . . . . . . . . . . . . . . . . . . .
The Steels . . . . . . . . . . . . . . . . . . . . . . . . . . . . .
The vanderVeenTest. . . . . . . . . . . . . . . . . . .
The BagsarTest . . . . . . . . . . . . . . . . . . . . . . . .
The Drop-WeightTest . . . . . . . . . . . . . . . . . . . .
Experimental Data . . . . . . . . . . . . . . . . . .
Discussion of Results. . . . . . . . . . . . . . . . . . . . . . .
Choice of Testing Method forPhase Two . . . . . .
Summary . . . . . . . . . . . . . . . . . . . . . . . . . . . . .
References . . . . . . . . . . . . . . . . . . . . .
1
2
2
7
9
11
12
13
21
22
23
INTRODUCTION
In the design and construction of ships of large tonnages,one of the most pressing problems is the selection of hullmaterial that will provide a suitable combination of strength,weldability, and resistance to brittle fracture. The Ship SteelCommittee initiated Project SR-162 at Lehigh University to de-
velop information which would enable the selection of the optimumcomposition and heat treatment of ship steel for use in heavysections.
The initial phase of the program, covered by the presentreport, was intended to establish an adequate testing methodto measure the resistance of steel of these section sizes tobrittle fracture, and to determine whether the level of per-
formance must be raised to counteract size effec’cs as the platethickness increases.
The metallurgical effects of plate thickness upon sensitivityto brittle fracture are well established. As plate section in-creases, the limited hot work and the slower cooling rates follow-ing rolling or heat treatment favor coarser grain size and in-homcgeneity in the plate microstructure which are harmful to
notch toughness. This trend can be balanced at least in partby compositional changes such as lowering the carbon contentand adding beneficial deoxidizing and alloying elements(l) , andby the use of accelerated cooling.(z)
In contrast to the metallurgical effects, the geometricaleffects of plate thickness on brittle fracture are less clearly
understood. Broadly, an increase in the dimensions of a steelsection tends to increase the restraint upon plastic deformationin the steel and thus promotes notch brittleness. The dimensionaleffect of plate thicknesses above 1% inches has not been studiedextensively. In early investigations, (3,4) testing was limited toroom temperature and no transition temperatures were obtained. Theeffect of size was dramatic in steels with transition temperatures
close enough to room temperature, so that thin specimens failed ina ductile manner but thick ones were brittle. In some studies allof the specimen dimensions including the notch radius were in-
creased proportionately; thus no information was obtained on theseparate effects of width, thickness, or span. Akita, ‘5) usingoversized Charpy bars, and Parker, (1) using wide plates, bothconcluded that the effect of plate thickness on transition temper-ature reached essentially a maximum at about one-inch thickness.On the other hand, results on Tipper tests reported by Holiday
-2-
and on the Bagsar tests reported by Epstein (7) indicated a
continuing effect of plate thickness up to 4 inches.
For these reasons, it was considered necessary to plan aseries Of tests which would furnish information on the quanti.
tative effect on transition temperature of the plate thicknessand of the other specimen dimensions. A previous investigationat Lehigh university had suggested that there might be alevelling off of the size effect when the specimen. dimensionsexceeded certain moderate limits. In the present investigation,three testing methods were selected to provide a variety of loadingconditions: the van der Veen test, the Bagsar test, and the drop-weight test. In the van der Veen test, the specimen is loaded inslow bending with the plate thickness oriented in the width di-rection of the beam. The Bagsar test uses a large C-shaped specimenloaded eccentrically in tension. The drop-weight specimen is abend specimen loaded dynamically with the plate thickness orientedas the height of the beam. Details of these tests are given later.
In these tests the plate thickness was varied from 3/4 to 3inches. The other lateral, dimensions and the span of the specimenswere varied to examine the separate effect of each specimen di-
mension on transition temperature and the possible interactionamong these effects. The basic question to be answered was this:how can the size effect of plate thickness on transition temperaturebe evaluated without interference from the size effect of the other
d imens ions of the spec imei~? Some assurance that the problem wassoluble was available from wide–plate tests (9) which showed thatplate widths from 3 inches to 72 inches did not seriously affect
the transition temperatures of plates 3/4-inch thick.
To broaden the applicability of the results, transitiontemperatures were determined by both ductility and fracture tran-sition criteria in the van der Veen and Bagsar tests. Deflectionsat failure, lateral contraction at the notch, maximum loads, andfracture appearance were all recorded.
The testing program of Phase One was carried out on a heat
of ABS Class C steel normalized to minimize metallurgical clifferencesamong plate thicknesses. A heat of “T-1” steel was also tested by
the van der veen method to check the results obtained on the carbonsteel-
EXPERIMFNTAL PRCGRAM
The Steels
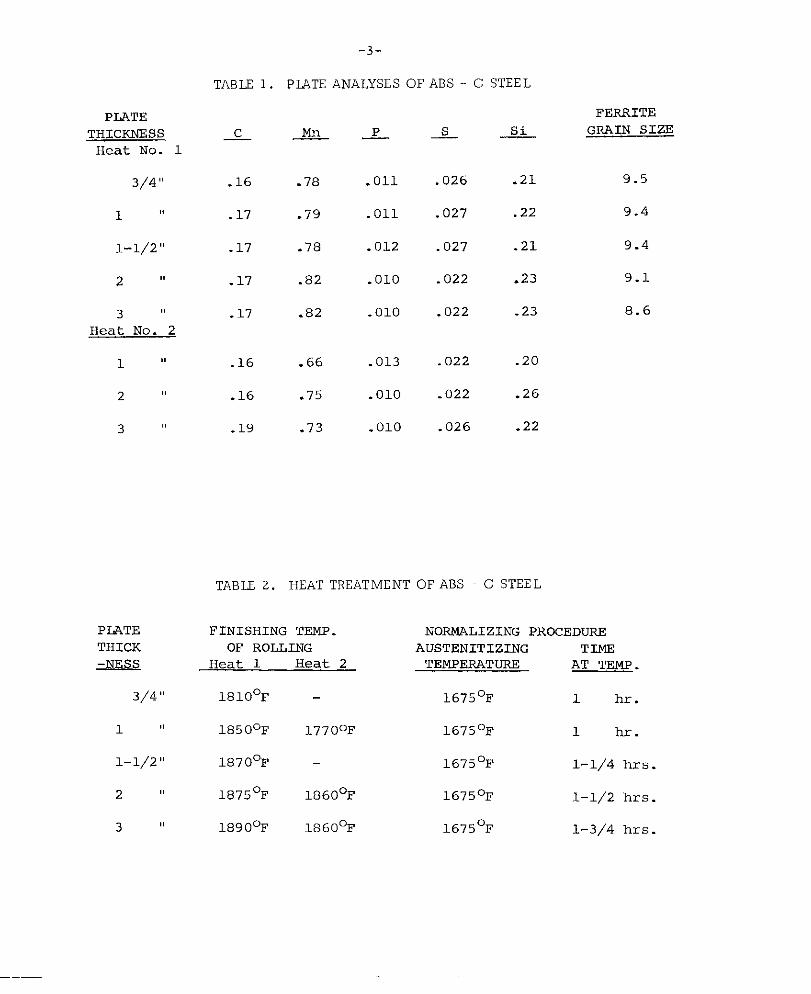
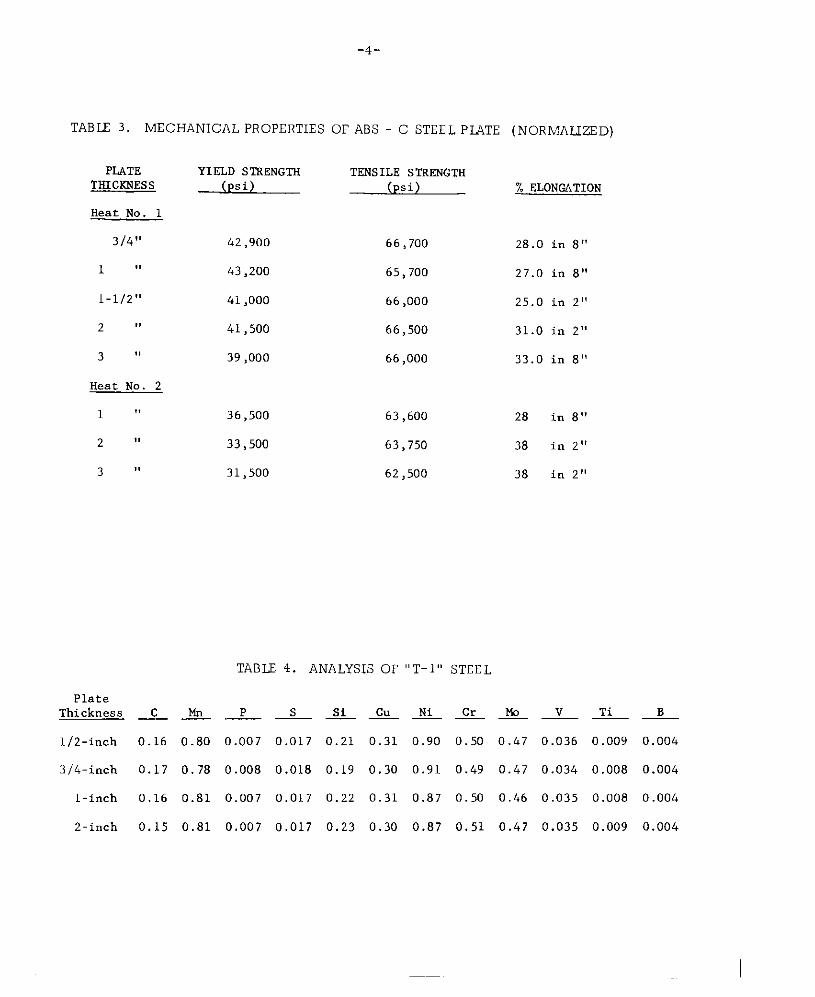
The chemical analyses, heat treatments, and mechanicalproperties of the ABS Class C steel and the “T-1” steel are
presented in Tables 1 to S. Heat No. 2 of the ABS Class C
PLATE
THICRNRSSHeat No. 1
3/4”
1 “
1-1/2 “
2 “
3 “Heat No. 2
1 “
2 “
3 “
PLATE
THICK~
3/4 “
1 “
1-1/2 “
2 “
3 “
TABLE 1
&
.16
.17
.17
.17
.17
.16
.16
.19
-3-
PIATE ANALYSES OF ABS - C STEEL
& &
.78 .011
.79 .011
.78 .012
.82 .010
.82 .010
.66 .013
.75 .010
.73 .010
Js_
.026
.027
.027
.022
.022
.022
.022
.026
FERRITE
Si GRAIN SIZE
.21 9.5
.22 9.4
.21 9.4
.23 9.1
.23 8.6
.20
.26
.22
TABLE 2. HEAT TREATMENT OF ABS C STEEL
FINISHING TEMP.OF ROLLING
Heat 1 Heat 2
181OOF -
18500F 1.770°F
lS70°F -
1875°F 18600F
1890°F 18600F
NORMALI ZING PROCEDURE
AUSTENITIZING TIMETEMPERATURE AT TEMP.
1675°F 1 hr.
1675°F 1 hr.
1675°F 1-1/4 hrs .
1675°F 1–1/2 hrs.
1675°F 1-3/4 hrs.
-4-
TABLE 3. MECHANICAL PROPERTIES OF ABS - C STEEL P2.4TE (NORMALIZED)
PLATETmc30iEss
Heat No. 1
314”
1 !,
1-1/2”
2 !,
3 !,
Heat No. 2
1 ,!
2 ,,
3 ,,
YIELD ST8ENGTR
(PSi)
42,900
43,200
41>000
41,500
39,000
36,500
33,500
31,500
TENSILE STSENGT8
(Psi
66,700
65,700
66,000
66,500
66,000
63,600
63,750
62,500
% ELONGATION
28.0 in 8“
27.o in 8“
25.0 in 2“
31.0 in 2“
33.0 in 8“
28 in 8“’
38 in 2“
38 in 2“
TABLE 4. ANALYSIS OF “T-l” STEEL
PlateThickness C M __.?___& & CuNicr~~ _Ti ~
lf2-inch 0.16 0.80 0.007 0.Ol7 0.21 0.31 0.90 0.50 0.47 0.036 0.009 0.004
314-inch 0.17 0.78 0.008 0.018 0.19 0.30 0.91 0.49 0.47 0.034 0.008 0.004
l-inch 0.16 0.81 0.007 0.017 0.22 0.31 0.87 0.50 0.46 0.035 0.OO8 0.004
2-inch 0.15 0.81 0.007 0.017 0.23 0.30 0.87 0.51 0.47 0.035 0.009 0.004
-5-
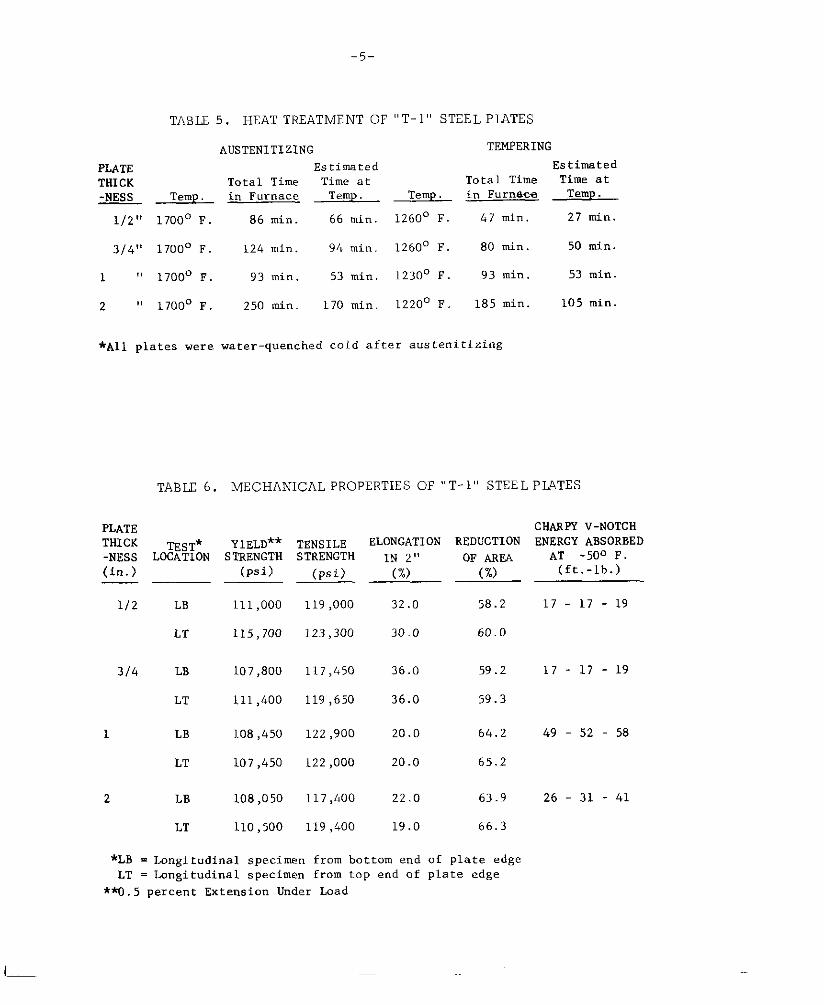
TABLE 5. HEAT TREATMENT OF “T-1” STEEL PL4TES
AUSTENITIZING TENFERING
PLATE Estimated EstimatedTHICK Total Time Time at Total Time Time at
* TemP in Furnace Temp. Temp. in Fumace Temp.
112” 1700° F. 86 min. 66 min. 1260° F. b7 min. 27 min.
3/4” 1700° F. 124 min. 94 min. 1260° F. 80 min. 50 min.
1 “ 1700° F. 93 min. 53 min. 1230° F. 93 min. 53 min.
2 “ 1700° F. 250 min. 170 min. 1220° F. 185 min. 105 min.
*All plates were water-quenchedcold after austenitizing
TABLE 6. MECHANICAL PROPERTIES OF “T-1“ STEEL PLATES
PLATE CHARFY v-NOTGHTHICK TEST* YIELD** TENSILE ELONGATION REDUCTION-NESS LOCATION STRENGTH STRENGTH IN 2“ OF AHEA(in.) (psi) (psi) (%) (%)
llz LB 111>000 119,000 32.0 58.2
LT 115,700 123,300 30.0 60.0
314 LB 107,800 117,450 36.0 59.2
LT 111,400 119,650 36.0 59.3
1 LB 108,450 122,900 20.0 64.2
LT 107>450 122,000 20.0 65.2
2 LB 108>050 117,LO0 22.0 63.9
LT 110,500 119,400 19.0 66.3
*LB = Longitudinalspecimen from bottom end of plate edgeLT = Longitudinalspecimen from tap end of plate edge
*W. 5 percent Extension Under Load
ENERGY ABSORBEDAT -500 F.(ft.-lb.)
17-17-19
17-17-19
49 - 52
26 - 31
58
41
I_
-6-
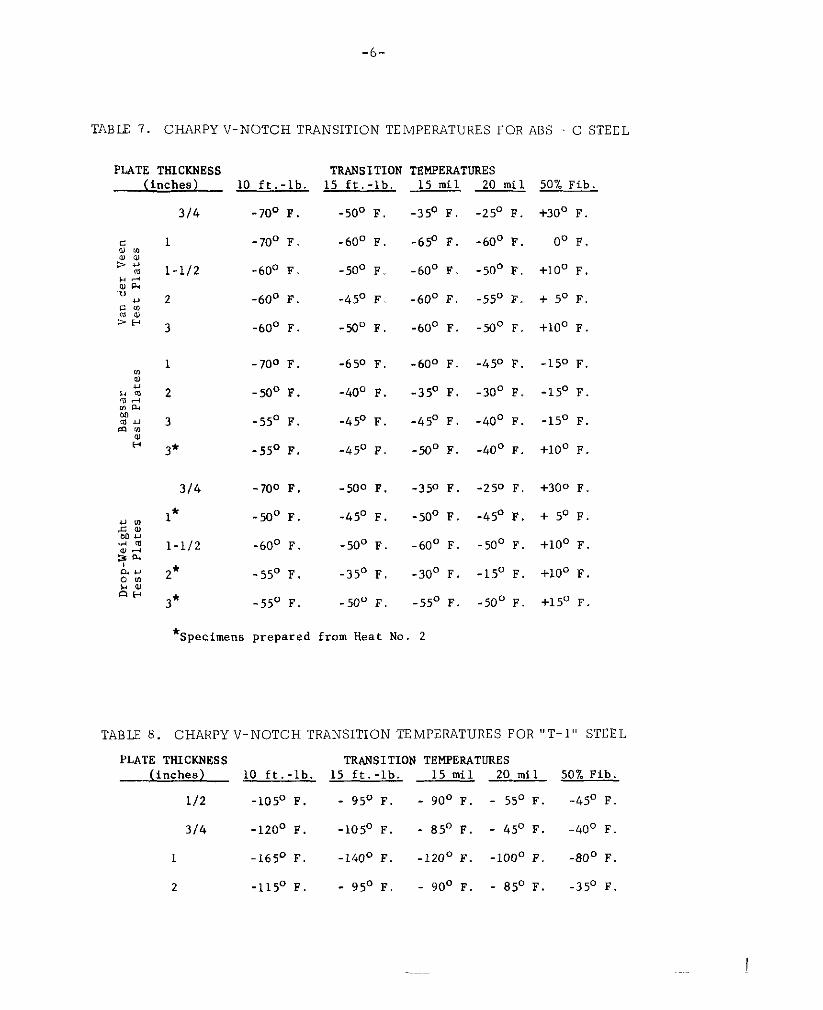
TABII 7. CHARPY V-NOTCH TRANSITION TEMPERATURES FOR ABS C STEEL
PIATE THICKNESS(inches)
3/4
1
1-1/2
2
3
1
2
3
3*
314
1*
1-1/2
**
3*
TSANSITION TEMPERATURES
-50° F,
-60° F.
-50° F.
-45° F.
-X3° F,
.650 F,
-40° F.
-45° F.
-45° F.
-500 F.
-450 F.
-50° F.
-35° F,
-50° F.
10 ft.-lb. 15 ft.-lb. “- “ “ “.... -.,
-70° F.
-70° F.
-60° F.
-60° F.
-60° F.
-700 F.
-Wo ~.
-55° F.
-55° F.
-700 F,
-50° F.
-60° F.
.550 F.
-550 F.
1> mxl
-35° F,
-65° F.
-60° F.
-60° F.
-60° F.
LU mll
-25° F.
-60° F.
-50° F.
-55° F.
-50° F.
-600 F.
-35° F.
-45° F.
-50° F.
-350 F.
-50° F.
-60° F.
-30° F.
-55° F.
-45° F.
-30° F.
-40° F.
-40° F.
-250 F.
-45° F.
-50° F.
-15° F.
-50° F,
3U{.CID.
+30° F
0° F.
+10° F.
+ 5° F,
+10° F
-150 F.
-15° F.
-15° F.
+10° F.
+300 F.
+ 5° F.
+10° F
+10° F
+15° F.
*Specimens prepared from Heat NO. 2
TABLE 8. CHARPY V-NOTCH TRANSITION TEMPERATURES POR “T-1“ STEEL
PLATE THICKNESS TRANSITION TENPESATURES(inches) 10 ft.-lb. 15 ft.-lb. 15 mil 20 mil .50% Fib
1/2 -105° F. - 95° F. - 90° F. - 55° F. -45° F.
314 -120° F. -105° F. - 85° F. - 45° F. -40° F.
1 -165° F. -140° F. -120° F. -100° F. -80° F.
2 -115° F. - 95° F. - 90° F. - 85° F. -35° F.
!
-7-
steel was used only for the l-inch and 2-inch thick drop-weighttests.
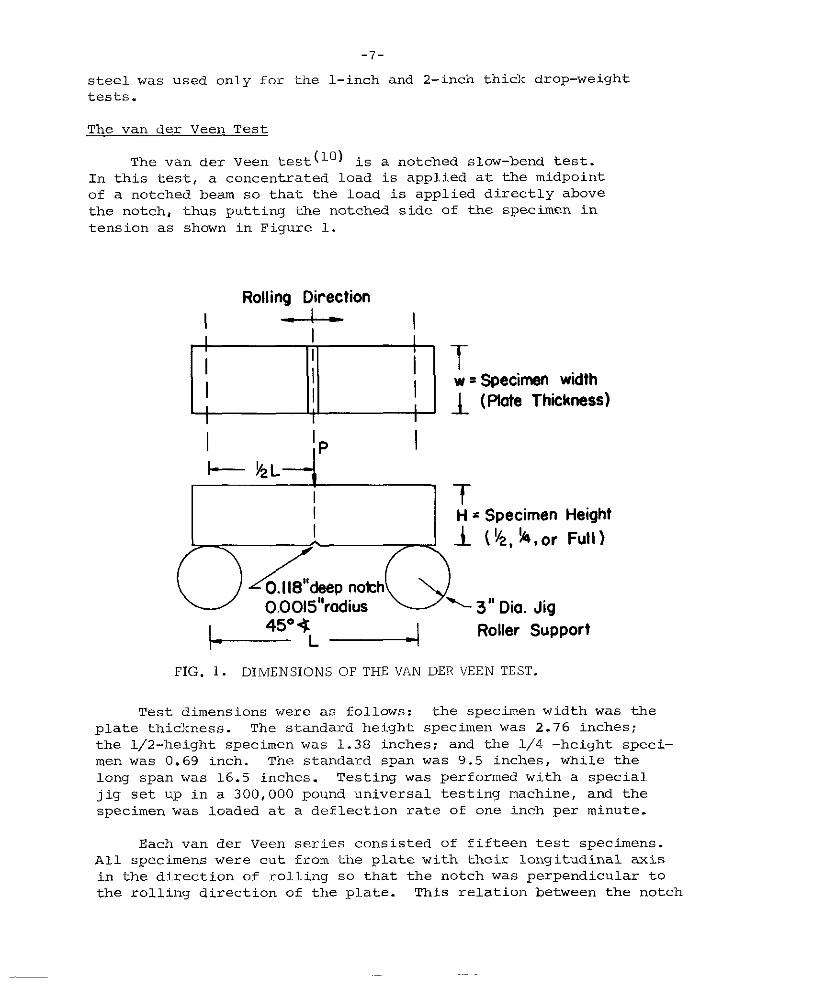
TIE van der Veen Test
The van der Veen test (‘0) is a notched slow-bend test.In this test, a concentrated load is applied at the midpointof a notched beam so that the load is applied directly abovethe notch, thus putt ing the notched side of the specimen intension as shown in Figure 1.
Rolling Direction
I I
I I+ )+L
I ‘ -fH = Specimen Height
I ($, ~,or Full)
~/ 0.118’’deeP nokh0.0015’’radius 3“ Die. Jig
~ 45”*L q Roller Support
FIG. 1. DIMENS1ONS OF THE VAN DER VEEN TEST.
Test dimensions were as fO11OWS: the specimen width was the
plate thickness. The standard height specimen was 2.76 inches;the l/2-height specimen was 1.38 inches; and the 1/4 -height speci-
men was O.69 inch. The standard span was 9.5 inches, while the
long span was 16.5 inches. Testing was performed with a special
jig set up in a 300, 000 pound universal testing machine, and thespecimen was loaded at a deflection rate of one inch per minute.
Each van der Veen series consisted of fifteen test specimens.All specimens were cut from the plate with their long itudinal axisin the direction of rolling so that the notch was perpendicular tothe rolling direction of the plate. This relation between the notch
-8-
and rolling direction was maintained in all tests, including theCharpy test.
The specimen notch was O.118 inch (3mm) deep with a radius
of 0.0015 inch and an included angle of 45°. The root radius was
~~~; ~HgH~i~;~s”=;fi=y’YY~ ‘;;~t~ew~~r;~s~;othe required depth in the test specimen by means of a tool steeldie. The depth was controlled during pressing by a dial gaugemounted on ,the movable head of the testing machine. After notching,the specimens were filed on both sides of the notch to obtain a
smooth surface for taking lateral measurements. These lateralmeasurements were taken before and after testing to determine thepercent lateral contraction.
The van der Veen specimens for each series were tested overa range of temperatures to obtain the transition temperature foreach criterion selected. The specimens were cooled to a pre-
determined temperature in a bath of alcohol and dry ice. For the
tests run at temperatures below -lOO°F, the specimens were im-mersed in a bath of methyl butane cooled with liquid nitrogen.
The minimum holding time needed for each specimen to cool
uniformly to the bath temperature was determined by running atemperature versus time test. A thermocouple was inserted into a
hole drilled to the center of a 3-inch x 2.76-inch cross section
van der Veen specimen. The time for the center of the specimen toreach the bath temperature was found to average 13 minutes for bath
temperatures from –30°F to -75°F. In practice this time was doubled
to insure a uniform temperature throughout the specimen. The hold ing
times for the smaller cross sections were estimated from the measure-ments on the 3-inch x 2.76- inch cross section. A time of approxi-mately 10-15 seconds was taken to remove the specimen from the bath,
center it on the jig and begin the testing. Deflection readings
were taken from an Ames dial gauge.
Both fracture appearance and ductility criteria were used toevaluate the transition temperature. These criteria were as
follows:
Fracture appearance:
a. 5CM shear depth
b. 8 mm shear depth
Ductility:
a. 2% lateral contraction at the root of the notch
b. % the deflection observed at maximum load in theshear rang e
I
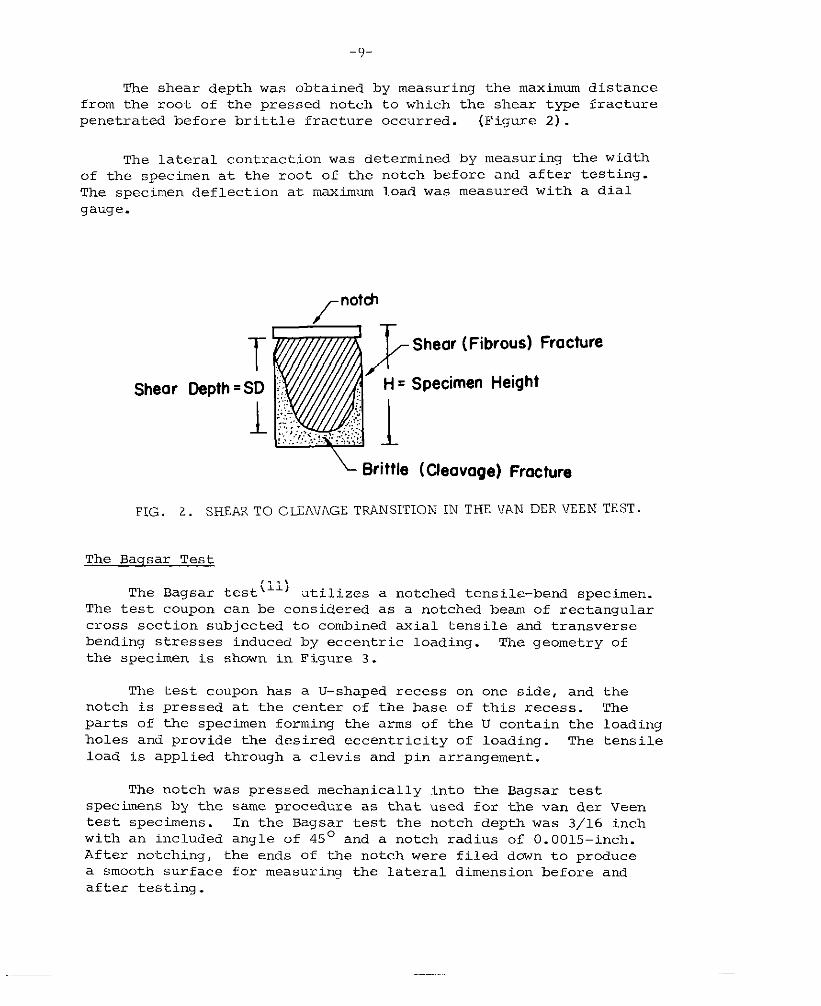
The shear depth was obtained by measuring the maximum distancefrom the root of the pressed notch to which the s“hear type fracturepenetrated before brittle fracture occurred. (Figure 2) .
The lateral contraction was determined by measuring the widthof the specimen at the root of the notch before and after testing.The specimen deflection at maximum load was measured with a dialgauge.
[
notch
T } Shear (Fibrous) Fracture
Shear Depth = SD H = Specimen Height
L1
~ Brittle (Cleavage) Fracture
FIG. 2. SHEAR TO C IXAVAGE TRANS1TION IN THE VAN DER VEEN TEST.
The Baqsar Test
The Bag6ar test(ll) ~tll~zes a notched tensile-bend specimen.The test coupon can be considered as a notched beam of rectangular
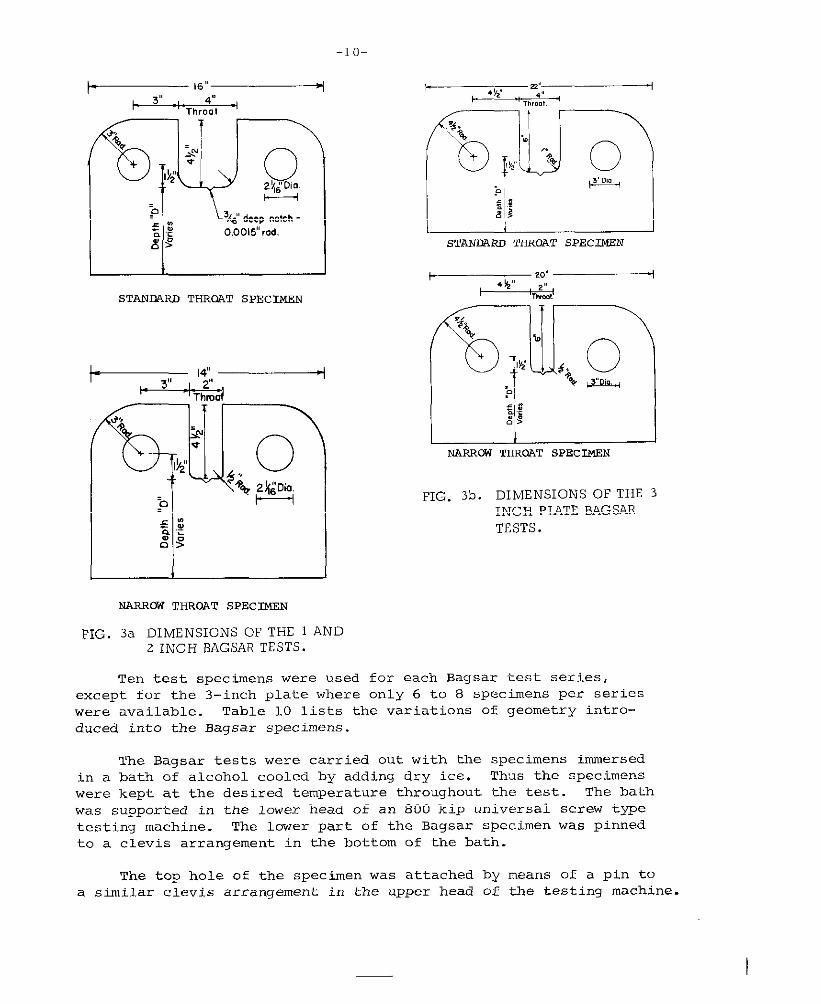
cross section subj ected to combined axial tensile and transversebending stresses induced by eccentric loading. The geometry ofthe specimen is shown in Figure 3.
The test coupon has a U-shaped recess on one side, and thenotch is pressed at the center of the base of this recess. Theparts of the specimen forming the arms of the U contain the loading
holes and provide the desired eccentricity of loading. The tensileload is applied through a clevis and pin arrangement.
The notch was pressed mechanically into the Bagsar test
specimens by the same procedure as that used for ‘iie van der Veentest specimens. In the Bagsar test the notch depth was 3/16 inchwith an included angle of 45° and a notch radius of O.0015-inch.
After notching, the ends of the notch were filed down to producea smooth surface for measuring the lateral dimension before andafter testing .
-1o-
1 zz’~.,. .
[email protected] SPECIMEN
I +sTANDARD ‘THROAT SPECIMEN
FIG. 3b. DIMENSIONS OF THE 3INCH PIATE BAGSAR
TESTS.
NARROW THROAT SPECIMEN
FIG. 3a DIMENSIONS OF THE 1 AND2 INCH BAGSAR TESTS.
Ten test specimens were used for each Bagsar test series,except for the 3-inch plate where only 6 to 8 specimens per series
were available. Table 10 lists the variations of geometry intro-
duced into the Bagsar specimens.
The Bagsar tests were carried out with the specimens immersedin a bath of alcohol cooled by adding dry ice. Thds the specimens
were kept at the desired temperature throughout the test. The bath
was supported in the lower head of an 800 kip universal screw typetesting machine. The lower part of the Bagsar specimen was pinnedto a clevis arrangement in the bottom of the bath.
The top hole of the specimen was attached by means of a pin toa similar clevis arrangement in the upper head of the testing machine.
The load was thenspeed of one inch
The criteria
-11-
applied thr Ough the pins at a cross–head separationper minute.
used to evaluate the transition temperatures weresimilar to those used for the van der Veen test.
Baqsar Transition Temperature Criteria
Fracture Appearance criteria:
a. 50?? shear depth
Ductility Criteria:
a. 2% lateral contractionb. drop in maximum load
The Drop-We iqht Test
In the drop-weight test(12) a known free falling weight strikesthe center of a special test specimen supported at its ends in a jig.
The impact energy is controlled by the choice of the weight and the
distance of fall.
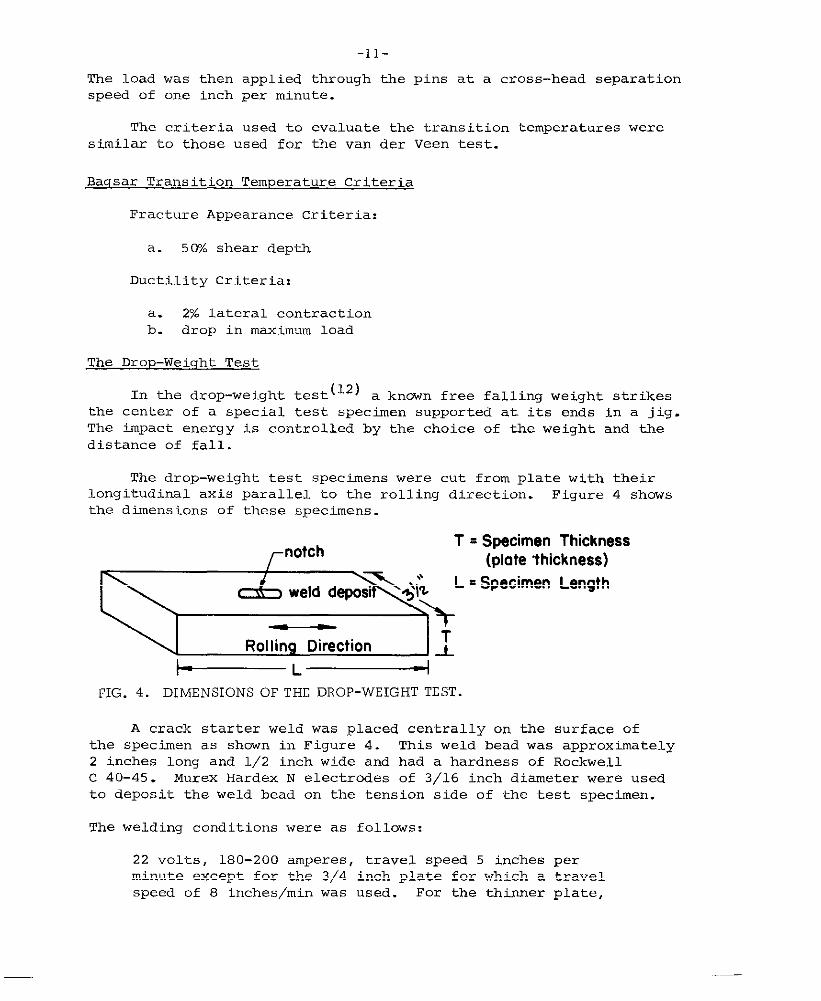
The drop–weight test specimens were cut from plate with their
longitudinal axis parallel to the rolling direction. Figure 4 showsthe dimens ions of these specimens.
e;=:g
~L~
FIG. 4. DIMENSIONS OF THE DROP-WEIGHT TEST.
A crack starter weld was placed centrally on the surface of
the specimen as shown in Figure 4. This weld bead was approximately
2 inches long and 1/2 inch wide and had a hardness of Rockwellc 40-45. Murex Hardex N electrodes of 3/16 inch diameter were used
to deposit the weld bead on the tension side of the test specimen.
The welding conditions were as follows:
22 volts, 180-200 amperes, travel speed 5 inches perminute except for the 3/4 inch plate for which a travel
speed of 8 inches/rein was used. For the thinner plate,
-12-
a faster travel speed was necessary to meet the hardnessrequirements.
A notch was machined in the weld bead using a 45° angle cutter
with a radius of O.010 inch. The notch was machined to a depthsuch that the root of the notch was O.070 inch above the specimensurface. The purpose of the notch was to initiate brittle fracture
in the weld bead directly belcw the line of impact.
The specimens were brought to the desired temperatures in a
bath of alcohol cooled by dry ice additions. After the required
period the specimen was removed from the bath and centered on
the jig supports so that the notch on the tension side of thespecimen was directly below the line of impact. The weight was
then dropped on the specimen from a height necessary to givethe required impact energy.
This impact energy value was determined by trial. The impact
energy for each specimen thickness and span length was determined
as that energy which would produce a minimum crack opening ofO.015 inch at the base of the notch at room temperature. The
impact energy chosen for each test series initiated brittlefracture at room temperature in the hard weld bead. At 10W
temperatures the brittle crack initiated in the weld bead waspropagated into the test specimen.
A specimen was considered broken (a “Go” specimen) if thebrittle crack propagated to one or both edges of the tension
surface. If the brittle crack did not propagate this amount,
the specimen was considered unbroken (a “No Go” specimen) .
Duplicate specimens were tested at 10°F intervals in the
=Pected transition temperature range. The nil ductility trans-
ition temperature (NDT) for a test series was defined as thehighest temperature at which a “Go” specimen was obtained,
providing duplicate “No-Go” specimens were obtained at atemperature 10°F higher. This was the only transition temperaturecriterion used for this test, and it is essentially a criterionof the ability of the specimen material to stop a running cleavagecrack.
EXPERIMENTAL DATA
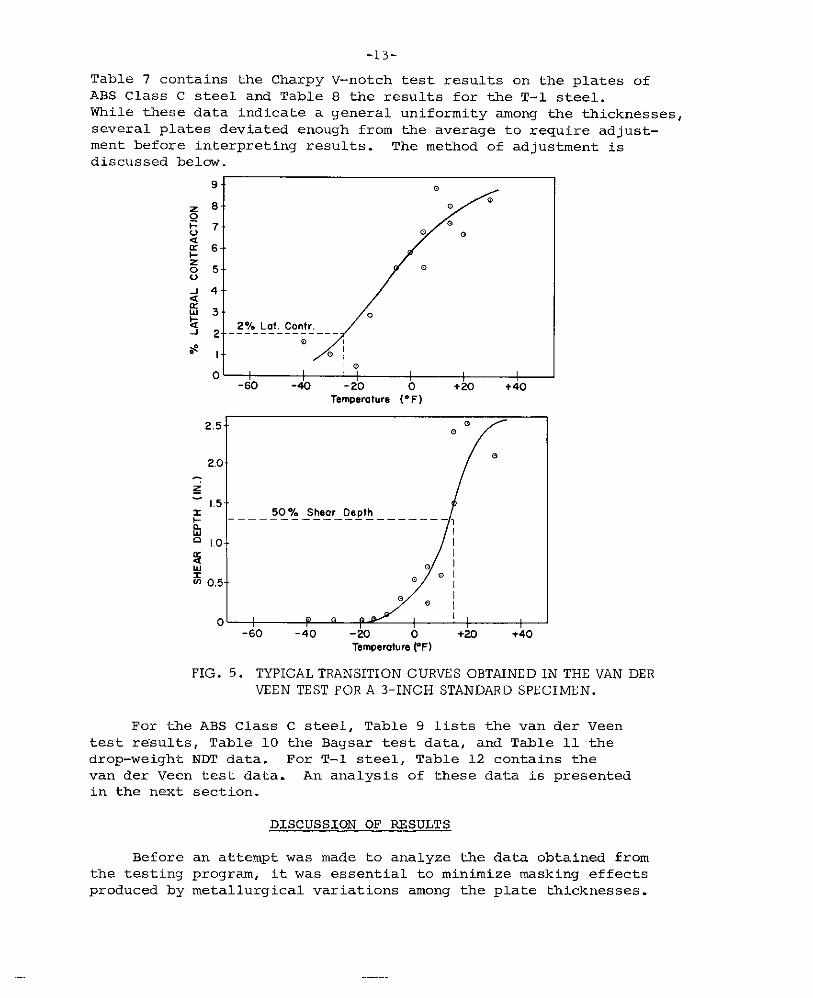
An illustration of the data collected for the determination
of transition temperatures is given in Figure 5. The scatter ex-hibited by the data is typical of that observed in the tests andrepresents an uncertainty of about > 10°F.
A complete listing of the transition temperatures obtained
from the several testing methods is presented in the tables.
-13-
Table 7 contains the Charpy V-notch test results on the plates ofABS Class C steel and Table 8 the results for the T-1 steel.While these data indicate a general uniformity among the thicknesses,
several plates deviated enough from the average to require adjust-ment before interpreting results. The method of adjustment isdiscussed below.
10
01 , $
-60 -40 -20 0 t20 +40Temperature (°F)
2.5-
f
0.
2.00
-g- L5-
:50% Shear Oepth
~
n 1.o-
3 0:~ 0,5 o
0 ( La ,(
-60 -40 -20 0 +20 +40Temperature PF)
FIG . 5. TYPICAL TRANSITION CURVES OBTAINED IN THE VAN DER
VEEN TEST FOR A 3-INCH STANDARD SPECIMEN.
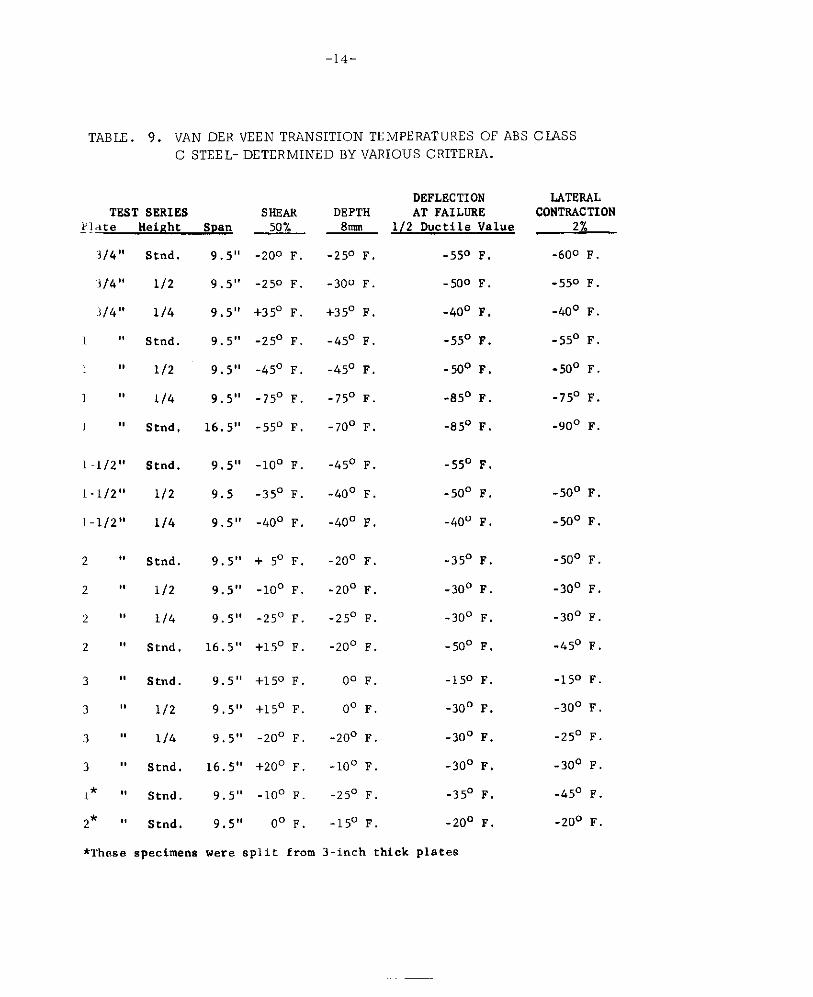
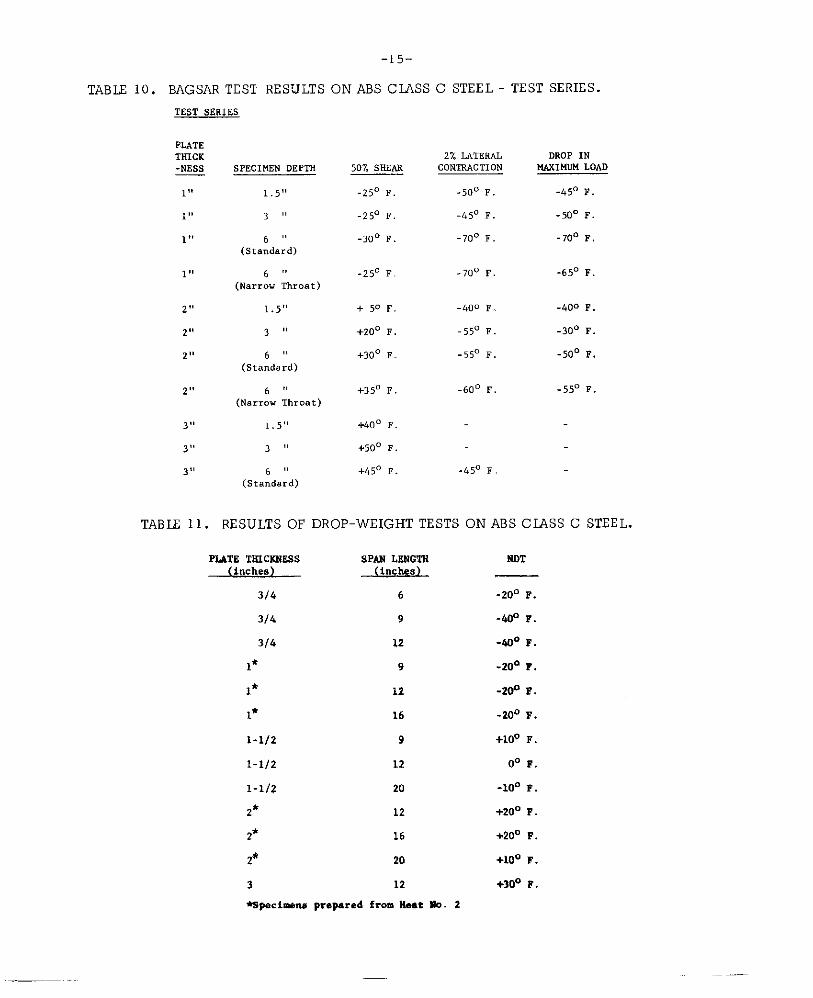
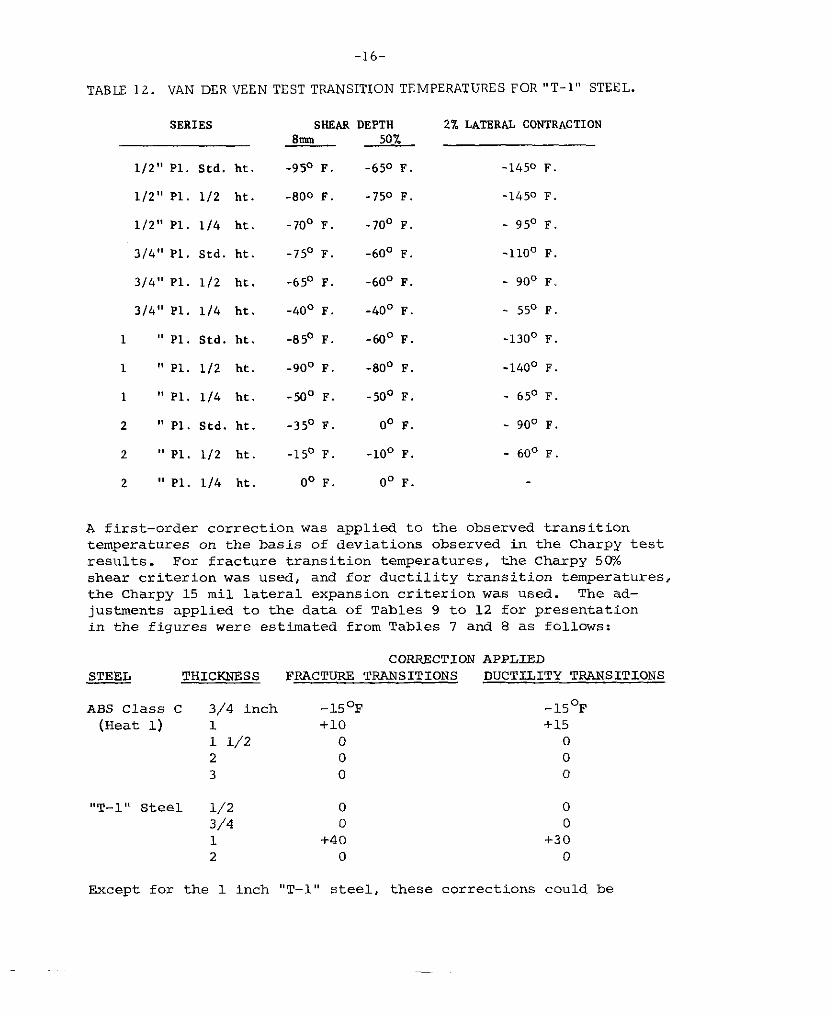
For the ABS Class C steel, Table 9 lists the van der Veen
test results, Table 10 the Bagsar test data, and Table 11 thedrop-weight NOT data. For T-1 steel, Table 12 contains the
van der Veen test data. An analysis of these data is presentedin the next section.
DISCUSSION OF RE8ULTS
Before an attempt was made to analyze the data obtained from
the testing program, it was essential to minimize masking effectsproduced by metallurgical variations among the plate thicknesses.
-14-
TAB LE. 9. VAN DER VEEN TRANSITION TEMPERATURES OF ABS CLASS
C STEEL- DETERMINED BY VARIOUS CRITERIA.
TEST SERIES SSEAR~late Height Span 50%
‘I14° Stnd.
‘3/4” 112
J/4° 1/4
1 ,, Stnd.
1 ,, 1/2
1 ,, L/b
1 !, Stnd,
1.1/28< Stnd.
1-1/2” 1/2
1-1/2” 1/4
2 ,,Stnd.
2 ,, 112
? “ 114
2 ,, S tnd.
3 ,, Stnd.
3 ,, 112
3 ,, 1/4
3 ,, Stnd.
L* ,,S tnd.
2* “ Stnd.
9.5” -200 F,
9.5” .250 F.
9.5” +35° F.
9.5” -25° F.
9.5” -45° F.
9.5” -75° F.
16.5” .5J0 ~,
9.5” -10° F.
9.5 -35° F.
9.5” -40° F.
9.5” + 5° F.
9.5” -10° F.
9.5” -25° F.
16.5” +15° F.
9.5” +150 F.
9.5” +15° F.
9.5” -20° F.
16.5” +20° F.
9.5” -10° F.
9,5” 0° F.
DEFLECTIONDEPTH AT FAILURESm 1[2 Ductile Value
-25° F.
-300 F.
+35° F.
-45° F.
-45° F.
-75° F.
-700 F,
-45° F.
-40° F.
-40° F.
-20° F.
-20° F.
-25° F.
-20° F.
0° F.
0° F.
-20° F.
-10° F.
-25° F.
-15° F.
-550 F.
-500 ~.
-400 ~,
-55° F.
-50° F,
-85° F.
-850 F.
-550 F,
-50° F.
-400 F,
-35° F.
-30° F.
-30° F,
-500 F.
-~50 F.
-30° F.
-300 F,
-30° F,
-35° F.
-200 F,
LATERALCONTRACTION
2%
-600 F.
-550 F.
-400 F.
-55° F.
-50° F.
-75° F.
-90° F.
-50° F.
-500 F.
-50° F.
-300 F,
-30° F.
.450 F.
-150 F.
-30° F,
-25° F.
-30° F.
-450 F.
-20° F.
*1’hese spectmens were split from 3-inch thick plates
-15-
TABLE 10. BAGSAR TEST RESVLTS ON ABS CLASS C STEEL - TEST SERIES.
TEST SERIES
PLATETHICK-NEss
1,,
1,,
1,,
1,,
~,,
~,,
2,,
~,,
~a,
~,,
3,,
TABLE 11,
SPECIMEN DEPTS
1 .5,!
3 “
6 ‘,(Standard)
~ t,
(Narrow Throat)
1 .5,,
~ ,,
~ ,,
(Standard)
6 ,’(Narrow Throat)
1 .5,’
~ ,,
~ ,,
(Standard)
50% SHE.4S
-25° F.
-2s0 F.
-30° F.
-25° F
+ 50 F,
+20” F.
+30° F.
+35° F,
+40° F.
+50° F,
+45” F
2% LATESALCONTSACTION
.500 F.
-45° F.
-70° F.
-70° F.
-400 F.
-55” F.
-55° F.
-60° F.
-45” F
DROP INMAXIMUM LOAD
.450 F.
-N” F.
-70° F,
-65° F.
-400 F,
-30° F.
-50” F.
-55° F.
RESULTS OF DROP-WEIGHT TESTS ON ABS CLASS C STEEL.
PLATE THICKNESS SPAN LSNGTS(inches) (inches)
3J4 6
314 9
314 12
1* 9
1*U
1*16
1.1/2 9
1.1/2 12
1-1/2 20
2*12
2* 16
p 20
3 12
●s9eci-ru preparedfrom31r.aew. 2
MDT
-20”F.
-400F.
-40° F .
-20”F.
-2@ F.
-200 5?.
+lOQ F.
o“ F.
-10° F.
+20° F
+200 F.
+100F.
+309 F
-16-
TABLE 12. VAN DER VEEN TEST TRANSITION TEMPERATURES FOR “T-1“ STEEL.
SERIES
112” P1. Std. ht.
1/2” P1. 1/2 ht.
112” PI. 114 ht.
3/4” P1. Std. ht.
314” P1. 1/2 ht.
3/4” P1. 1/4 ht.
1 “ P1. Std. ht.
1 “ PI. 1/2 ht.
1 “ P1. 1/4 ht.
2 “ P1. Std. ht.
2 “ P1. 1/2 ht.
2 “ P1. 114 ht.
SHSAR DEPTH 2% LATERAL CONTRACTION
Sm
-95° F.
-800 F.
.,~o F.
-75° F.
-65° F.
-40° F
-S50 F.
-90° F.
-50° F.
-35° F.
-15° F.
0° F.
50%
-650 F.
.750 F.
-70° F.
-60° F.
-600 F.
-40° F.
-60° F.
-80° F.
-50° F.
0° F.
-100 F.
0° F.
-1450 F.
-1450 F.
95° F.
-110° F.
90° F.
- 55° F.
-130° F.
-140° F.
65° F.
- goo F.
60° F
A first-order correction was auplied to the observed transition.-temperatures on the basis of deviations observed in the Charpy testresults. For fracture transition temperatures, the Charpy 50“shear criterion was used, and for ductility transition temperatures,the Charpy 15 mil lateral expansion criterion was used. The ad–justments applied to the data of Tables 9 to 12 for presentationin the figures were estiinated from Tables 7 and 8 as follows:
CORRECTION APPLIED
m THICKNSSS F’PACTURE TRANSITIONS DUCTILITY TSANS ITIONS
ABS Class C 3/4 inch -15 0?? -15°F(Heat 1) 1 +10 +15
1 1/2 o 02 0 0
3 0 0
“T-1” Steel 1/2 o 03/4 o 01 +40 +30
2 0 0
Except for the 1 inch “T-1” steel, these corrections could be
-17-
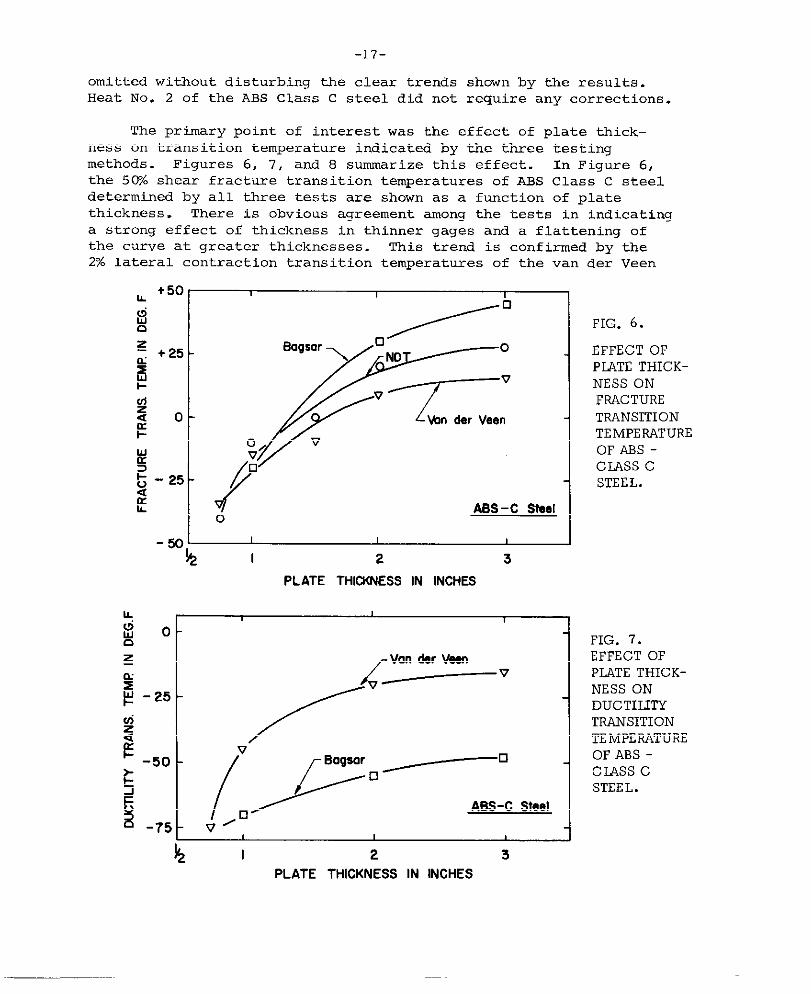
omitted without disturbing the clear trends shown by the results.Heat No. 2 of the ABS Class C steel did not require any corrections.
The primary point of interest was the effect of plate thick-
ness on transition temperature indicated by the ttiee testingmethods. Figures 6, 7, and 8 summarize this effect. In Figure 6,the 50?? shear fracture transition temperatures of ABS Class C steeldetermined by all three tests are shown as a function of platethickness. There is obvious agreement among the tests in indicatinga strong effect of thickness in thinner gages and a flattening ofthe curve at greater thicknesses. This trend is confirmed by the2% lateral contraction transition temperatures of the van der Veen
Wa31-0 -25a(rL I
./OBagsar
F
‘ “N%:
p
P“
[o
ABS–C Steal
k?l 2 3
PLATE THICKNESSIN INCHES
IA ,
W. -wn~ Van &r Vc.snu “—----”~ -25 -
tiz
/’
~-50 - /“pD/-.
ABS-C Steal
-75 - “0, 1
FIG. 6.
EFFECT OFPIATE THICK-
NESS ONFRACTURETRANSITIONTEMPERATUREOF ABS -CL4SS cSTEEL.
FIG. 7.EFFECT OFPJ.ATE THICK-NESS ONDUCTILITYTRANSITIONTEMPERATUREOF ABS -CIASS cSTEEL.
41 2 3
PLATE THICKNESS IN INCHES
-18-,
-1251
-150L
/
d~ion(50% SheOr)
~l”
.~”
{
oOuctility Tmnsition
(2% Lateml Contmction)
/o
T- I STEEL
o I 2
PLATE THICKNESS IN INCHES
FIG. 8. EFFECT OF PLATE THICKNESS ON THE TRANSITION TEMPERATURES OF
“T-l” STEEL IN THE VAN DER VEEN TEST.
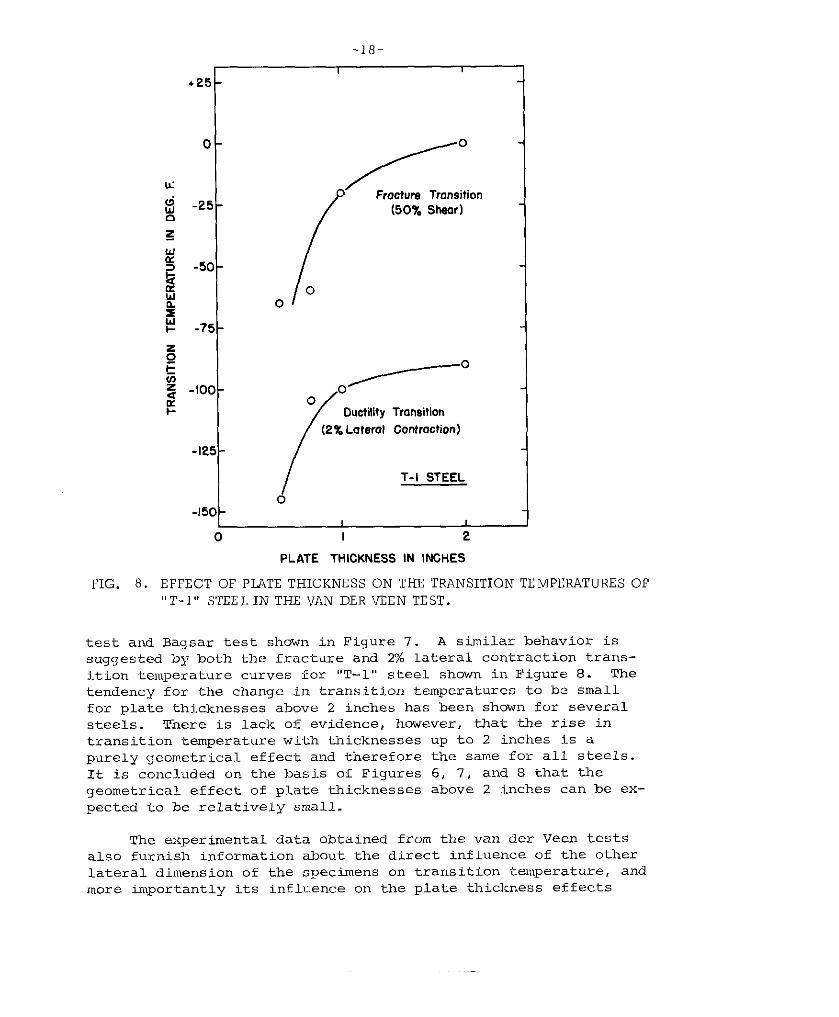
test and Bagsar test shown in Figure 7. A similar behavior issuggested by both the fracture and 2Y. Lateral contraction trans-
ition temperature curves for “T-l” steel shown in Figure 8. Thetendency for the change in transition temperatures to be smallfor plate thicknesses above 2 inches has been shown for severalsteels. There is lack of evidence, however, that the rise in
transition temperature with thicknesses up to 2 inches is apurely geometrical effeet and therefore the same for all steels.It is concluded on the basis of Figures 6, 7, and 8 ‘chat thegeometrical effect of plate thicknesses above 2 inches can be ex-pected to be relatively small.
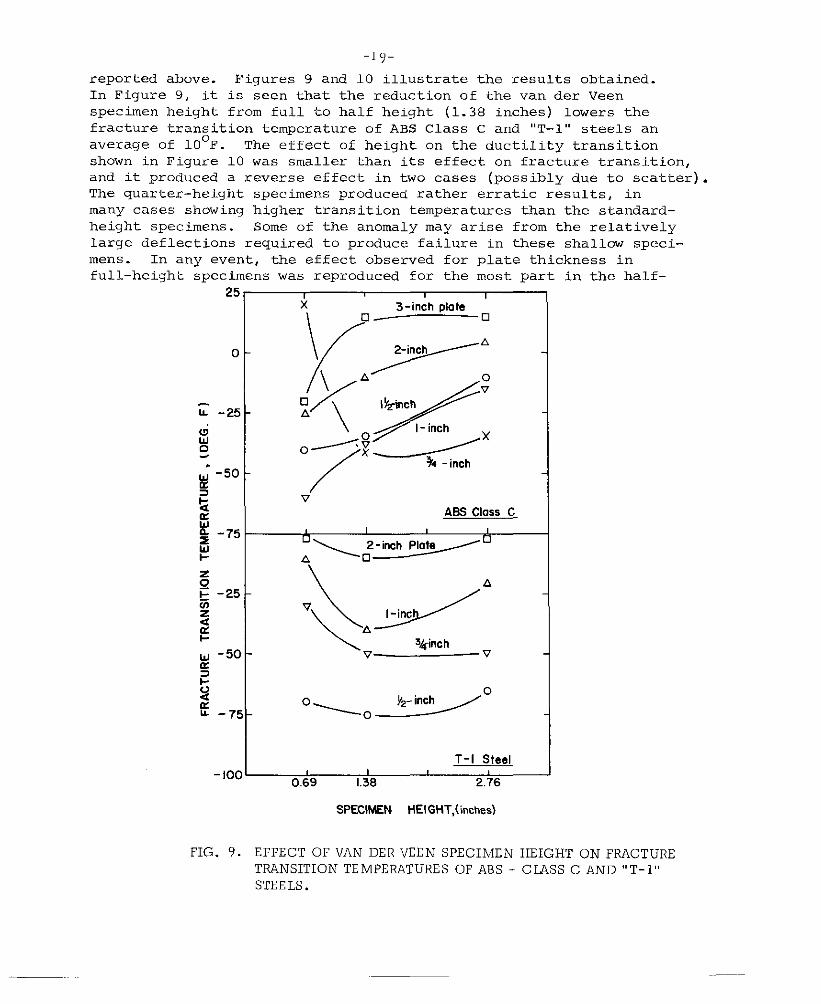
The experimental data obtained from the van der Veen testsalso furnish information about the direct influence of the otherlateral dimension of the specimens on transition temperature, andmore importantly its influence on the plate thickness effects
-19-
reported above. Figures 9 and 10 illustrate the results obtained.In Figure 9, it is seen that the reduction of the van der Veenspecimen height from full to half height (1.38 inches) lowers the
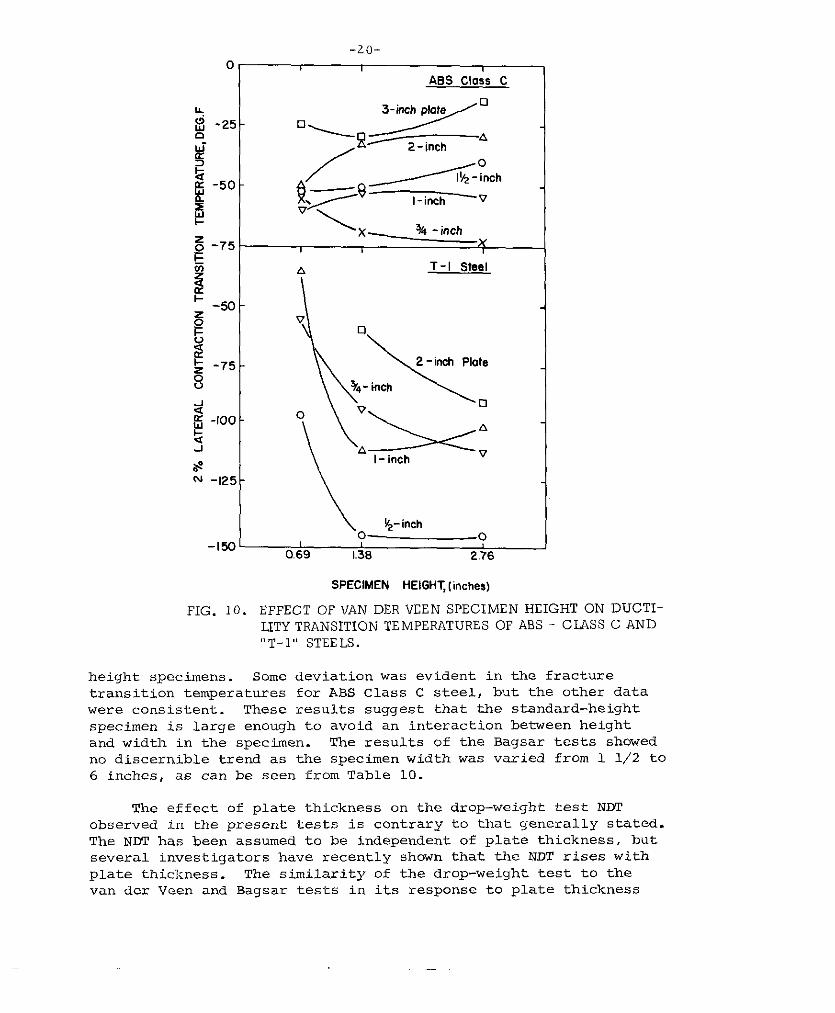
fracture transition temperature of ABS Class C and “T-1” steels anaverage of 10°F. The effect of height on the ductility transitionshown in Figure 10 was smaller than its effect on fracture transition,and it produced a reverse effect in two cases (possibly due to scatter) .The quarter-height specimens produced rather erratic results, inmany cases showing higher transition temperatures than the standard-
height specimens. Some of the anomaly may arise from the relatively
large deflections required to produce failure in these shallow speci-mens. In any event, the effect observed for plate thickness infull-height specimens was reproduced for the most part in the half-
FIG. 9.
v’ABS class C
,&A/A%&inch
v v
IT-1 Steel
,0.69 1.38 2.76
SPECIMEN HEIGHT.( inches)
EFFECT OF VAN DER vEEN SPECIMEN HEIGHT ON FRACTURE
TRANSITION TEMPERATURES OF ABS - CIASS C AND “T-1“STEELS.
-zo-0 1 ,
ABS Class C
\. ~-imh ~
-150 10.69 1.38 2.76
SPECIMEN HEIGHT [inches)
FIG. 10. EFFECT OF VAN DER VEEN SPECIMEN HEIGHT ON DUCTI-
LITY TRANSITION TEMPERATURES OF ABS - CLASS C AND“T-l” STEELS.
height specimens. Some deviation was evident in the fracture
transition temperatures for ABS Class C steel, but the other datawere consistent. These results suggest that the standard-height
specimen is large enough to avoid an interaction between heightand width in the specimen. The results of the Bagsar tests showed
no discernible trend as the specimen width was varied from 1 1/2 to6 inches, as can be seen from Table 10.
The effect of plate thickness on the drop-weight test NETobserved in the present tests is contrary to that generally stated.The NDT has been assumed to be independent of plate thickness, but
several investigators have recently shown that the NDT rises withplate thickness. The similarity of the drop-weight test to thevan der Veen and Bagsar tests in its response to plate thickness
-21-
is more useful and comprehendible to the investigator than wouldbe a total insensitivity to thickness.
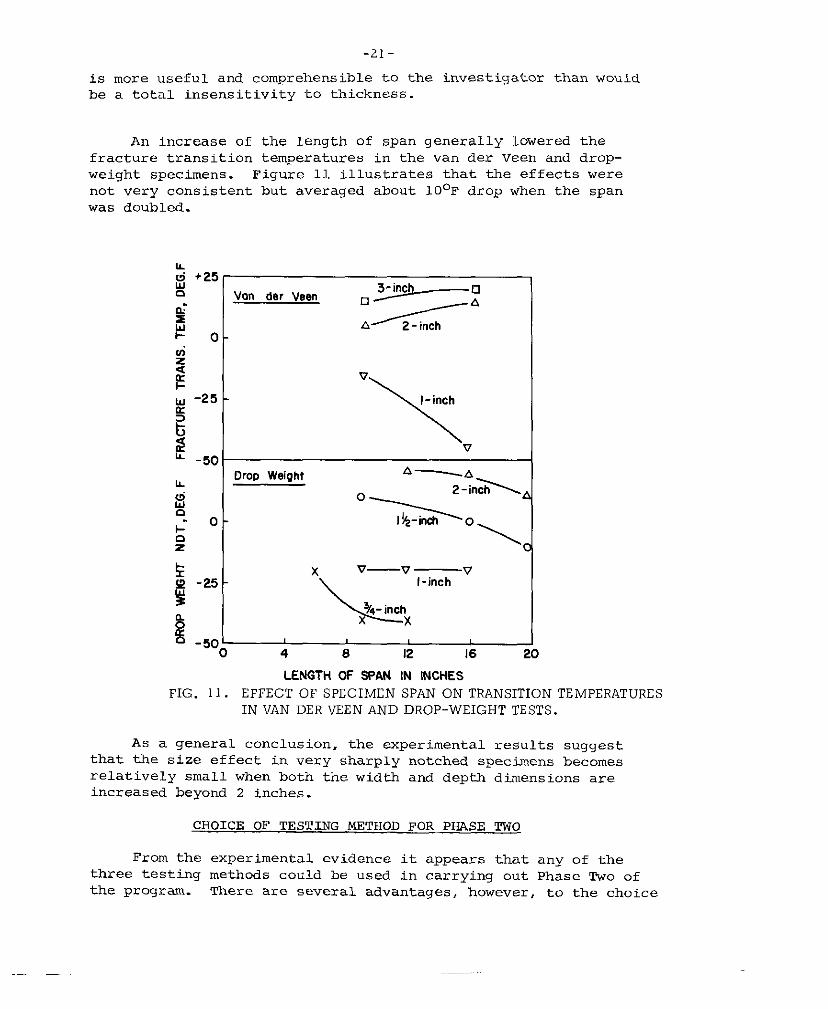
An increase of the length of span generally lowered thefracture transition temperatures in the van der Veen and drop-weight specimens. Figure 11 illustrates that the effects werenot very cons istent but averaged about 10°F drop when the span
was doubled.
$0llizaK1-
ii -50
Van tierVeen3-inc
v
\
l-inch
v
13r0p Weight A—A
2-inh,
‘>0
\,
x v —v —v
\
l-inch
~%- inchx
4 8 12 16 2
LENGTH OF SPAN IN INCHES
FIG. 11. EFFECT OF SPECIMEN SPAN ON TRANSITION TEMPERATURESIN VAN DER VEEN AND DROP-WEIGHT TESTS.
As a general conclusion, the experimental results suggestthat the size effect in very sharply notched specimens becomesrelatively small when both the width and depth dimensions areincreased beyond 2 inches.
CHOICE OF TESTING METHOD FOR PHASE TWO
From the experimental evidence it appears that any of thethree testing methods could be used in carrying out Phase Two of
the program. There are several advantages, however, to the choice
-22-
of the van der Veen test for this purpose. First, it can be ap-
plied to thicknesses up to 4 inches without requiring specialtesting equipment other than readily available universal testing
machines. Secondly, it permits the use of a variety of criteria
of transition temperature to assess the merits of steel compositionsand heat treatments. Third, it is free of the interfering actionof the welding heat-affected zone which sometimes produces spurioustransit ion temperatures in the drop-weight test.
It is therefore planned to adopt the van der Veen test asthe primary testing method for the second phase of the investi-gation.
SUMMARY
The results of the investigation can be summarized as follows:
1. The van der Veen test, the Bagsar test, and the drop-weighttest showed general agresment in their response to changes in platethickness ranging from 3/4 to 3 inches.
2. The dimensional effect of plate thickness, with metal-lurgical variables held constant, was to raise the transitiontemperature markedly as the plate thickness was increased from1/2 to 1 l/2 inches. Above 2 inches, thickness appeared to havemuch less effect on the transition temperature observed in thesesharply-notched specimens. ABs Class C and “T-1” steels behaved
similarly in this respect.
3. In the presence of a severe notch, specimen widths andheights of 2 inches or greater appear adequate to determine thesensitivity of heavy-section steel plate to brittle fracture.
4. The van der Veen specimen is recommended as the testingmethod for the second phase of the program because of itstesting convenience and its suitability for determining transitiontemperatures by a variety of criteria.
1.
2.
3.
4.
5.
6.
7.
8.
9.
10.
11.
12.
Parker, E.R. , “Brittle Behavior of Engineering Structures”323p John Wiley and.Sons 1957. See Chapter VII.
Canonico, D.A. , Kait.camp, E.H. , and Stout, R.D. , “AcceleratedCooling of Carbon Steels for Pressure Vessels” Welding JournalVol. 40, No. 9, P@OOs-404s 1961
Philpot, H.P. , “The Dimensional Problem and the Significance ofthe I?otched Bar Test” Engineering Vol. 118 p286 1924
Docherty, J.G. , “Slow Bending Tests on Large i~otched Bars ‘aEngineeri~ Vol. 1.39, pp211-213 1935
Akita, Y. , “Scale E?fects in Notch Brittleness” Welding JournalVol. 32 No. 9 PP475s-480s 1953
Holliday, W.C. , Discussion of “Service Experience of BrittleFracture’” by G.N. Boyd. Report P-3 of A&miraity AdvisoryCommittee on Structural Steel pp26-34 1959
Epstein, S., “Optimum Composition of Steel Plate Over 1%-inchThick” Report to Ship Steel Committee Project SR-152February 26, 1963
Agnew, S.A., and Stout, R.D. , “Evaluation Oi ?late ThicknessEffects on Notch Toughness” Welding Journal Vol. 41, No. 4PP154s-159s 1962
Tipper, C.F. , “The Brittle Fracture Story” 196P CambridqeUriiversity Press 1962
van der Veen, J.K., “Symposiam onRelation to Welded Construction”1953
Bagsar, A.B. , “Cleavac~e Fractures
Notch-Bar Testing and its
Institute oi Welding P35
and Transition Temperatures otMild Steels” The Weiding Journal Vol. 27 No. 3 pp133s-131s1948
Puzalc,P.P. and Pellini, W.S. , “Standard Method for NRL Drop-Weight Test”, U.S. Naval Reeearch Laboratory Report No. 5831,&u~uSt 21, 1962
SHIP HULL P3SEARCH COMMITTEE
Division Of Engineering & Industrial ResearchNational Academy of Sciences-National Research Council
Chairman:
Members:
RADM A. G. Mumma, USN (Ret. )Vice PresidentWorthington Corporation
Mr. Hollinshead de LuteAssistant to Vice PresidentBethlehem Steel Co. Shipbuilding Div.
P1ofessor J. Harvey EvansProfessor of Naval ArchitectureMassachusetts Institute of Technology
Mr. M. G. ForrestVice President - Naval ArchitectureGibbs & Cox, Inc.
Mr. James GoodrichGeneral ManagerTodd Shipyards, Los Angeles Div.
Professor N. J. HoffHead, Dept. of Aeronautics & AstronauticsStanford University
Mr. M. W. LightnerVice President, Applied ResearchU. S Steel Corporation
Dr. J. R. Low, Jr.Metallurgy & Ceramics Research Dept.General Electric Research Laboratory
Arthur R. Lytle R. W. RumkeDirector Executive Secretary