Embed Size (px)
Citation preview
17
AbstractOne of the common issues that arises in abrasive machin-
ing is the inconsistency of the surface roughness within thesame batch and under identical machining conditions.Recent advances in engineered abrasives have allowedreplacement of the random arrangement of minerals on con-ventional belts with precisely shaped structures uniformlycast directly onto a backing material. This allows for abrasivebelts that are more deterministic in shape, size, distribution,orientation, and composition. A computer model based onknown tooling geometry was developed to approximate theasymptotic surface profile that was achievable under specif-ic loading conditions. Outputs included the theoretical sur-face parameters, Rq, Ra, Rv, Rp, Rt, and Rsk. Experimental val-idation was performed with a custom-made abrader appara-tus and using engineered abrasives on highly polished alu-minum samples. Interferometric microscopy was used inassessing the surface roughness. Results include the indi-vidual effects of pyramid base width, pyramid height, attackangle, and indentation depth on the surface descriptors.
Keywords: Engineered Abrasives, Geometric ComputerModel, Surface Roughness, Surface Generation,Abrasive Machining
IntroductionSome abrasives occur in nature (flint, garnet, etc.),
and some are man-made (aluminum oxide, siliconcarbide, zirconia, CBN, and so on). Until now, mostcoated abrasive tools have consisted of single ormultiple layers of oriented grits of approximately thesame size that are attached to a substrate. The size ofthe particles used on coated abrasives is establishedby sifting the crushed grits through screens of stan-dard mesh (NBS), by sedimentation, or by air flota-tion. The application of the abrasive grits to the beltbacking is either achieved through gravity or elec-trode-induced polarization. This traditional manu-facturing practice, however, yields an abrasive beltthat presents variations in grit size, shape, distribu-tion, and orientation. Moreover, the geometry of thecutting grits changes from particle to particle, mak-ing it impossible to know, for instance, the rake orattack angle for any given grit or cut.
The task of modeling the interaction of the gritand the surface of the part in an abrasive machiningprocess has been attempted in several ways by pre-vious researchers (Torrance 1987; Bahin 1987; Linet al. 1996a, 1996b; Li and Liao 1997; Abede andAppl 1988; Dornfeld 1981; Buttery and Hamed1977, 1978). The random size, shape, and relativeplacement of abrasive particles on the sandpaper hasalways presented a difficult problem to attack froma process modeling standpoint. Using statistical dis-tributions of particle size and making assumptionsabout particle shape and relative placement on thesubstrate have allowed some researchers to estimateoverall process results based on process parameters(Torrance 1987; Li and Liao 1997). This method,which is probabilistic in nature rather than deter-ministic, has typically served as a basis for a corre-lation of predicted and actual results. Another com-mon approach to abrasive process modeling hasbeen the single-grit approach (Abede and Appl1988; Dornfeld 1981; Buttery and Hamed 1977; Linet al. 1996b). This method seeks to deterministical-ly model the interaction of a single abrasive grit andthe surface of the part. Major contributions to the lit-erature have been made via this modeling methodespecially with regard to the ploughing phenomenonand elastic/plastic effects (Abede and Appl 1988;Dornfeld 1981; Lin et al. 1996b; Buttery and Hamed1978). The major shortcoming of this method is thelack of interaction of the multiple abrasive grits onthe surface of the part. The actual abrasive process isthe sum total of many single abrasive grits of differ-ent sizes and shapes and their effect on the surface.
Recent advances in manufacturing processes haveallowed replacement of the random arrangement ofminerals on conventional belts by a patented tech-nology called microreplication. The technology is aspin-off of work that was originally used in the man-ufacturing of reflectors. Since the original develop-ment by 3M, other companies have also produced
Journal of Manufacturing ProcessesVol. 7/No. 1
2005
Geometric Modeling of Engineered Abrasive ProcessesAndres L. Carrano and James B. Taylor, Dept. of Industrial and Systems Engineering, Rochester Institute of Technology, Rochester, New York, USA
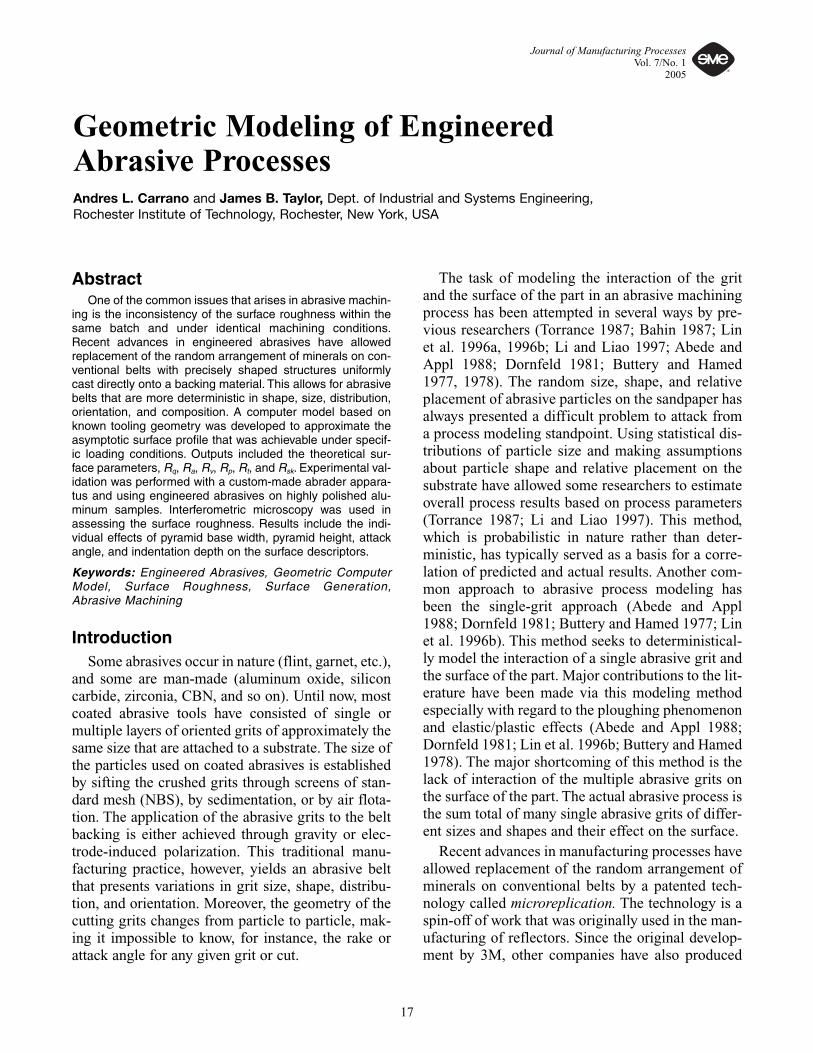
their own engineered abrasives in similar manners(Mason 1999; Norton 2000). To date, engineeredabrasives have been targeted at the much larger met-als market, but interest has been shown from thewood and composites markets. As defined by 3M(1997), microreplication is the science of creatingsmall, precisely shaped, three-dimensional structuresand reproducing them on a variety of surfaces. Thebelt’s surface, in this case, consists of pyramidal struc-tures containing micron-graded minerals that are uni-formly applied to a backing material (see Figure 1).
This development has been around for severalyears, but it was not until recently that commercialfabrication of belts became feasible. This new genreof abrasive tools is usually referred to as engineeredor structured abrasives. They consist of abrasivebelts that are more deterministic than the traditionalcounterpart: the shape, size, distribution, and orien-tation of the cutting grits are known and controlled.This provides a very even distribution of mineraland yields a more consistent rate of cut and surfacefinish. The motivation for pursuing such abrasiveslies in the idea that, by removing variation in the gritgeometry, it is possible to remove variation in thefinish quality. However, a better understanding ofthe impact of the individual geometric features ofthe abrasive on the surface roughness is required asa basis for proposing an optimized geometry and forassessing the degree of performance improvement.It is believed that the future of abrasive-basedmachining is in microengineered belt patterns andthat further job-based customization of these pat-
terns will be a future step. Optimization of the resul-tant workpiece surface and machining parameterswill also be possible.
The main objective of this research was to devel-op and validate a 3-D computer-based model thatwould help in understanding the impact of the indi-vidual geometric features of the grit on the surfaceroughness of the workpiece. To date, most geomet-ric models of abrasive processes have been devel-oped based on a single-grit tooling supposition(Abede and Appl 1988; Dornfeld 1981; Butteryand Hamed 1977; Lin et al. 1996b; Oxley 1997),thus neglecting interactions between grits (multi-ple-pass effect), or consisted of theoretical approx-imations due to unknown geometry (Torrance1987; Li and Liao 1997, Mulhearn and Samuels1962). These are assumptions that simplify themodels but also make them somewhat unrealisticand provide no basis for optimization. The modeldeveloped here was based on a pyramid-shapedabrasive grit, incorporated the effect of multiplepasses, and was validated on commercially avail-able products. Other literature relevant to abrasiveprocess modeling is included for reference (Gahlinand Jacobson 1999; Komanduri 1971; Larsen-Badse 1968; Sin, Sada, and Suh 1979).
Once the model was developed and validated, asecond objective was to search for a better under-standing of the individual geometric features andtheir impact on the final quality. Three main parame-ters were investigated: the attack angle of the belt, thepyramid width, and the pyramid height. These are thefeatures that could potentially be changed during themanufacture of this abrasive. The other inputs to themodel were: the amount of indentation (a function ofthe load applied), the sampling resolution (a functionof the instrumentation), the number of grits/row, andthe number of rows. Notice that some of these areartificial variables that arise because of the finitenature of the model (such as the number of grits andnumber of rows in the abrasive matrix) or variablesthat are not under control by the abrasive manufac-turer (amount of grit indentation).
MethodologyThe basic idea is to develop a geometric comput-
er model that would parametrically represent thetooling and workpiece, as well as to calculate thesurface descriptors that result from the interaction
18
Journal of Manufacturing ProcessesVol. 7/No. 12005
Figure 1Pyramidal-Shaped Engineered Abrasive
between these. A matrix with several grits per rowand several rows, one after the other, was generatedin a computer program. Because this abrasive tool-ing allows for perfectly known geometry, it is thenpossible to define the geometry as a function of basewidth and height of the pyramid. Rake and attackangle can be calculated from the design geometrybut are also a function of the width and height. Byknowing the pyramid orientation with respect to thefeed direction, the offset between rows and columnsof pyramids, and the depth of indentation into theworkpiece (as a function of the applied pressure), itwas possible to approximate the resultant 2-D sur-face profile after n rows of grits have performed acut. The model assumed that the entire volume ofmaterial displaced in the workpiece by the tool waseffectively the volume removed. This equates to 100percent efficiency in the removal of material(Samuels 1978). Proportionality between theamount of indentation of the grits into the workpieceand the pressure applied was assumed.
Geometric Computer ModelingThe computer model was developed to be a fully
parametric tool that allows for changes in the follow-ing features: height and base width of pyramid, num-ber of grits per row, total number of rows, and depthof grit indentation into the workpiece. The outputsobtained from this include the arithmetic averageroughness (Ra), rms roughness (Rq), maximum profilevalley depth (Rv), maximum profile peak height (Rp),maximum peak-to valley (Rt), and skewness (Rsk)coefficients. A program was developed and written inMatlab® to perform the aforementioned calculationsas well as to graphically represent these conditions.Figure 2 represents the abrasive grits as a two-dimen-sional matrix of pyramidal elements.
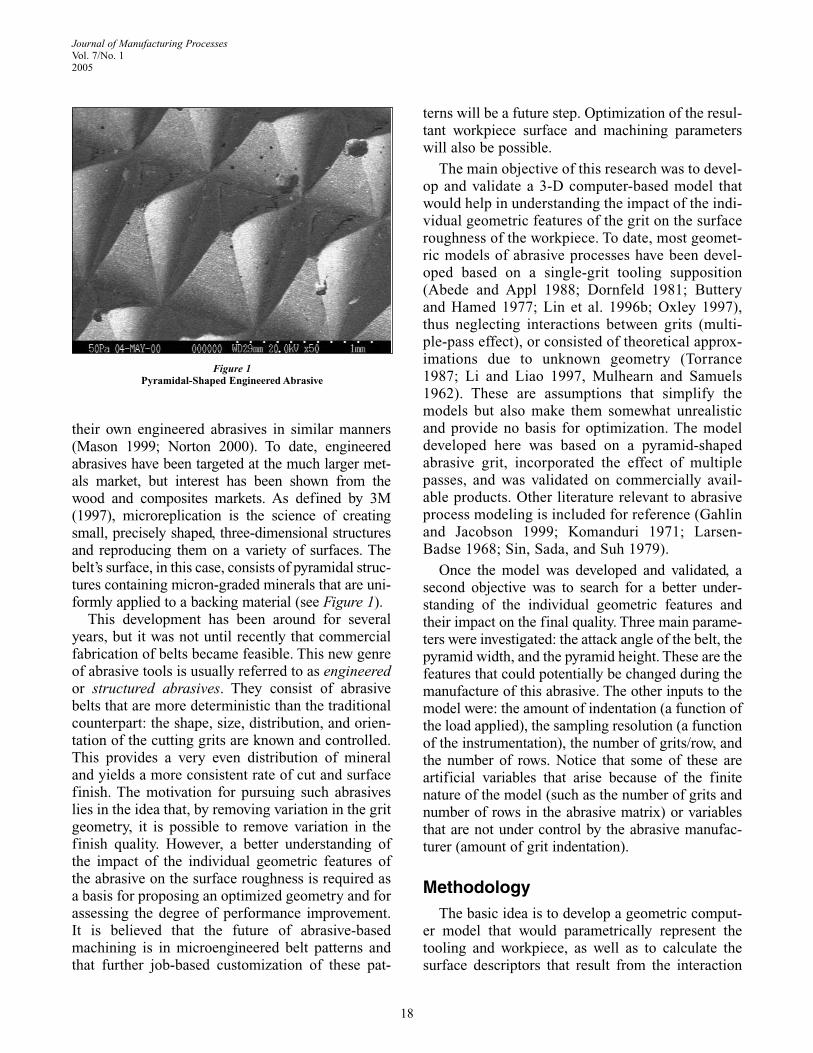
Every square in Figure 2 represents the projectiononto the X-Y plane of a four-sided pyramidal grit.This can be specified in the program by entering anynumber of grits per row (N), any number of totalrows (M), and the base width (a). By selecting theappropriate pyramid height (h), it is then possible tocompletely define the pyramid geometry. The rakeangle was given by the parameters a and h alongwith the orientation of the pyramid with respect tothe feed direction. For any given orientation, therake angle was contained in the following interval:
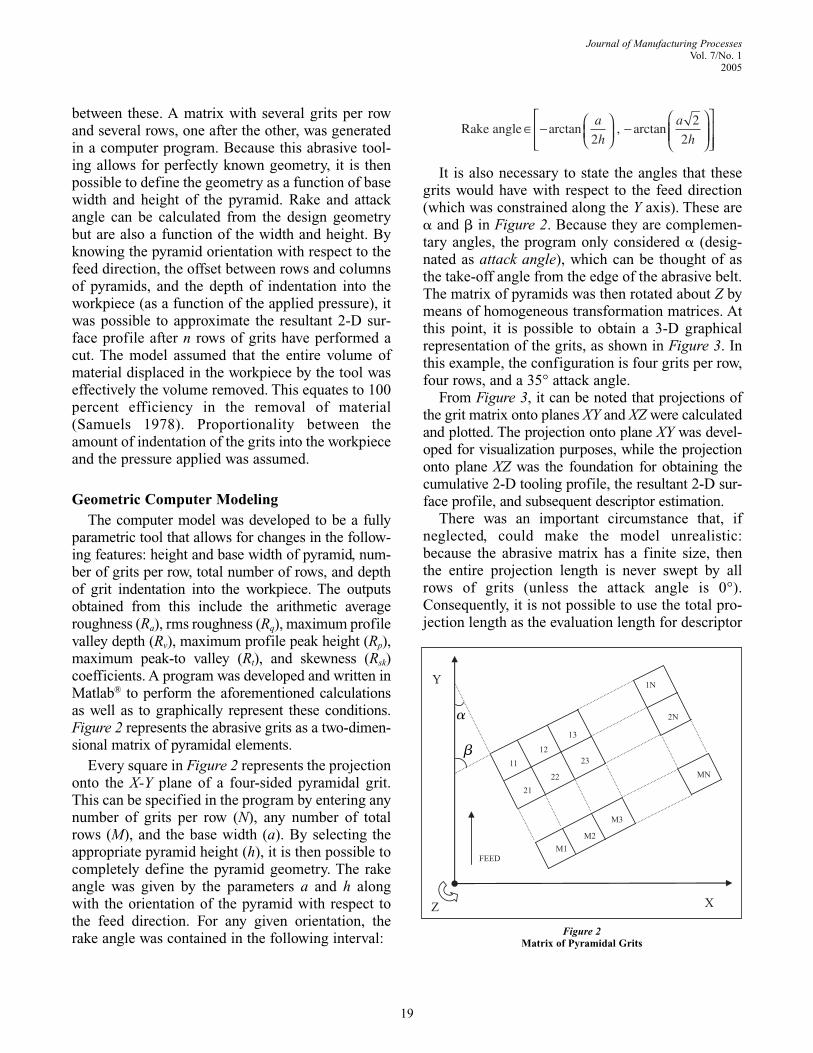
It is also necessary to state the angles that thesegrits would have with respect to the feed direction(which was constrained along the Y axis). These are� and � in Figure 2. Because they are complemen-tary angles, the program only considered � (desig-nated as attack angle), which can be thought of asthe take-off angle from the edge of the abrasive belt.The matrix of pyramids was then rotated about Z bymeans of homogeneous transformation matrices. Atthis point, it is possible to obtain a 3-D graphicalrepresentation of the grits, as shown in Figure 3. Inthis example, the configuration is four grits per row,four rows, and a 35° attack angle.
From Figure 3, it can be noted that projections ofthe grit matrix onto planes XY and XZ were calculatedand plotted. The projection onto plane XY was devel-oped for visualization purposes, while the projectiononto plane XZ was the foundation for obtaining thecumulative 2-D tooling profile, the resultant 2-D sur-face profile, and subsequent descriptor estimation.
There was an important circumstance that, ifneglected, could make the model unrealistic:because the abrasive matrix has a finite size, thenthe entire projection length is never swept by allrows of grits (unless the attack angle is 0°).Consequently, it is not possible to use the total pro-jection length as the evaluation length for descriptor
19
Journal of Manufacturing ProcessesVol. 7/No. 1
2005
Figure 2Matrix of Pyramidal Grits
�
�
calculation. Figure 4 depicts this situation. An algo-rithm was developed that, for any geometric config-uration, would calculate the left-most vertices (orclosest to the Y axis) from the first grit on the lastrow [this is grit (M,1)] and the right-most vertices(or farthest from Y axis) from the last grit in the firstrow [or grit (1,N)]. These vertices determined theactual length that is swept by all rows present in theconfiguration and was the length used for thedescriptor estimation.
Once the projection onto the XZ plane was
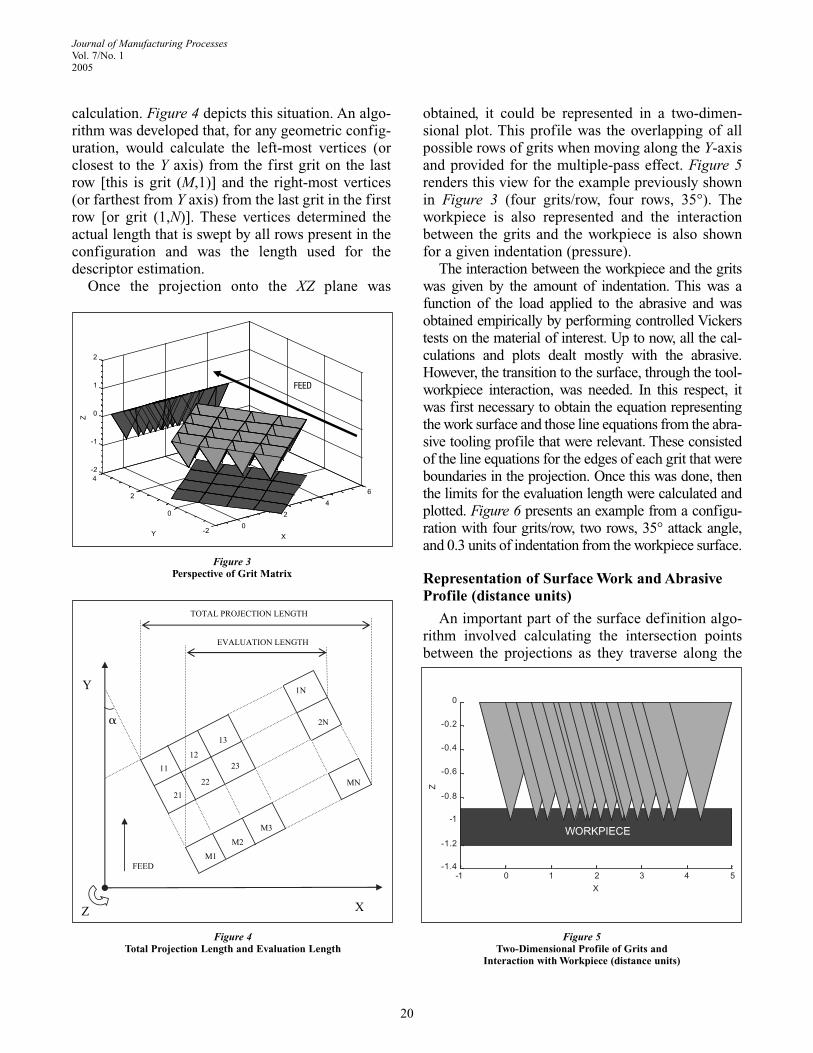
obtained, it could be represented in a two-dimen-sional plot. This profile was the overlapping of allpossible rows of grits when moving along the Y-axisand provided for the multiple-pass effect. Figure 5renders this view for the example previously shownin Figure 3 (four grits/row, four rows, 35°). Theworkpiece is also represented and the interactionbetween the grits and the workpiece is also shownfor a given indentation (pressure).
The interaction between the workpiece and the gritswas given by the amount of indentation. This was afunction of the load applied to the abrasive and wasobtained empirically by performing controlled Vickerstests on the material of interest. Up to now, all the cal-culations and plots dealt mostly with the abrasive.However, the transition to the surface, through the tool-workpiece interaction, was needed. In this respect, itwas first necessary to obtain the equation representingthe work surface and those line equations from the abra-sive tooling profile that were relevant. These consistedof the line equations for the edges of each grit that wereboundaries in the projection. Once this was done, thenthe limits for the evaluation length were calculated andplotted. Figure 6 presents an example from a configu-ration with four grits/row, two rows, 35° attack angle,and 0.3 units of indentation from the workpiece surface.
Representation of Surface Work and AbrasiveProfile (distance units)
An important part of the surface definition algo-rithm involved calculating the intersection pointsbetween the projections as they traverse along the
20
Journal of Manufacturing ProcessesVol. 7/No. 12005
Figure 3Perspective of Grit Matrix
Figure 4Total Projection Length and Evaluation Length
Figure 5Two-Dimensional Profile of Grits and
Interaction with Workpiece (distance units)
FEED
�
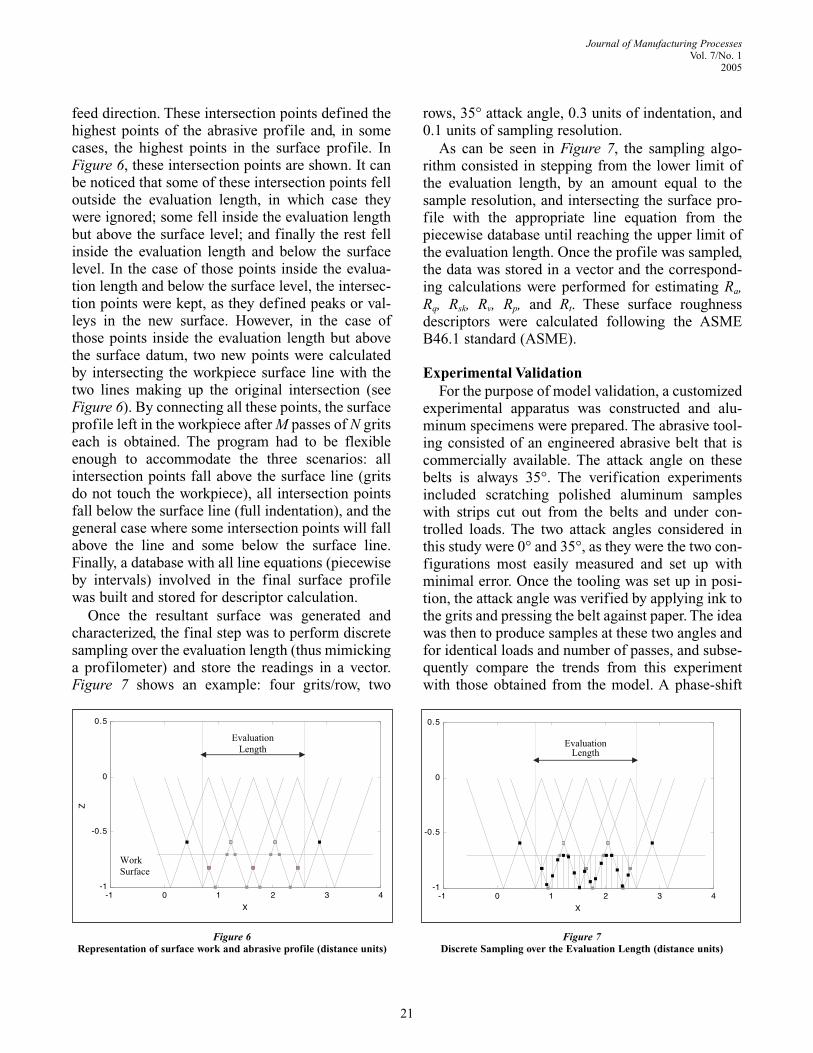
feed direction. These intersection points defined thehighest points of the abrasive profile and, in somecases, the highest points in the surface profile. InFigure 6, these intersection points are shown. It canbe noticed that some of these intersection points felloutside the evaluation length, in which case theywere ignored; some fell inside the evaluation lengthbut above the surface level; and finally the rest fellinside the evaluation length and below the surfacelevel. In the case of those points inside the evalua-tion length and below the surface level, the intersec-tion points were kept, as they defined peaks or val-leys in the new surface. However, in the case ofthose points inside the evaluation length but abovethe surface datum, two new points were calculatedby intersecting the workpiece surface line with thetwo lines making up the original intersection (seeFigure 6). By connecting all these points, the surfaceprofile left in the workpiece after M passes of N gritseach is obtained. The program had to be flexibleenough to accommodate the three scenarios: allintersection points fall above the surface line (gritsdo not touch the workpiece), all intersection pointsfall below the surface line (full indentation), and thegeneral case where some intersection points will fallabove the line and some below the surface line.Finally, a database with all line equations (piecewiseby intervals) involved in the final surface profilewas built and stored for descriptor calculation.
Once the resultant surface was generated andcharacterized, the final step was to perform discretesampling over the evaluation length (thus mimickinga profilometer) and store the readings in a vector.Figure 7 shows an example: four grits/row, two
rows, 35° attack angle, 0.3 units of indentation, and0.1 units of sampling resolution.
As can be seen in Figure 7, the sampling algo-rithm consisted in stepping from the lower limit ofthe evaluation length, by an amount equal to thesample resolution, and intersecting the surface pro-file with the appropriate line equation from thepiecewise database until reaching the upper limit ofthe evaluation length. Once the profile was sampled,the data was stored in a vector and the correspond-ing calculations were performed for estimating Ra,Rq, Rsk, Rv, Rp, and Rt. These surface roughnessdescriptors were calculated following the ASMEB46.1 standard (ASME).
Experimental ValidationFor the purpose of model validation, a customized
experimental apparatus was constructed and alu-minum specimens were prepared. The abrasive tool-ing consisted of an engineered abrasive belt that iscommercially available. The attack angle on thesebelts is always 35°. The verification experimentsincluded scratching polished aluminum sampleswith strips cut out from the belts and under con-trolled loads. The two attack angles considered inthis study were 0° and 35°, as they were the two con-figurations most easily measured and set up withminimal error. Once the tooling was set up in posi-tion, the attack angle was verified by applying ink tothe grits and pressing the belt against paper. The ideawas then to produce samples at these two angles andfor identical loads and number of passes, and subse-quently compare the trends from this experimentwith those obtained from the model. A phase-shift
21
Journal of Manufacturing ProcessesVol. 7/No. 1
2005
Figure 7Discrete Sampling over the Evaluation Length (distance units)
Figure 6Representation of surface work and abrasive profile (distance units)
interferometric microscope (wavelength 550 nm)was used to assess the surface topography anddescriptors. The area of sampling was 500 µm × 500µm. The CRT resolution was 480 pixels × 480 pix-els. The output from the interferometric microscopeincluded 3-D maps, intensity maps, 2-D traces, aswell as area averaging and 2-D descriptors.
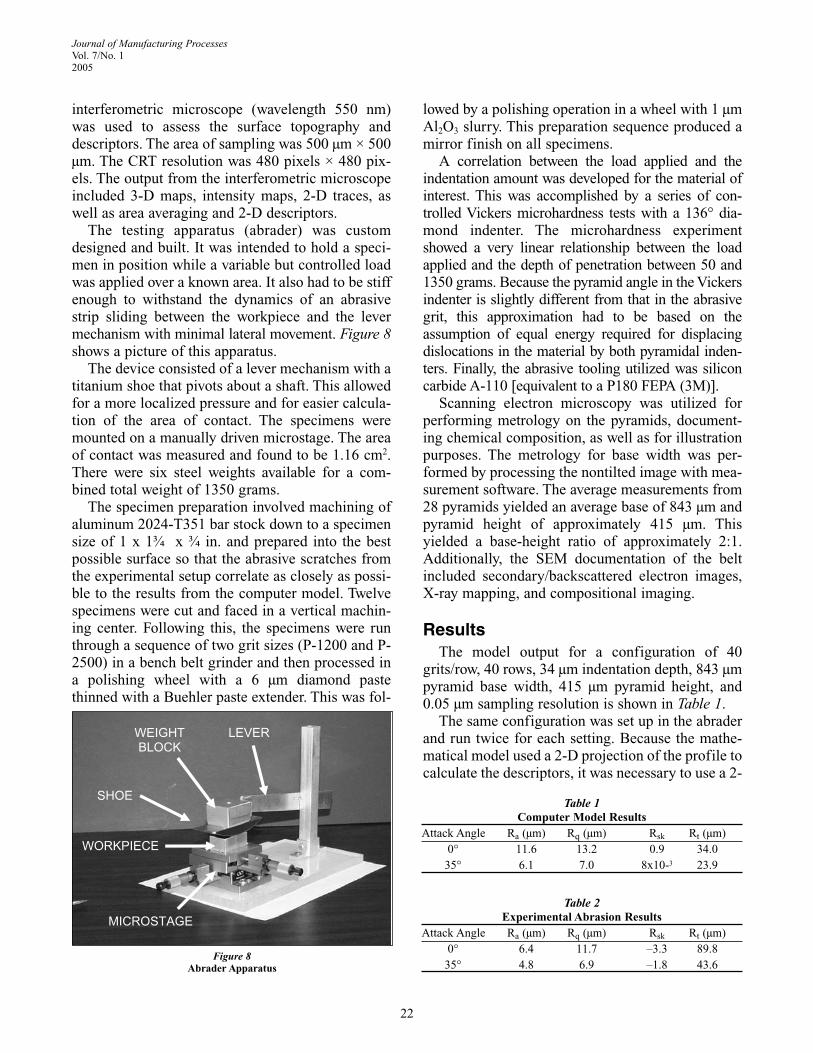
The testing apparatus (abrader) was customdesigned and built. It was intended to hold a speci-men in position while a variable but controlled loadwas applied over a known area. It also had to be stiffenough to withstand the dynamics of an abrasivestrip sliding between the workpiece and the levermechanism with minimal lateral movement. Figure 8shows a picture of this apparatus.
The device consisted of a lever mechanism with atitanium shoe that pivots about a shaft. This allowedfor a more localized pressure and for easier calcula-tion of the area of contact. The specimens weremounted on a manually driven microstage. The areaof contact was measured and found to be 1.16 cm2.There were six steel weights available for a com-bined total weight of 1350 grams.
The specimen preparation involved machining ofaluminum 2024-T351 bar stock down to a specimensize of 1 x 1¾ x ¾ in. and prepared into the bestpossible surface so that the abrasive scratches fromthe experimental setup correlate as closely as possi-ble to the results from the computer model. Twelvespecimens were cut and faced in a vertical machin-ing center. Following this, the specimens were runthrough a sequence of two grit sizes (P-1200 and P-2500) in a bench belt grinder and then processed ina polishing wheel with a 6 µm diamond pastethinned with a Buehler paste extender. This was fol-
lowed by a polishing operation in a wheel with 1 µmAl2O3 slurry. This preparation sequence produced amirror finish on all specimens.
A correlation between the load applied and theindentation amount was developed for the material ofinterest. This was accomplished by a series of con-trolled Vickers microhardness tests with a 136° dia-mond indenter. The microhardness experimentshowed a very linear relationship between the loadapplied and the depth of penetration between 50 and1350 grams. Because the pyramid angle in the Vickersindenter is slightly different from that in the abrasivegrit, this approximation had to be based on theassumption of equal energy required for displacingdislocations in the material by both pyramidal inden-ters. Finally, the abrasive tooling utilized was siliconcarbide A-110 [equivalent to a P180 FEPA (3M)].
Scanning electron microscopy was utilized forperforming metrology on the pyramids, document-ing chemical composition, as well as for illustrationpurposes. The metrology for base width was per-formed by processing the nontilted image with mea-surement software. The average measurements from28 pyramids yielded an average base of 843 µm andpyramid height of approximately 415 µm. Thisyielded a base-height ratio of approximately 2:1.Additionally, the SEM documentation of the beltincluded secondary/backscattered electron images,X-ray mapping, and compositional imaging.
ResultsThe model output for a configuration of 40
grits/row, 40 rows, 34 µm indentation depth, 843 µmpyramid base width, 415 µm pyramid height, and0.05 µm sampling resolution is shown in Table 1.
The same configuration was set up in the abraderand run twice for each setting. Because the mathe-matical model used a 2-D projection of the profile tocalculate the descriptors, it was necessary to use a 2-
22
Journal of Manufacturing ProcessesVol. 7/No. 12005
Figure 8Abrader Apparatus
Table 1Computer Model Results
Attack Angle Ra (µm) Rq (µm) Rsk Rt (µm)0° 11.6 13.2 0.9 34.0
35° 6.1 7.0 8x10⁻³ 23.9
Table 2Experimental Abrasion Results
Attack Angle Ra (µm) Rq (µm) Rsk Rt (µm)0° 6.4 11.7 –3.3 89.8
35° 4.8 6.9 –1.8 43.6
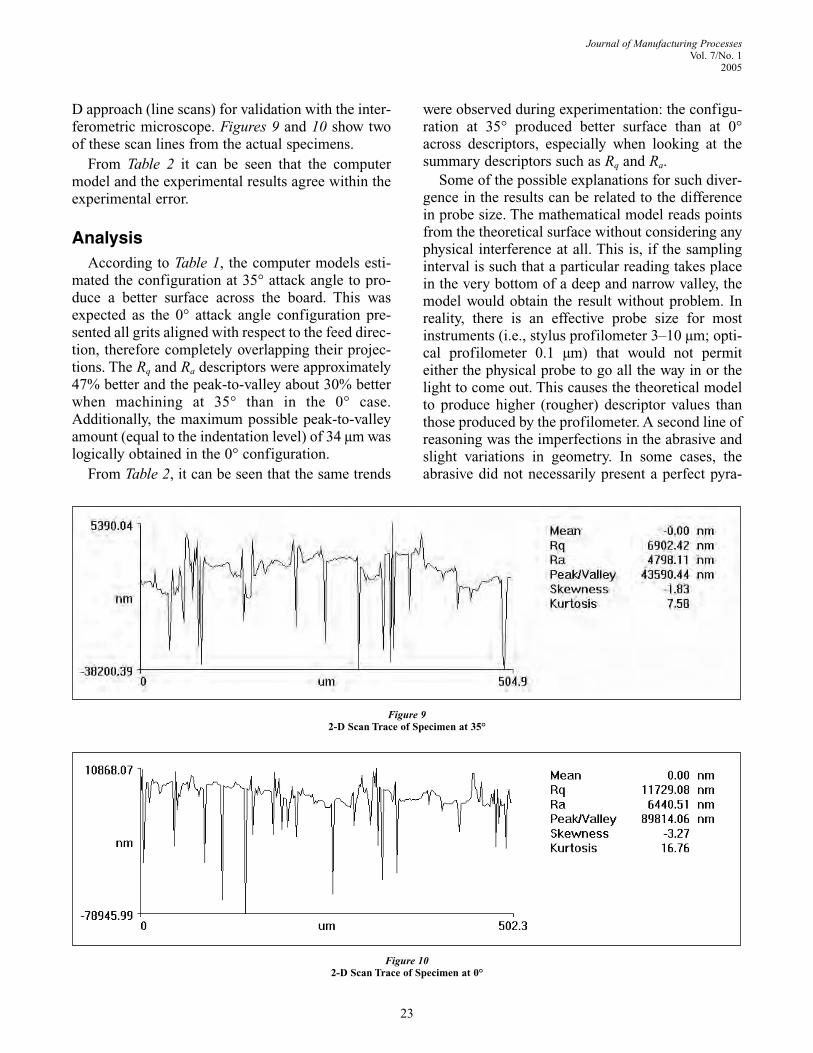
D approach (line scans) for validation with the inter-ferometric microscope. Figures 9 and 10 show twoof these scan lines from the actual specimens.
From Table 2 it can be seen that the computermodel and the experimental results agree within theexperimental error.
Analysis According to Table 1, the computer models esti-
mated the configuration at 35° attack angle to pro-duce a better surface across the board. This wasexpected as the 0° attack angle configuration pre-sented all grits aligned with respect to the feed direc-tion, therefore completely overlapping their projec-tions. The Rq and Ra descriptors were approximately47% better and the peak-to-valley about 30% betterwhen machining at 35° than in the 0° case.Additionally, the maximum possible peak-to-valleyamount (equal to the indentation level) of 34 µm waslogically obtained in the 0° configuration.
From Table 2, it can be seen that the same trends
were observed during experimentation: the configu-ration at 35° produced better surface than at 0°across descriptors, especially when looking at thesummary descriptors such as Rq and Ra.
Some of the possible explanations for such diver-gence in the results can be related to the differencein probe size. The mathematical model reads pointsfrom the theoretical surface without considering anyphysical interference at all. This is, if the samplinginterval is such that a particular reading takes placein the very bottom of a deep and narrow valley, themodel would obtain the result without problem. Inreality, there is an effective probe size for mostinstruments (i.e., stylus profilometer 3–10 µm; opti-cal profilometer 0.1 µm) that would not permiteither the physical probe to go all the way in or thelight to come out. This causes the theoretical modelto produce higher (rougher) descriptor values thanthose produced by the profilometer. A second line ofreasoning was the imperfections in the abrasive andslight variations in geometry. In some cases, theabrasive did not necessarily present a perfect pyra-
23
Journal of Manufacturing ProcessesVol. 7/No. 1
2005
Figure 92-D Scan Trace of Specimen at 35°
Figure 102-D Scan Trace of Specimen at 0°
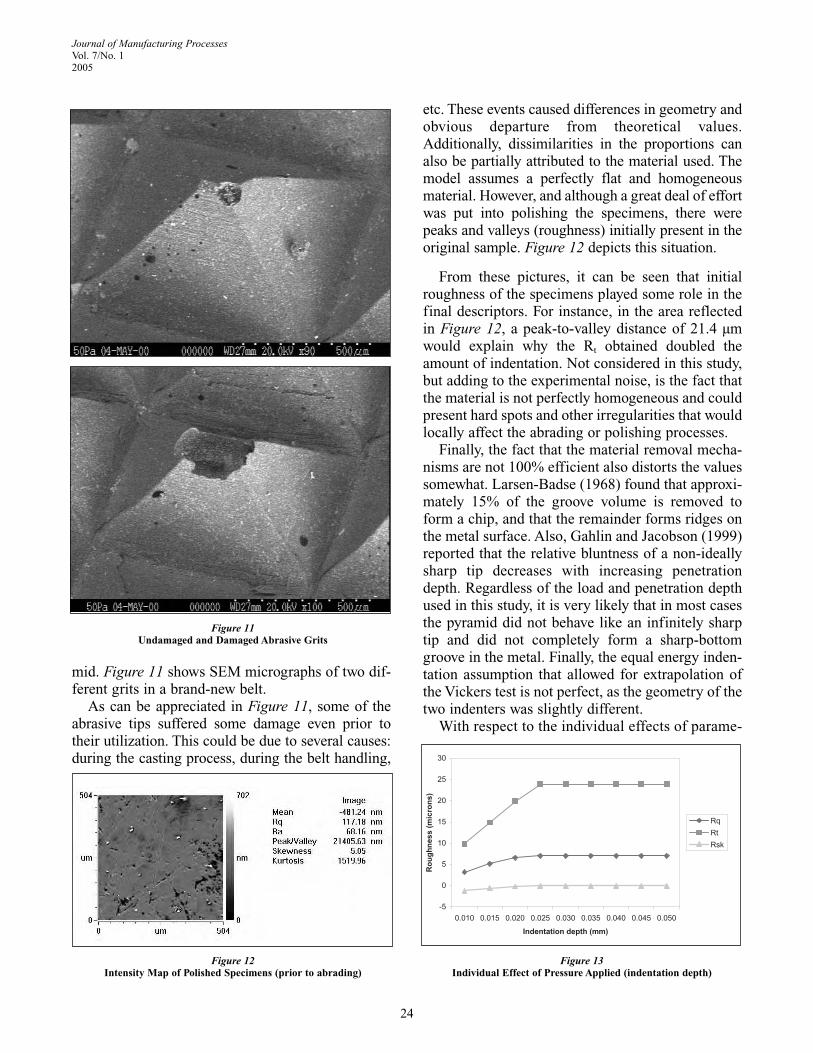
mid. Figure 11 shows SEM micrographs of two dif-ferent grits in a brand-new belt.
As can be appreciated in Figure 11, some of theabrasive tips suffered some damage even prior totheir utilization. This could be due to several causes:during the casting process, during the belt handling,
etc. These events caused differences in geometry andobvious departure from theoretical values.Additionally, dissimilarities in the proportions canalso be partially attributed to the material used. Themodel assumes a perfectly flat and homogeneousmaterial. However, and although a great deal of effortwas put into polishing the specimens, there werepeaks and valleys (roughness) initially present in theoriginal sample. Figure 12 depicts this situation.
From these pictures, it can be seen that initialroughness of the specimens played some role in thefinal descriptors. For instance, in the area reflectedin Figure 12, a peak-to-valley distance of 21.4 µmwould explain why the Rt obtained doubled theamount of indentation. Not considered in this study,but adding to the experimental noise, is the fact thatthe material is not perfectly homogeneous and couldpresent hard spots and other irregularities that wouldlocally affect the abrading or polishing processes.
Finally, the fact that the material removal mecha-nisms are not 100% efficient also distorts the valuessomewhat. Larsen-Badse (1968) found that approxi-mately 15% of the groove volume is removed toform a chip, and that the remainder forms ridges onthe metal surface. Also, Gahlin and Jacobson (1999)reported that the relative bluntness of a non-ideallysharp tip decreases with increasing penetrationdepth. Regardless of the load and penetration depthused in this study, it is very likely that in most casesthe pyramid did not behave like an infinitely sharptip and did not completely form a sharp-bottomgroove in the metal. Finally, the equal energy inden-tation assumption that allowed for extrapolation ofthe Vickers test is not perfect, as the geometry of thetwo indenters was slightly different.
With respect to the individual effects of parame-
24
Journal of Manufacturing ProcessesVol. 7/No. 12005
Figure 11Undamaged and Damaged Abrasive Grits
Figure 13Individual Effect of Pressure Applied (indentation depth)
Figure 12Intensity Map of Polished Specimens (prior to abrading)
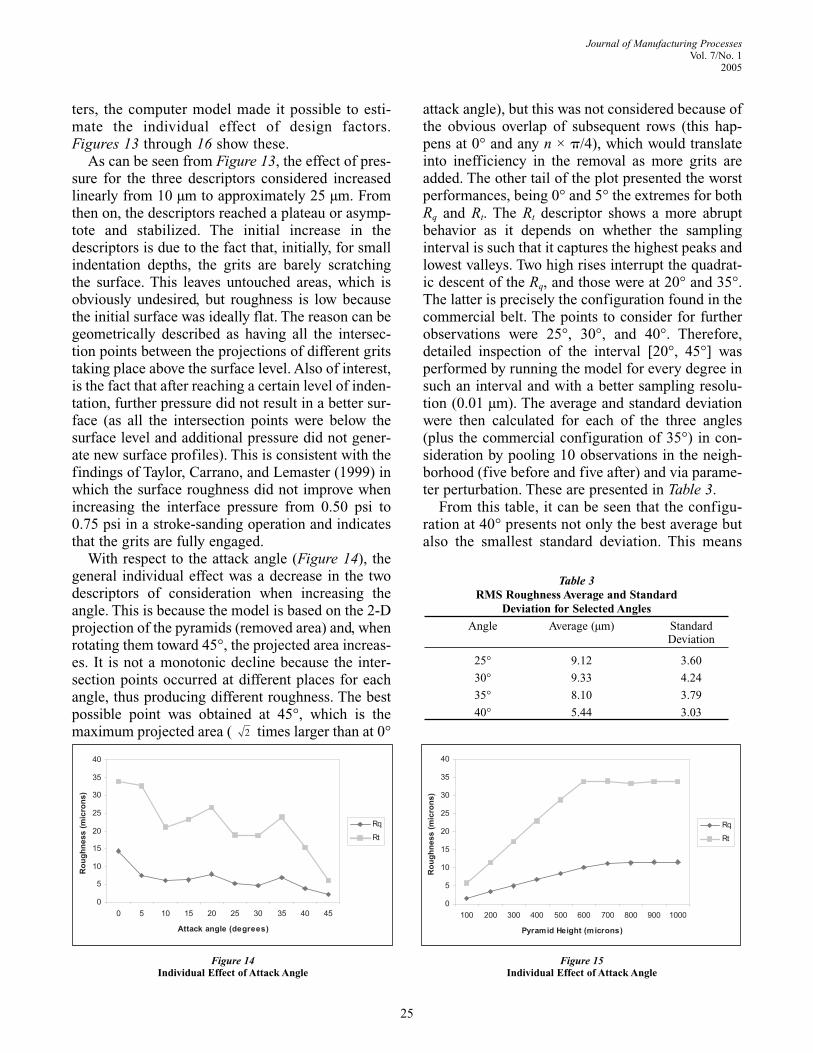
ters, the computer model made it possible to esti-mate the individual effect of design factors.Figures 13 through 16 show these.
As can be seen from Figure 13, the effect of pres-sure for the three descriptors considered increasedlinearly from 10 µm to approximately 25 µm. Fromthen on, the descriptors reached a plateau or asymp-tote and stabilized. The initial increase in thedescriptors is due to the fact that, initially, for smallindentation depths, the grits are barely scratchingthe surface. This leaves untouched areas, which isobviously undesired, but roughness is low becausethe initial surface was ideally flat. The reason can begeometrically described as having all the intersec-tion points between the projections of different gritstaking place above the surface level. Also of interest,is the fact that after reaching a certain level of inden-tation, further pressure did not result in a better sur-face (as all the intersection points were below thesurface level and additional pressure did not gener-ate new surface profiles). This is consistent with thefindings of Taylor, Carrano, and Lemaster (1999) inwhich the surface roughness did not improve whenincreasing the interface pressure from 0.50 psi to0.75 psi in a stroke-sanding operation and indicatesthat the grits are fully engaged.
With respect to the attack angle (Figure 14), thegeneral individual effect was a decrease in the twodescriptors of consideration when increasing theangle. This is because the model is based on the 2-Dprojection of the pyramids (removed area) and, whenrotating them toward 45°, the projected area increas-es. It is not a monotonic decline because the inter-section points occurred at different places for eachangle, thus producing different roughness. The bestpossible point was obtained at 45°, which is themaximum projected area ( times larger than at 0°
attack angle), but this was not considered because ofthe obvious overlap of subsequent rows (this hap-pens at 0° and any n × �/4), which would translateinto inefficiency in the removal as more grits areadded. The other tail of the plot presented the worstperformances, being 0° and 5° the extremes for bothRq and Rt. The Rt descriptor shows a more abruptbehavior as it depends on whether the samplinginterval is such that it captures the highest peaks andlowest valleys. Two high rises interrupt the quadrat-ic descent of the Rq, and those were at 20° and 35°.The latter is precisely the configuration found in thecommercial belt. The points to consider for furtherobservations were 25°, 30°, and 40°. Therefore,detailed inspection of the interval [20°, 45°] wasperformed by running the model for every degree insuch an interval and with a better sampling resolu-tion (0.01 µm). The average and standard deviationwere then calculated for each of the three angles(plus the commercial configuration of 35°) in con-sideration by pooling 10 observations in the neigh-borhood (five before and five after) and via parame-ter perturbation. These are presented in Table 3.
From this table, it can be seen that the configu-ration at 40° presents not only the best average butalso the smallest standard deviation. This means
2
25
Journal of Manufacturing ProcessesVol. 7/No. 1
2005
Figure 14Individual Effect of Attack Angle
Figure 15Individual Effect of Attack Angle
Table 3RMS Roughness Average and Standard
Deviation for Selected Angles
Angle Average (µm) Standard Deviation
25° 9.12 3.60
30° 9.33 4.24
35° 8.10 3.79
40° 5.44 3.03
that this is the most robust configuration againstperturbations in the angle. These perturbations canarise from the abrasive manufacturing processitself or from belt tracking problems during the useof the belt.
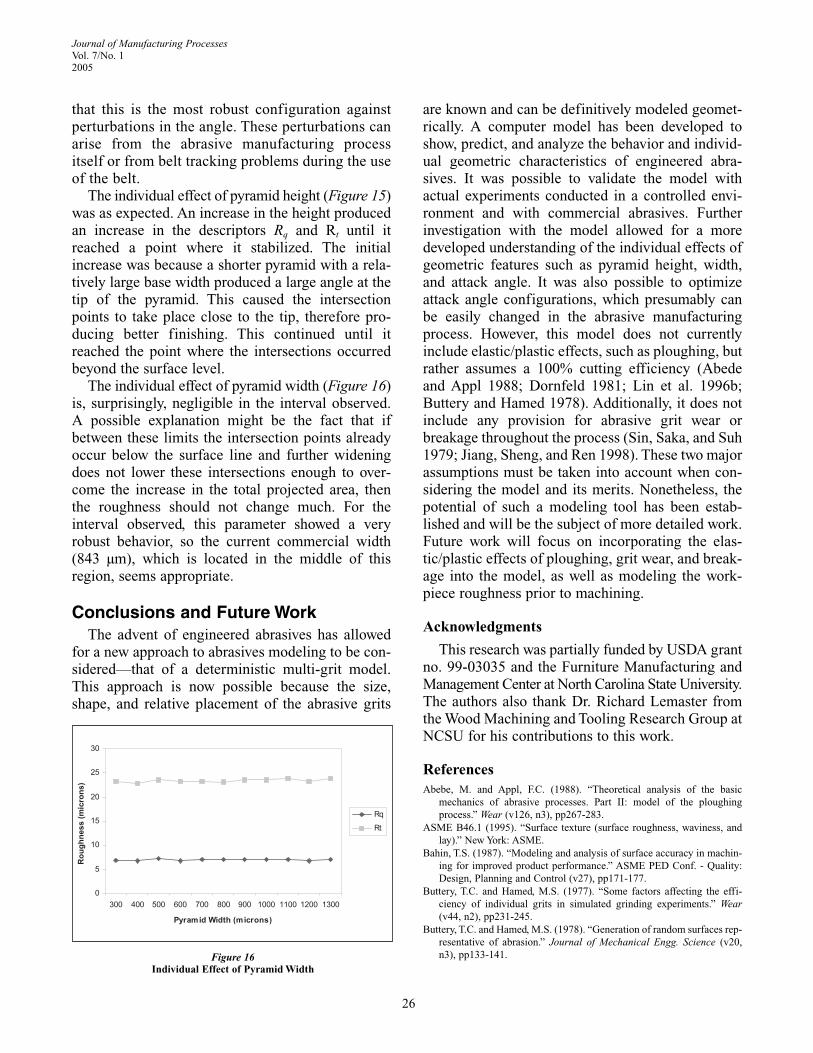
The individual effect of pyramid height (Figure 15)was as expected. An increase in the height producedan increase in the descriptors Rq and Rt until itreached a point where it stabilized. The initialincrease was because a shorter pyramid with a rela-tively large base width produced a large angle at thetip of the pyramid. This caused the intersectionpoints to take place close to the tip, therefore pro-ducing better finishing. This continued until itreached the point where the intersections occurredbeyond the surface level.
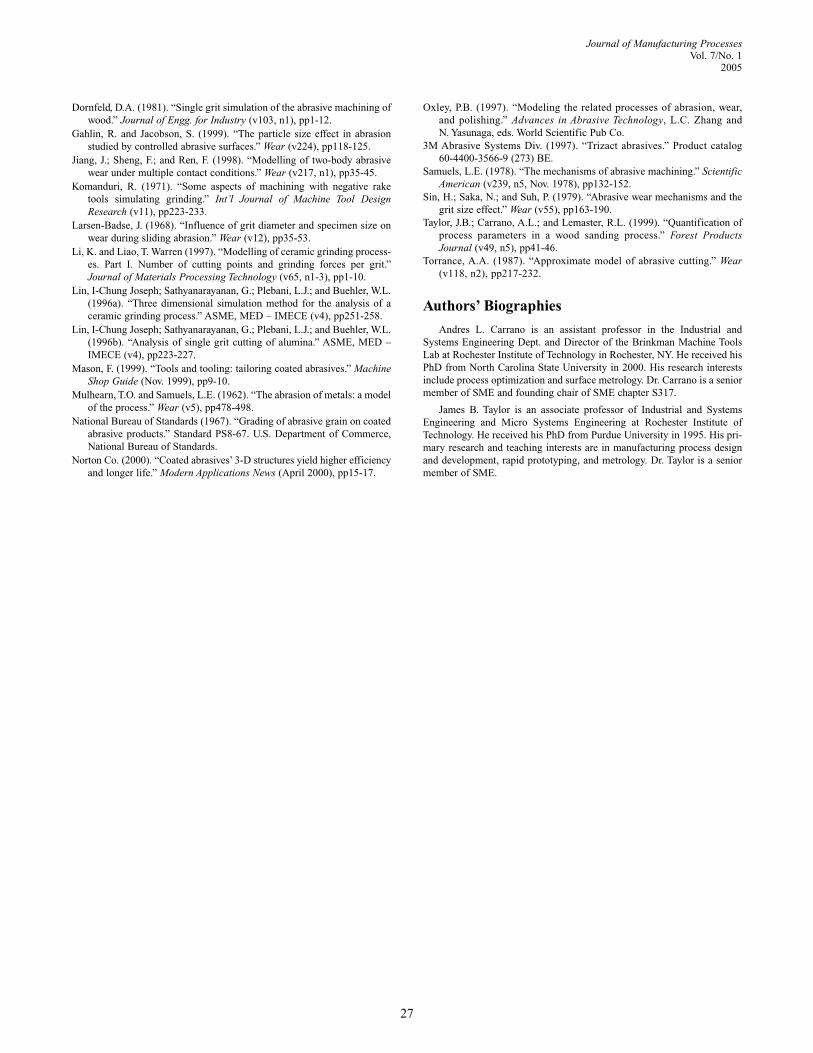
The individual effect of pyramid width (Figure 16)is, surprisingly, negligible in the interval observed.A possible explanation might be the fact that ifbetween these limits the intersection points alreadyoccur below the surface line and further wideningdoes not lower these intersections enough to over-come the increase in the total projected area, thenthe roughness should not change much. For theinterval observed, this parameter showed a veryrobust behavior, so the current commercial width(843 µm), which is located in the middle of thisregion, seems appropriate.
Conclusions and Future WorkThe advent of engineered abrasives has allowed
for a new approach to abrasives modeling to be con-sidered—that of a deterministic multi-grit model.This approach is now possible because the size,shape, and relative placement of the abrasive grits
are known and can be definitively modeled geomet-rically. A computer model has been developed toshow, predict, and analyze the behavior and individ-ual geometric characteristics of engineered abra-sives. It was possible to validate the model withactual experiments conducted in a controlled envi-ronment and with commercial abrasives. Furtherinvestigation with the model allowed for a moredeveloped understanding of the individual effects of geometric features such as pyramid height, width,and attack angle. It was also possible to optimizeattack angle configurations, which presumably canbe easily changed in the abrasive manufacturingprocess. However, this model does not currentlyinclude elastic/plastic effects, such as ploughing, butrather assumes a 100% cutting efficiency (Abedeand Appl 1988; Dornfeld 1981; Lin et al. 1996b;Buttery and Hamed 1978). Additionally, it does notinclude any provision for abrasive grit wear orbreakage throughout the process (Sin, Saka, and Suh1979; Jiang, Sheng, and Ren 1998). These two majorassumptions must be taken into account when con-sidering the model and its merits. Nonetheless, thepotential of such a modeling tool has been estab-lished and will be the subject of more detailed work.Future work will focus on incorporating the elas-tic/plastic effects of ploughing, grit wear, and break-age into the model, as well as modeling the work-piece roughness prior to machining.
Acknowledgments
This research was partially funded by USDA grantno. 99-03035 and the Furniture Manufacturing andManagement Center at North Carolina State University.The authors also thank Dr. Richard Lemaster fromthe Wood Machining and Tooling Research Group atNCSU for his contributions to this work.
ReferencesAbebe, M. and Appl, F.C. (1988). “Theoretical analysis of the basic
mechanics of abrasive processes. Part II: model of the ploughingprocess.” Wear (v126, n3), pp267-283.
ASME B46.1 (1995). “Surface texture (surface roughness, waviness, andlay).” New York: ASME.
Bahin, T.S. (1987). “Modeling and analysis of surface accuracy in machin-ing for improved product performance.” ASME PED Conf. - Quality:Design, Planning and Control (v27), pp171-177.
Buttery, T.C. and Hamed, M.S. (1977). “Some factors affecting the effi-ciency of individual grits in simulated grinding experiments.” Wear(v44, n2), pp231-245.
Buttery, T.C. and Hamed, M.S. (1978). “Generation of random surfaces rep-resentative of abrasion.” Journal of Mechanical Engg. Science (v20,n3), pp133-141.
26
Journal of Manufacturing ProcessesVol. 7/No. 12005
Figure 16Individual Effect of Pyramid Width
Dornfeld, D.A. (1981). “Single grit simulation of the abrasive machining ofwood.” Journal of Engg. for Industry (v103, n1), pp1-12.
Gahlin, R. and Jacobson, S. (1999). “The particle size effect in abrasionstudied by controlled abrasive surfaces.” Wear (v224), pp118-125.
Jiang, J.; Sheng, F.; and Ren, F. (1998). “Modelling of two-body abrasivewear under multiple contact conditions.” Wear (v217, n1), pp35-45.
Komanduri, R. (1971). “Some aspects of machining with negative raketools simulating grinding.” Int’l Journal of Machine Tool DesignResearch (v11), pp223-233.
Larsen-Badse, J. (1968). “Influence of grit diameter and specimen size onwear during sliding abrasion.” Wear (v12), pp35-53.
Li, K. and Liao, T. Warren (1997). “Modelling of ceramic grinding process-es. Part I. Number of cutting points and grinding forces per grit.”Journal of Materials Processing Technology (v65, n1-3), pp1-10.
Lin, I-Chung Joseph; Sathyanarayanan, G.; Plebani, L.J.; and Buehler, W.L.(1996a). “Three dimensional simulation method for the analysis of aceramic grinding process.” ASME, MED – IMECE (v4), pp251-258.
Lin, I-Chung Joseph; Sathyanarayanan, G.; Plebani, L.J.; and Buehler, W.L.(1996b). “Analysis of single grit cutting of alumina.” ASME, MED –IMECE (v4), pp223-227.
Mason, F. (1999). “Tools and tooling: tailoring coated abrasives.” MachineShop Guide (Nov. 1999), pp9-10.
Mulhearn, T.O. and Samuels, L.E. (1962). “The abrasion of metals: a modelof the process.” Wear (v5), pp478-498.
National Bureau of Standards (1967). “Grading of abrasive grain on coatedabrasive products.” Standard PS8-67. U.S. Department of Commerce,National Bureau of Standards.
Norton Co. (2000). “Coated abrasives’ 3-D structures yield higher efficiencyand longer life.” Modern Applications News (April 2000), pp15-17.
Oxley, P.B. (1997). “Modeling the related processes of abrasion, wear,and polishing.” Advances in Abrasive Technology, L.C. Zhang andN. Yasunaga, eds. World Scientific Pub Co.
3M Abrasive Systems Div. (1997). “Trizact abrasives.” Product catalog60-4400-3566-9 (273) BE.
Samuels, L.E. (1978). “The mechanisms of abrasive machining.” ScientificAmerican (v239, n5, Nov. 1978), pp132-152.
Sin, H.; Saka, N.; and Suh, P. (1979). “Abrasive wear mechanisms and thegrit size effect.” Wear (v55), pp163-190.
Taylor, J.B.; Carrano, A.L.; and Lemaster, R.L. (1999). “Quantification ofprocess parameters in a wood sanding process.” Forest ProductsJournal (v49, n5), pp41-46.
Torrance, A.A. (1987). “Approximate model of abrasive cutting.” Wear(v118, n2), pp217-232.
Authors’ Biographies
Andres L. Carrano is an assistant professor in the Industrial andSystems Engineering Dept. and Director of the Brinkman Machine ToolsLab at Rochester Institute of Technology in Rochester, NY. He received hisPhD from North Carolina State University in 2000. His research interestsinclude process optimization and surface metrology. Dr. Carrano is a seniormember of SME and founding chair of SME chapter S317.
James B. Taylor is an associate professor of Industrial and SystemsEngineering and Micro Systems Engineering at Rochester Institute ofTechnology. He received his PhD from Purdue University in 1995. His pri-mary research and teaching interests are in manufacturing process designand development, rapid prototyping, and metrology. Dr. Taylor is a seniormember of SME.
27
Journal of Manufacturing ProcessesVol. 7/No. 1
2005