Embed Size (px)
Citation preview

Geometry Expressions ManualTM
Saltire SoftwarePO Box 230755
Tigard, OR 97281 0755

© 2013 Saltire Software. All rights reserved.
Information in this document is subject to change without notice. The distribution and sale of this product areintended for the use of the original purchaser only. Under the copyright laws, neither the documentation norsoftware may be copied, photocopied, reproduced, translated, or reduced to any electronic medium ormachine-readable form, in whole or in part without the prior written consent of Saltire Software, Inc., except in themanner described in the Software License Agreement.
Saltire Software, Inc.P.O. Box 230755Tigard, OR 97281 0755http://www.saltire.comhttp://www.geometryexpressions.com
Geometry Expressions is a registered trademark of Saltire Software Inc.TM
This material is based upon work supported by the National Science Foundation under GrantNo. 0750028
3Contents
© 2013 Saltire Software
Table of Contents
.....................................................................................................11Getting Started
........................................................................................................................11Need Help?
.......................................................................................................................................11 Linked Text
.....................................................................................................14The Display and How It's Organized
........................................................................................................................15The Status Bar
.....................................................................................................18Customizing Your Display
........................................................................................................................19Arranging Toolboxes
........................................................................................................................20Hiding / Showing Toolboxes
........................................................................................................................21Saving the Configuration
........................................................................................................................22Arranging Project Pages
........................................................................................................................24Changing Background Color
.....................................................................................................28Adjusting the Default Settings
.....................................................................................................32File Handling
........................................................................................................................33Wookbooks and Individual .gx Files
.....................................................................................................36MathML
.....................................................................................................38Some Opening Examples
.....................................................................................................40Tools

Geometry Expressions Manual4
© 2013 Saltire Software
........................................................................................................................40Drawing
.......................................................................................................................................40 Using the Drawing Tools
.......................................................................................................................................41 Adding a Point
.......................................................................................................................................42 Adding Line Segments
.......................................................................................................................................43 Drawing Lines
.......................................................................................................................................44 Drawing Vectors
.......................................................................................................................................45 Drawing Polygons
.......................................................................................................................................46 Drawing Circles
.......................................................................................................................................47 Drawing Ellipses
.......................................................................................................................................48 Drawing Parabolas
.......................................................................................................................................49 Drawing Hyperbolas
.......................................................................................................................................50 Drawing Arcs
.......................................................................................................................................55 Drawing Regular Polygons
.......................................................................................................................................56 Drawing Curve Approximations
.......................................................................................................................................57 Adding Text to the Drawing
.......................................................................................................................................58 Using Pictures in the Drawing
.......................................................................................................................................60 Adding Expressions
.......................................................................................................................................61 Creating Functions
.......................................................................................................................................72 The Selection Arrow
.......................................................................................................................................74 Adjusting the Drawing
........................................................................................................................75Constraints
.......................................................................................................................................75 Using Drawing Constraints
.......................................................................................................................................78 System Added Constraints
.......................................................................................................................................81 Constraint Conflicts
5Contents
© 2013 Saltire Software
.......................................................................................................................................83 Distance / Length Constraint
.......................................................................................................................................84 Radius Constraint
.......................................................................................................................................84 Perpendicular Constraint
.......................................................................................................................................85 Angle Constraint
.......................................................................................................................................86 Direction Constraint
.......................................................................................................................................86 Slope Constraint
.......................................................................................................................................87 Coordinate Constraint
.......................................................................................................................................87 Constraining Vector Coeffecients
.......................................................................................................................................88 Tangent Constraint
.......................................................................................................................................88 Incident Constraint
.......................................................................................................................................89 Congruent Constraint
.......................................................................................................................................90 Parallel Constraint
.......................................................................................................................................91 Implicit Equation Constraint
.......................................................................................................................................91 Point Proportional Along a Curve Constraint
........................................................................................................................96Constructions
.......................................................................................................................................96 Creating Constructions
.......................................................................................................................................98 Midpoints of Line Segments
.......................................................................................................................................98 Intersections
.......................................................................................................................................99 Perpendicular Bisector
.......................................................................................................................................100 Angle Bisector
.......................................................................................................................................100 Parallel Constructions
.......................................................................................................................................101 Perpendicular Constructions
.......................................................................................................................................101 Tangents
.......................................................................................................................................102 Polygon Construction
.......................................................................................................................................102 Reflection
Geometry Expressions Manual6
© 2013 Saltire Software
.......................................................................................................................................103 Translation
.......................................................................................................................................103 Rotation
.......................................................................................................................................104 Dilation
.......................................................................................................................................105 Locus of Points / Envelope
.......................................................................................................................................107 Trace
.......................................................................................................................................109 Area Under the Arc
........................................................................................................................111Annotations
.......................................................................................................................................111 Applying Annotations
........................................................................................................................122Calculations
.......................................................................................................................................122 Calculating the Output
.......................................................................................................................................124 Distance / Length Calculation
.......................................................................................................................................124 Radius Calculation
.......................................................................................................................................125 Angle Calculation
.......................................................................................................................................127 Direction Calculation
.......................................................................................................................................127 Slope Calculation
.......................................................................................................................................128 Calculate Coordinates
.......................................................................................................................................128 Area Calculation
.......................................................................................................................................129 Perimeter Calculation
.......................................................................................................................................129 Calculate Coefficients
.......................................................................................................................................130 Calculating Parametric Equations
.......................................................................................................................................130 Calculating Implicit Equation
........................................................................................................................131Output
.......................................................................................................................................131 Viewing the Output
........................................................................................................................136Symbols

7Contents
© 2013 Saltire Software
.......................................................................................................................................136 Using Symbols
.......................................................................................................................................137 Inserting Greek Letters
.......................................................................................................................................137 Multiplication & Division Editing Tools
.......................................................................................................................................138 Square Root Editing Tool
.......................................................................................................................................138 Subscript / Superscript Editor
.......................................................................................................................................139 Parentheses and Absolute Value Notation
.......................................................................................................................................139 Using the Piecewise Function
........................................................................................................................139Built-In Functions
........................................................................................................................140Using Annotation Symbols
........................................................................................................................142System Variables and Animation
.......................................................................................................................................143 Investigating Variables
.......................................................................................................................................144 Variables List
.......................................................................................................................................144 Functions List
.......................................................................................................................................145 Using the Lock Tool
.......................................................................................................................................147 Changing and Locking the Variable Value
.......................................................................................................................................147 Animation
.......................................................................................................................................149 Animation Console
.......................................................................................................................................149 Animation Modes
.......................................................................................................................................149 Animation Values and Duration
.......................................................................................................................................150 Animation and the Locus Tool
.....................................................................................................152Menus and Icons
........................................................................................................................152File Menu
.......................................................................................................................................153 Importing Files from the Figure Gallery

Geometry Expressions Manual8
© 2013 Saltire Software
.......................................................................................................................................155 Importing Files from the Geometry Atlas
.......................................................................................................................................157 Exporting a Drawing
.......................................................................................................................................177 Graphing Mode
........................................................................................................................178Edit Menu
.......................................................................................................................................181 Copying Mathematics
........................................................................................................................189View Menu
.......................................................................................................................................192 Zooming and Scaling
........................................................................................................................193Toolbox Menus
........................................................................................................................194Help Menu
........................................................................................................................195Context Menus
.......................................................................................................................................195 The General Context Menu
.......................................................................................................................................197 Selection Context Menu
........................................................................................................................203Tool Bar
.....................................................................................................206 More About Geometry Expressions
........................................................................................................................206What's New in Geometry Expressions?
........................................................................................................................207Where is the Geometry Expressions Website?
........................................................................................................................207Can I See Some Examples?
......................................................................................................209Index

IGetting Started

Getting Started 11
© 2013 Saltire Software
Need Help?
There are many ways to get help with Geometry Expressions.
In both the PDF manual document and the embedded Help system youcan:
· Use the table of contents to get details on using a tool, an icon or amenu.
· Use the index for help on a particular topic, such as "parametricequations".
Inside the Geometry Expressions Help system you can:
· Use the Search tool to find all topics based on a key word, such as"constraints".
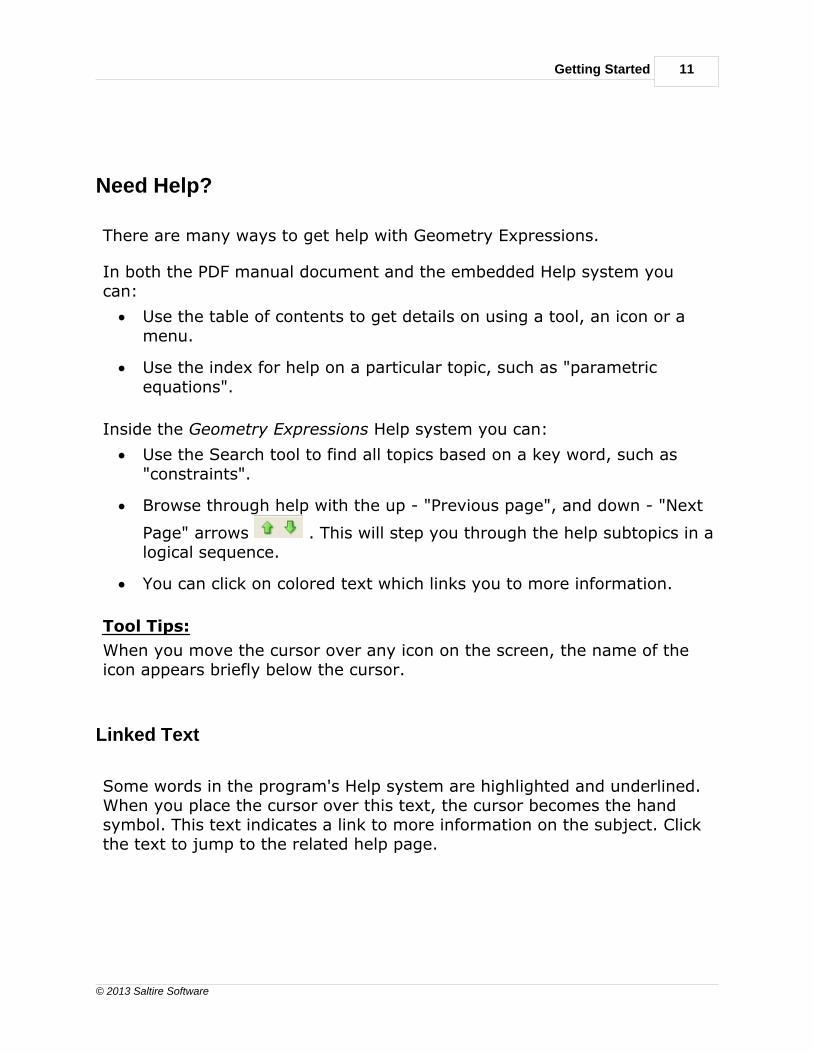
· Browse through help with the up - "Previous page", and down - "Next
Page" arrows . This will step you through the help subtopics in alogical sequence.
· You can click on colored text which links you to more information.
Tool Tips:
When you move the cursor over any icon on the screen, the name of theicon appears briefly below the cursor.
Linked Text
Some words in the program's Help system are highlighted and underlined.When you place the cursor over this text, the cursor becomes the handsymbol. This text indicates a link to more information on the subject. Clickthe text to jump to the related help page.


IIThe Display and How It's Organized
14
© 2013 Saltire Software
Geometry Expressions Manual
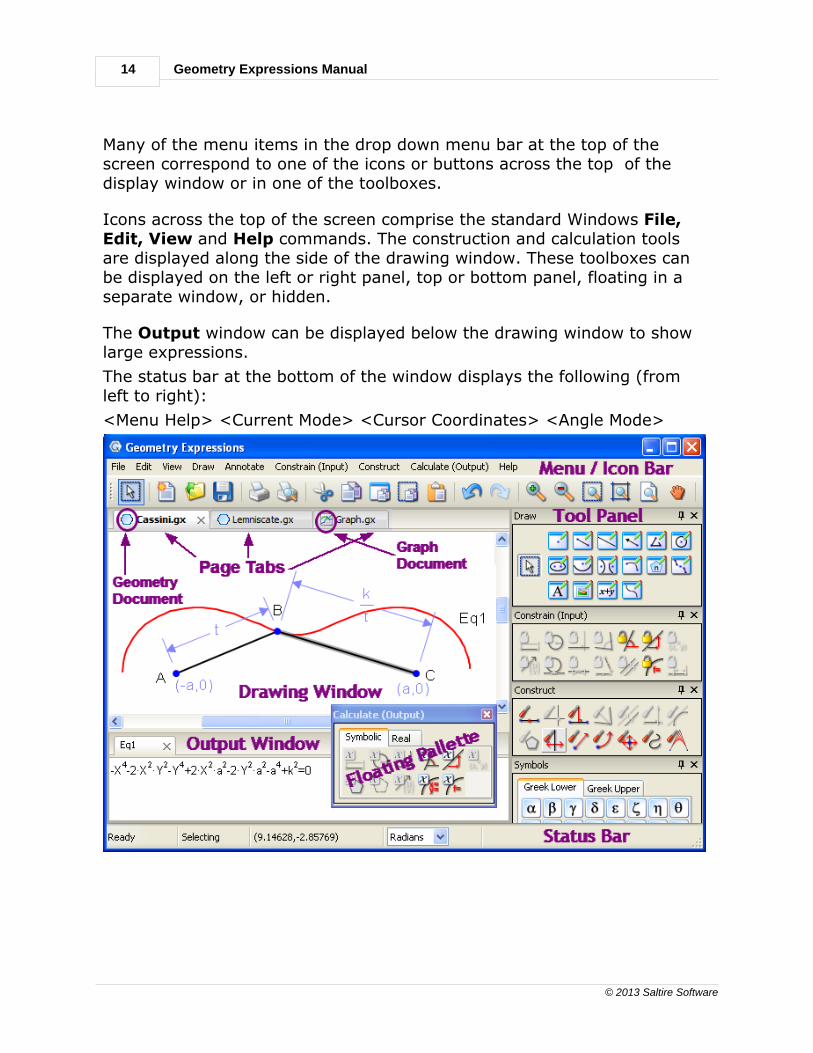
Many of the menu items in the drop down menu bar at the top of thescreen correspond to one of the icons or buttons across the top of thedisplay window or in one of the toolboxes.
Icons across the top of the screen comprise the standard Windows File,Edit, View and Help commands. The construction and calculation toolsare displayed along the side of the drawing window. These toolboxes canbe displayed on the left or right panel, top or bottom panel, floating in aseparate window, or hidden.
The Output window can be displayed below the drawing window to showlarge expressions.
The status bar at the bottom of the window displays the following (fromleft to right):
<Menu Help> <Current Mode> <Cursor Coordinates> <Angle Mode>

The Display and How It's Organized 15
© 2013 Saltire Software
The Status Bar
The status bar at the bottom of the screen prompts the followinginformation (from left to right):
· Menu Help - summary of a selected menu item.
· Current Mode - Each icon in the drawing toolbox represents a mode.Tools requiring additional inputs after clicking the tool will displayfurther prompts in this field.
· Cursor Coordinates - Displays the current coordinates of the cursorin the diagram.
· Angle Mode - A drop down window for conveniently changing fromRadians to Degrees and visa versa. This default can also be changedin the Preferences dialog - Edit / Preferences / Math.

IIICustomizing Your Display
18
© 2013 Saltire Software
Geometry Expressions Manual
You can arrange the display as it suits you.
Arranging Toolboxes - Anchored or floating toolboxes can beplaced around the drawing window.
Hide / Show Toolboxes - You may want to hide toolboxes whichyou rarely use.
Saving your configuration - Use the View / Tool PanelConfigurations.
Arranging projects - You can open multiple project files andarrange them in the drawing window using the page tabs.
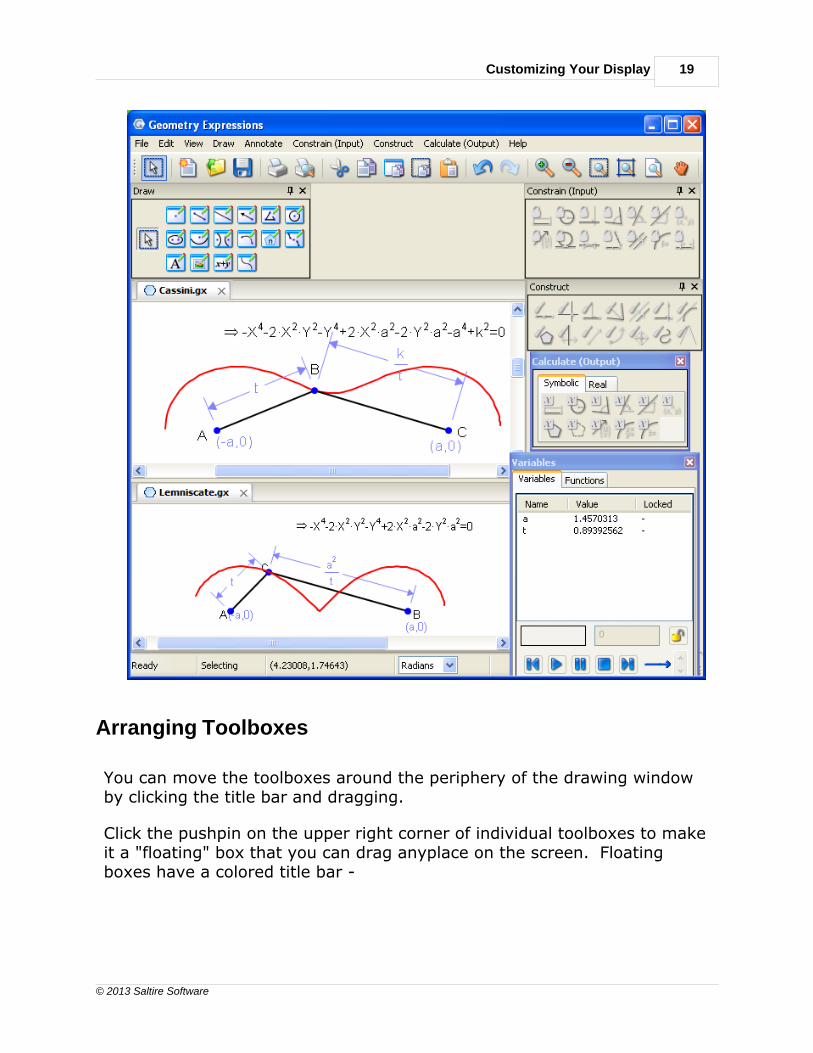
In the example below three toolboxes (Draw, Constrain (Input), andConstruct) are anchored, two (Calculate (Output) and Variables) arefloating, and three (Anotate, Symbols, and Annotation Symbols) arehidden. Two slightly different locus examples are displayed forcomparison.
Customizing Your Display 19
© 2013 Saltire Software
Arranging Toolboxes
You can move the toolboxes around the periphery of the drawing windowby clicking the title bar and dragging.
Click the pushpin on the upper right corner of individual toolboxes to makeit a "floating" box that you can drag anyplace on the screen. Floatingboxes have a colored title bar -
20
© 2013 Saltire Software
Geometry Expressions Manual
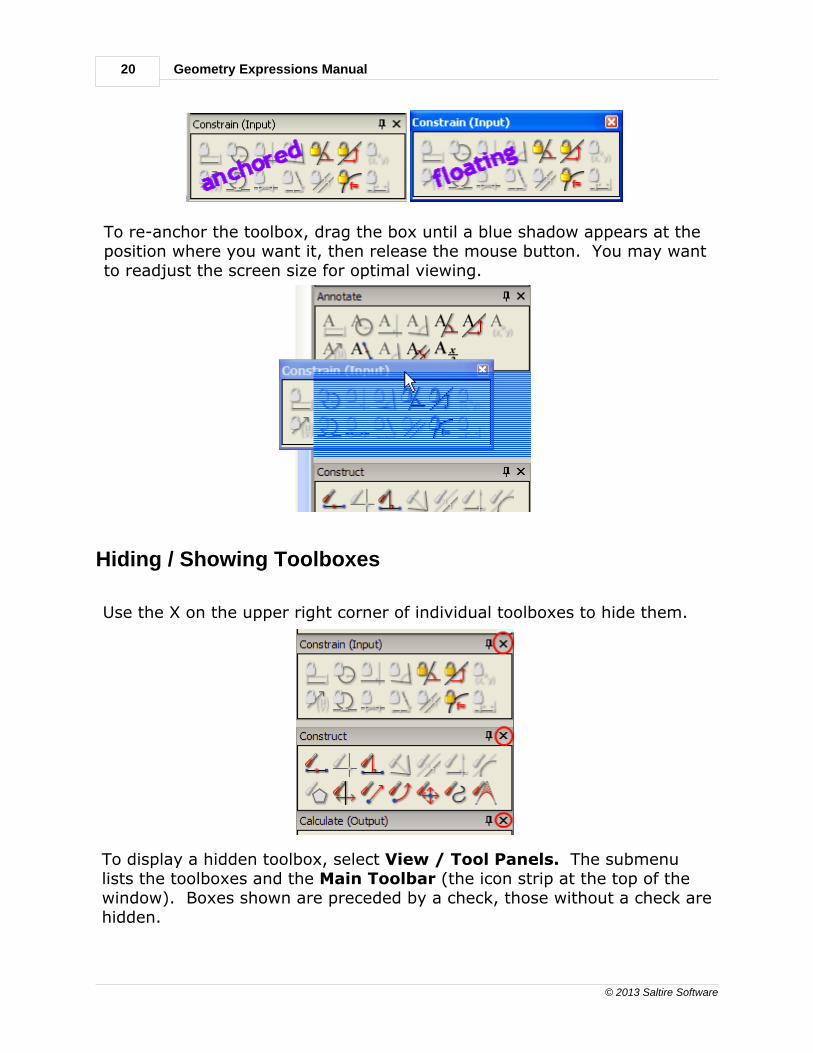
To re-anchor the toolbox, drag the box until a blue shadow appears at theposition where you want it, then release the mouse button. You may wantto readjust the screen size for optimal viewing.
Hiding / Showing Toolboxes
Use the X on the upper right corner of individual toolboxes to hide them.
To display a hidden toolbox, select View / Tool Panels. The submenulists the toolboxes and the Main Toolbar (the icon strip at the top of thewindow). Boxes shown are preceded by a check, those without a check arehidden.

Customizing Your Display 21
© 2013 Saltire Software
Click a toolbox name to change its state.
Saving the Configuration
After configuring the screen to you preference, you can save thisarrangement in case it gets messed up, or perhaps you need the toolsarranged differently for different projects. This is easy with the View /Tool Panel Configurations menu selection. You can give a name to anarrangement of the toolbars. Several configurations can be saved in a listand referred to as needed.
Add - to save the current screen configuration. You will be prompted fora name to reference this configuration.
Delete - if you no longer will use a certain configuration you can delete itfrom your list.
Set - to change a configuration which you have saved, simply select theconfiguration name from your list. Check out the configurations thatcome with the program.

22
© 2013 Saltire Software
Geometry Expressions Manual
Default - reset tool panels back to the default configuration.
Arranging Project Pages
You can open multiple project files for quick reference. By default files areoverlaid. Click a page tab to bring a file to the top.
Comparing drawings side by side - click the page tab and drag it toone side, top, or bottom of the window. A shadow of the drawing givesyou an indication of how the drawings will be arranged before you releasethe mouse button.

Customizing Your Display 23
© 2013 Saltire Software
Returning to overlaid configuration - drag one tab and position it overthe other tab. The shadow will appear only on the title bar, then releasethe mouse button.

24
© 2013 Saltire Software
Geometry Expressions Manual
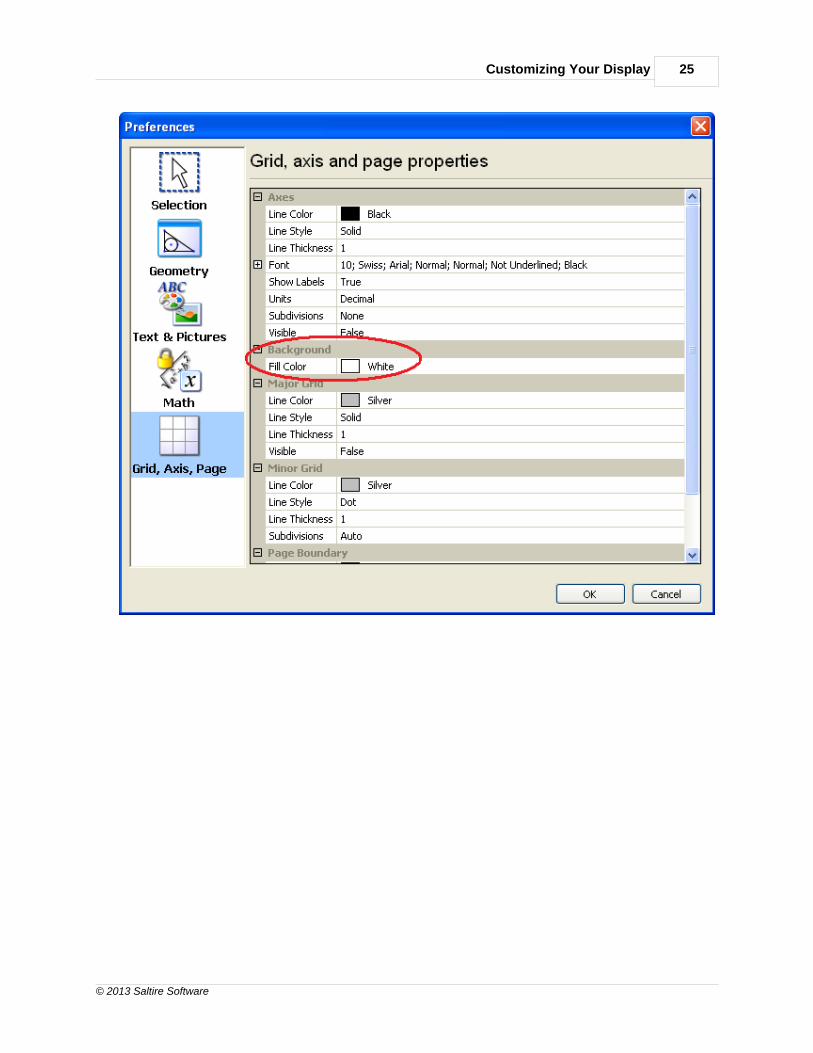
Changing Background Color
You can now change the drawing's background color to something otherthan white by the following steps:
1. Select Edit / Preferences... (or in the Mac version, GeometryExpressions / Preferences...)
2. Click Grid, Axis, Page button
3. Change Fill Color in Background section. The color will be applied toall pages.
Customizing Your Display 25
© 2013 Saltire Software


IVAdjusting the Default Settings
28
© 2013 Saltire Software
Geometry Expressions Manual
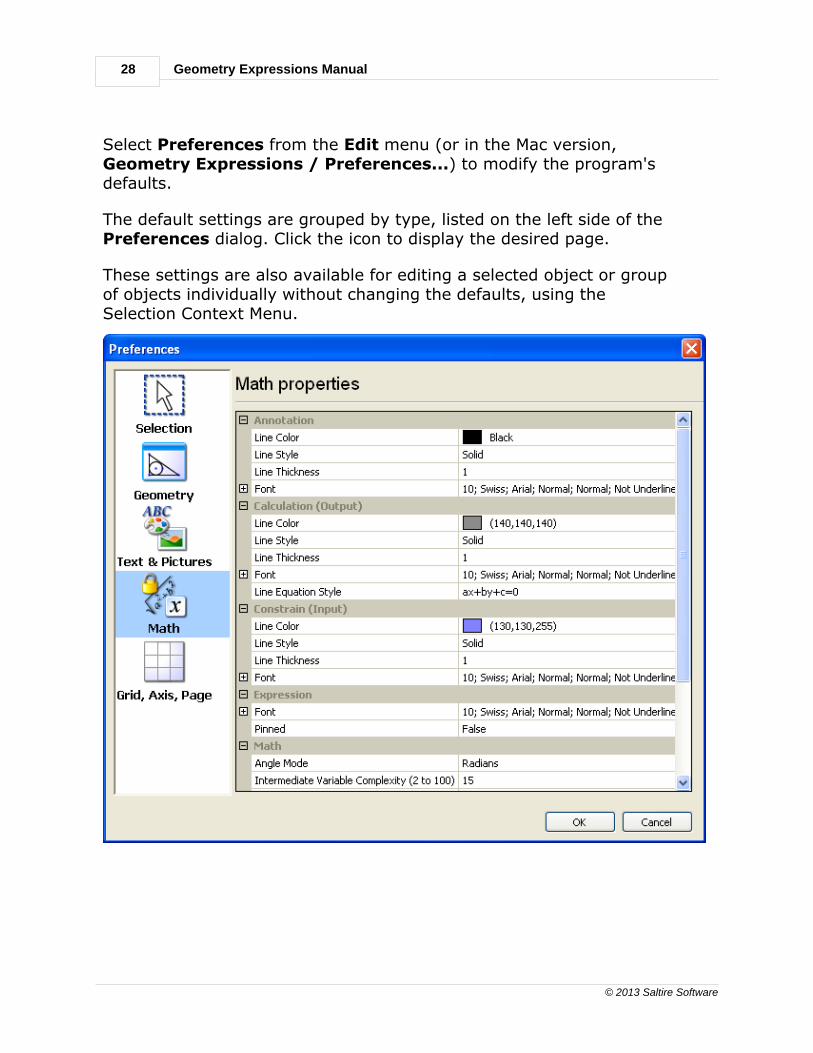
Select Preferences from the Edit menu (or in the Mac version,Geometry Expressions / Preferences...) to modify the program'sdefaults.
The default settings are grouped by type, listed on the left side of the Preferences dialog. Click the icon to display the desired page.
These settings are also available for editing a selected object or groupof objects individually without changing the defaults, using the Selection Context Menu.

Adjusting the Default Settings 29
© 2013 Saltire Software
set the line color and style for each selection type.
set font related properties for labels; color and size /style for other geometric elements.
set font properties for text, the rotation angle and thetransparency level of an inserted picture, and the Pinned state for Text and Pictures. Pinned Text andPictures will not move relative to the PageBoundaries as the result of a Scale operation.
set the properties for alphanumeric input and output;mathematical calculation defaults.
set properties of the Major and Minor Grid, thecoordinate Axes, the drawing's background color, andthe Page Boundary lines.
To see the possible values for each property, click the row. An icon willappear at the right end of the row (except the Point Size selection underthe Font property -you can enter the point size directly).
Click the icon to display the selection dialog or drop-down menu of
choices .
Changing a default for a type of drawing entity will apply to all entities of

30
© 2013 Saltire Software
Geometry Expressions Manual
that type except ones whose properties have been individually set, byselecting it and then choosing Edit / Properties or right clicking AllProperties from the Selection Context menu. Likewise, text, pictures
or expressions that were individually pinned or unpinned
will not be affected by changes to the default Pinned settings.
VFile Handling

32
© 2013 Saltire Software
Geometry Expressions Manual
Geometry Expressions uses standard Windows file Open and Save
operations. Save your files regularly with the handy icon at the top ofthe screen.
The data files generated from your drawings will have the extension ".gx".
You may create multiple data files and have them open in a session. Eachfile is on separate page with the tabs across the top of the drawingwindow. Click the tab to view the file.
If you are preparing a multi-paged lesson, you can save the pagestogether as a Workbook, with the file extension ".gxw". This is acompletely separate file from the .gx files.
The Open / Save (As) / Close Workbook file selections apply only to the
workbook. and the File / Save commands will NOT save theworkbook files. They only affect the individual .gx files.
Files can also be arranged for comparison viewing.

File Handling 33
© 2013 Saltire Software
Wookbooks and Individual .gx Files
Workbooks are a handy way of putting lessons together.
· You can make a workbook by opening new tabs (File / New).
· You can Open .gx files that you have already created to make thempart of your workbook.
· You can create pages from a combination of the above.
When all of the pages are together on the page tab bar, select Save

34
© 2013 Saltire Software
Geometry Expressions Manual
Workbook (As) from the file menu.
Note: saving the workbook does NOT update any of the individual .gx
files displayed in the workbook, since the workbook file is an entirelyseparate file (.gxw). If you want to keep the individual .gx file up to datewith the workbook page, you must use the regular File / Save for eachpage / file. But, if you forget, you can always save it from the workbookat any time.
Likewise, saving an individual page, File / Save, of an open workbookdoes NOT update the workbook file (.gxw). However, if you forget to savethe workbook, but save a page (.gx), you can always open the .gx fileagain from your open workbook file and resave the workbook.
If you don't want to keep individual copies of all your workbook pages,then you just have to remember to use the Save Workbook fileselection.
However, to give the workbook pages custom names (instead ofunnamed7.gx), you must save the individual page (for example, Lesson 1Ellipse.gx) at least once. After the first time, you don't need to continueto save the .gx file.
Only one workbook file can be open at a time. If you open a workbook filewhile other individual files or another workbook file is open, they will beclosed, after, of course, prompting you to save them if you have madechanges.
VIMathML

36
© 2013 Saltire Software
Geometry Expressions Manual
All mathematical expressions in Geometry Expressions are written inMathML, so you can copy and paste directly to or from any other MathMLprogram.
Usually the standard Edit / Copy or Ctrl-C command should work. If thisdoesn't give you the desired result, try the Edit / Copy As command.Select from the submenu of choices appropriate to your application.
If you copy an expression that uses Intermediate Variables, the algebrasystem will create a function from the pasted expression.
To Paste math into Geometry Expressions it must be Content MathML.
· Maple creates Content MathML by default.
· To create Content MathML in Mathematica v6.0, execute the followingcommands:
SetOptions[XML`MathML`ExpressionToMathML, "NamespacePrefixes"> {}, "Formats" > {"ContentMathML"}]
SetOptions[XML`MathML`BoxesToMathML, "NamespacePrefixes" > {},"Formats" > {"ContentMathML"}]
SetOptions[Export, ConversionOptions > {"NamespacePrefixes" > {},"Formats" > {"ContentMathML"}}]
SetOptions[ExportString, ConversionOptions > {"NamespacePrefixes"> {}, "Formats" > {"ContentMathML"}}]

VIISome Opening Examples

38
© 2013 Saltire Software
Geometry Expressions Manual
Your installation comes with several examples - look in the Examplessubdirectory. For step by step instructions through some example sets,see the Geometry Expressions Tutorial.pdf and Geometry ExpressionsExamples.pdf which can be found under the Doc subdirectory in your Gxinstallation.

VIIITools

40
© 2013 Saltire Software
Geometry Expressions Manual
Drawing
Using the Drawing Tools
The Draw toolbox contains the drawing commands and the SelectionArrow. The drawing commands can also be invoked from the Draw menu.
Unlike commands in the other toolboxes, Drawing commands are alwaysavailable and require no pre-selection. Many of the commands are activeuntil you change to a different one or press the Esc key or click the
selection arrow , e.g. you can make multiple points until you selectanother tool or press esc. The selection mode, indicated by the selection
arrow cursor, , is used for invoking all other commands. You can findthe active command mode by noting which button is pressed or looking atthe current mode on the status bar.
Point LineSegment
InfiniteLine
Vector Polygon Circle
Ellipse Parabola Hyperbola Arc N-gon CurveApproximation
Text Picture Expression Function

Tools 41
© 2013 Saltire Software
Before you start your drawing, select Edit / Preferences / Geometry toset various attributes, such as line color / style, fill color / style andtransparency level, of the various drawing elements.
You can change the attributes of individual drawing elements by selectingthem, right click the mouse, and choose All Properties from the contextmenu.
Adding a Point
To insert a point in your drawing, follow these steps:
1. Click the Point icon in the Drawing toolbox or select Point fromthe Draw menu.
2. Move the crosshairs into position.
3. Click the mouse to place the point under the crosshair.
When the crosshairs are positioned over some geometry an incidencesymbol (bowtie) is displayed around the point and the geometry ishighlighted. A click of the mouse will create the point incident to thehighlighted geometry.

42
© 2013 Saltire Software
Geometry Expressions Manual
Each point is displayed with a letter label. You can change the label from
the Select mode .
Point is a modal command. You can continue making points until youchoose the select arrow or another drawing tool.
Adding Line Segments
To add line segments to your geometry follow these steps:
1. Click on the Line Segment icon in the Draw toolbox or selectLine Segment from the Draw menu.
2. Position the cursor in the drawing window.
3. Click the mouse to place each endpoint.
Each line segment is displayed with a letter label for each endpoint.
You can change the label from the Select mode .
To abort a line segment in the middle of the drawing operation, hit the"esc" key.
Line Segment is a modal command. You can continue making segmentsuntil you choose the select arrow or another drawing tool.
Tools 43
© 2013 Saltire Software
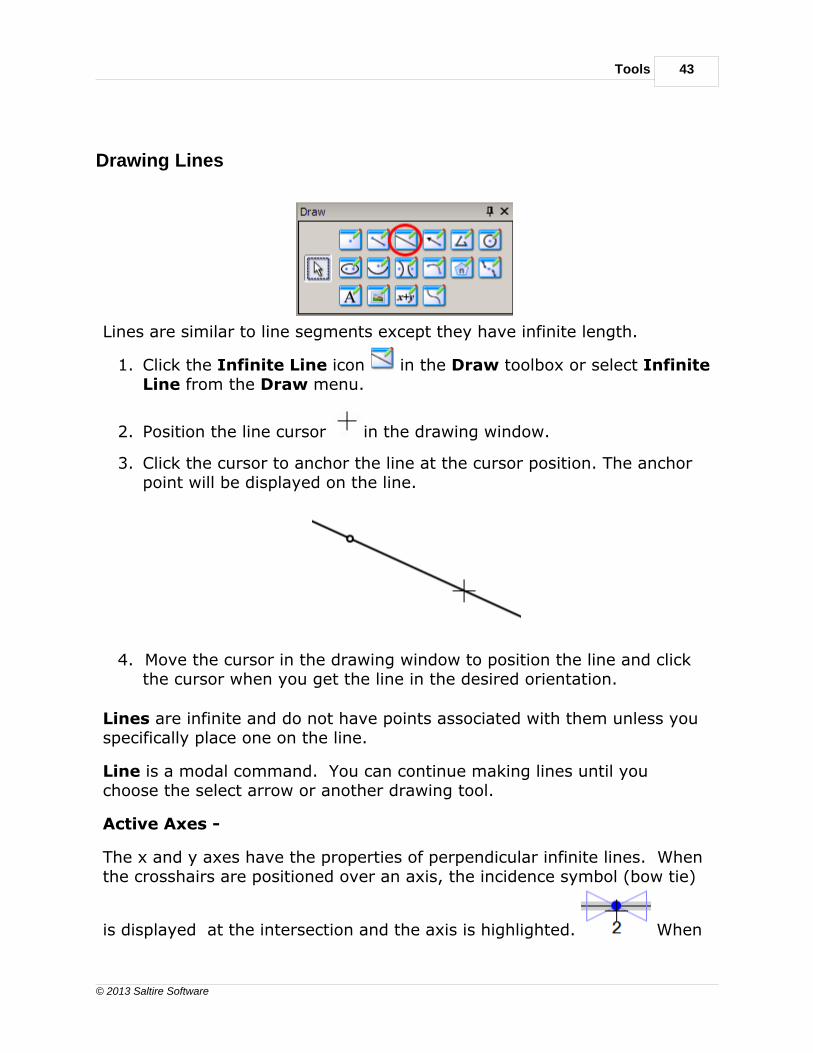
Drawing Lines
Lines are similar to line segments except they have infinite length.
1. Click the Infinite Line icon in the Draw toolbox or select InfiniteLine from the Draw menu.
2. Position the line cursor in the drawing window.
3. Click the cursor to anchor the line at the cursor position. The anchorpoint will be displayed on the line.
4. Move the cursor in the drawing window to position the line and clickthe cursor when you get the line in the desired orientation.
Lines are infinite and do not have points associated with them unless youspecifically place one on the line.
Line is a modal command. You can continue making lines until youchoose the select arrow or another drawing tool.
Active Axes -
The x and y axes have the properties of perpendicular infinite lines. Whenthe crosshairs are positioned over an axis, the incidence symbol (bow tie)
is displayed at the intersection and the axis is highlighted. When
44
© 2013 Saltire Software
Geometry Expressions Manual
the cursor is at the origin, both axes are highlighted . Points andEnd points of line segments can be placed directly on the axes withoutusing the Constrain / Incident tool when the bow tie is displayed.
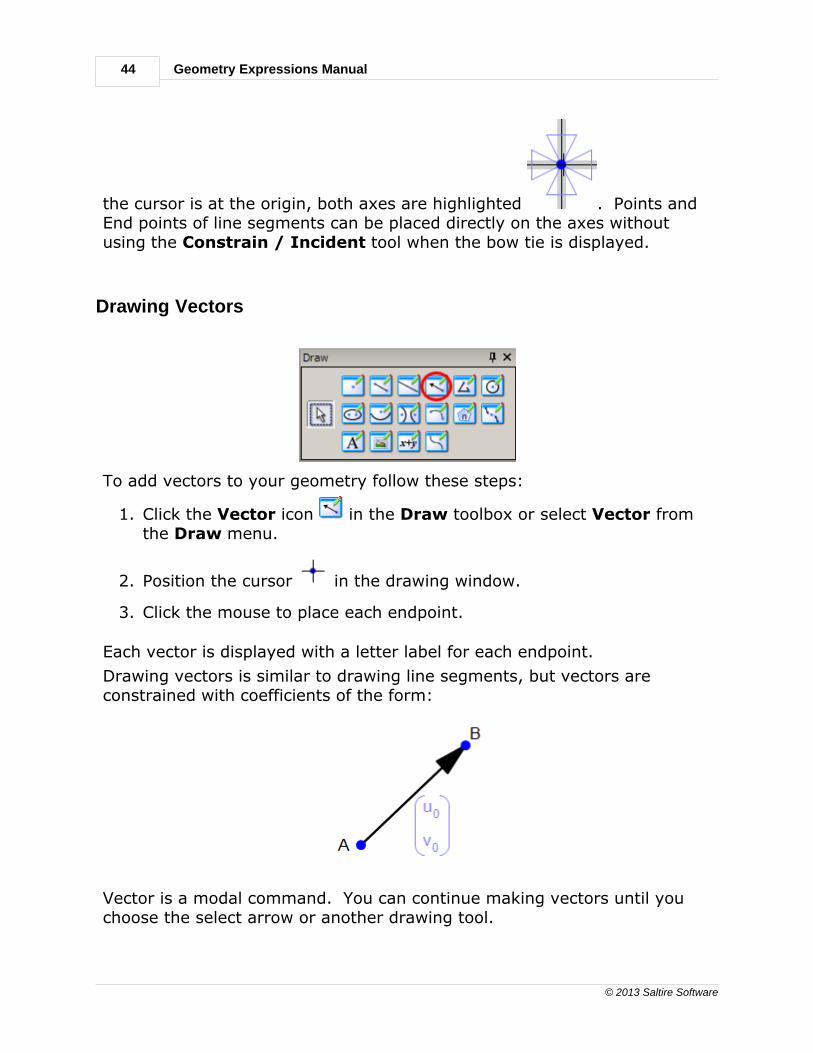
Drawing Vectors
To add vectors to your geometry follow these steps:
1. Click the Vector icon in the Draw toolbox or select Vector fromthe Draw menu.
2. Position the cursor in the drawing window.
3. Click the mouse to place each endpoint.
Each vector is displayed with a letter label for each endpoint.
Drawing vectors is similar to drawing line segments, but vectors are constrained with coefficients of the form:
Vector is a modal command. You can continue making vectors until youchoose the select arrow or another drawing tool.

Tools 45
© 2013 Saltire Software
Drawing Polygons
You can quickly create a multisided figure with these steps:
1. Click the Polygon icon in the Draw toolbox or select Polygonfrom the Draw menu.
2. Position the cursor in the drawing window.
3. Move the cursor and click once to place each vertex.
· As you create the sides of the polygon, each vertex isautomatically assigned a letter name. You can change the label in
Select mode.
· When you create the last side of the polygon by clicking on thefirst vertex, the polygon will be filled with the default fill color,style and transparency.
· To change the appearance of the polygon (color or style), select
it, right click, and choose All Properties from the contextmenu.
· Polygon is a modal command. You can continue making polygonsuntil you choose the select arrow or another drawing tool.
Polygons can be filled with the color, style, and transparency level of yourchoice. See the Edit /Preferences menu, Geometry tab to set thedefault. To change the color / style /transparency level of selectedpolygons, select the polygon(s), right-click, and select All Propertiesfrom the Selection Context menu (or Edit / Properties from the menubar).

46
© 2013 Saltire Software
Geometry Expressions Manual
Drawing Circles
To add a circle to your diagram, follow these steps:
1. Click the Circle icon in the Draw toolbox or select Circle from theDraw menu.
2. Move the cursor in the drawing window to the position of thecenter of the circle and click once.
3. Move the cursor to draw the circle in the desired size and click again.
Notice the circle is displayed with 2 points, the center and a point on theperimeter.
Circle is a modal command. You can continue making circles until youchoose the select arrow or another drawing tool.
You can adjust the circle in Select mode.
Circles can be filled with the color / transparency level of your choice. Seethe Edit /Preferences menu, Geometry tab to set the default. Tochange the color / transparency level of selected circles, select the circle(s), right-click, and select All Properties from the selection context menu(or Edit / Properties from the menu bar).
Tools 47
© 2013 Saltire Software
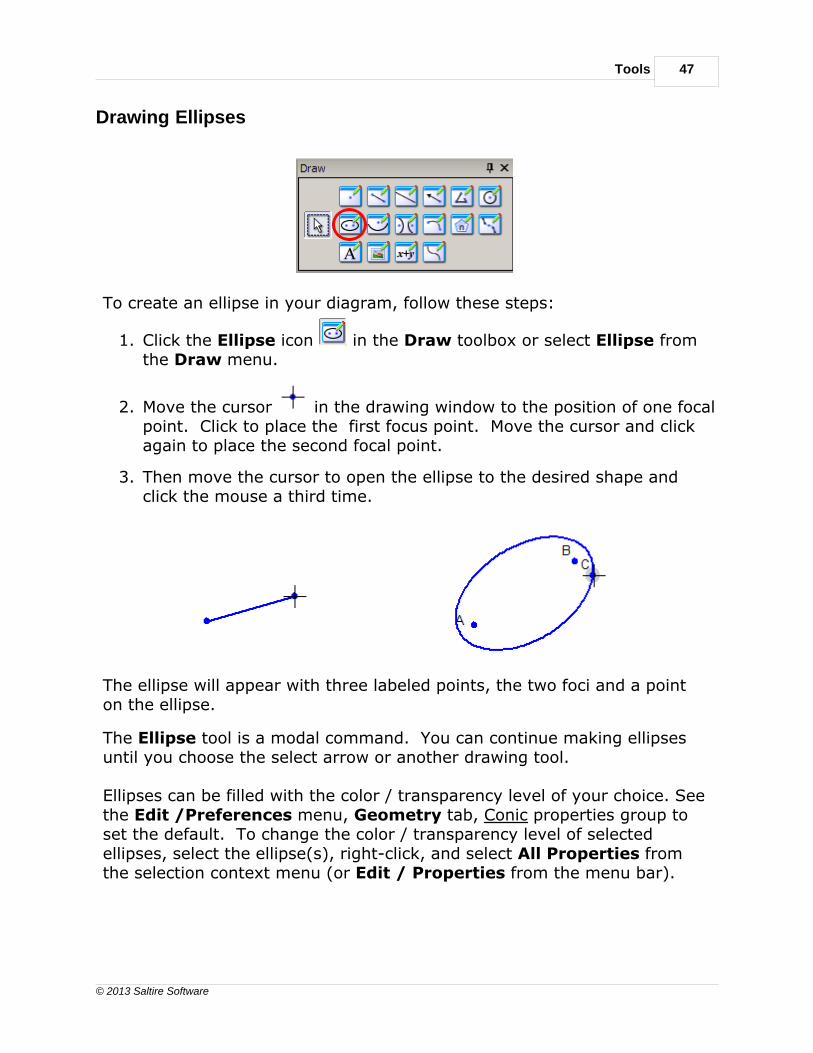
Drawing Ellipses
To create an ellipse in your diagram, follow these steps:
1. Click the Ellipse icon in the Draw toolbox or select Ellipse fromthe Draw menu.
2. Move the cursor in the drawing window to the position of one focalpoint. Click to place the first focus point. Move the cursor and clickagain to place the second focal point.
3. Then move the cursor to open the ellipse to the desired shape andclick the mouse a third time.
The ellipse will appear with three labeled points, the two foci and a pointon the ellipse.
The Ellipse tool is a modal command. You can continue making ellipsesuntil you choose the select arrow or another drawing tool.
Ellipses can be filled with the color / transparency level of your choice. Seethe Edit /Preferences menu, Geometry tab, Conic properties group toset the default. To change the color / transparency level of selectedellipses, select the ellipse(s), right-click, and select All Properties fromthe selection context menu (or Edit / Properties from the menu bar).

48
© 2013 Saltire Software
Geometry Expressions Manual
Drawing Parabolas
To create a parabola in your diagram, follow these steps:
1. Click the Parabola icon in the Draw toolbox or select Parabolafrom the Draw menu.
2. Move the cursor in the drawing window to the position of theparabola's vertex. Click and drag the mouse along the major axis. Release the mouse at the focus.
After sketching the general parabola, you can constrain it in the followingways:
1. Click the parabola and select Implicit equation from theConstrain toolbox and type or paste the formula.
2. Constrain the vertex and focus points to some coordinate values.

Tools 49
© 2013 Saltire Software
3. You can also adjust the parabola with the Translation, Rotation andDilation tools.
Drawing Hyperbolas
To create a hyperbola in your diagram, follow these steps:
1. Click the Hyperbola icon in the Draw toolbox or selectHyperbola from the Draw menu.
2. Move the cursor in the drawing window to the position of onefocal point. Click to place the first focus. Move the cursor and clickagain to place the second focal point.
3. Then move the cursor to open the hyperbola to the desired shapeand click the mouse a third time.

50
© 2013 Saltire Software
Geometry Expressions Manual
The hyperbola will appear with three labeled points, the two foci and apoint on the hyperbola.
The Hyperbola tool is a modal command. You can continue makinghyperbolas until you choose the select arrow or another drawing tool.
Drawing Arcs
Arcs can be placed on any of the conics - circle, ellipse, parabola,hyperbola - or any function. Points are automatically placed at the ends ofthe arc.
Here are the steps:
1. First draw the conic or function which will be the basis for the arc.
2. Choose the Arc tool and move the cursor over the section of theexisting curve where the arc will be defined. Click and drag thecursor over the curve.

Tools 51
© 2013 Saltire Software
Endpoints are automatically inserted on the arc.
Curvilinear Polygons
The Arc drawing tool lets you make curvilinear polygons for which you canassign fill properties and find areas. There are some limitations, however. Since you can't construct a point on two intersecting curves (except forcircles), you have to connect curves with line segments. If you want toconnect two arcs, you have to first connect them with a line and move itto the intersection like this:

52
© 2013 Saltire Software
Geometry Expressions Manual
To make a curvilinear polygon of the intersecting parabolas here are thesteps:
· Attach two lines.
· Make endpoints C and D -t point proportional along the curves.
· Make endpoints A and B t point proportional along the curves.
· Draw the two arcs - select Draw / Arc, from C to A and D to B.
· Select the sides and arcs of the polygon in order and click Construct / Polygon.
· Set t=2 in the Variables toolbox and the lines will become theintersection points.

Tools 53
© 2013 Saltire Software
54
© 2013 Saltire Software
Geometry Expressions Manual
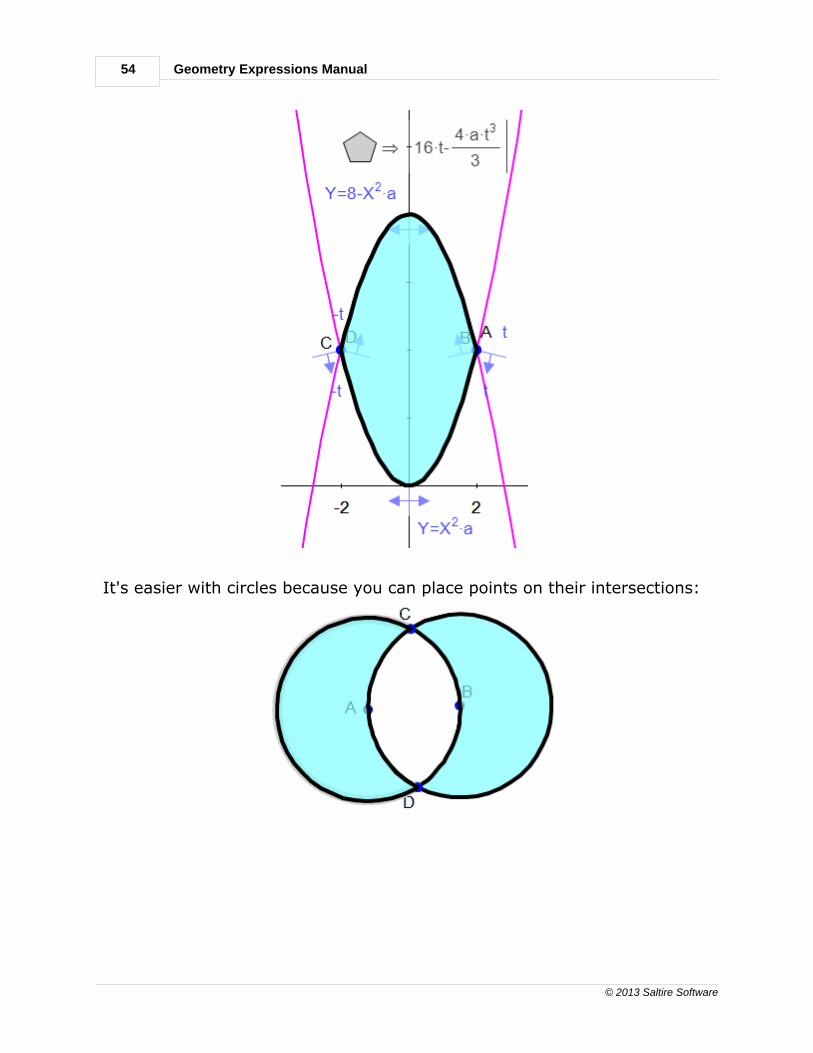
It's easier with circles because you can place points on their intersections:

Tools 55
© 2013 Saltire Software
Drawing Regular Polygons
The N-gon tool lets you quickly draw any regular polygon. You can evenwork on problems where the number of sides is n, or whatever variableyou choose.
Here are the steps:
1. Click the N-gon button in the Draw toolbox.
2. Similar to drawing a circle, position the cursor to place the center ofthe n-gon and click to the desired size. The n-gon at first appears tobe a pentagon.
3. In the data entry box, enter the number of sides you want or avariable to represent the number of sides and press Enter.

56
© 2013 Saltire Software
Geometry Expressions Manual
Drawing Curve Approximations
The Curve Approximation tool will insert a specified number of pointsand edges evenly spaced on a selected section of a curve or conic. This isa great tool for introducing problems using the Trapezoidal Method ofintegration. (Take a look at our Gx book, Calculus Explorations .)
Here are the steps:
1. Click Draw / Curve Approximation .
2. Select any function, circle, ellipse or parabola and drag the cursorover the curve.
3. In the data entry box type the number of points you want on the arc.
Note: It is best to draw your curve independent of existing points on thecurve. Then connect other geometry to the approximation points. If youstart or finish the arc with points lying on the curve (e.g. point C in theellipse above) and later decide to delete the curve approximation,attached geometry may also get deleted.

Tools 57
© 2013 Saltire Software
Here is the area of a function using the Trapezoidal Method:
Adding Text to the Drawing
To add titles or other annotation to the drawing follow these steps:
1. From the Draw toolbox click the Text icon or select Text fromthe Draw menu.
2. Position the text cursor at the upper left corner where you wouldlike your window of text located.
3. Click and drag to form your text box to the appropriate size.
58
© 2013 Saltire Software
Geometry Expressions Manual
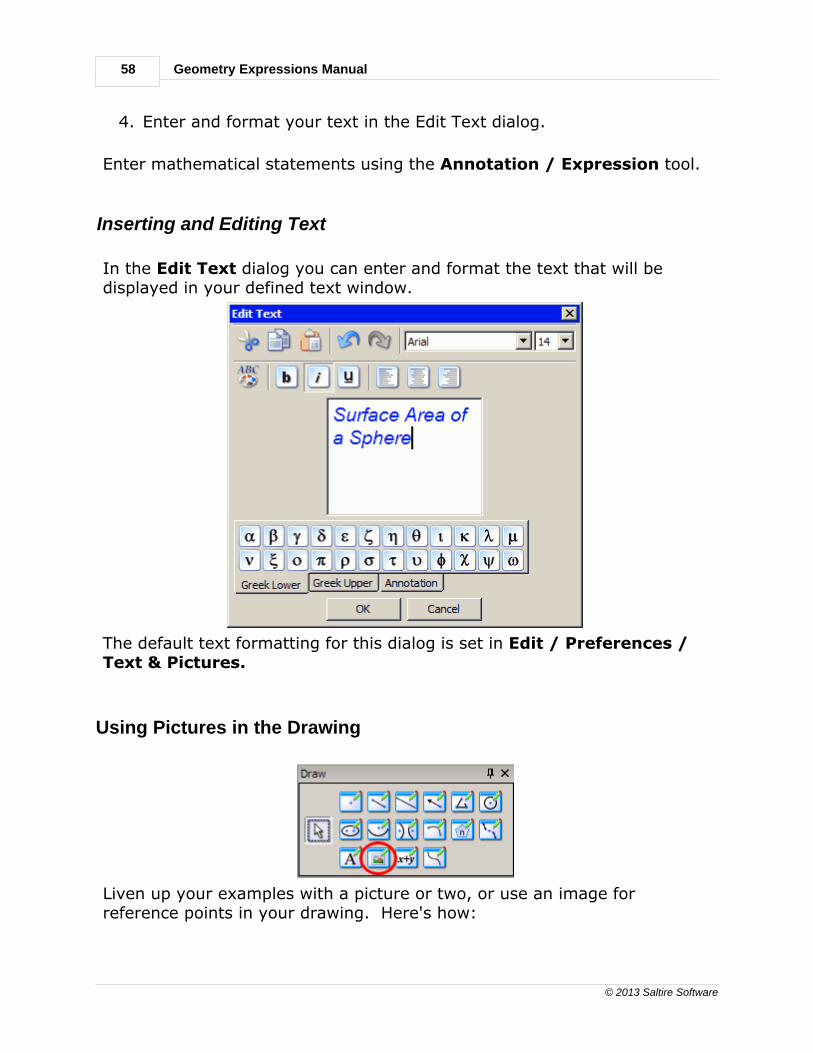
4. Enter and format your text in the Edit Text dialog.
Enter mathematical statements using the Annotation / Expression tool.
Inserting and Editing Text
In the Edit Text dialog you can enter and format the text that will bedisplayed in your defined text window.
The default text formatting for this dialog is set in Edit / Preferences /Text & Pictures.
Using Pictures in the Drawing
Liven up your examples with a picture or two, or use an image forreference points in your drawing. Here's how:

Tools 59
© 2013 Saltire Software
1. Click the Picture icon in the Draw toolbox or select Picturefrom the Draw menu.
2. Click and drag the cursor to delimit the area where you want to placethe picture.
3. Find your image in the Select Image File dialog. Image formatsinclude: .bmp, .gif, .jpg, .pcx, .png, and .tif
4. After entering your images, change to Select mode or chooseanother Draw command.
Pictures are always inserted under your drawing objects, so you can add apicture at any time.
In Select mode you can move a picture, as with any drawing object.
The inserted picture can be rotated and the transparency level can be setin the Display Properties dialog box.
· Right click on a highlighted picture and then select All Properties
· Or select Properties from Edit menu.
60
© 2013 Saltire Software
Geometry Expressions Manual
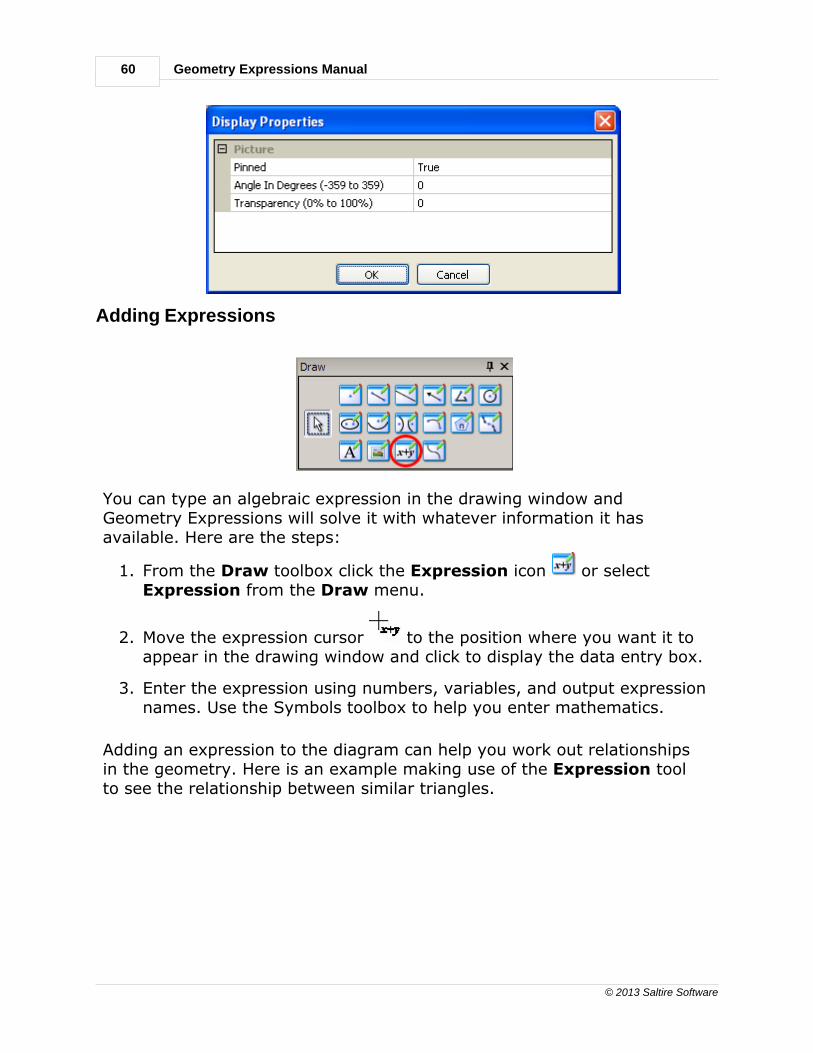
Adding Expressions
You can type an algebraic expression in the drawing window andGeometry Expressions will solve it with whatever information it hasavailable. Here are the steps:
1. From the Draw toolbox click the Expression icon or selectExpression from the Draw menu.
2. Move the expression cursor to the position where you want it toappear in the drawing window and click to display the data entry box.
3. Enter the expression using numbers, variables, and output expressionnames. Use the Symbols toolbox to help you enter mathematics.
Adding an expression to the diagram can help you work out relationshipsin the geometry. Here is an example making use of the Expression toolto see the relationship between similar triangles.

Tools 61
© 2013 Saltire Software
Sides a and b are perpendicular, and AC is perpendicular to BD. Weobtained the Output of lengths AD and BD using the Show Name button.
The expression to solve is the relationship of the two lengths: z0 / z1. The
system immediately evaluates the expression as => a/b.
Creating Functions
1. Click the Function icon in the Draw toolbox or select Functionfrom the Draw menu
2. Click the drop-down list button to select the function type that youwant to use in your drawing.

62
© 2013 Saltire Software
Geometry Expressions Manual
Cartesian Function
When you select Cartesian from the Function Type dialog, the next linecontains a general form of the function in terms of Y.
You can define a domain of the function by enter values for Start and End.If you want to draw function with indefinite domain, leave these fieldsblank.
You can define this function in these ways:
· Modify the formula directly:

Tools 63
© 2013 Saltire Software
· Modify the function interactively using "handles". In the drawingwindow, click the function to select it. Click and drag it and a circleappears on the curve. This handle represents one of the variables inthe equation. You can click and drag this handle around the drawing. Click and drag another place on the function and another moveablehandle appears if there is another variable in the equation.
This feature is a wonderful way to understand exactly how theequation represents the function.
In the first example, a click of the curve gives you the b handle, they-intercept, and lets you drag the function up and down. Click anddrag another place on the curve and you get the a handle to changethe shape of the curve.
Notice the Variable toolbox displays the changing values as youmove the handles.
· Modify the function after it's drawn by double clicking the function tagand changing it in the edit box.
· Modify the domain of the function after it's drawn by double clickingthe curve.

64
© 2013 Saltire Software
Geometry Expressions Manual
The Generic Function f(X)
To use the generic form of a function, Y=f(X), select Cartesian from theFunction Type dialog, enter f(X) in the edit window and click OK:
Click the Functions tab of the Variables toolbox to see the values usedin the function.
You can define this function in these ways:
· Modify the edit line at the bottom of the Functions tab. (Use yourkeyboard arrow keys to move through the whole function.)
· Modify the function interactively using "handles". In the drawingwindow, click the function to select it. Click and drag it and a circleappears on the curve. This handle represents one of the variables inthe equation. You can click and drag a handle around the drawing tochange the curve. Click and drag another place on the curve andanother moveable handle appears if there is another functionvariable in the equation. In the general function in this example wehave 5 possible handles: f(a), f(b), f(k), f(u), and f(v).

Tools 65
© 2013 Saltire Software
Polar Function
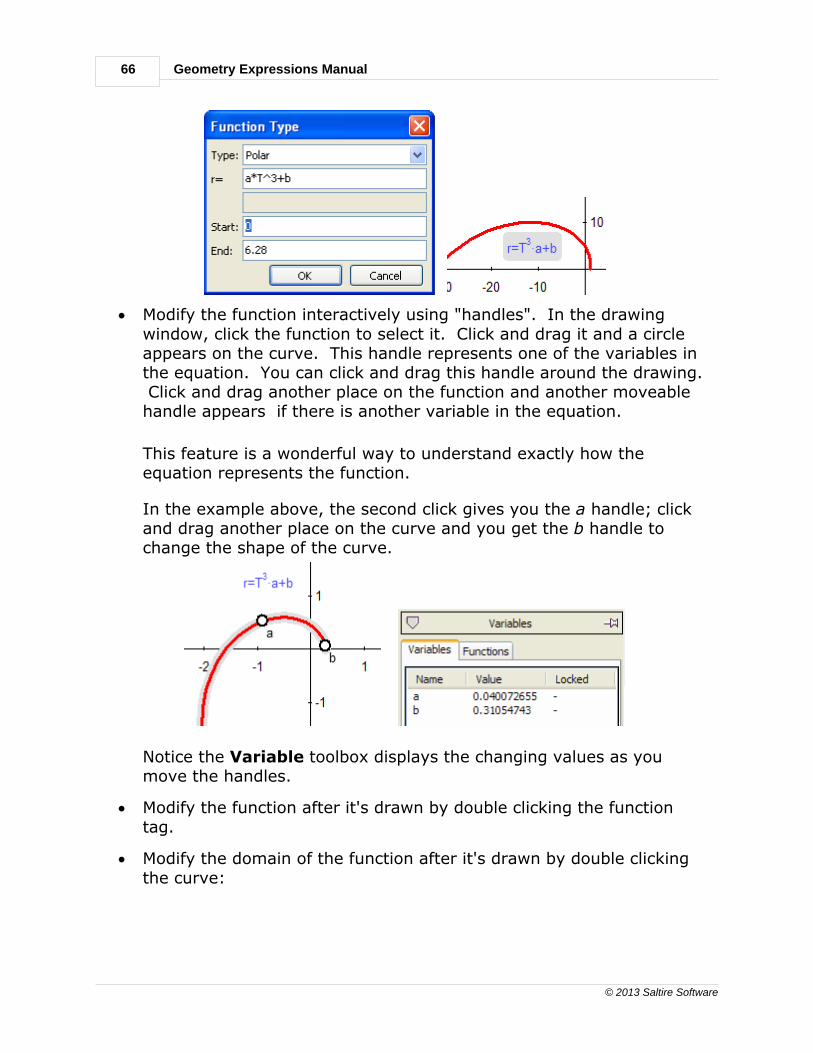
When you select Polar from the Function Type dialog, the next linecontains the general form of the function in terms of the radialcoordinate, r and the polar angle, T.
You can define this function in these ways:
· Modify the formula and the curve domain directly:
66
© 2013 Saltire Software
Geometry Expressions Manual
· Modify the function interactively using "handles". In the drawingwindow, click the function to select it. Click and drag it and a circleappears on the curve. This handle represents one of the variables inthe equation. You can click and drag this handle around the drawing. Click and drag another place on the function and another moveablehandle appears if there is another variable in the equation.
This feature is a wonderful way to understand exactly how theequation represents the function.
In the example above, the second click gives you the a handle; clickand drag another place on the curve and you get the b handle tochange the shape of the curve.
Notice the Variable toolbox displays the changing values as youmove the handles.
· Modify the function after it's drawn by double clicking the function tag.
· Modify the domain of the function after it's drawn by double clickingthe curve:
Tools 67
© 2013 Saltire Software
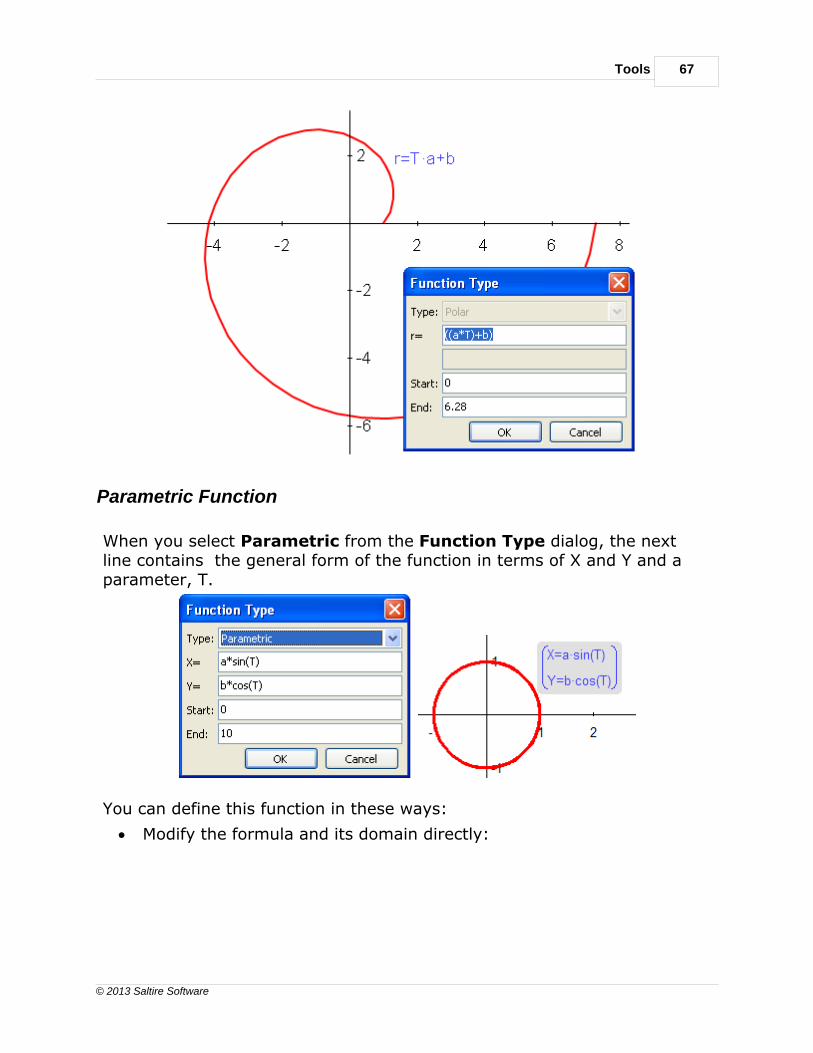
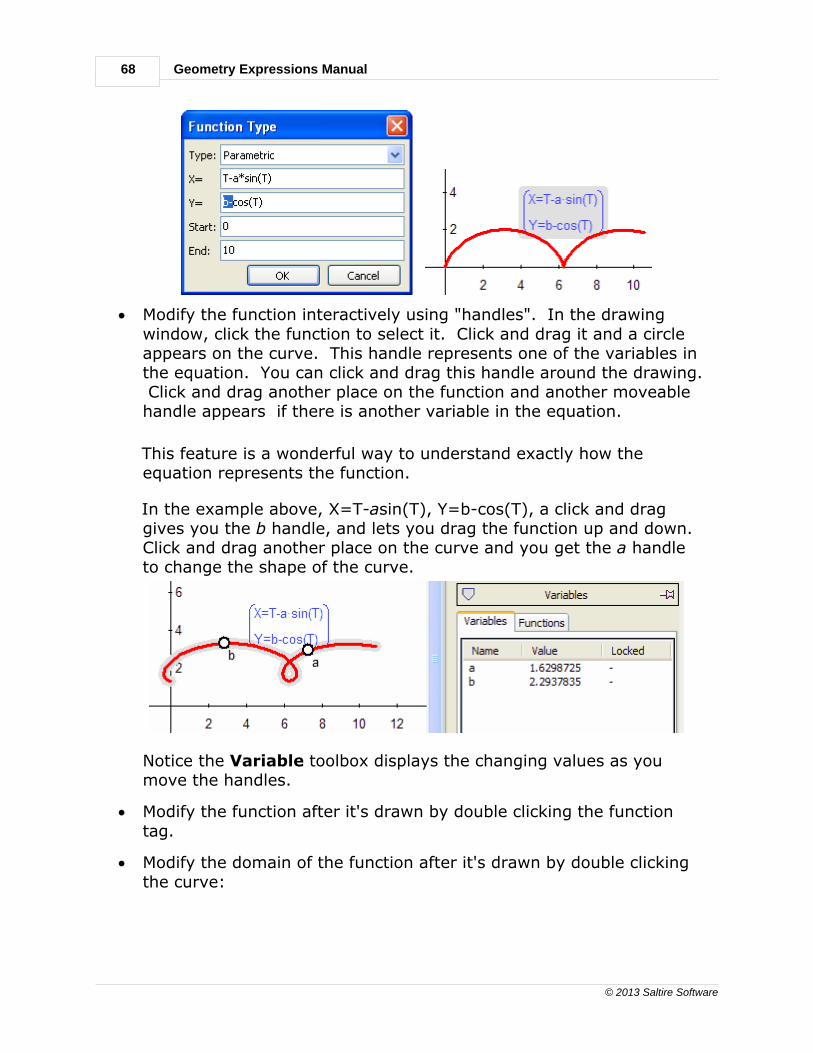
Parametric Function
When you select Parametric from the Function Type dialog, the nextline contains the general form of the function in terms of X and Y and aparameter, T.
You can define this function in these ways:
· Modify the formula and its domain directly:
68
© 2013 Saltire Software
Geometry Expressions Manual
· Modify the function interactively using "handles". In the drawingwindow, click the function to select it. Click and drag it and a circleappears on the curve. This handle represents one of the variables inthe equation. You can click and drag this handle around the drawing. Click and drag another place on the function and another moveablehandle appears if there is another variable in the equation.
This feature is a wonderful way to understand exactly how theequation represents the function.
In the example above, X=T-asin(T), Y=b-cos(T), a click and draggives you the b handle, and lets you drag the function up and down.Click and drag another place on the curve and you get the a handleto change the shape of the curve.
Notice the Variable toolbox displays the changing values as youmove the handles.
· Modify the function after it's drawn by double clicking the functiontag.
· Modify the domain of the function after it's drawn by double clickingthe curve:

Tools 69
© 2013 Saltire Software
Piecewise Function
A piecewise function or expression can be created using the Piecewisesymbol:
or the built-in function - piecewise({expression1, domain1},{expression2,domain2}...,{last expression, otherwise}). The reserved word,"otherwise" is an option available for the last condition.
Here we show how to enter the sequence of values, followed byconditions:
· Create a function.
· Double click the equationto edit.
70
© 2013 Saltire Software
Geometry Expressions Manual
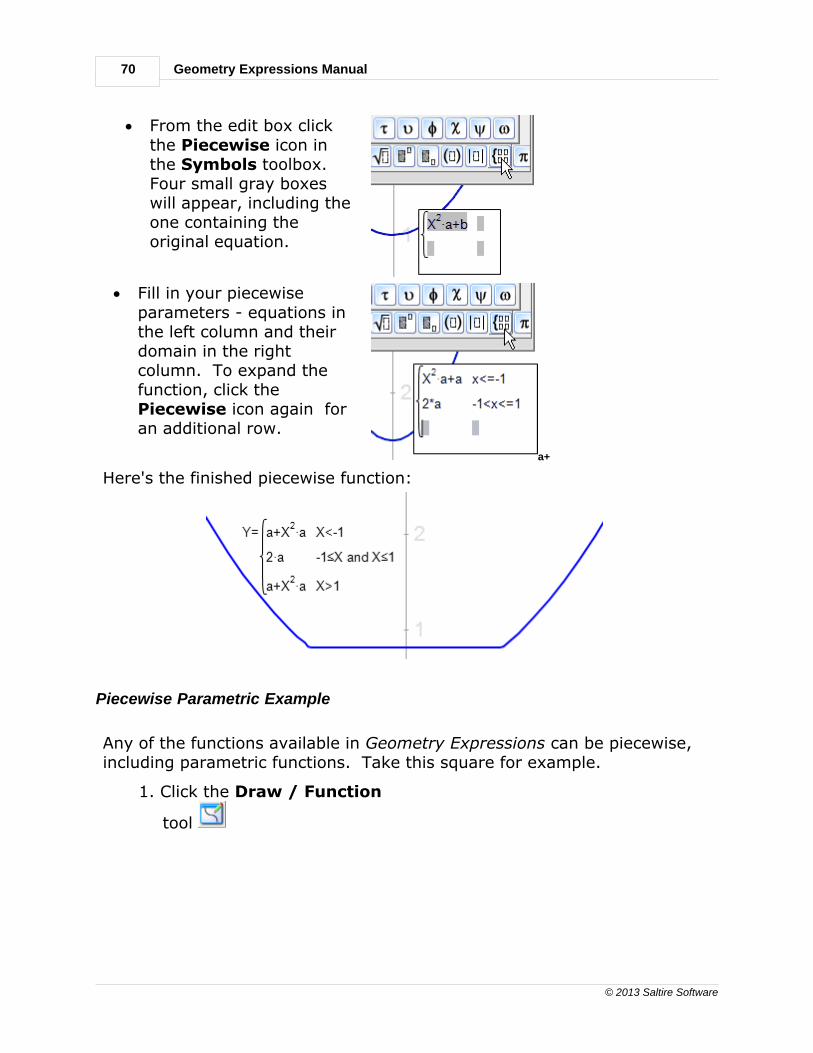
· From the edit box clickthe Piecewise icon inthe Symbols toolbox.Four small gray boxeswill appear, including theone containing theoriginal equation.
· Fill in your piecewiseparameters - equations inthe left column and theirdomain in the rightcolumn. To expand thefunction, click the Piecewise icon again foran additional row.
a+
Here's the finished piecewise function:
Piecewise Parametric Example
Any of the functions available in Geometry Expressions can be piecewise,including parametric functions. Take this square for example.
1. Click the Draw / Function
tool

Tools 71
© 2013 Saltire Software
2. Select Parametric from thedrop down Type window.
3. Enter the first value (side) forthe square and the range forthe parameter values -
Hit enter. Don't worry aboutthe shape of the function, it'snot defined yet.
4. Double-click the function andselect the x value
5. Click the Piecewise icon
6. Enter the x values for eachside of the square. Whenyou run out of gray boxes,click the Piecewise iconagain to get another row. -
72
© 2013 Saltire Software
Geometry Expressions Manual
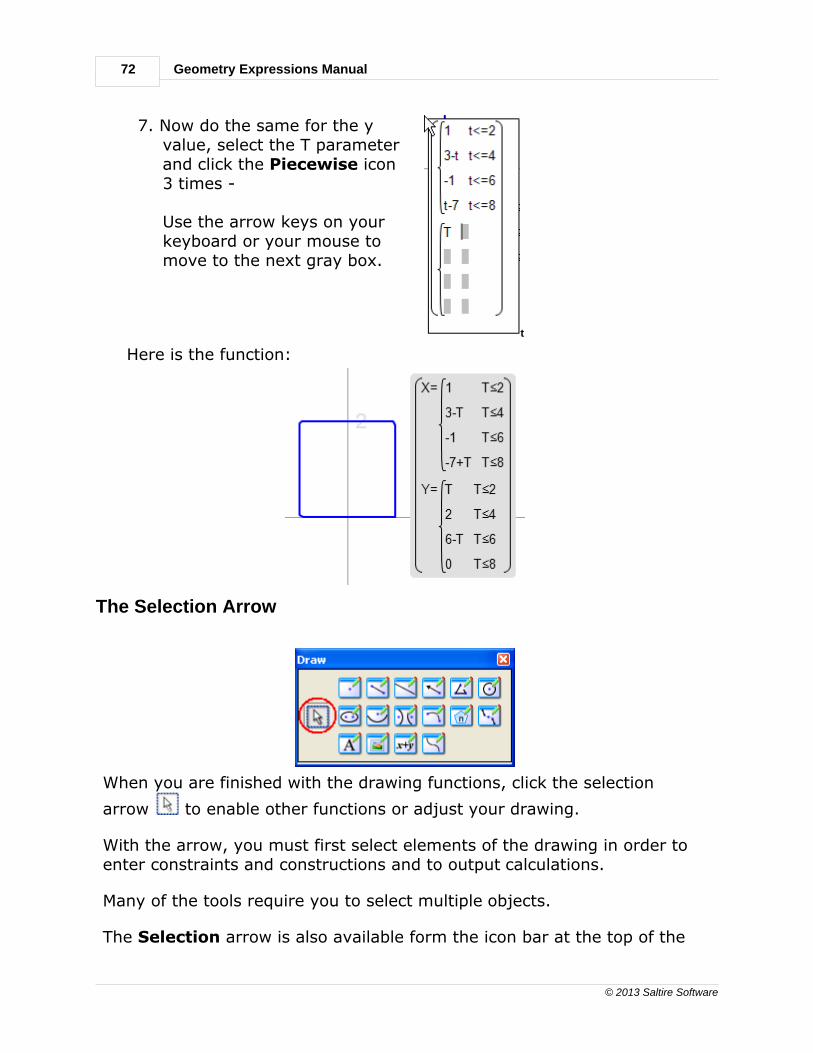
7. Now do the same for the yvalue, select the T parameterand click the Piecewise icon3 times -
Use the arrow keys on yourkeyboard or your mouse tomove to the next gray box.
t
Here is the function:
The Selection Arrow
When you are finished with the drawing functions, click the selection
arrow to enable other functions or adjust your drawing.
With the arrow, you must first select elements of the drawing in order toenter constraints and constructions and to output calculations.
Many of the tools require you to select multiple objects.
The Selection arrow is also available form the icon bar at the top of the

Tools 73
© 2013 Saltire Software
screen.
Selecting Multiple Objects
Many of the Constrain, Construct, and Calculate tools require that youselect more than one object.
To select more than one object:
· Click the selection arrow on the tool bar.
· Hold down the CTRL or SHIFT key as you click the objects you want toselect.
If you click the wrong object while holding down the CTRL key, click itagain and it will become unselected.
If all of the objects you wish to select fall within a rectangular region, youcan use the selection box:
· Click on the selection arrow on the tool bar or the Drawingtoolbox.
· Draw a rectangle around all of the objects by clicking and dragging.
If you are using Geometry Expressions on a Smartboard, turn onSmartboard mode to make multiple selections without using the Ctrl orShift keys. In this mode selections accumulate. Clicking a blank space inthe drawing does not clear the selections. Clicking on an item a secondtime unselects only that item.
74
© 2013 Saltire Software
Geometry Expressions Manual
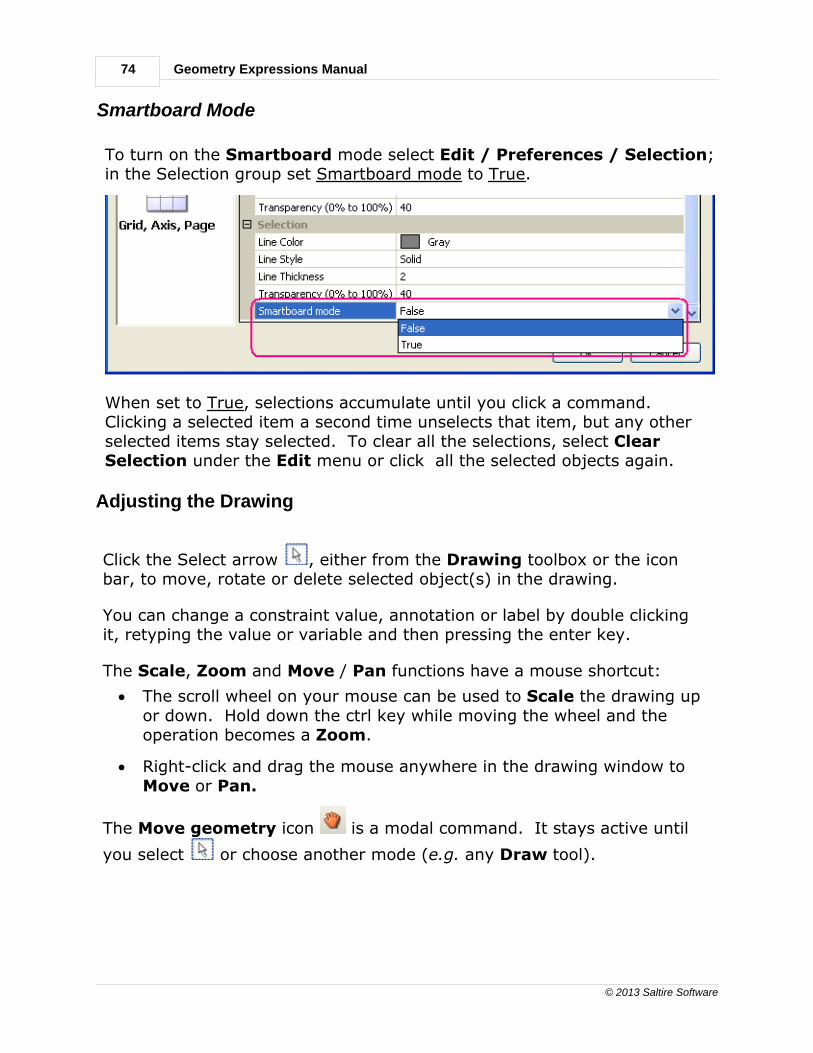
Smartboard Mode
To turn on the Smartboard mode select Edit / Preferences / Selection;in the Selection group set Smartboard mode to True.
When set to True, selections accumulate until you click a command.Clicking a selected item a second time unselects that item, but any otherselected items stay selected. To clear all the selections, select ClearSelection under the Edit menu or click all the selected objects again.
Adjusting the Drawing
Click the Select arrow , either from the Drawing toolbox or the iconbar, to move, rotate or delete selected object(s) in the drawing.
You can change a constraint value, annotation or label by double clickingit, retyping the value or variable and then pressing the enter key.
The Scale, Zoom and Move / Pan functions have a mouse shortcut:
· The scroll wheel on your mouse can be used to Scale the drawing upor down. Hold down the ctrl key while moving the wheel and theoperation becomes a Zoom.
· Right-click and drag the mouse anywhere in the drawing window to Move or Pan.
The Move geometry icon is a modal command. It stays active until
you select or choose another mode (e.g. any Draw tool).
Tools 75
© 2013 Saltire Software
Constraints
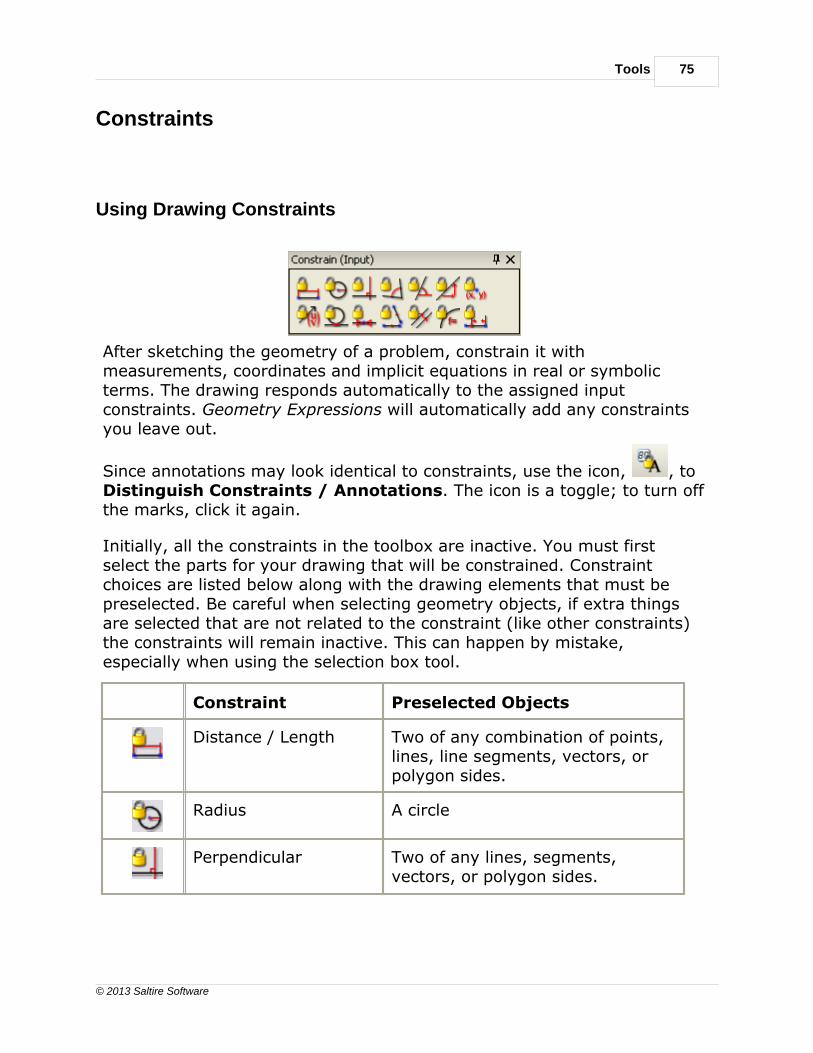
Using Drawing Constraints
After sketching the geometry of a problem, constrain it withmeasurements, coordinates and implicit equations in real or symbolicterms. The drawing responds automatically to the assigned inputconstraints. Geometry Expressions will automatically add any constraintsyou leave out.
Since annotations may look identical to constraints, use the icon, , toDistinguish Constraints / Annotations. The icon is a toggle; to turn offthe marks, click it again.
Initially, all the constraints in the toolbox are inactive. You must firstselect the parts for your drawing that will be constrained. Constraintchoices are listed below along with the drawing elements that must bepreselected. Be careful when selecting geometry objects, if extra thingsare selected that are not related to the constraint (like other constraints)the constraints will remain inactive. This can happen by mistake,especially when using the selection box tool.
Constraint Preselected Objects
Distance / Length Two of any combination of points,lines, line segments, vectors, orpolygon sides.
Radius A circle
Perpendicular Two of any lines, segments,vectors, or polygon sides.
76
© 2013 Saltire Software
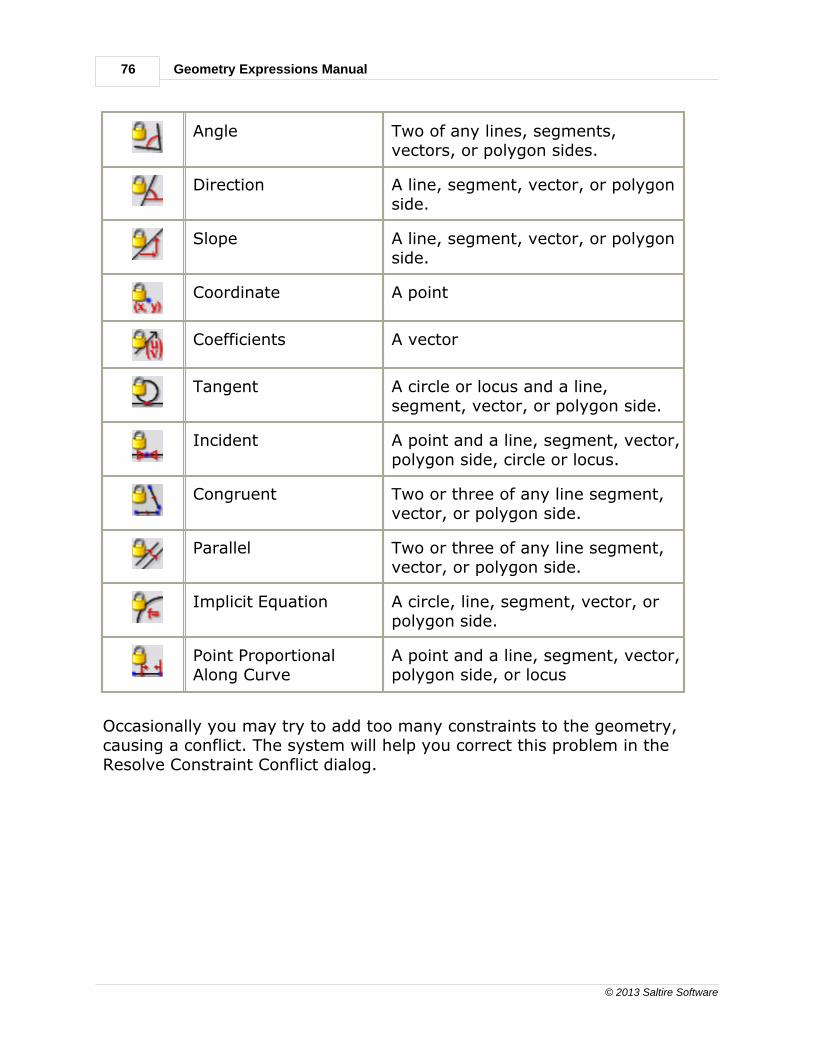
Geometry Expressions Manual
Angle Two of any lines, segments,vectors, or polygon sides.
Direction A line, segment, vector, or polygonside.
Slope A line, segment, vector, or polygonside.
Coordinate A point
Coefficients A vector
Tangent A circle or locus and a line,segment, vector, or polygon side.
Incident A point and a line, segment, vector,polygon side, circle or locus.
Congruent Two or three of any line segment,vector, or polygon side.
Parallel Two or three of any line segment,vector, or polygon side.
Implicit Equation A circle, line, segment, vector, orpolygon side.
Point ProportionalAlong Curve
A point and a line, segment, vector,polygon side, or locus
Occasionally you may try to add too many constraints to the geometry,causing a conflict. The system will help you correct this problem in the Resolve Constraint Conflict dialog.
Tools 77
© 2013 Saltire Software
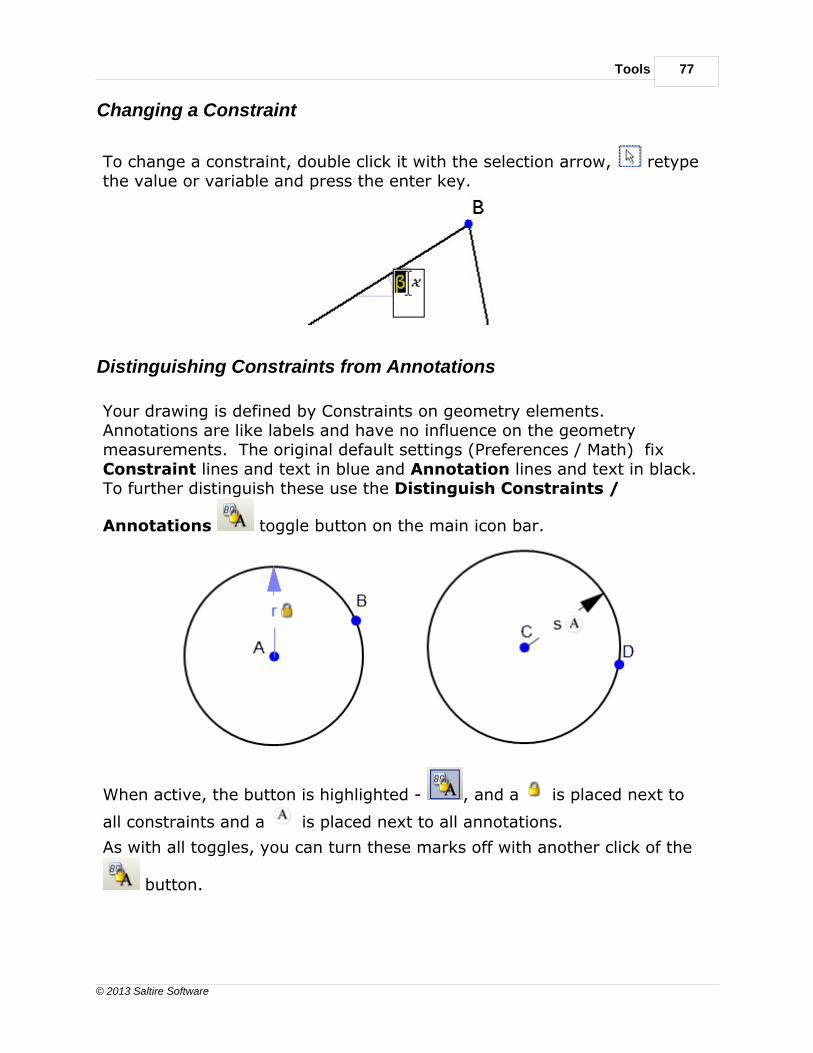
Changing a Constraint
To change a constraint, double click it with the selection arrow, retypethe value or variable and press the enter key.
Distinguishing Constraints from Annotations
Your drawing is defined by Constraints on geometry elements. Annotations are like labels and have no influence on the geometrymeasurements. The original default settings (Preferences / Math) fixConstraint lines and text in blue and Annotation lines and text in black.To further distinguish these use the Distinguish Constraints /
Annotations toggle button on the main icon bar.
When active, the button is highlighted - , and a is placed next to
all constraints and a is placed next to all annotations.
As with all toggles, you can turn these marks off with another click of the
button.

78
© 2013 Saltire Software
Geometry Expressions Manual
System Added Constraints
In Geometry Expressions, you do not need to fully constrain your model.Any parameters you have left unconstrained are filled in by the geometryengine.
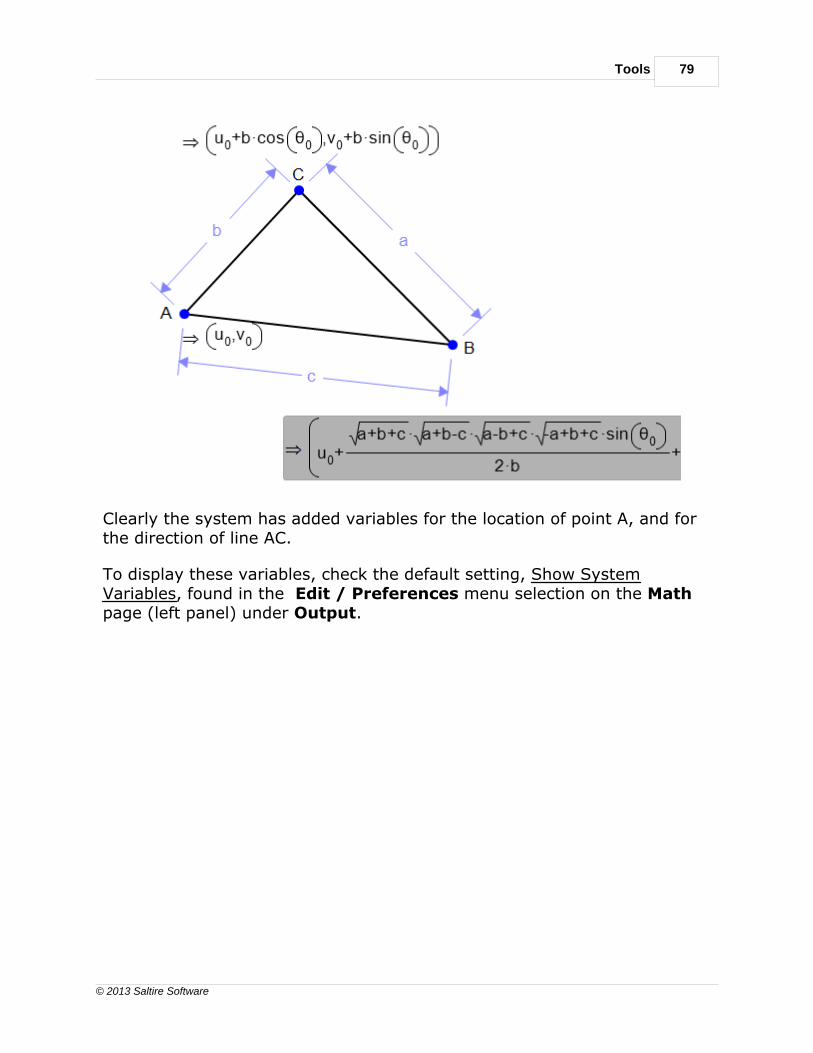
For example, the following drawing is constrained only modulo a rigidtransformation (typical for many geometry problems).
So if you ask for the coordinates of any of the points, they will be given interms of system added variables:
Tools 79
© 2013 Saltire Software
Clearly the system has added variables for the location of point A, and forthe direction of line AC.
To display these variables, check the default setting, Show SystemVariables, found in the Edit / Preferences menu selection on the Mathpage (left panel) under Output.

80
© 2013 Saltire Software
Geometry Expressions Manual
When the setting is True, you will see the system variables when youselect the output:

Tools 81
© 2013 Saltire Software
Constraint Conflicts
If you enter a constraint for some geometry which is already constrainedby another constrained object you will see a message like the one below.
In this case, the Coordinate constraint was already determined by theother two sides and an angle constraint on the triangle. There are threeways of dealing with this problem:
1. Hit the Cancel button to leave the drawing as it was without the new
82
© 2013 Saltire Software
Geometry Expressions Manual
constraint.
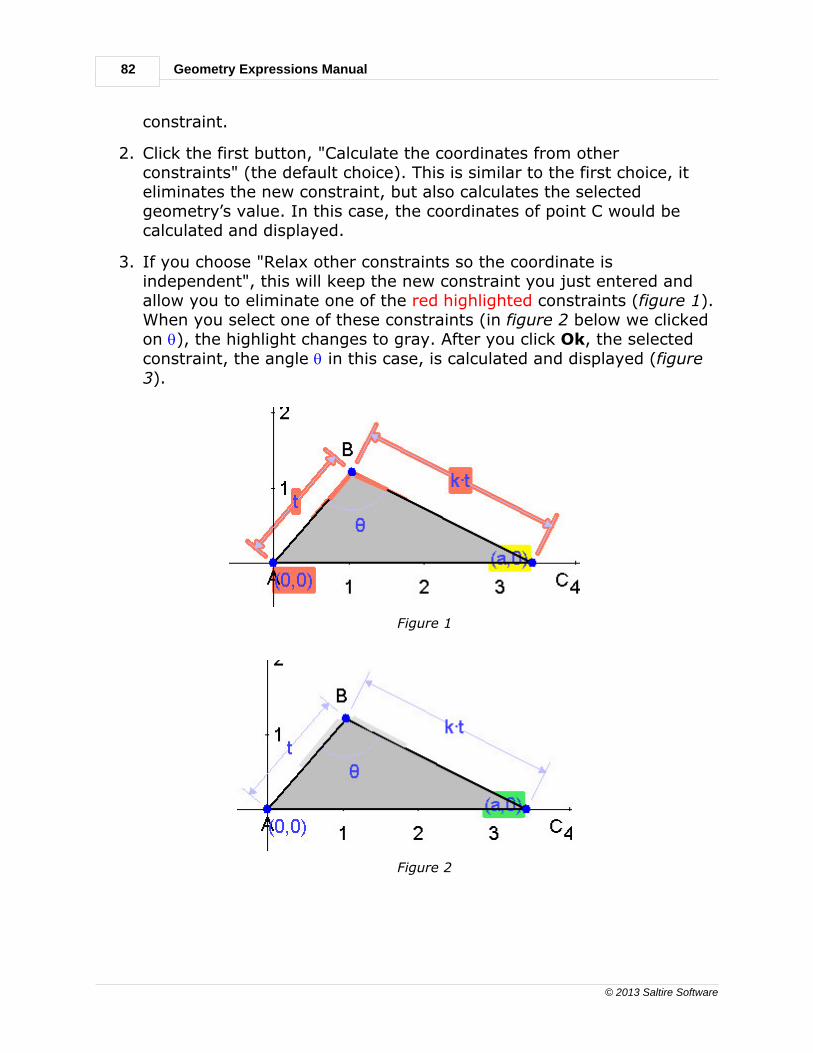
2. Click the first button, "Calculate the coordinates from otherconstraints" (the default choice). This is similar to the first choice, iteliminates the new constraint, but also calculates the selectedgeometry’s value. In this case, the coordinates of point C would becalculated and displayed.
3. If you choose "Relax other constraints so the coordinate isindependent", this will keep the new constraint you just entered andallow you to eliminate one of the red highlighted constraints (figure 1).When you select one of these constraints (in figure 2 below we clickedon q), the highlight changes to gray. After you click Ok, the selectedconstraint, the angle q in this case, is calculated and displayed (figure3).
Figure 1
Figure 2

Tools 83
© 2013 Saltire Software
Figure 3
Distance / Length Constraint
The Distance / Length constraint lets you specify the followingdimensions:
· Length of a line segment, vector, or polygon side
· Distance between two points or a point and any one of the line typeslisted above.
· To enter a constraint:
1. Select the appropriate drawing object(s). When you make your
selection, the Distance / Length icon will light up .
2. Click the icon, enter the constraint value, either real or symbolic,and press enter. You can press enter without typing a value toaccept the system's default value.
You can click the constraint and drag it to adjust its placement on thedrawing.
84
© 2013 Saltire Software
Geometry Expressions Manual
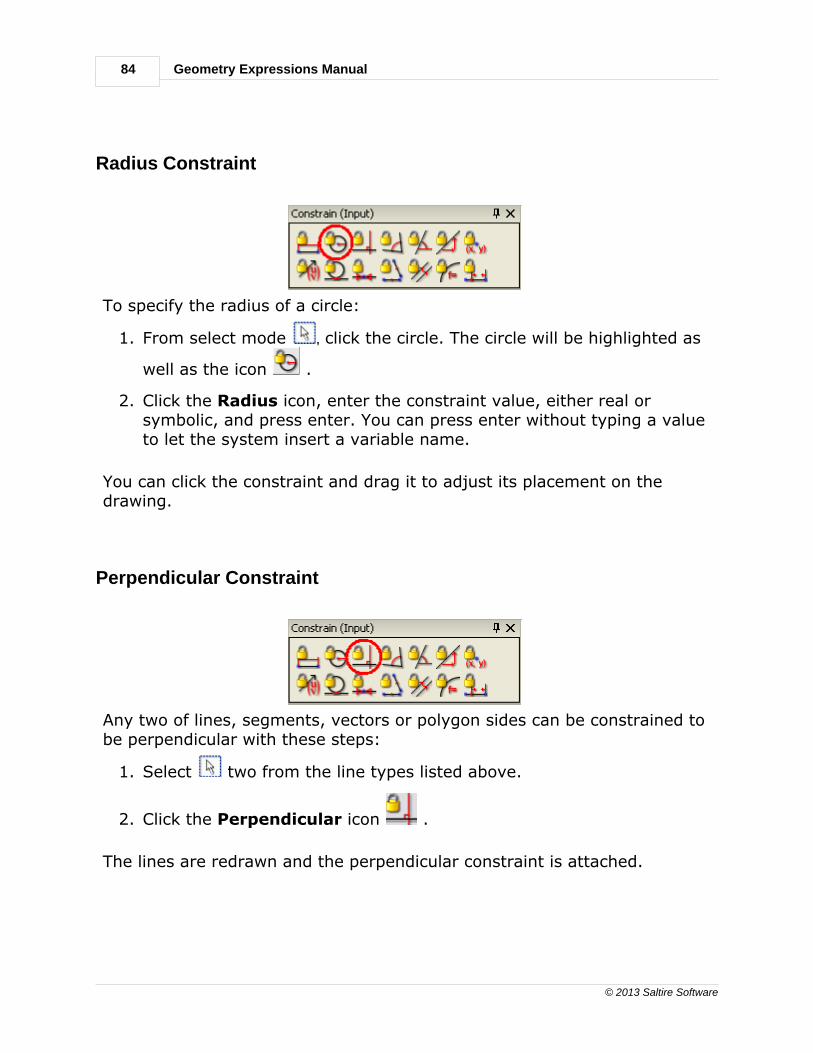
Radius Constraint
To specify the radius of a circle:
1. From select mode , click the circle. The circle will be highlighted as
well as the icon .
2. Click the Radius icon, enter the constraint value, either real orsymbolic, and press enter. You can press enter without typing a valueto let the system insert a variable name.
You can click the constraint and drag it to adjust its placement on thedrawing.
Perpendicular Constraint
Any two of lines, segments, vectors or polygon sides can be constrained tobe perpendicular with these steps:
1. Select two from the line types listed above.
2. Click the Perpendicular icon .
The lines are redrawn and the perpendicular constraint is attached.

Tools 85
© 2013 Saltire Software
Angle Constraint
Any two of lines, segments, vectors or polygon sides can be constrainedwith an angle value or variable name with these steps:
1. Select two from the line types listed above.
2. Click the Angle icon .
3. Enter the constraint, real or symbolic. If you enter a real value, thelines will be adjusted to reflect the constraint.
Which Side to Constrain?
Sometimes when identifying angles, the constraint falls on the wrong one.In the example below, we wanted BDC, not BDA. Just click the cursorover the constraint arrow and drag it to the other side, then release themouse button - done!
Note: The angular units are displayed in the lower right of the screen.Change the default Angle Mode in the Edit / Preferences / MathProperties menu, Math settings group.
86
© 2013 Saltire Software
Geometry Expressions Manual
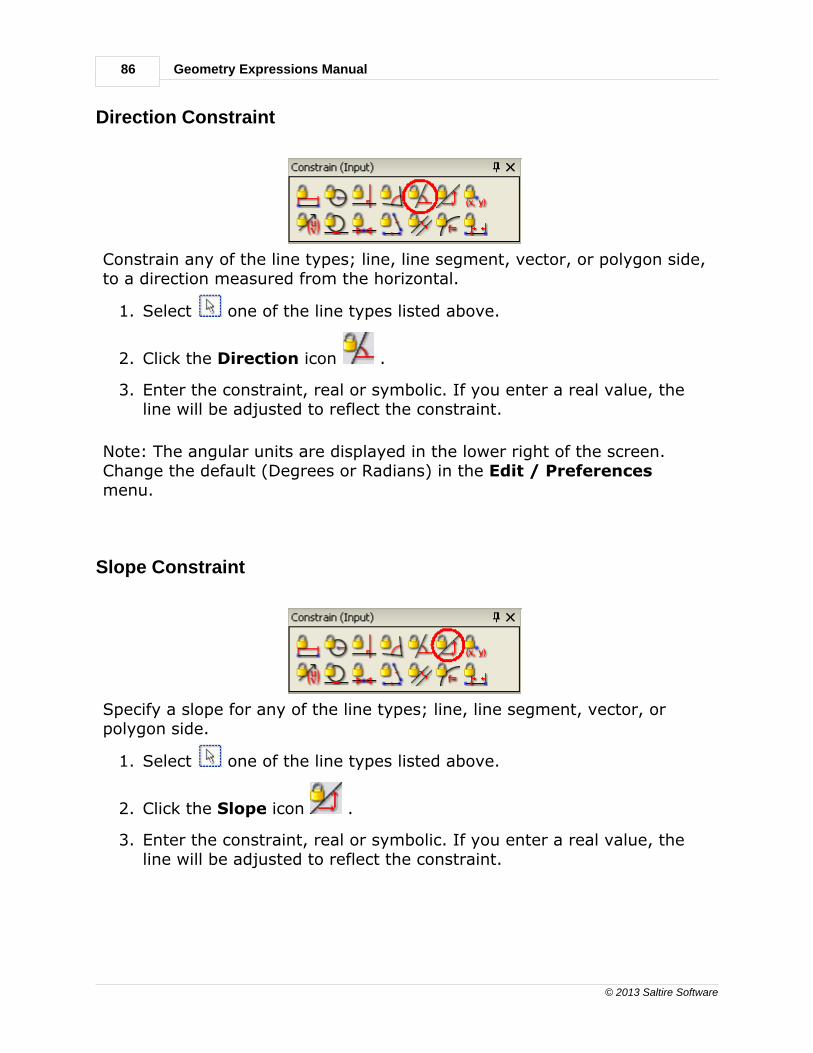
Direction Constraint
Constrain any of the line types; line, line segment, vector, or polygon side,to a direction measured from the horizontal.
1. Select one of the line types listed above.
2. Click the Direction icon .
3. Enter the constraint, real or symbolic. If you enter a real value, theline will be adjusted to reflect the constraint.
Note: The angular units are displayed in the lower right of the screen.Change the default (Degrees or Radians) in the Edit / Preferencesmenu.
Slope Constraint
Specify a slope for any of the line types; line, line segment, vector, orpolygon side.
1. Select one of the line types listed above.
2. Click the Slope icon .
3. Enter the constraint, real or symbolic. If you enter a real value, theline will be adjusted to reflect the constraint.

Tools 87
© 2013 Saltire Software
Coordinate Constraint
You can give coordinates to any point in your drawing:
1. Select a point.
2. Click the Coordinate icon .
3. Enter the constraint, real or symbolic. If you enter a real value, theline will be adjusted to reflect the constraint, even if the coordinateaxes are not displayed.
To change the coordinates shown, double click and type over thehighlighted value in the data entry box.
Constraining Vector Coeffecients
You can specify coefficients for a vector with the following steps:
1. Select a vector.
2. Click the coefficients icon .
3. Enter the coefficients separated by a comma.
Note: Don't forget the parentheses or an error message appears.

88
© 2013 Saltire Software
Geometry Expressions Manual
Tangent Constraint
Any of the line types; line, line segment, vector, or polygon side can bemade tangent to a circle or locus with these steps:
1. Select a line of the types listed above and the circle or locus.
2. Click the Tangent icon from the Constrain tool box or selectTangent from the Constrain menu.
The line and curve immediately become tangent.
Incident Constraint
Constrain a point to be incident to any other geometry; line, segment,vector, polygon side, circle or locus with these steps:
1. Select the point and the other geometry listed above.
2. Click the Incident icon from the Constrain toolbox, or selectIncident from the Constrain menu.
The point is moved to meet the line or curve, or the extension of the line.
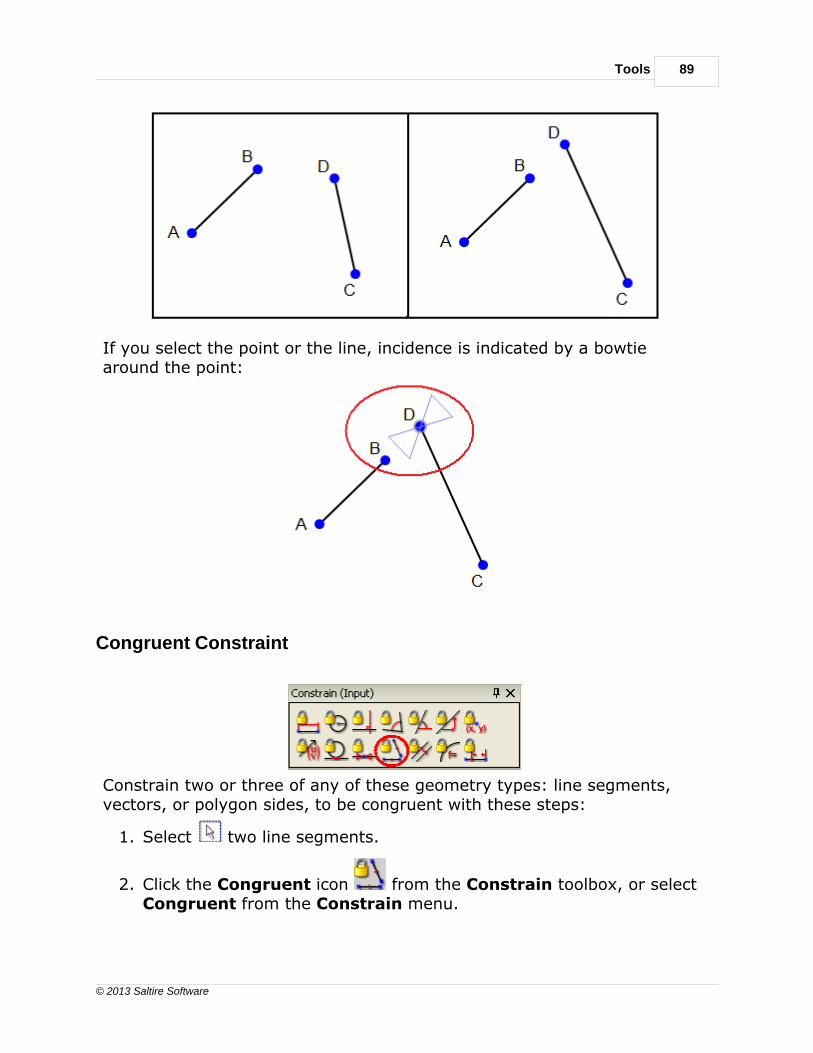
Below is an example of the latter, point D is moved to lie on the extensionof line segment AB.
Tools 89
© 2013 Saltire Software
If you select the point or the line, incidence is indicated by a bowtiearound the point:
Congruent Constraint
Constrain two or three of any of these geometry types: line segments,vectors, or polygon sides, to be congruent with these steps:
1. Select two line segments.
2. Click the Congruent icon from the Constrain toolbox, or selectCongruent from the Constrain menu.

90
© 2013 Saltire Software
Geometry Expressions Manual
You will see matching congruency lines on the selected segments and alength will be adjusted.
Parallel Constraint
Any two or three of the linear geometry types can be made parallel: line,segment, vector, or polygon side.
1. Select two or three from the types listed above.
2. Click the Parallel icon from the Constrain toolbox, or selectParallel from the Constrain menu.
The geometry will be adjusted and matching symbols
appear on the selected lines.

Tools 91
© 2013 Saltire Software
Implicit Equation Constraint
You can use symbolic variables to constrain geometry with an implicitequation. Lines, line segments, polygon sides, vectors and circles andconics can all be constrained with implicit equations.
1. Select the geometry.
2. Click the Implicit Equation icon from the Constrain toolbox, orselect Implicit Equation from the Constrain menu.
An input window will open next to the geometry you selected. Highlightedin the window is a generic equation for the selected object; for a line, anequation like - XA1+YB1+C1 = 0 might appear. You can edit the equation
with different variable names or coefficients as you like. You will find thesevariables added to the variable list in the Variables toolbox.
Point Proportional Along a Curve Constraint
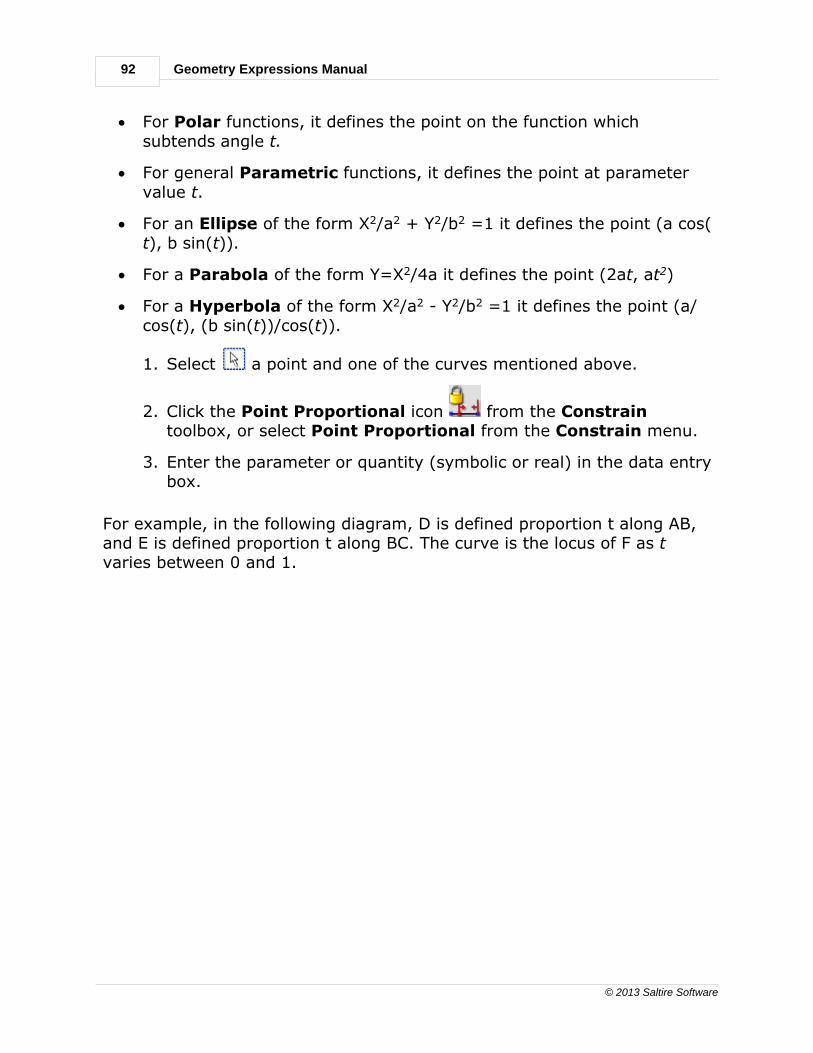
A point proportion t along a curve is defined variously for different types ofcurves as follows:
· For a Line segment AB, it defines the point (1-t)•A + t•B
· For a Circle it defines the point on the circle which subtends angle t atthe center.
· For a Locus or envelope, it defines the point at parameter value t.
· For general Cartesian functions, it defines the x value of the point onthe function.
92
© 2013 Saltire Software
Geometry Expressions Manual
· For Polar functions, it defines the point on the function whichsubtends angle t.
· For general Parametric functions, it defines the point at parametervalue t.
· For an Ellipse of the form X2/a2 + Y2/b2 =1 it defines the point (a cos(t), b sin(t)).
· For a Parabola of the form Y=X2/4a it defines the point (2at, at2)
· For a Hyperbola of the form X2/a2 - Y2/b2 =1 it defines the point (a/cos(t), (b sin(t))/cos(t)).
1. Select a point and one of the curves mentioned above.
2. Click the Point Proportional icon from the Constraintoolbox, or select Point Proportional from the Constrain menu.
3. Enter the parameter or quantity (symbolic or real) in the data entrybox.
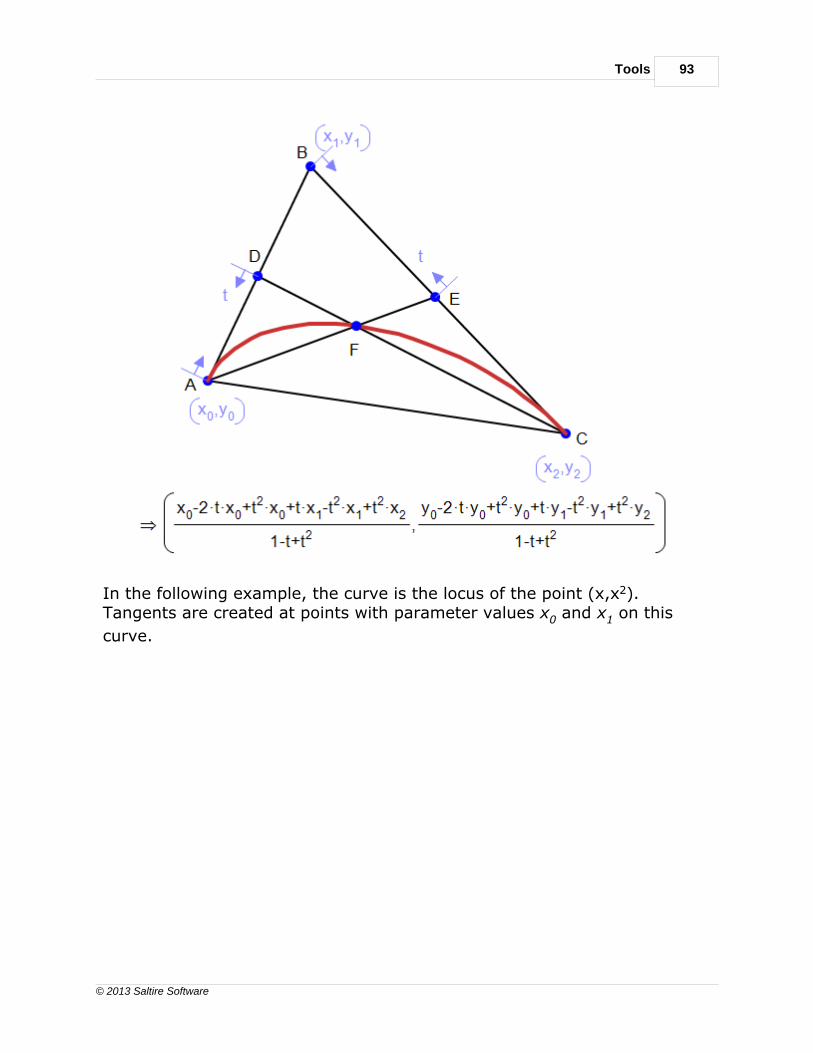
For example, in the following diagram, D is defined proportion t along AB,and E is defined proportion t along BC. The curve is the locus of F as tvaries between 0 and 1.
Tools 93
© 2013 Saltire Software
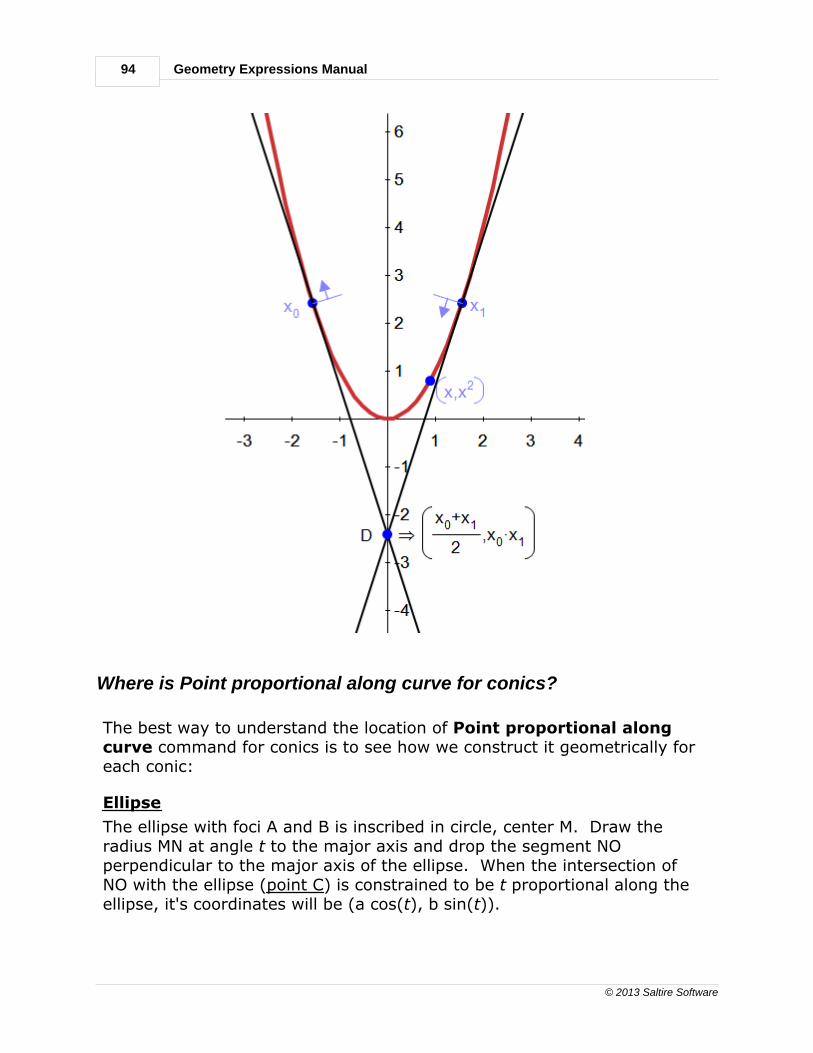
In the following example, the curve is the locus of the point (x,x2).Tangents are created at points with parameter values x0 and x1 on this
curve.
94
© 2013 Saltire Software
Geometry Expressions Manual
Where is Point proportional along curve for conics?
The best way to understand the location of Point proportional alongcurve command for conics is to see how we construct it geometrically foreach conic:
Ellipse
The ellipse with foci A and B is inscribed in circle, center M. Draw theradius MN at angle t to the major axis and drop the segment NOperpendicular to the major axis of the ellipse. When the intersection ofNO with the ellipse (point C) is constrained to be t proportional along theellipse, it's coordinates will be (a cos(t), b sin(t)).

Tools 95
© 2013 Saltire Software
Parabola
C lies on the parabola and BC is perpendicular to the axis AB of theparabola. Point D is located proportion t along the segment. Point F is theintersection of the perpendicular to BC through D with the parabola. Ithas the coordinates (2at, at2) when it is constrained to parametriclocation t on this parabola.
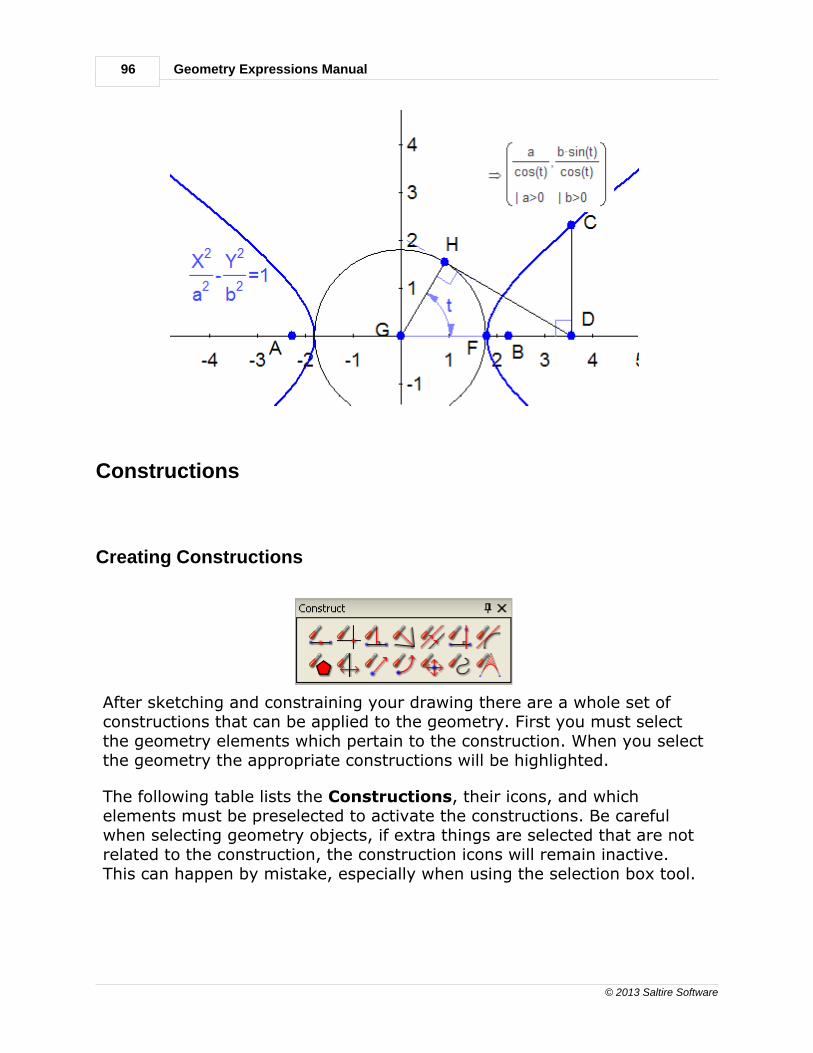
Hyperbola
CD is the perpendicular projection of C onto the axis of the hyperbola, GFis the circle centered at the center of the hyperbola which goes throughthe intersections of the hyperbola with its axis. H is the point of contact ofthis circle with the tangent from D. We can see that the angle DGH is thesame as the parameter value. When point C is constrained to be atparametric location t along the curve, its coordinates are (a/cos(t), b sin(t)/cos(t)) on this hyperbola.
96
© 2013 Saltire Software
Geometry Expressions Manual
Constructions
Creating Constructions
After sketching and constraining your drawing there are a whole set ofconstructions that can be applied to the geometry. First you must selectthe geometry elements which pertain to the construction. When you selectthe geometry the appropriate constructions will be highlighted.
The following table lists the Constructions, their icons, and whichelements must be preselected to activate the constructions. Be carefulwhen selecting geometry objects, if extra things are selected that are notrelated to the construction, the construction icons will remain inactive.This can happen by mistake, especially when using the selection box tool.
Tools 97
© 2013 Saltire Software
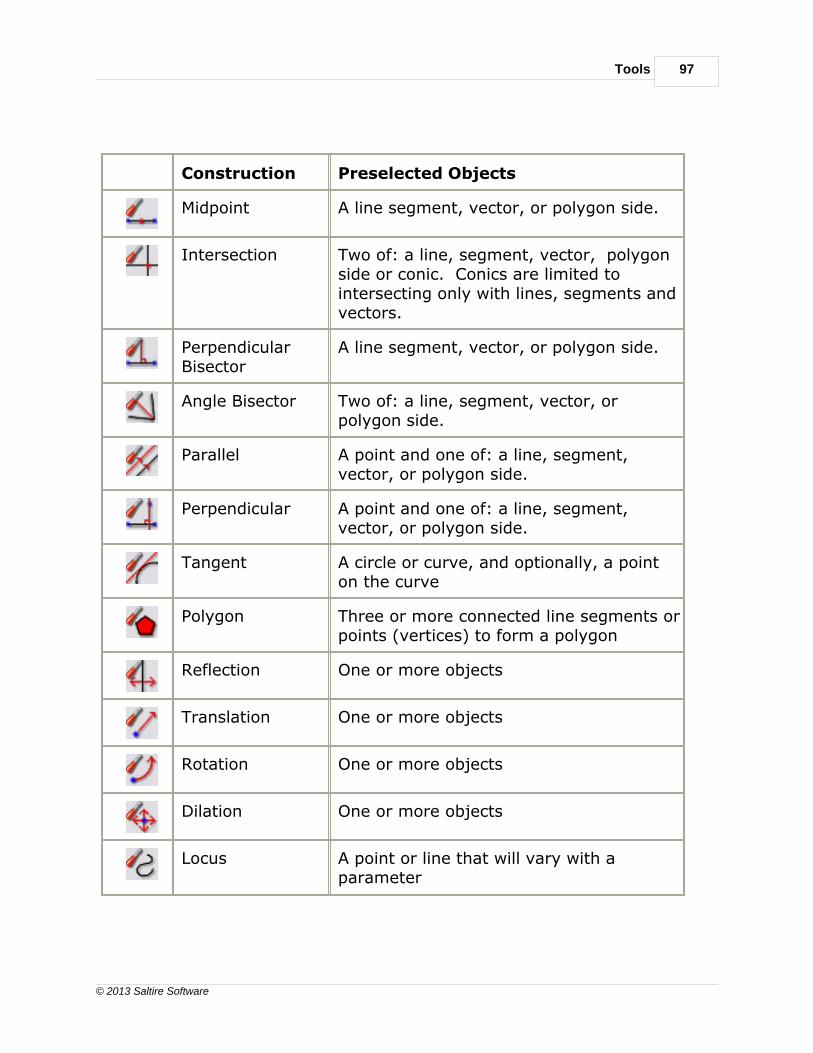
Construction Preselected Objects
Midpoint A line segment, vector, or polygon side.
Intersection Two of: a line, segment, vector, polygonside or conic. Conics are limited tointersecting only with lines, segments andvectors.
PerpendicularBisector
A line segment, vector, or polygon side.
Angle Bisector Two of: a line, segment, vector, orpolygon side.
Parallel A point and one of: a line, segment,vector, or polygon side.
Perpendicular A point and one of: a line, segment,vector, or polygon side.
Tangent A circle or curve, and optionally, a pointon the curve
Polygon Three or more connected line segments orpoints (vertices) to form a polygon
Reflection One or more objects
Translation One or more objects
Rotation One or more objects
Dilation One or more objects
Locus A point or line that will vary with aparameter
98
© 2013 Saltire Software
Geometry Expressions Manual
Trace One or more objects that will vary with aparameter
Area Under Arc An arc of a Cartesian function
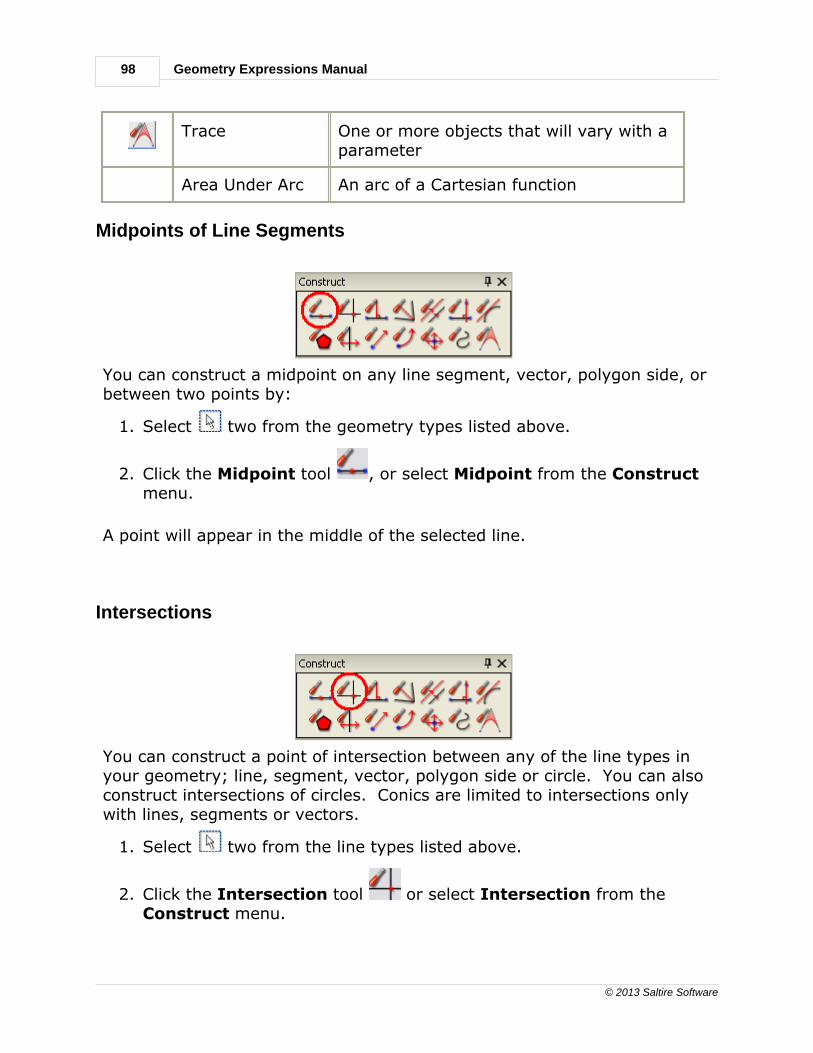
Midpoints of Line Segments
You can construct a midpoint on any line segment, vector, polygon side, orbetween two points by:
1. Select two from the geometry types listed above.
2. Click the Midpoint tool , or select Midpoint from the Constructmenu.
A point will appear in the middle of the selected line.
Intersections
You can construct a point of intersection between any of the line types inyour geometry; line, segment, vector, polygon side or circle. You can alsoconstruct intersections of circles. Conics are limited to intersections onlywith lines, segments or vectors.
1. Select two from the line types listed above.
2. Click the Intersection tool or select Intersection from theConstruct menu.

Tools 99
© 2013 Saltire Software
A new point and label will appear at the intersection. If the lines aresegments that do not intersect, a point will be created at the extension ofthe lines as with line segments AB and CD below.
If the geometry will never intersect, the selected objects are moved toform the intersection. In the example below, the infinite line and circlebecome tangent at the newly created point, H.
Perpendicular Bisector
You can construct a perpendicular bisector on any line, segment, vector,or polygon side with these steps:
1. Select any of the line types listed above.
2. Click the Perpendicular Bisector tool or select PerpendicularBisector from the Construct menu.
An infinite line will appear at right angles to the selected line.
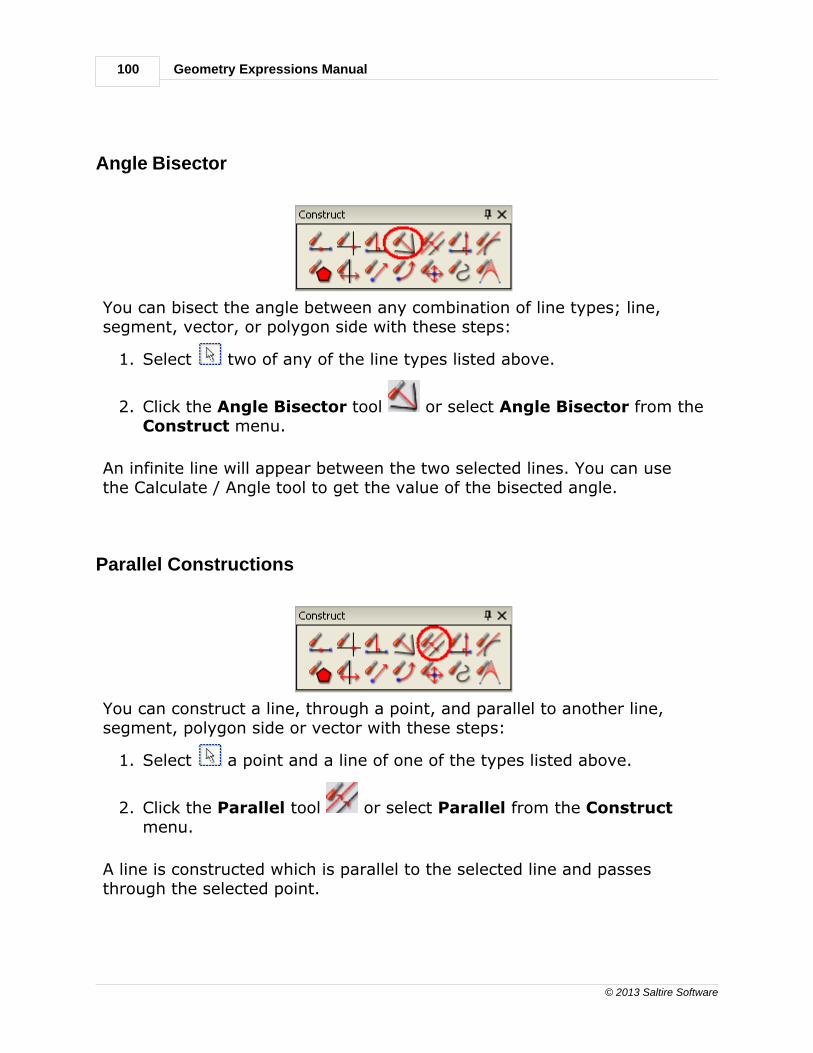
100
© 2013 Saltire Software
Geometry Expressions Manual
Angle Bisector
You can bisect the angle between any combination of line types; line,segment, vector, or polygon side with these steps:
1. Select two of any of the line types listed above.
2. Click the Angle Bisector tool or select Angle Bisector from theConstruct menu.
An infinite line will appear between the two selected lines. You can usethe Calculate / Angle tool to get the value of the bisected angle.
Parallel Constructions
You can construct a line, through a point, and parallel to another line,segment, polygon side or vector with these steps:
1. Select a point and a line of one of the types listed above.
2. Click the Parallel tool or select Parallel from the Constructmenu.
A line is constructed which is parallel to the selected line and passesthrough the selected point.

Tools 101
© 2013 Saltire Software
Perpendicular Constructions
You can construct a line, through a point, which is perpendicular toanother line, segment, polygon side or vector with these steps:
1. Select a point and a line of one of the types listed above.
2. Click the Perpendicular tool or select Perpendicular from theConstruct menu.
A line is constructed which is perpendicular to the selected line and passesthrough the selected point.
Tangents
You can construct a line that is tangent to a circle or curve with thesesteps:
1. Select the circle or curve. You can also select a point on the curveso that the tangent goes through the point on the curve.
2. Click the Tangent tool or select Tangent from the Constructmenu.
A line tangent to the selected curve will appear at the point where youselected the circle or curve, or at the selected point.

102
© 2013 Saltire Software
Geometry Expressions Manual
Polygon Construction
If you created a polygon with the line segment tool, or your polygon wasnot shaded for some reason, (e.g. the drawing of the sides wasinterrupted or out of order) you can make joined line segments into apolygon that can be selected with a single click using this construction.
1. Select the line segments that make up the polygon.
2. Click the Polygon tool in the Construct toolbox, or selectPolygon from the Construct menu.
The polygon will be filled and you can now select the entire polygon with asingle click.
Reflection
You can reflect any subset of your diagram about a line with these steps:
1. Select one or more geometry objects to reflect.
2. Click the Reflection tool in the Construct toolbox, or selectReflection from the Construct menu.
3. Either click the cursor to place the reflection line on the screen, adjustthe angle and click again, or select an existing line as the reflectionline.
A copy of your selected geometry will appear on the other side of thereflection line.
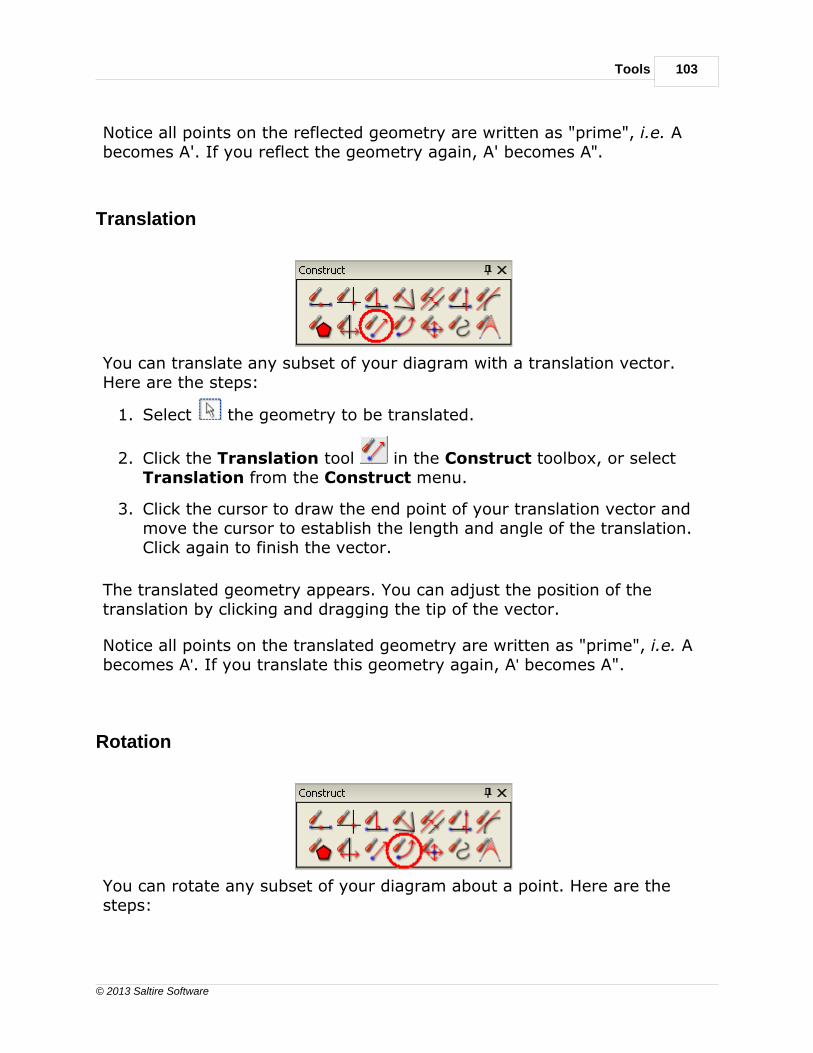
Tools 103
© 2013 Saltire Software
Notice all points on the reflected geometry are written as "prime", i.e. Abecomes A'. If you reflect the geometry again, A' becomes A".
Translation
You can translate any subset of your diagram with a translation vector.Here are the steps:
1. Select the geometry to be translated.
2. Click the Translation tool in the Construct toolbox, or selectTranslation from the Construct menu.
3. Click the cursor to draw the end point of your translation vector andmove the cursor to establish the length and angle of the translation.Click again to finish the vector.
The translated geometry appears. You can adjust the position of thetranslation by clicking and dragging the tip of the vector.
Notice all points on the translated geometry are written as "prime", i.e. Abecomes A'. If you translate this geometry again, A' becomes A".
Rotation
You can rotate any subset of your diagram about a point. Here are thesteps:

104
© 2013 Saltire Software
Geometry Expressions Manual
1. Select the geometry to be rotated.
2. Click the Rotation tool in the Construct toolbox, or selectRotation from the Construct menu.
3. Click the screen to place your rotation point.
4. In the data entry box presented, enter the angle of rotation.
The rotation of the selected geometry appears.
Notice all points on the rotated geometry are written as "prime", i.e. Abecomes A'. If you rotate this geometry again, A' becomes A".
Dilation
You can dilate any subset of your diagram from a point. Here are thesteps:
1. Select the geometry to be dilated.
2. Click the Dilation tool in the Construct toolbox, or selectDilation from the Construct menu.
3. Click the cursor on your dilation point.
4. In the data entry box presented, enter the dilation factor.
The dilated geometry appears.
Notice all points on the dilated geometry are written as "prime", i.e. Abecomes A'. If you dilate this geometry again, A' becomes A".

Tools 105
© 2013 Saltire Software
Locus of Points / Envelope
You can construct a locus of points or envelope from a selected point orline, by defining a range for some constraint in the drawing. Just followthese easy steps:
1. Select the point on the drawing that will form the locus (point B inthe example below); select a line, line segment, or vector to form anenvelope.
2. When you click the Locus icon , the Edit Locus dialog pops up.
3. You need a parameter to drive the motion to create the locus. Clickthe arrow key to the right of the Parametric Variable window toselect from a list of all variables in the drawing. (If you entered theneeded constraint in real terms, Cancel the trace and change theconstraint to a variable by double-clicking it in the drawing window.)
4. Simply fill in the values for the appropriate variable and click the Okbutton.
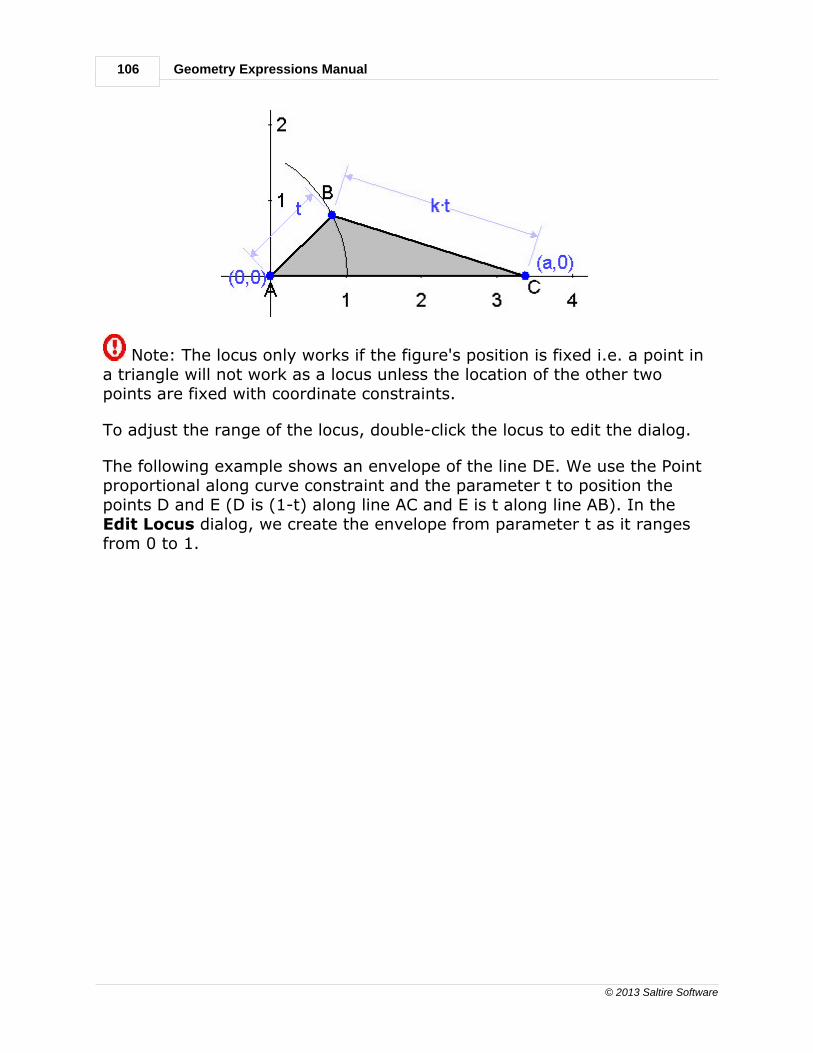
106
© 2013 Saltire Software
Geometry Expressions Manual
Note: The locus only works if the figure's position is fixed i.e. a point ina triangle will not work as a locus unless the location of the other twopoints are fixed with coordinate constraints.
To adjust the range of the locus, double-click the locus to edit the dialog.
The following example shows an envelope of the line DE. We use the Pointproportional along curve constraint and the parameter t to position thepoints D and E (D is (1-t) along line AC and E is t along line AB). In the Edit Locus dialog, we create the envelope from parameter t as it rangesfrom 0 to 1.
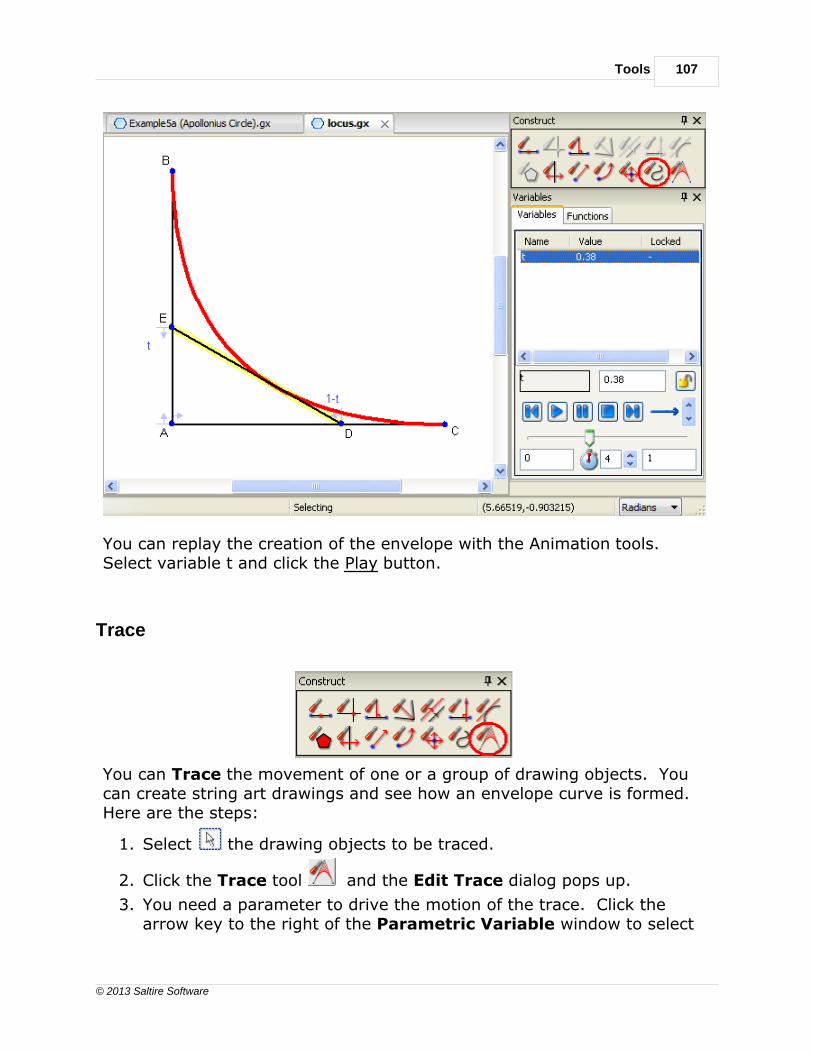
Tools 107
© 2013 Saltire Software
You can replay the creation of the envelope with the Animation tools.Select variable t and click the Play button.
Trace
You can Trace the movement of one or a group of drawing objects. Youcan create string art drawings and see how an envelope curve is formed. Here are the steps:
1. Select the drawing objects to be traced.
2. Click the Trace tool and the Edit Trace dialog pops up.
3. You need a parameter to drive the motion of the trace. Click thearrow key to the right of the Parametric Variable window to select
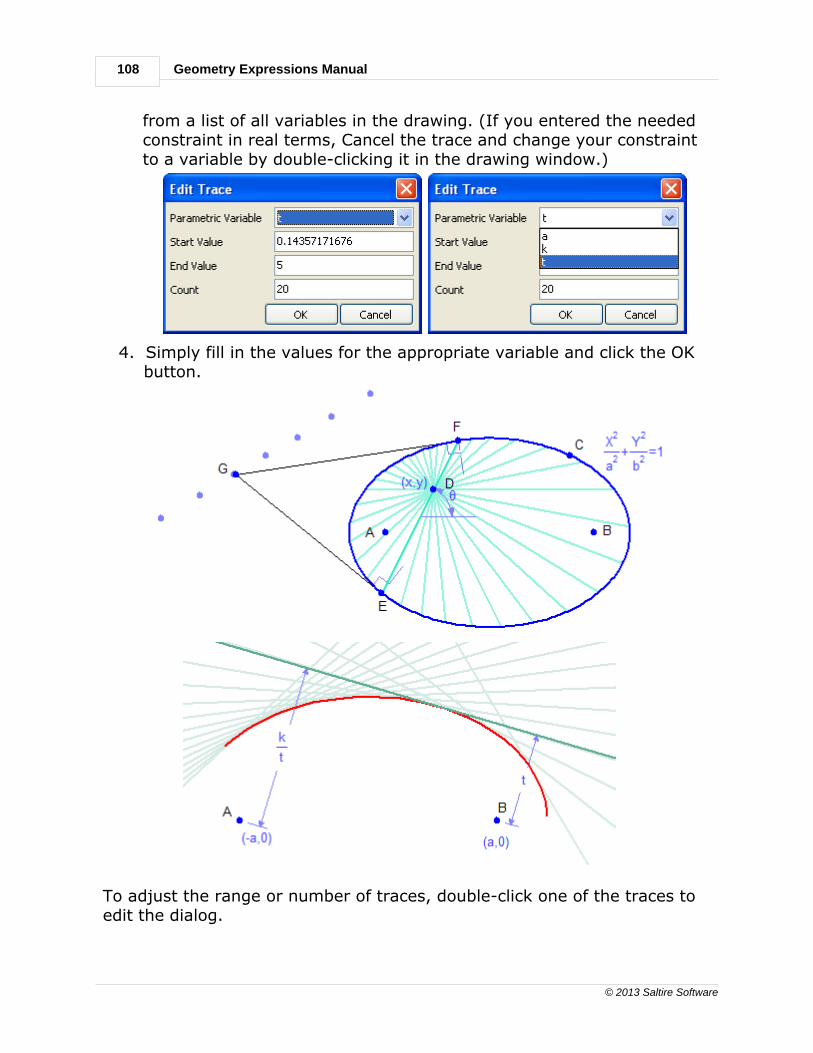
108
© 2013 Saltire Software
Geometry Expressions Manual
from a list of all variables in the drawing. (If you entered the neededconstraint in real terms, Cancel the trace and change your constraintto a variable by double-clicking it in the drawing window.)
4. Simply fill in the values for the appropriate variable and click the OKbutton.
To adjust the range or number of traces, double-click one of the traces toedit the dialog.
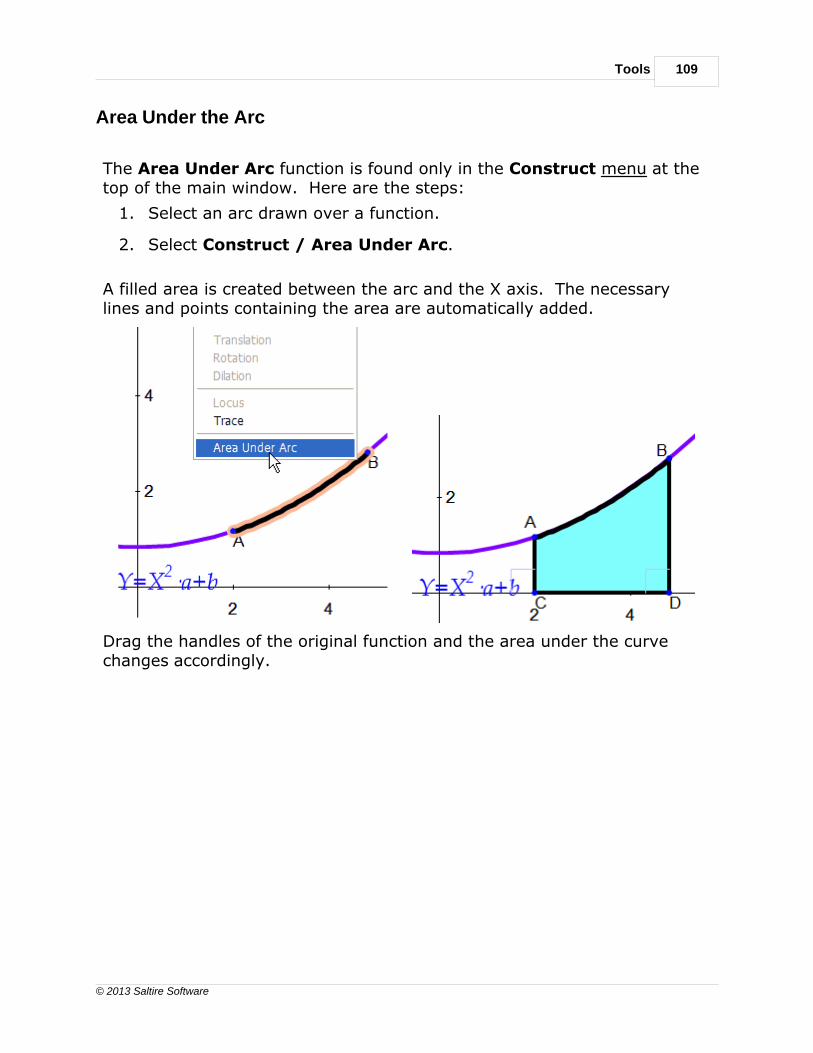
Tools 109
© 2013 Saltire Software
Area Under the Arc
The Area Under Arc function is found only in the Construct menu at thetop of the main window. Here are the steps:
1. Select an arc drawn over a function.
2. Select Construct / Area Under Arc.
A filled area is created between the arc and the X axis. The necessarylines and points containing the area are automatically added.
Drag the handles of the original function and the area under the curvechanges accordingly.

110
© 2013 Saltire Software
Geometry Expressions Manual
This is a great way to illustrate the definite integral.
Note: this only works for arcs drawn on functions. For arcs drawn onconics, create the sides with the Draw / Line Segment, select all sidesand use the Construct / Polygon tool. See also: instructions forcreating curvilinear polygons.
Integral Calculus
The Area Under Arc function is a great way to show problems with thedefinite integral.
Here are the steps for making the integral of the generic function f(x) overthe interval a to b:
1. Select the Draw / Function tool and enter f(x) in the Y= data entrybox. Click OK.
2. Use the Draw / Arc tool to trace over some portion of the function.
3. Select the new arc - be careful not to select the whole function. Justthe section of arc should be highlighted.
4. Choose Area Under Arc from the Construct menu. The areabetween the arc and the X axis will be filled.
5. For each endpoint of the arc, use the Constrain / Pointproportional along curve tool to define the limits of the region, e.g.

Tools 111
© 2013 Saltire Software
select a and b from the Symbols toolbox.
6. Select the area under the arc and click Calculate / Symbolic /Area.
Annotations
Applying Annotations
Annotations allow you to add constraint information to your drawing whichisn't needed for it's construction. These might be constraints that causethe geometry to be over constrained, but you might want to give theviewer some additional information. This feature can be very helpful formaking up texts or worksheets.
Annotate tools are similar to Text in that they have no influence on thegeometry engine, even though they are placed exactly like the Constraintools.
Since annotations may look identical to constraints, use the icon from icon
bar at the top of the window to Distinguish Constraints /
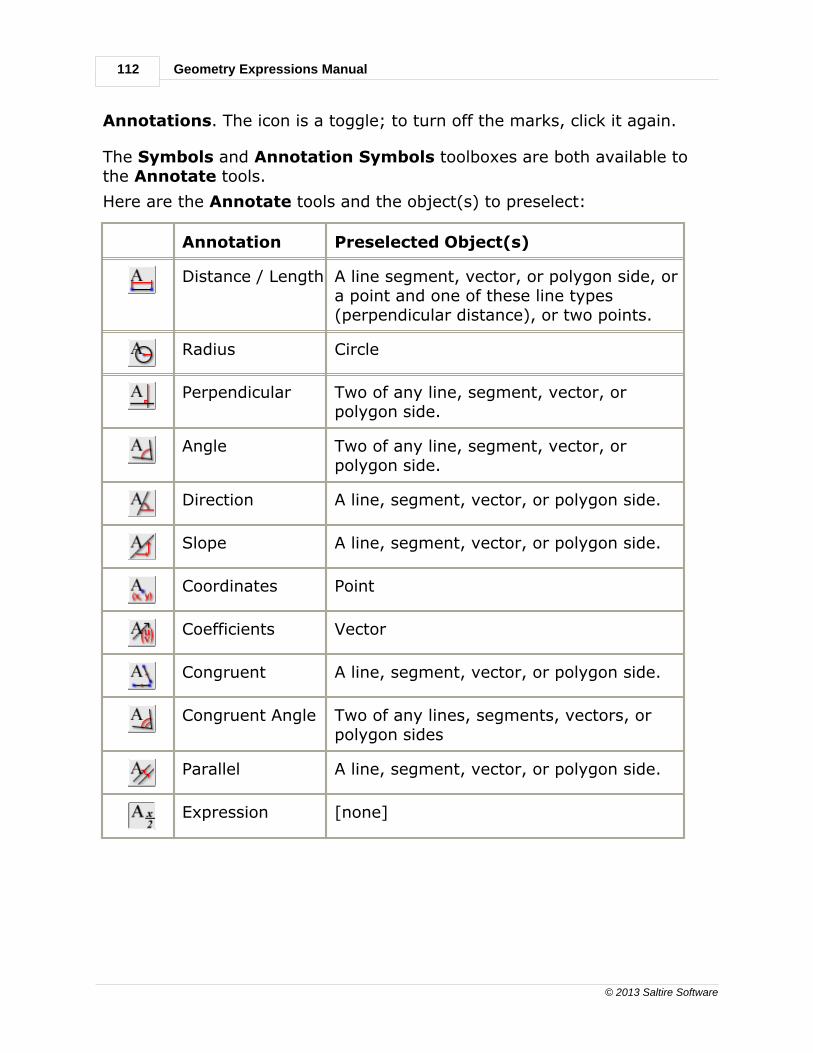
112
© 2013 Saltire Software
Geometry Expressions Manual
Annotations. The icon is a toggle; to turn off the marks, click it again.
The Symbols and Annotation Symbols toolboxes are both available tothe Annotate tools.
Here are the Annotate tools and the object(s) to preselect:
Annotation Preselected Object(s)
Distance / Length A line segment, vector, or polygon side, ora point and one of these line types(perpendicular distance), or two points.
Radius Circle
Perpendicular Two of any line, segment, vector, orpolygon side.
Angle Two of any line, segment, vector, orpolygon side.
Direction A line, segment, vector, or polygon side.
Slope A line, segment, vector, or polygon side.
Coordinates Point
Coefficients Vector
Congruent A line, segment, vector, or polygon side.
Congruent Angle Two of any lines, segments, vectors, orpolygon sides
Parallel A line, segment, vector, or polygon side.
Expression [none]

Tools 113
© 2013 Saltire Software
Distance / Length Annotation
Length annotations may be applied to any line, segment, polygon side orvector. Distance annotations are available between two points, or theperpendicular distance between a point and a line, segment, polygon side,or vector. Use these steps:
1. Select the line segment, or point and line, or pair of points asdescribed above. When you make your selection, the drawingobjects will be highlighted and the Distance / Length icon will light
up .
2. Click the icon
3. Enter the distance information. There are no format restrictions. Youcan use Symbols and Annotation Symbols in the entry. Press enterwhen you're done.
You can click the annotation and drag it to adjust its placement in thedrawing.
Radius Annotation
To annotate a circle's radius use these steps:
1. Select the circle. The Annotate / Radius icon will light upand the circle will be highlighted.
2. Click the icon
3. Enter the radius information. There are no format restrictions. Youcan use Symbols and Annotation Symbols in the entry. Press enter

114
© 2013 Saltire Software
Geometry Expressions Manual
when you're done.
You can click the annotation and drag it to adjust its placement in thedrawing.
Perpendicular Annotation
The perpendicular annotation inserts the perpendicular mark between anytwo of these line types: line, segment, polygon side or vector. Use thesesteps:
1.Select two of any line, segment, vector, or polygon side. The
Annotate / Perpendicular icon will light up when both lines arehighlighted.
2.Click the icon.
Note: Placing this annotation between two lines does not change therelative position of the lines or prevent the lines from changing theirrelative position as it does with the Constrain tool of the same name.
This annotation is very useful if you are displaying a 3-d object. In thisexample we imported the Triangular Prism from the Solids folder in theFigure Gallery.

Tools 115
© 2013 Saltire Software
Angle Annotation
To annotate an angle use these steps:
1. Select two of any line, segment, vector, or polygon side. The
Annotate / Angle icon will light up and the lines will behighlighted.
2. Click the icon
3. Enter the angle information. There are no format restrictions. Youcan use Symbols and Annotation Symbols in the entry. Press enterwhen you're done.
Which Side to Annotate?
Sometimes when identifying angles, the annotation falls on the wrong one. In the example below, we wanted BDC, not BDA. Just click the cursorover the annotation arrow and drag it to the other side, then release themouse button - done!
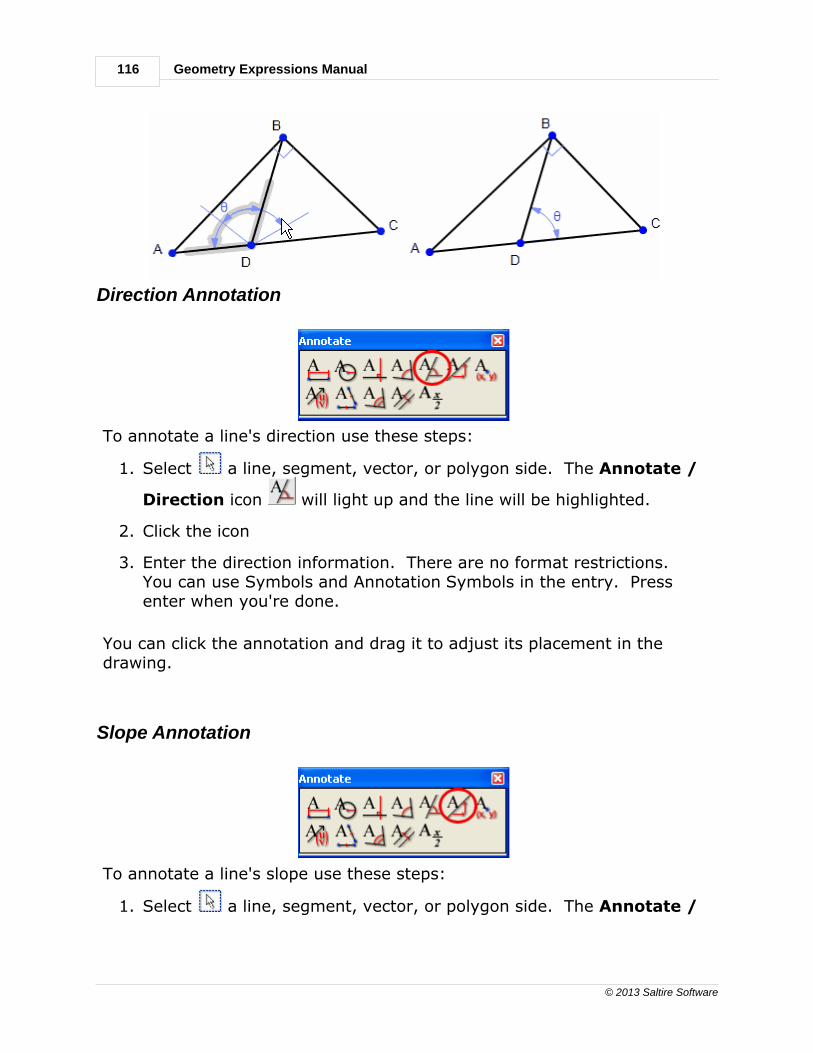
116
© 2013 Saltire Software
Geometry Expressions Manual
Direction Annotation
To annotate a line's direction use these steps:
1. Select a line, segment, vector, or polygon side. The Annotate /
Direction icon will light up and the line will be highlighted.
2. Click the icon
3. Enter the direction information. There are no format restrictions. You can use Symbols and Annotation Symbols in the entry. Pressenter when you're done.
You can click the annotation and drag it to adjust its placement in thedrawing.
Slope Annotation
To annotate a line's slope use these steps:
1. Select a line, segment, vector, or polygon side. The Annotate /
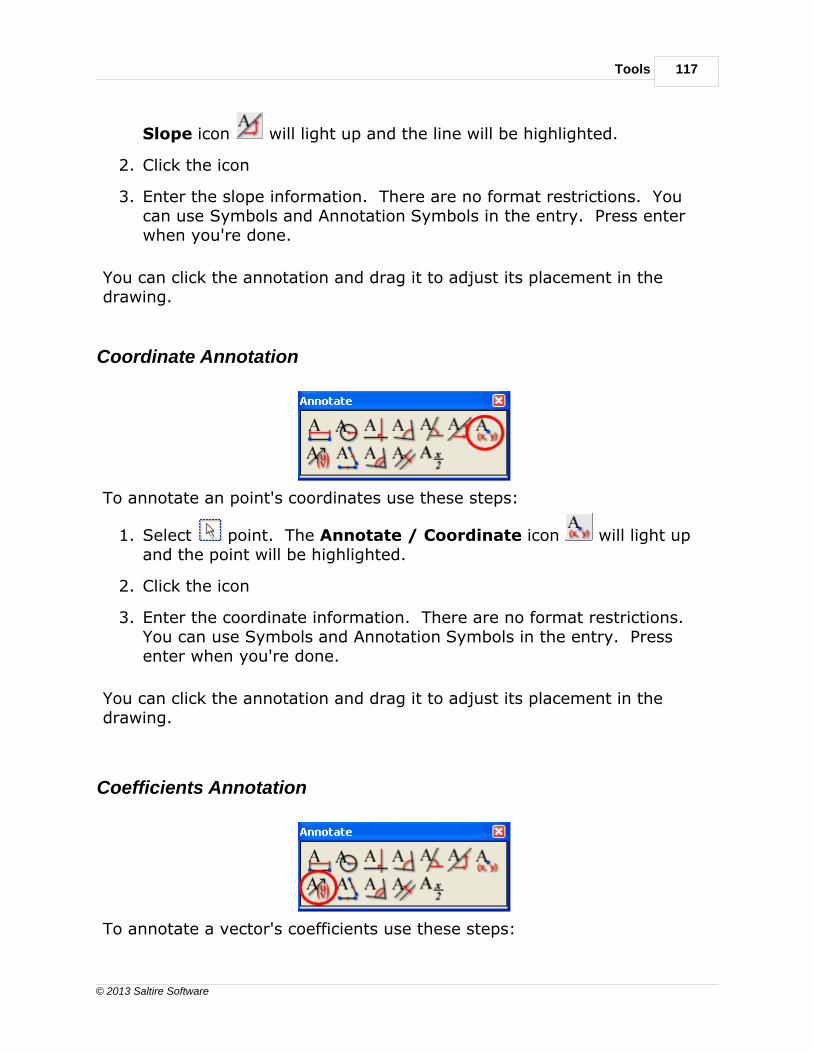
Tools 117
© 2013 Saltire Software
Slope icon will light up and the line will be highlighted.
2. Click the icon
3. Enter the slope information. There are no format restrictions. Youcan use Symbols and Annotation Symbols in the entry. Press enterwhen you're done.
You can click the annotation and drag it to adjust its placement in thedrawing.
Coordinate Annotation
To annotate an point's coordinates use these steps:
1. Select point. The Annotate / Coordinate icon will light upand the point will be highlighted.
2. Click the icon
3. Enter the coordinate information. There are no format restrictions. You can use Symbols and Annotation Symbols in the entry. Pressenter when you're done.
You can click the annotation and drag it to adjust its placement in thedrawing.
Coefficients Annotation
To annotate a vector's coefficients use these steps:

118
© 2013 Saltire Software
Geometry Expressions Manual
1. Select vector. The Annotate / Coefficients icon will lightup and the vector will be highlighted.
2. Click the icon
3. Enter the vector's coefficients. There are no format restrictions. Youcan use Symbols and Annotation Symbols in the entry. Press enterwhen you're done.
You can click the annotation and drag it to adjust its placement in thedrawing.
Congruent Annotation
Place a congruent mark on any of the linear drawing elements: lines,segments, vectors, or polygon sides. Use these steps:
1.Select any line, segment, vector, or polygon side. The
Annotate / Congruent icon will light up when both lines arehighlighted.
2.Click the icon.
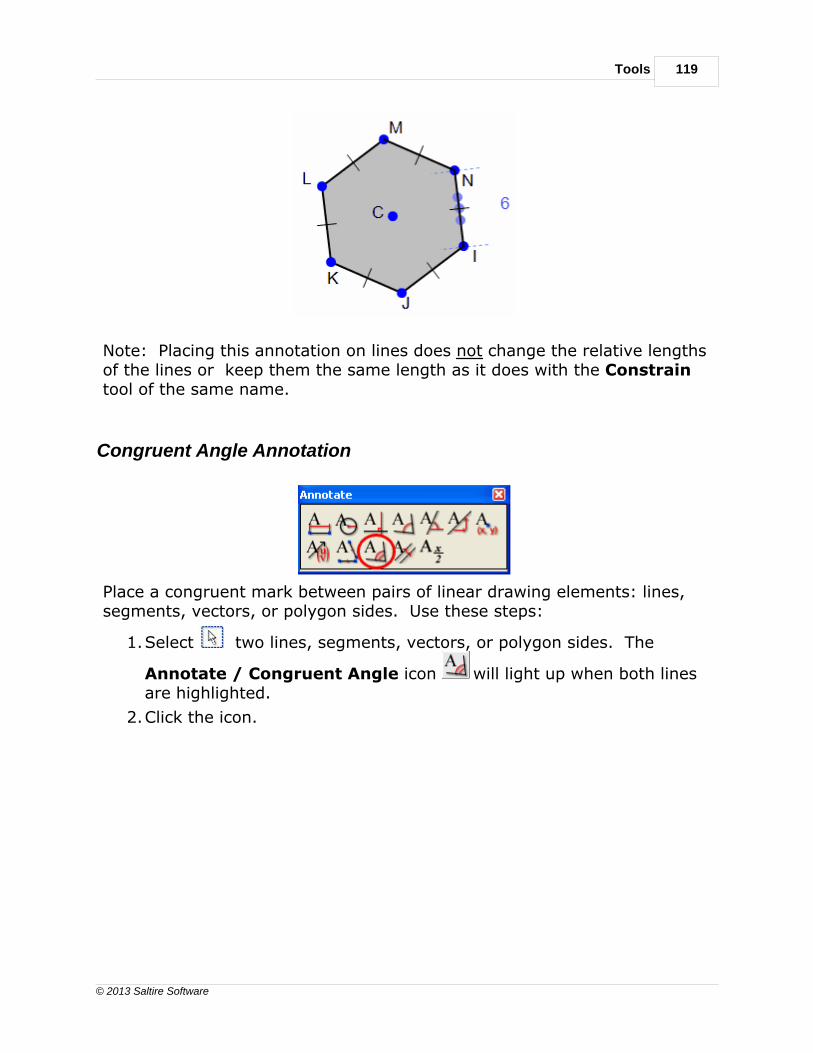
Tools 119
© 2013 Saltire Software
Note: Placing this annotation on lines does not change the relative lengthsof the lines or keep them the same length as it does with the Constraintool of the same name.
Congruent Angle Annotation
Place a congruent mark between pairs of linear drawing elements: lines,segments, vectors, or polygon sides. Use these steps:
1.Select two lines, segments, vectors, or polygon sides. The
Annotate / Congruent Angle icon will light up when both linesare highlighted.
2.Click the icon.
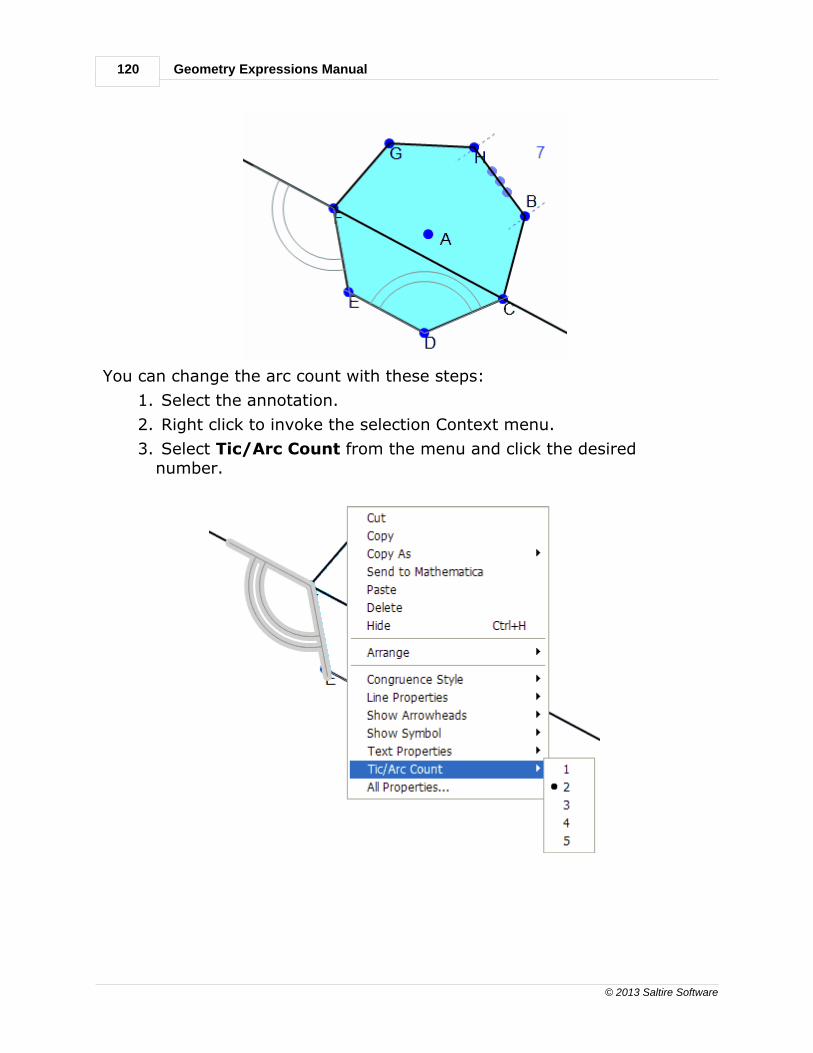
120
© 2013 Saltire Software
Geometry Expressions Manual
You can change the arc count with these steps:
1. Select the annotation.
2. Right click to invoke the selection Context menu.
3. Select Tic/Arc Count from the menu and click the desirednumber.

Tools 121
© 2013 Saltire Software
Parallel Annotation
Place a parallel mark on any of the linear drawing elements: lines,segments, vectors, or polygon sides. Use these steps:
1. Select _ any line, segment, vector, or polygon side. The
Annotate / Perpendicular icon will light up when both lines arehighlighted.
2. Click the icon.
Note: Placing this annotation on lines does not change the relativeposition of the lines or prevent the lines from changing their relativeposition as it does with the Constrain tool of the same name.
Expression Annotation
The Annotate / Expression command is useful for placing a line ofmathematics anywhere in your drawing.
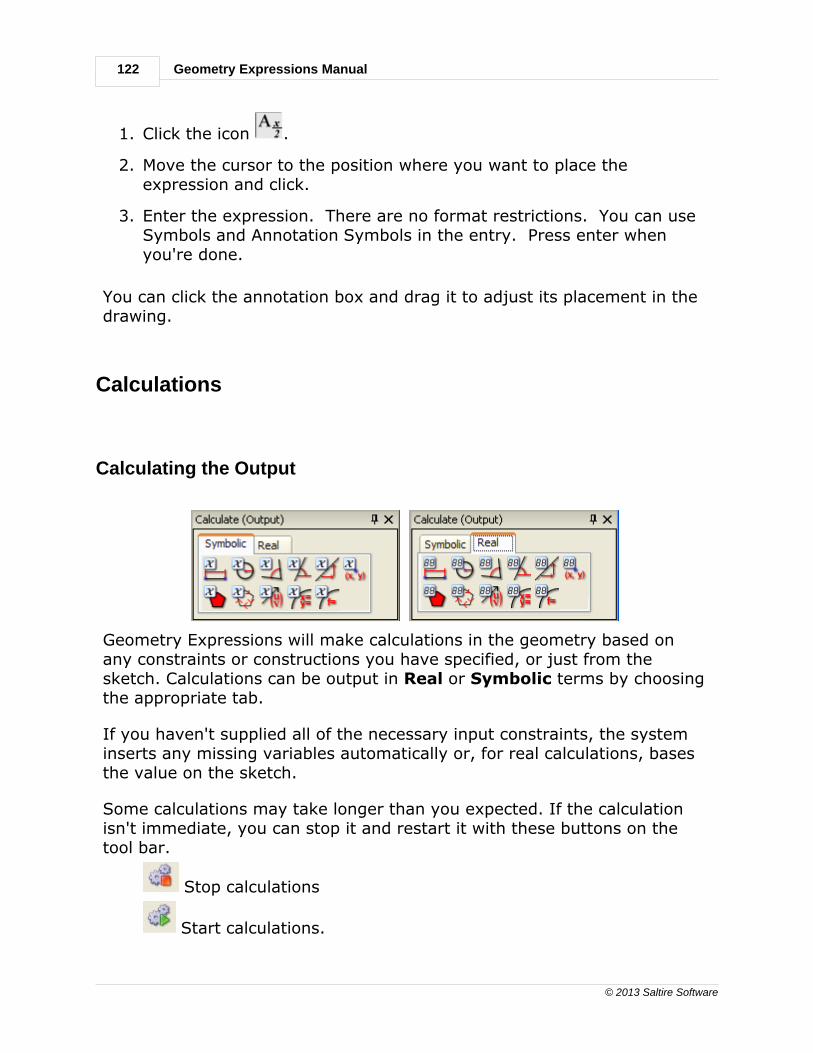
122
© 2013 Saltire Software
Geometry Expressions Manual
1. Click the icon .
2. Move the cursor to the position where you want to place theexpression and click.
3. Enter the expression. There are no format restrictions. You can useSymbols and Annotation Symbols in the entry. Press enter whenyou're done.
You can click the annotation box and drag it to adjust its placement in thedrawing.
Calculations
Calculating the Output
Geometry Expressions will make calculations in the geometry based onany constraints or constructions you have specified, or just from thesketch. Calculations can be output in Real or Symbolic terms by choosingthe appropriate tab.
If you haven't supplied all of the necessary input constraints, the systeminserts any missing variables automatically or, for real calculations, basesthe value on the sketch.
Some calculations may take longer than you expected. If the calculationisn't immediate, you can stop it and restart it with these buttons on thetool bar.
Stop calculations
Start calculations.

Tools 123
© 2013 Saltire Software
You may want to reconsider the problem, add constraints, or just let itcontinue with the calculation.
The Stop calculations and Start calculations can also be found underCalculate (Output) menu and under the general context menu.
The table below lists all the available calculations and geometry elementswhich must be preselected. Be careful when selecting geometry objects, ifextra things are selected that are not related to the calculation (like othercalculations) the calculations will remain inactive. This can happen bymistake, especially when using the selection rectangle.
Calculation Preselected Object(s)
Distance /Length
A line segment, vector, or polygon side,or a point and one of these line types(perpendicular distance), or two points.
Radius Circle
Angle Two of any line, segment, vector, or
polygon side.
Direction A line, segment, vector, or polygon
side.
Slope A line, segment, vector, or polygon
side.
Coordinates Point
Area Circle or polygon
Perimeter Circle or polygon
Coefficients Vector
ParametricEquation
A line, segment, vector, polygon side,circle, or a constructed locus.
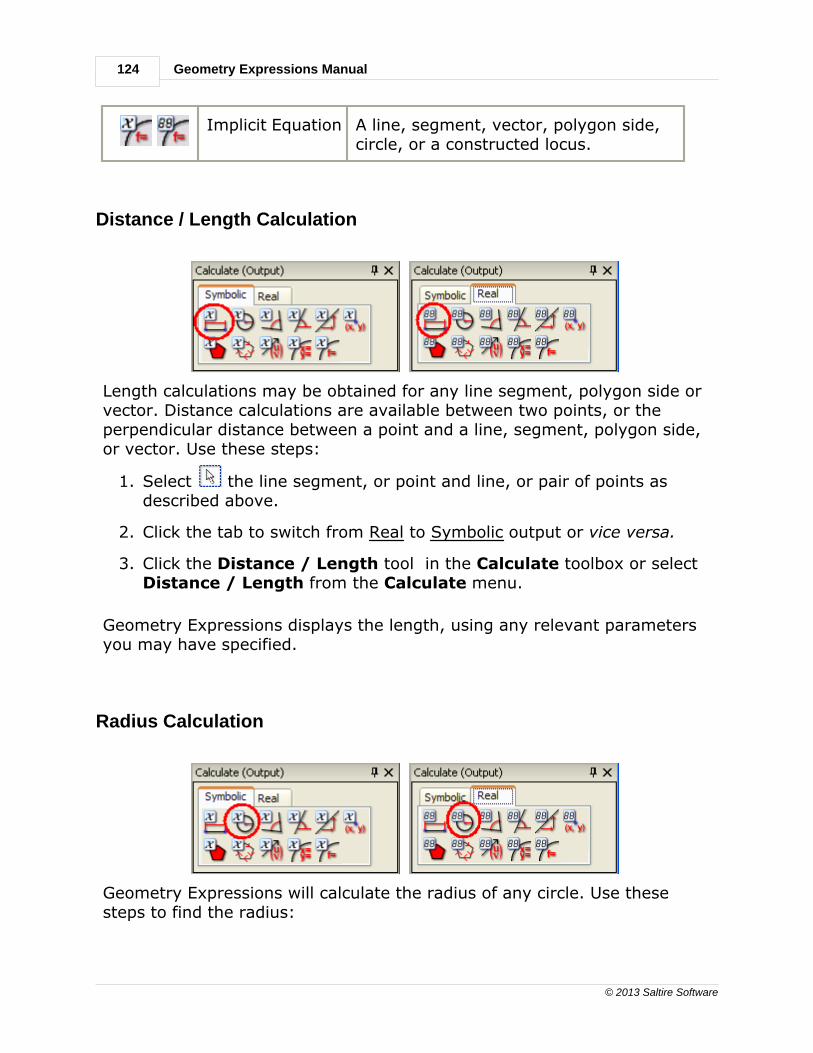
124
© 2013 Saltire Software
Geometry Expressions Manual
Implicit Equation A line, segment, vector, polygon side,
circle, or a constructed locus.
Distance / Length Calculation
Length calculations may be obtained for any line segment, polygon side orvector. Distance calculations are available between two points, or theperpendicular distance between a point and a line, segment, polygon side,or vector. Use these steps:
1. Select the line segment, or point and line, or pair of points asdescribed above.
2. Click the tab to switch from Real to Symbolic output or vice versa.
3. Click the Distance / Length tool in the Calculate toolbox or selectDistance / Length from the Calculate menu.
Geometry Expressions displays the length, using any relevant parametersyou may have specified.
Radius Calculation
Geometry Expressions will calculate the radius of any circle. Use thesesteps to find the radius:
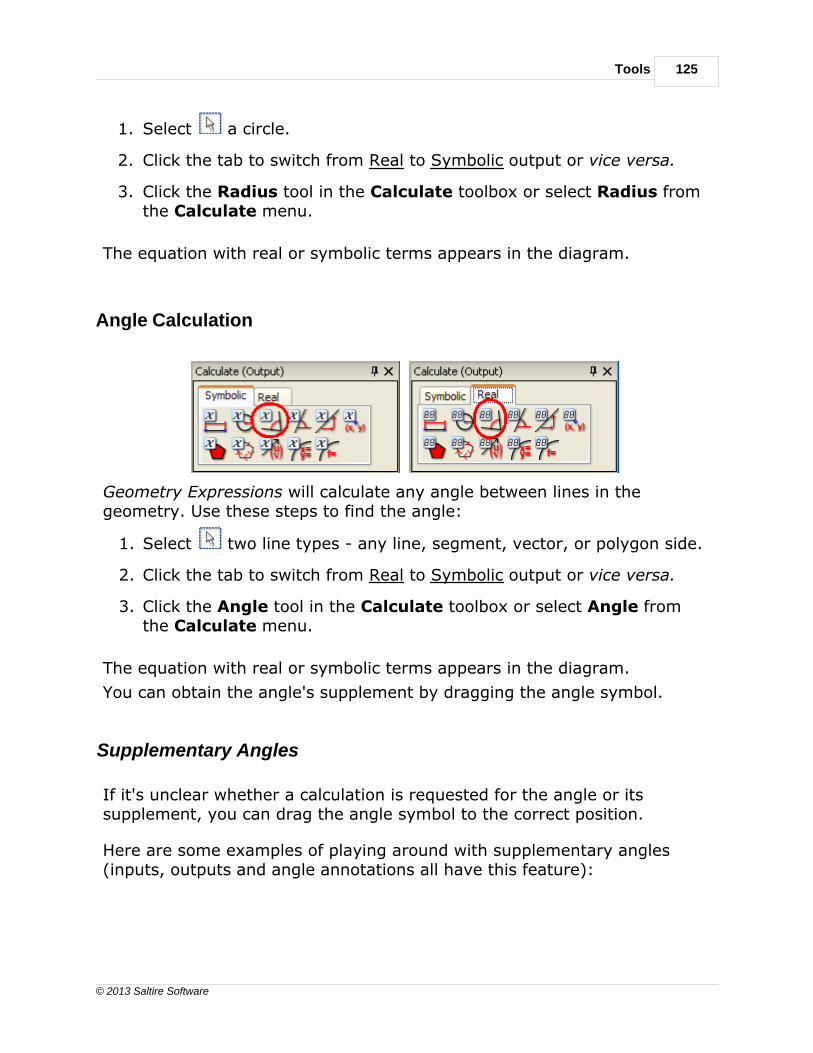
Tools 125
© 2013 Saltire Software
1. Select a circle.
2. Click the tab to switch from Real to Symbolic output or vice versa.
3. Click the Radius tool in the Calculate toolbox or select Radius fromthe Calculate menu.
The equation with real or symbolic terms appears in the diagram.
Angle Calculation
Geometry Expressions will calculate any angle between lines in thegeometry. Use these steps to find the angle:
1. Select two line types - any line, segment, vector, or polygon side.
2. Click the tab to switch from Real to Symbolic output or vice versa.
3. Click the Angle tool in the Calculate toolbox or select Angle fromthe Calculate menu.
The equation with real or symbolic terms appears in the diagram.
You can obtain the angle's supplement by dragging the angle symbol.
Supplementary Angles
If it's unclear whether a calculation is requested for the angle or itssupplement, you can drag the angle symbol to the correct position.
Here are some examples of playing around with supplementary angles (inputs, outputs and angle annotations all have this feature):

126
© 2013 Saltire Software
Geometry Expressions Manual

Tools 127
© 2013 Saltire Software
Direction Calculation
Geometry Expressions will calculate the direction of lines, segments,polygon sides, or vectors with these steps:
1. Select a line type.
2. Click the tab to switch from Real to Symbolic output or vice versa.
3. Click the Direction tool in the Calculate toolbox or select Directionfrom the Calculate menu.
The direction measurement appears in real or symbolic terms.
Slope Calculation
Geometry Expressions will calculate the slope of lines, segments, polygonsides, or vectors with these steps:
1. Select a line type.
2. Click the tab to switch from Real to Symbolic output or vice versa.
3. Click the Slope tool in the Calculate toolbox or select Slope from theCalculate menu.
The equation for the slope with real or symbolic terms appears in thediagram.
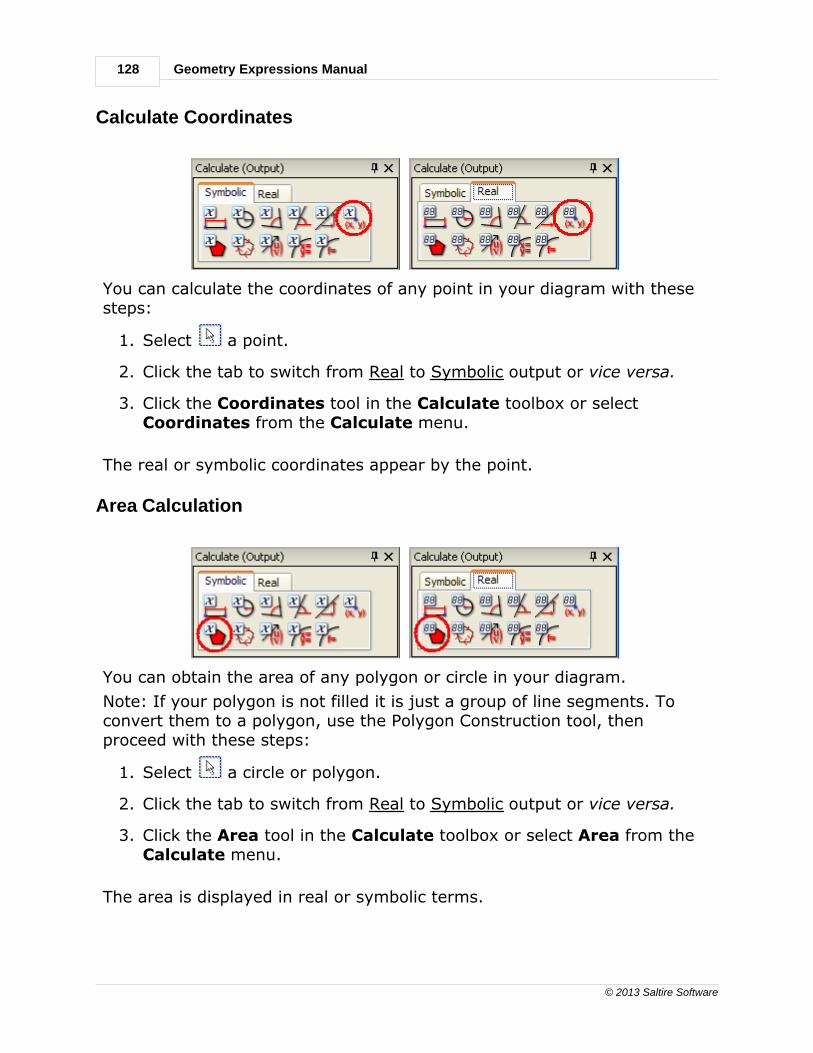
128
© 2013 Saltire Software
Geometry Expressions Manual
Calculate Coordinates
You can calculate the coordinates of any point in your diagram with thesesteps:
1. Select a point.
2. Click the tab to switch from Real to Symbolic output or vice versa.
3. Click the Coordinates tool in the Calculate toolbox or selectCoordinates from the Calculate menu.
The real or symbolic coordinates appear by the point.
Area Calculation
You can obtain the area of any polygon or circle in your diagram.
Note: If your polygon is not filled it is just a group of line segments. Toconvert them to a polygon, use the Polygon Construction tool, thenproceed with these steps:
1. Select a circle or polygon.
2. Click the tab to switch from Real to Symbolic output or vice versa.
3. Click the Area tool in the Calculate toolbox or select Area from theCalculate menu.
The area is displayed in real or symbolic terms.

Tools 129
© 2013 Saltire Software
Perimeter Calculation
You can obtain the perimeter of any polygon or circle in your diagram.
Note: If your polygon is not filled it is just a group of line segments. Toconvert them to a polygon, use the Polygon Construction tool, thenproceed with these steps:
1. Select a circle or polygon.
2. Click the tab to switch from Real to Symbolic output or vice versa.
3. Click the Perimeter tool in the Calculate toolbox or select Perimeterfrom the Calculate menu.
The perimeter is displayed in real or symbolic terms.
Calculate Coefficients
Use this tool to calculate the coefficients of a vector in the diagram withthese steps:
1. Select a vector.
2. Click the tab to switch from Real to Symbolic output or vice versa.
3. Click the Coefficients tool in the Calculate toolbox or selectCoefficients from the Calculate menu.
The real or symbolic coefficients appear by the vector.
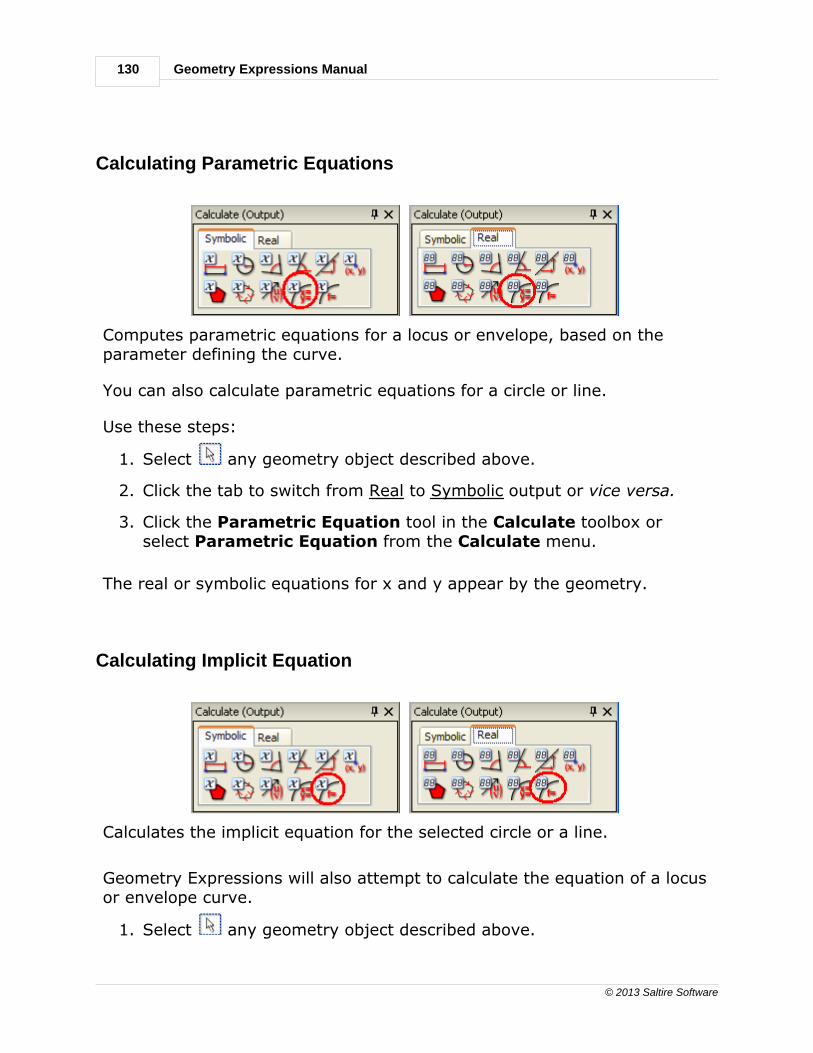
130
© 2013 Saltire Software
Geometry Expressions Manual
Calculating Parametric Equations
Computes parametric equations for a locus or envelope, based on theparameter defining the curve.
You can also calculate parametric equations for a circle or line.
Use these steps:
1. Select any geometry object described above.
2. Click the tab to switch from Real to Symbolic output or vice versa.
3. Click the Parametric Equation tool in the Calculate toolbox orselect Parametric Equation from the Calculate menu.
The real or symbolic equations for x and y appear by the geometry.
Calculating Implicit Equation
Calculates the implicit equation for the selected circle or a line.
Geometry Expressions will also attempt to calculate the equation of a locusor envelope curve.
1. Select any geometry object described above.
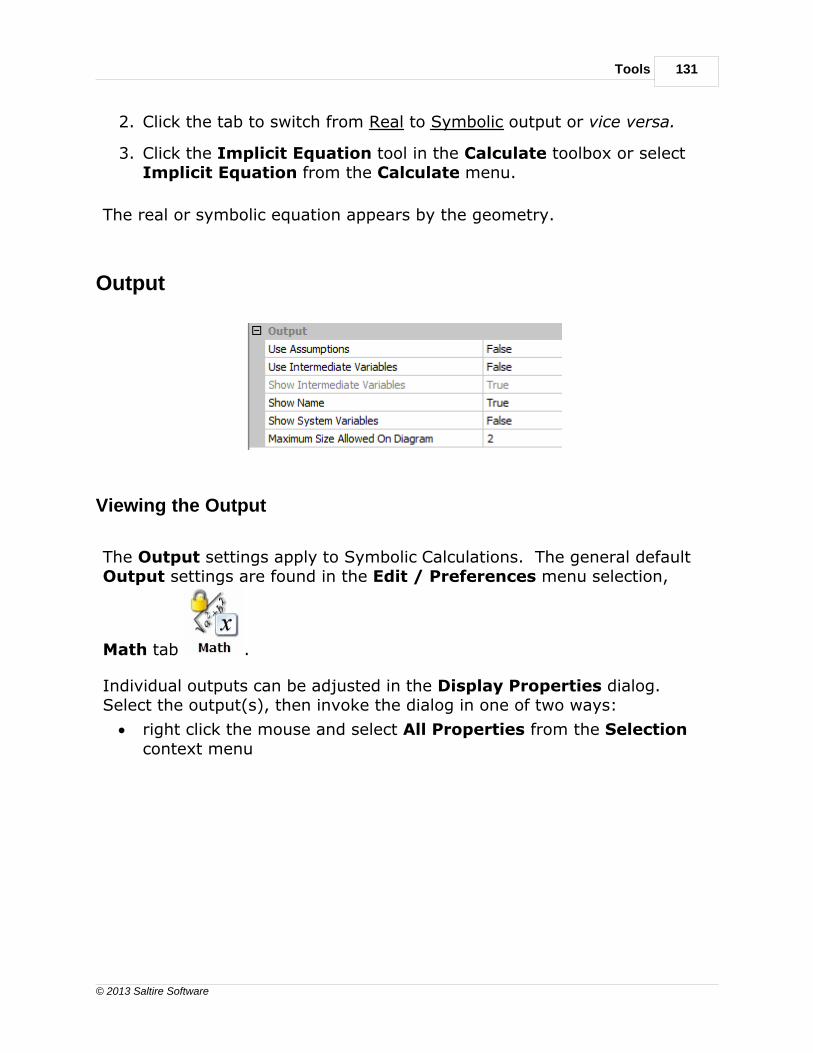
Tools 131
© 2013 Saltire Software
2. Click the tab to switch from Real to Symbolic output or vice versa.
3. Click the Implicit Equation tool in the Calculate toolbox or selectImplicit Equation from the Calculate menu.
The real or symbolic equation appears by the geometry.
Output
Viewing the Output
The Output settings apply to Symbolic Calculations. The general defaultOutput settings are found in the Edit / Preferences menu selection,
Math tab .
Individual outputs can be adjusted in the Display Properties dialog. Select the output(s), then invoke the dialog in one of two ways:
· right click the mouse and select All Properties from the Selectioncontext menu
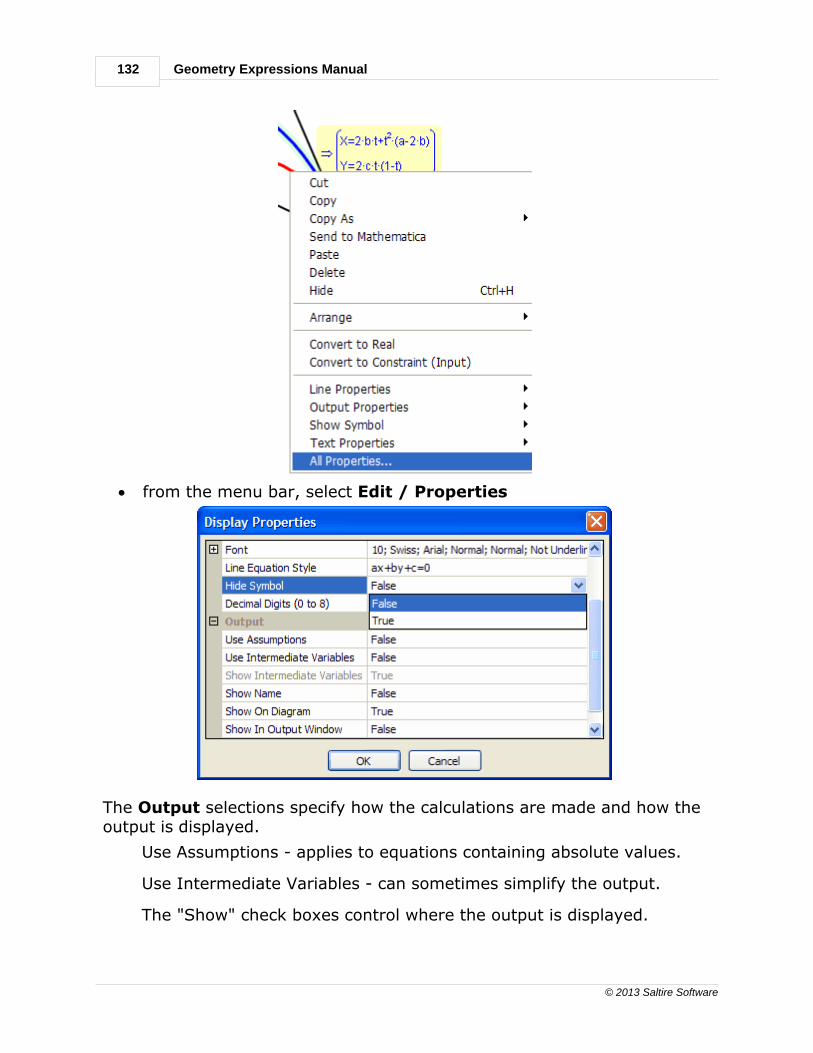
132
© 2013 Saltire Software
Geometry Expressions Manual
· from the menu bar, select Edit / Properties
The Output selections specify how the calculations are made and how theoutput is displayed.
Use Assumptions - applies to equations containing absolute values.
Use Intermediate Variables - can sometimes simplify the output.
The "Show" check boxes control where the output is displayed.

Tools 133
© 2013 Saltire Software
Click the Output selection, and then the drop-down arrow to select thedesired state - True or False.
Assumptions
With the Use Assumptions selection, Geometry Expressions eliminates theabsolute value from expressions and determines from the diagramwhether the value is positive or negative. Try it with these steps:
1. select one or more output calculations
2. right click the mouse and select All Properties from the Selectioncontext menu
3. click anywhere on the Use Assumptions line in the Output box
4. click the drop-down arrow
5. select False or True
Obviously, this tool only has an effect when the expression selectedcontains an absolute value.
Intermediate Variables
Substituting intermediate variables can sometimes simplify expressionscalculated by the program. Try this option to see how it affects youroutput:
1. select one or more output calculations
2. right click the mouse and select All Properties from the Selectioncontext menu
3. click anywhere on the Use Intermediate Variables line in the Outputbox
4. click the drop-down arrow
5. select False or True
If Use Intermediate Variables is False, the Show Intermediate Variables is
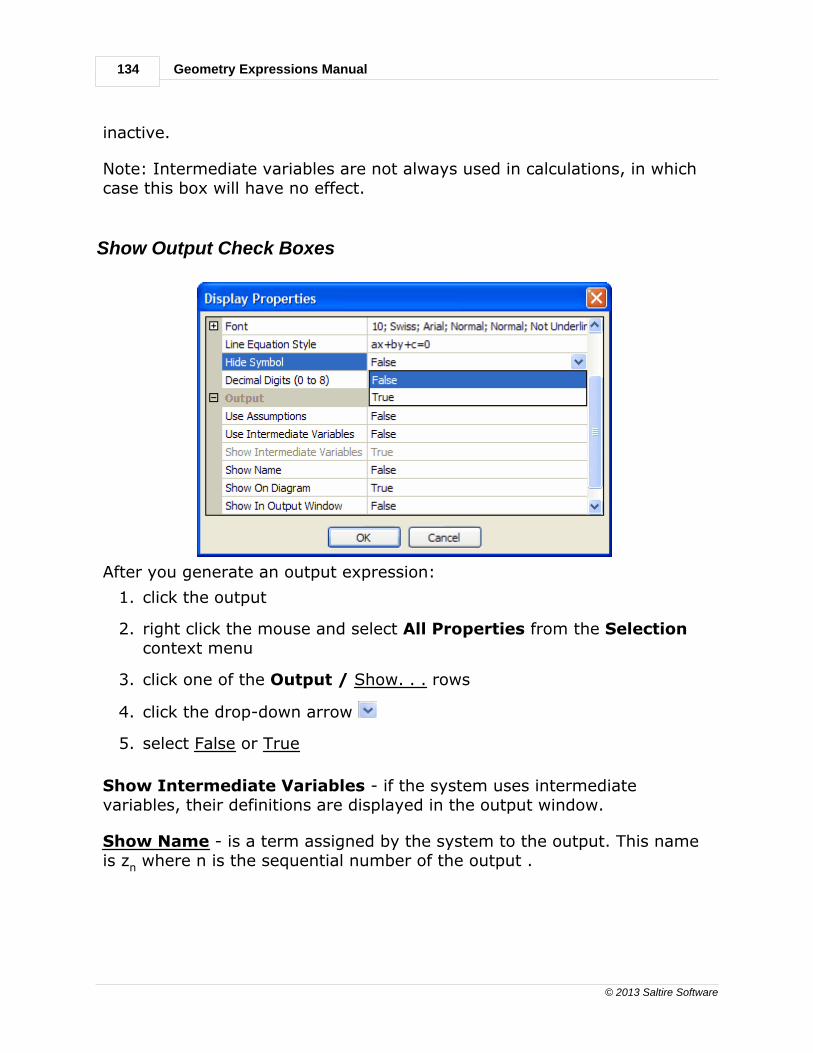
134
© 2013 Saltire Software
Geometry Expressions Manual
inactive.
Note: Intermediate variables are not always used in calculations, in whichcase this box will have no effect.
Show Output Check Boxes
After you generate an output expression:
1. click the output
2. right click the mouse and select All Properties from the Selectioncontext menu
3. click one of the Output / Show. . . rows
4. click the drop-down arrow
5. select False or True
Show Intermediate Variables - if the system uses intermediatevariables, their definitions are displayed in the output window.
Show Name - is a term assigned by the system to the output. This nameis zn where n is the sequential number of the output .

Tools 135
© 2013 Saltire Software
You can change the output name by double clicking the output andentering a new name in the box.
Show On Diagram - puts the output expression on the diagram whenTrue.
Show in Output Window - puts the output expression in the OutputWindow when True. If this value is True, then Show Name becomes True.
Too Big for Diagram - the output expression is moved to the outputwindow when True (Show in Output Window becomes True, Show OnDiagram becomes False).
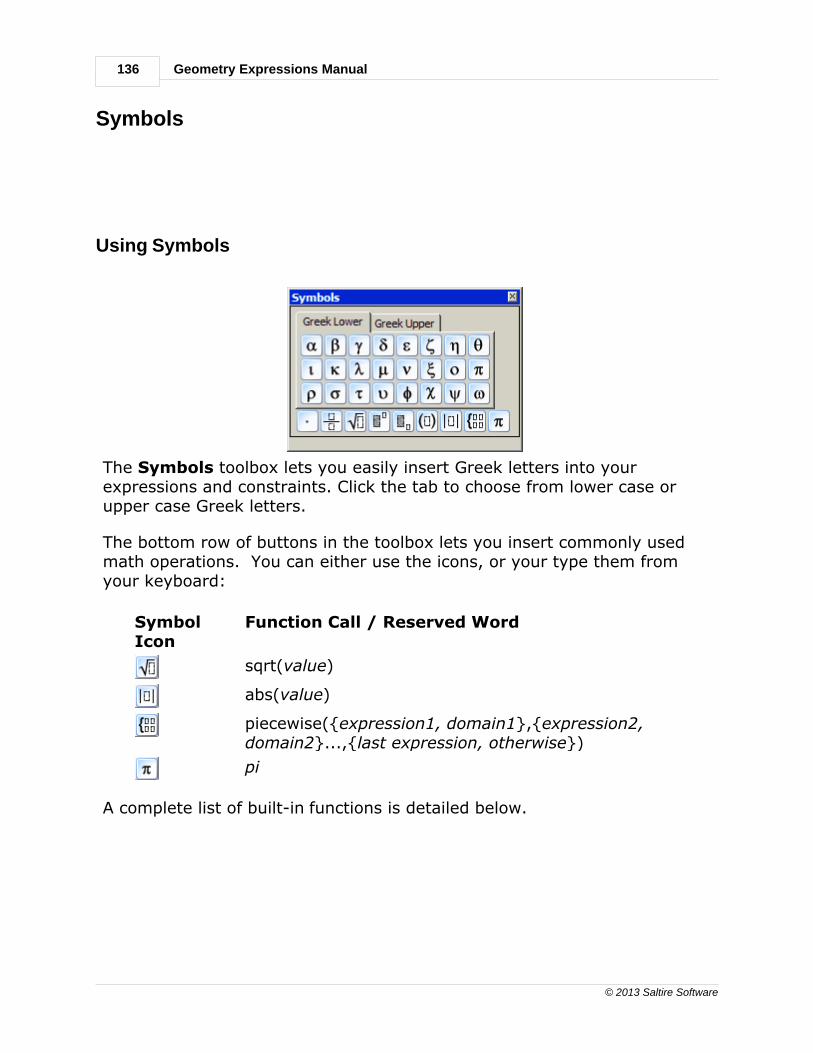
136
© 2013 Saltire Software
Geometry Expressions Manual
Symbols
Using Symbols
The Symbols toolbox lets you easily insert Greek letters into yourexpressions and constraints. Click the tab to choose from lower case orupper case Greek letters.
The bottom row of buttons in the toolbox lets you insert commonly usedmath operations. You can either use the icons, or your type them fromyour keyboard:
SymbolIcon
Function Call / Reserved Word
sqrt(value)
abs(value)
piecewise({expression1, domain1},{expression2,domain2}...,{last expression, otherwise})
pi
A complete list of built-in functions is detailed below.

Tools 137
© 2013 Saltire Software
Inserting Greek Letters
To insert Greek letters into any variable name or expression, click theappropriate tab, Greek Upper (upper case letters) or Greek Lower( lower case letters) in the Symbols toolbox, and click the letters to beinserted into the data entry box.
Multiplication & Division Editing Tools
The Multiplication button inserts a multiplication symbol into theexpression.
The Division button makes expressions easier to enter and read.
· From the data entry box, enter the numerator of the expression,highlight it, and then click Division.
The cursor is then positioned in the denominator.
· If you click the Division button first, be sure to place the cursor in theappropriate place before typing the expression.

138
© 2013 Saltire Software
Geometry Expressions Manual
Square Root Editing Tool
You can enter square roots in one of these ways:
· From the data entry box, enter the expression you want inside thesquare root, highlight the terms, and click the Square Root button.
· From the data entry box, click the Square Root button, then highlightthe 0 and type the terms.
· Use the sqrt() function in the data entry box.
Subscript / Superscript Editor
You can enter superscripts or subscripts for variables in one of theseways:
· From the data entry box, enter the expression you want sub/
superscripted, highlight the terms and click the Subscript or
Superscript button.
· From the data entry box, click the Sub/Superscript button and typethe values into the grey boxes.
Note: Make sure the cursor is positioned at the left side of the graybox before typing the sub/superscript.

Tools 139
© 2013 Saltire Software
· Another way to make a subscript is to use square brackets - A[1] = A1
Parentheses and Absolute Value Notation
You can add parentheses or an absolute value sign to a term in one of twoways:
· From the data input box, type the term(s), highlight the term(s), then
click the Parentheses or Absolute Value button.
· From the data entry box, click the Parentheses or Absolute
Value button first and enter the terms.
Using the Piecewise Function
A piecewise function or expression can be created using the Piecewisesymbol or the built-in function - piecewise({expression1, domain1},{expression2,domain2}...,{last expression, otherwise}). The reservedword, "otherwise" is an option available for the last condition.
For details see Piecewise Function and Piecewise Parametric Example in theCreating Functions section.
Built-In Functions
For including in any expression or constraint, Gx has the followingcommon functions available:
Trig
· sin() · arcsin() · sinh()

140
© 2013 Saltire Software
Geometry Expressions Manual
· cos() · arccos() · cosh()
· tan() · arctan() · tanh()
Math
• sqrt() - same as · abs() - same as
· signum(x) - finds the sign of anumber:
= -1 if x < 0
0 if x = 0
1 if x > 0
· exp(x) - the exponentialfunction; you must use exp,not e, e is just a variable name
· log() or ln() - both mean thenatural log
· piecewise({expression1,domain1},{expression2,domain2}...) - the function isevaluated in the order written
· diff(expression, variable) · integrate(expression, variable)
· sum(expression, variable =start, end)
· pi - same as in the Symbolstoolbox
· ceil() - rounds up · floor() - rounds down
Boolean
AND
OR
NOT
<
<=
>
>=
Using Annotation Symbols
Annotation Symbols are available for use with any of the Annotate
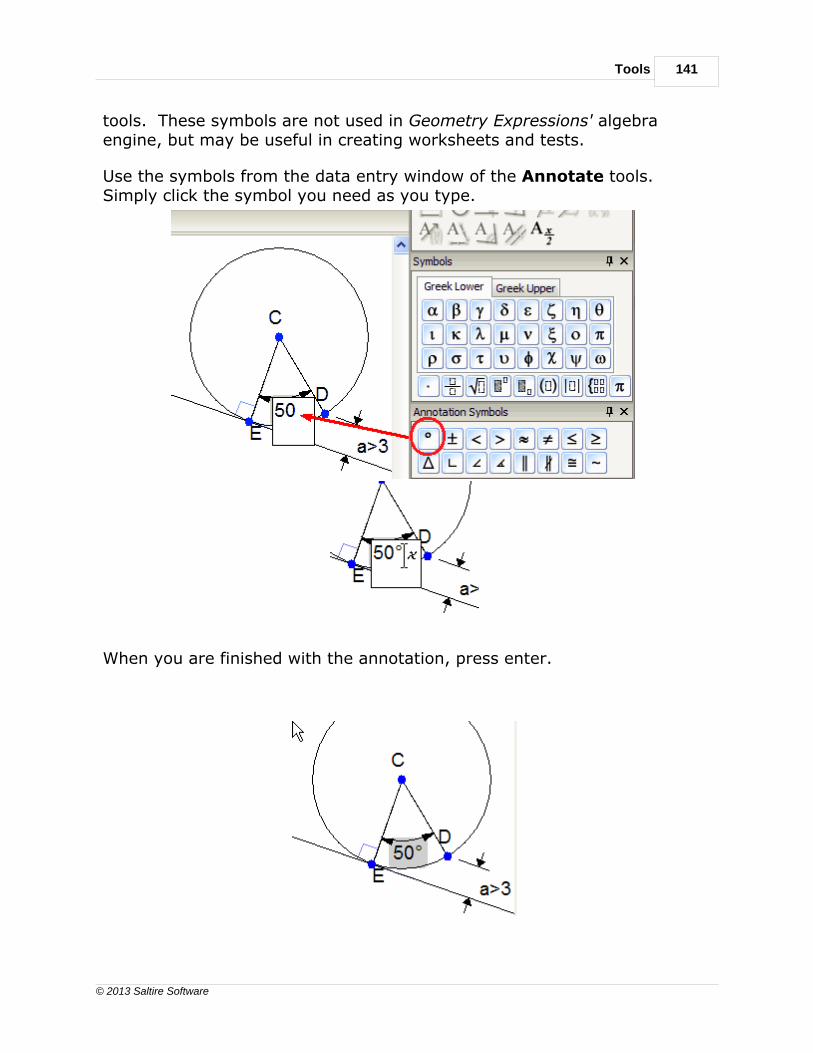
Tools 141
© 2013 Saltire Software
tools. These symbols are not used in Geometry Expressions' algebraengine, but may be useful in creating worksheets and tests.
Use the symbols from the data entry window of the Annotate tools.Simply click the symbol you need as you type.
When you are finished with the annotation, press enter.

142
© 2013 Saltire Software
Geometry Expressions Manual
Font trouble - some of the Annotation Symbols may not show up inyour drawing, depending on your OS and the default font setting. (Windows 7 users have no worries.) If you don't see an AnnotationSymbol, change the Edit / Preferences / Math / Annotation / Font /Face Name. Try one of the Unicode fonts, e.g. Lucida Sans Unicode. Ifyou are exporting a Metafile, you may have to change the default font inthe program to which you are exporting.
System Variables and Animation

Tools 143
© 2013 Saltire Software
Investigating Variables
The Variables toolbox reports all the variables you have used in thediagram and lets you manipulate their values.
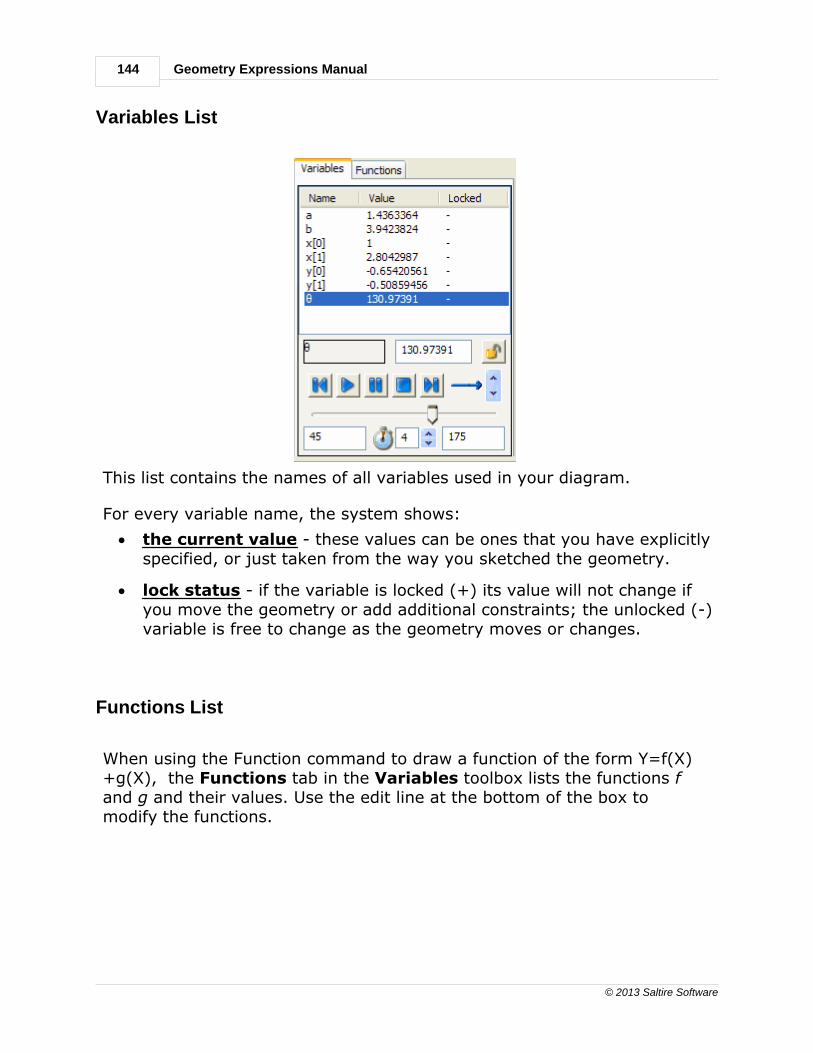
144
© 2013 Saltire Software
Geometry Expressions Manual
Variables List
This list contains the names of all variables used in your diagram.
For every variable name, the system shows:
· the current value - these values can be ones that you have explicitlyspecified, or just taken from the way you sketched the geometry.
· lock status - if the variable is locked (+) its value will not change ifyou move the geometry or add additional constraints; the unlocked (-)variable is free to change as the geometry moves or changes.
Functions List
When using the Function command to draw a function of the form Y=f(X)+g(X), the Functions tab in the Variables toolbox lists the functions fand g and their values. Use the edit line at the bottom of the box tomodify the functions.

Tools 145
© 2013 Saltire Software
Using the Lock Tool
By default, when you drag points in a Geometry Expressions model, it willadjust the numerical sample values used in the various parameters of themodel to accommodate the drag, as best it can.
For example, in the model of a 4 bar linkage below, dragging point B willcause lengths a and b and angle q to be adjusted appropriately.
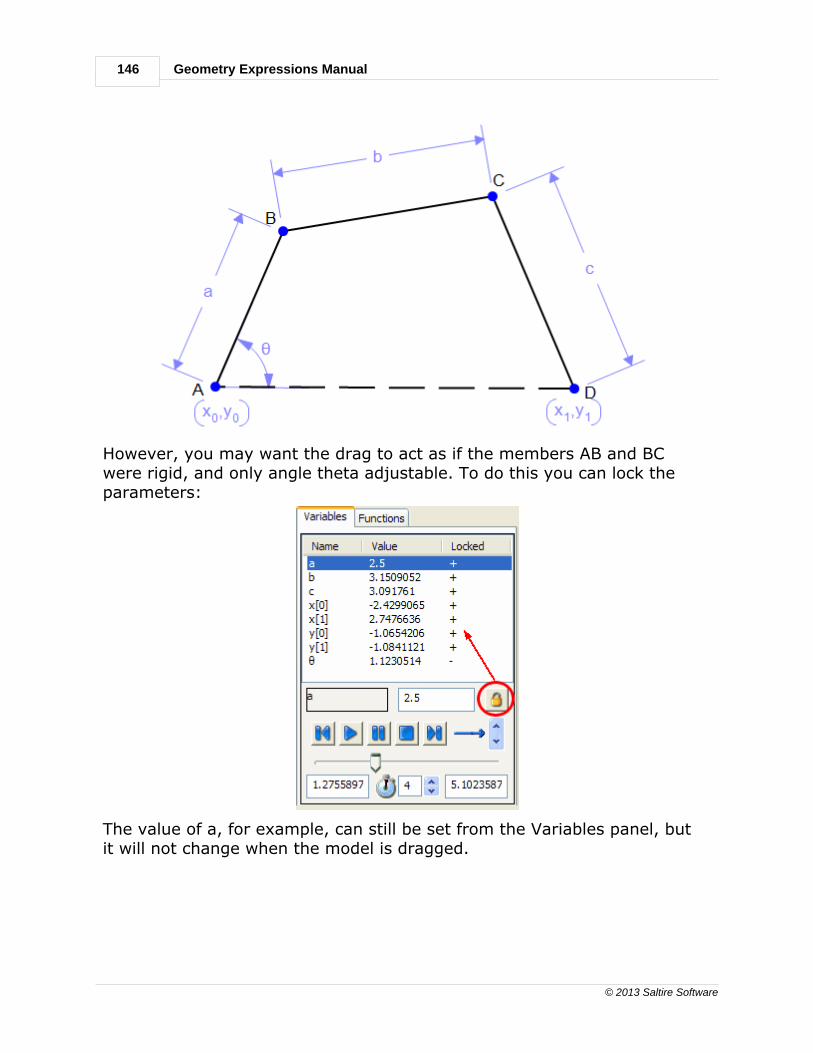
146
© 2013 Saltire Software
Geometry Expressions Manual
However, you may want the drag to act as if the members AB and BCwere rigid, and only angle theta adjustable. To do this you can lock theparameters:
The value of a, for example, can still be set from the Variables panel, butit will not change when the model is dragged.

Tools 147
© 2013 Saltire Software
Changing and Locking the Variable Value
To make a change to the variable list, first click anyplace in the row of thevariable you want to change. That row will be highlighted.
To change the value: highlight the value in the edit window and type thenew value.
To change the lock status: just click the button -
to unlock a locked variable
to lock an open variable
Animation
Your geometry comes to life with the Animation tools. You simply need toselect the parameter that drives the animation, give it a range, then Play.
In the diagram below we select q for the crank of this linkage.

148
© 2013 Saltire Software
Geometry Expressions Manual
Click the headings below for details on the animation buttons andwindows:
· Animation console - works like a video player.
· Animation modes - indicates how the range for the animation isstepped through.
· Animation values and duration - where you specify the speed and therange for the driving parameter.
Users of numeric interactive geometry systems may be familiar with theconcept of animation based on points animated along line segments orcurves. This type of animation can be conveniently modeled in GeometryExpressions using the point proportional along a curve constraint alongwith parameter based animation.

Tools 149
© 2013 Saltire Software
Animation Console
The Animation console works like a standard videoconsole with the Play, Pause, and Stop buttons as well as advance tothe Beginning and End buttons.
Animation Modes
The animation modes can be changed with the up/down arrowbuttons. The modes are:
Runs the animation one time through the specified range.
Runs the animation continuously from the beginning to the endof the range.
Runs the animation one time forward and then backwardthrough the specified range.
Runs the animation continuously forward and then backwardthrough the specified range.
Animation Values and Duration
These animation buttons help you adjust the range and speed of theanimation.
· Click and drag the slider along the bar to manually animate thedrawing.
· In the two data entry windows at the bottom right and left of thetoolbox, specify the range of the animation.
· The Duration box in the center lets you specify how long theanimation takes to play one time through. Values are between 1 and
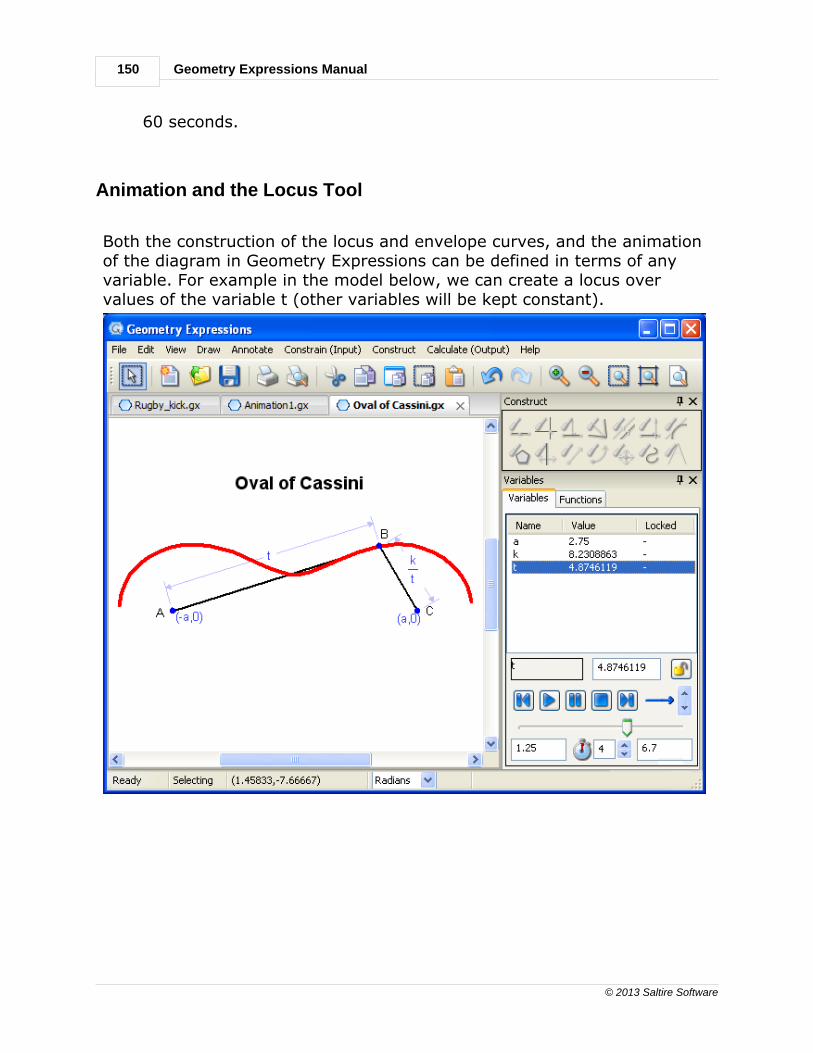
150
© 2013 Saltire Software
Geometry Expressions Manual
60 seconds.
Animation and the Locus Tool
Both the construction of the locus and envelope curves, and the animationof the diagram in Geometry Expressions can be defined in terms of anyvariable. For example in the model below, we can create a locus overvalues of the variable t (other variables will be kept constant).

IXMenus and Icons

152
© 2013 Saltire Software
Geometry Expressions Manual
Many of the menus and icons across the top of the screen duplicate thecommands and functions found in the toolboxes.
File Menu
The File menu contains the standard Windows file handling operationswith options for copying and exporting to other programs. Several of theoptions are also available from the icon bar.
Menu Option Function
NewCreates a new project.
New Graph Graph mode allows scaling of axes.
Open. . .Brings up the Select a File dialog box so youcan open a project.
Close Closes the current file or, if multiple files areopen, the file on top.
SaveSaves the file. If you have not yet saved thecurrent work to a file, the Save File Asdialog box lets you specify where to save theproject file.
Save As . . . Brings up the Save File As dialog box toenter a new or different path / file name. Useful for making a backup.
Open Workbook Brings up the Open Workbook dialog box.If any other files are open, they will be closedwhen you select the workbook.
Save Workbook Saves all tabbed pages as a single workspace(.gxw), so you can open them all at once.
Save Workbook as Saves all tabbed pages as a single workbook

Menus and Icons 153
© 2013 Saltire Software
(.gxw) and lets you specify a new or differentpath / file name for the workbook.
Close Workbook Closes the current workbook. If you havemade changes to pages, you will be asked ifyou want to save them individually (.gx files).
Import Figure fromFigure Gallery
A shortcut containing common geometryfigures that you may need for creatingworksheets or other documents.
Import GX File fromGeometry Atlas
Import one of the many interesting theoremsand problems already constructed. Browsethrough the files and select one to explore.
Export Export the file as Windows Metafile (.emf) (Windows version only), image file, anEncapsulated PostScript (.eps), HTML file (.html), animated gif, JavaScript file, Lua app,or OS X Dashboard Widget.
Page Setup. . . Displays the page setup dialog box forchoosing a printer and print options.
Print PreviewDisplays the printout by pages.
Print. . .Displays the standard system Print dialog.
Recent files Click to display a list of the most recentlyused files. Selecting one opens it.
Exit Exits the program, after prompting for save.
Importing Files from the Figure Gallery
Are there figures which you need to use frequently? The Figure Gallerymakes your tasks easier. Browse through the folders to see the manyobjects, graphs and transformation examples which you can use and tailorto your needs without starting from scratch.
Figure Gallery database file is copied to your computer when you install

154
© 2013 Saltire Software
Geometry Expressions Manual
Geometry Expressions.
Here are the steps to import a figure:
1. Select File / Import Figure from Figure Gallery
2. Double click a folder or sub-folder (or click and press Select in thelower right corner) to view of the problems in a category. You canalso use the search window to find files.
3. Double click a problem (or click and press Select) to see an enlargedview
4. Click the Import button (it replaces the Select button in the lower rightcorner) to bring the drawing into your drawing window.
Use the Toggle Hidden function from the general context menu to modifyconstraints in the drawing, or try dragging the geometry to suit yourneeds. Don't forget to Save.

Menus and Icons 155
© 2013 Saltire Software
Navigating the Figure Gallery
The Figure Gallery is arranged in the usual tree structure containingfolders and sub-folders.
Back - takes you up one level.
Home - takes you to the top level.
Use the Search window to find a specific file or types of files. Enter thesearch word(s) and click Go.
Text at the top center of the dialog tells you which level is displayed. ClickHome to return to the top level.
Importing Files from the Geometry Atlas
The Geometry Atlas is a huge collection of interesting theorems andproblems which are already constructed, waiting for you to discover theirmysteries. You just need to have internet access.

156
© 2013 Saltire Software
Geometry Expressions Manual
Browse through the atlas, organized in the usual tree structure bygeometry element. Here are the steps:
1. Make sure your computer is on-line.
2. Select File / Import GX File from Geometry Atlas.
3. Double click a folder or sub-folder (or select the folder and press the Select button) to view the problems or sub-folder.
4. Double click a problem (or select the problem and press Select) to seean enlarged view.
5. Click the Import button to bring the drawing into your drawingwindow.
Browsing the Atlas
takes you up one level.
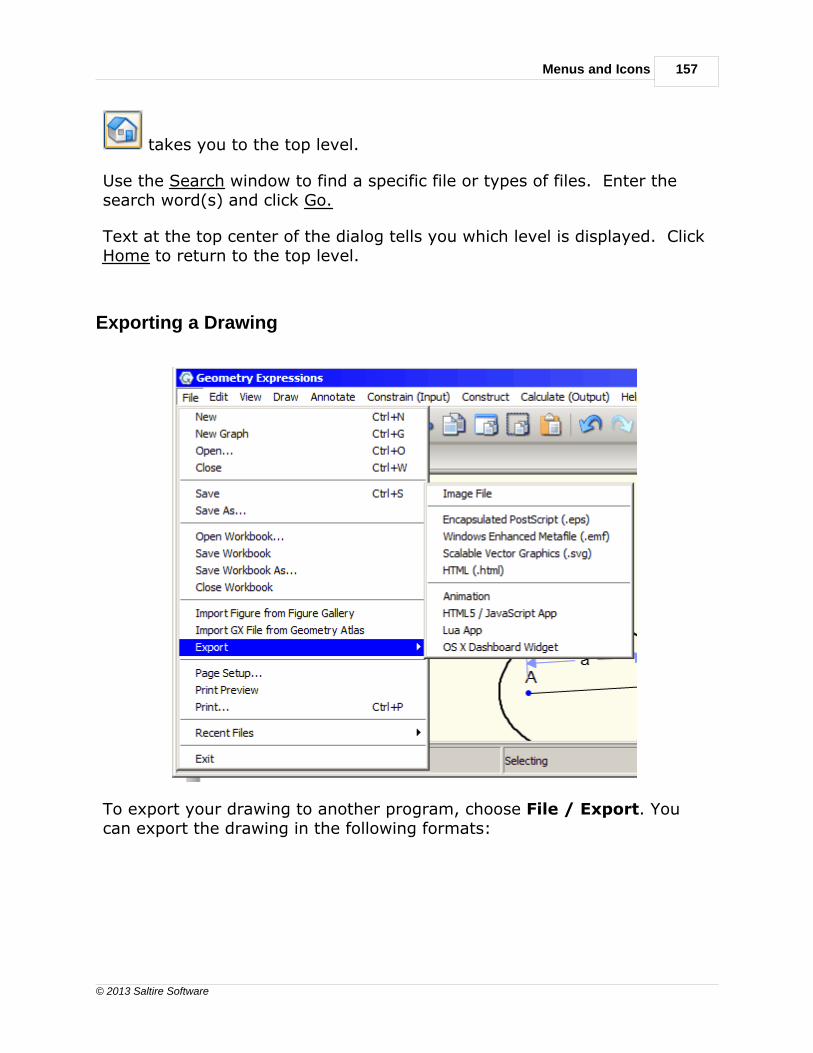
Menus and Icons 157
© 2013 Saltire Software
takes you to the top level.
Use the Search window to find a specific file or types of files. Enter thesearch word(s) and click Go.
Text at the top center of the dialog tells you which level is displayed. ClickHome to return to the top level.
Exporting a Drawing
To export your drawing to another program, choose File / Export. Youcan export the drawing in the following formats:

158
© 2013 Saltire Software
Geometry Expressions Manual
Static File Formats Dynamic FileFormats
· Image - BMP, JPEG,TIFF, PNG, XMP
· Animated GIF
· EncapsulatedPostscript
· HTML5 /JavaScript App
· Windows EnhancedMetafile
· Lua App
· Scalable VectorGraphics
· OS XDashboardWidget
· HTML
Please note that neither EMF, nor EPS support semi-transparency ortransparent images of any kind, thus you will get a warning message ifyou try to export to either of these formats and you have such an item inthe document.
Here are the steps for the export as an Image file, EPS, EMF, SVG orHTML:
1. For all file types enter the Filename or click the folder icon to select theappropriate folder and file.
2. Image files and HTML files have an extra step at this point as detailedbelow.
3. Select the region of the drawing with the displayed cursor (click-and-drag opposite corners of the region).
Animation Files and JavaScript Files have a few more details to consider asexplained below.
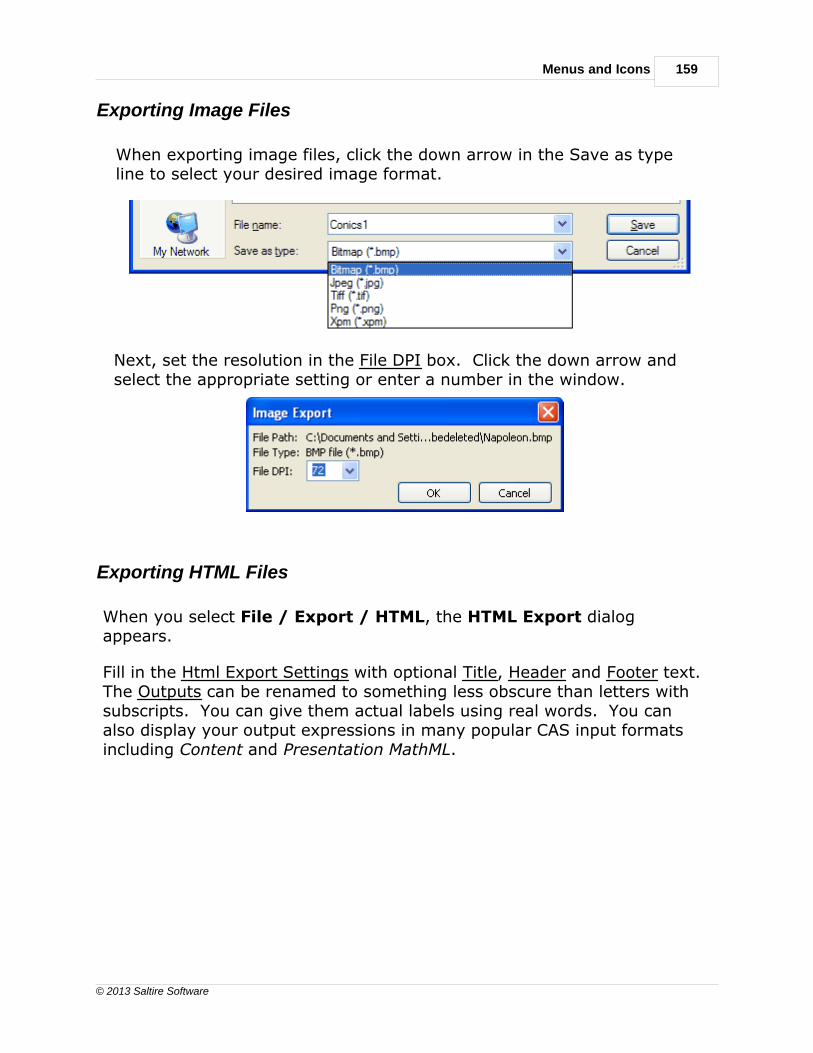
Menus and Icons 159
© 2013 Saltire Software
Exporting Image Files
When exporting image files, click the down arrow in the Save as typeline to select your desired image format.
Next, set the resolution in the File DPI box. Click the down arrow andselect the appropriate setting or enter a number in the window.
Exporting HTML Files
When you select File / Export / HTML, the HTML Export dialogappears.
Fill in the Html Export Settings with optional Title, Header and Footer text.The Outputs can be renamed to something less obscure than letters withsubscripts. You can give them actual labels using real words. You canalso display your output expressions in many popular CAS input formatsincluding Content and Presentation MathML.
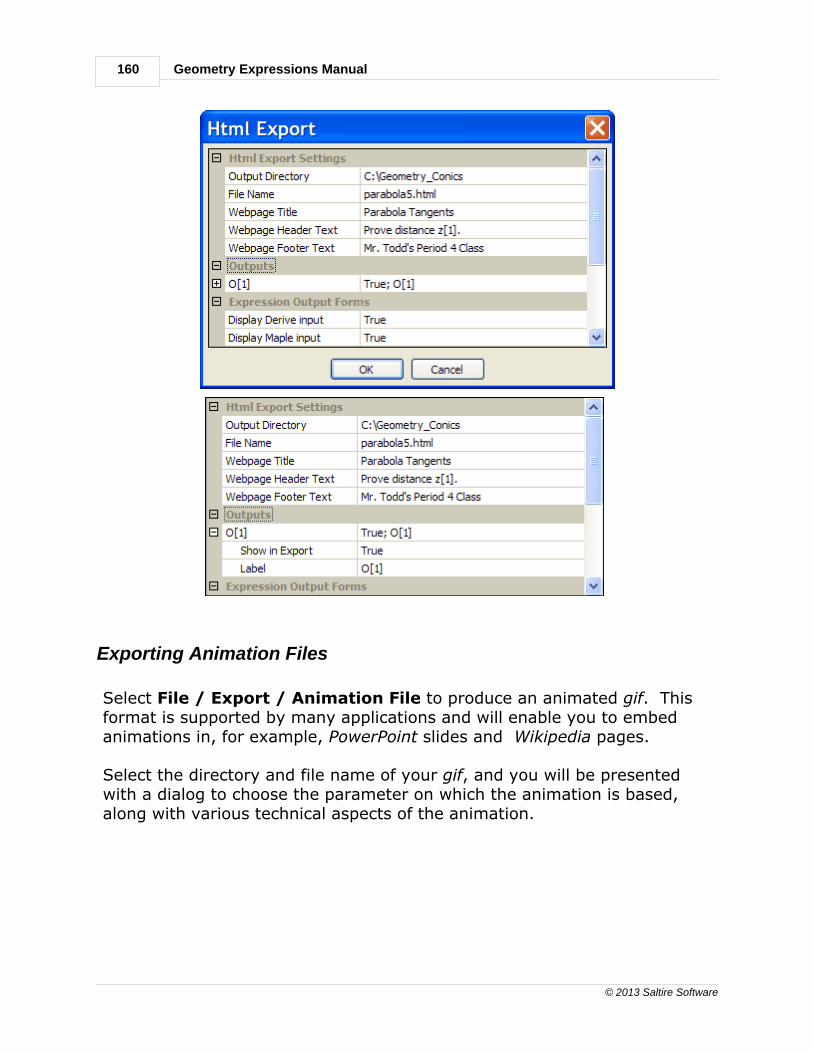
160
© 2013 Saltire Software
Geometry Expressions Manual
Exporting Animation Files
Select File / Export / Animation File to produce an animated gif. Thisformat is supported by many applications and will enable you to embedanimations in, for example, PowerPoint slides and Wikipedia pages.
Select the directory and file name of your gif, and you will be presentedwith a dialog to choose the parameter on which the animation is based,along with various technical aspects of the animation.

Menus and Icons 161
© 2013 Saltire Software
File DPI - specify the resolution of the output. The higher number youuse, the slower will be the process of creating and loading the animation.
Frames Per Second - if you multiply this number by the animationduration specified in the Variables toolbox, you will get the number offrames captured. For example if you are set at 10 frames per second,and the Variables toolbox specifies the duration of the animation to be 4seconds, then 40 frames will be captured. The more frames you capture,the slower will be the animation creation process, and the longer theanimation will take to load.
Number of iterations - when an animation is played (e.g. when aPowerPoint slide containing the animation is displayed), enter a numberto play the animation a specific number of times, or enter 0 to play itcontinuously.
Variable - choose the variable that controls the animation. (All thevariables in the Variables toolbox should be available). The limits of thevariable defining the range of the animation should be set in the Variables toolbox.
Exporting JavaScript Files
Select File / Export / [HTML5 / JavaScript App] - to export aGeometry Expressions model as a JavaScript application (.html file), withinan html page. This can then run within any web browser that supportsHTML 5.
Fill out the details in the JavaScript Applet Generator dialog.

162
© 2013 Saltire Software
Geometry Expressions Manual
Output directory - tells Gx where to put the files. It will create a file: name.html in the specified directory. You should be able to bringname.html up in a browser to see the applet.
Applet Name - is the name of the html file.
Auto-scale - when set to True, the JavaScript applet automatically rescalesthe drawing when the user changes the value of one of the inputs; whenset to False, you click-and-drag a rectangle around the drawing after youclick Ok.
Width and Height specify the size of the drawing on the html page.
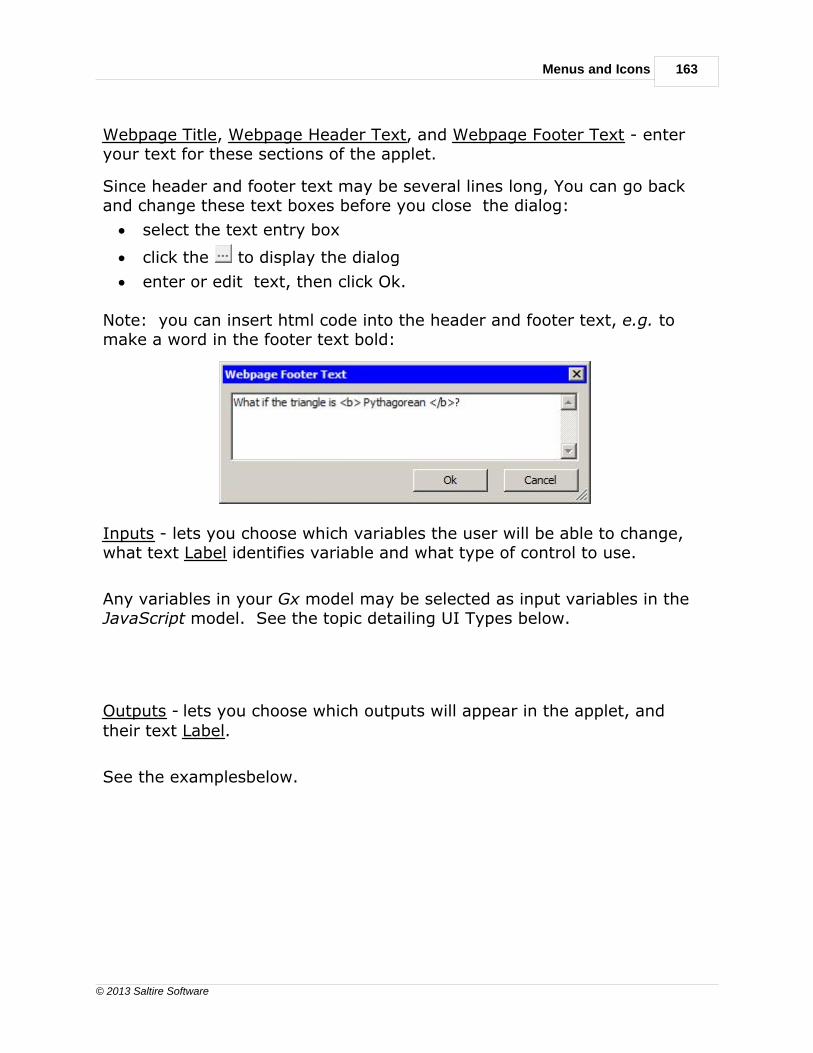
Menus and Icons 163
© 2013 Saltire Software
Webpage Title, Webpage Header Text, and Webpage Footer Text - enteryour text for these sections of the applet.
Since header and footer text may be several lines long, You can go backand change these text boxes before you close the dialog:
· select the text entry box
· click the to display the dialog
· enter or edit text, then click Ok.
Note: you can insert html code into the header and footer text, e.g. tomake a word in the footer text bold:
Inputs - lets you choose which variables the user will be able to change,what text Label identifies variable and what type of control to use.
Any variables in your Gx model may be selected as input variables in theJavaScript model. See the topic detailing UI Types below.
Outputs - lets you choose which outputs will appear in the applet, andtheir text Label.
See the examplesbelow.

164
© 2013 Saltire Software
Geometry Expressions Manual
JavaScript Applet Example
We’ll use this Gx model, displaying the radius of an incircle to create aJavaScript Applet.
Here are the parameters we entered in the JavaScript Applet Generatordialog:
Here is the result:
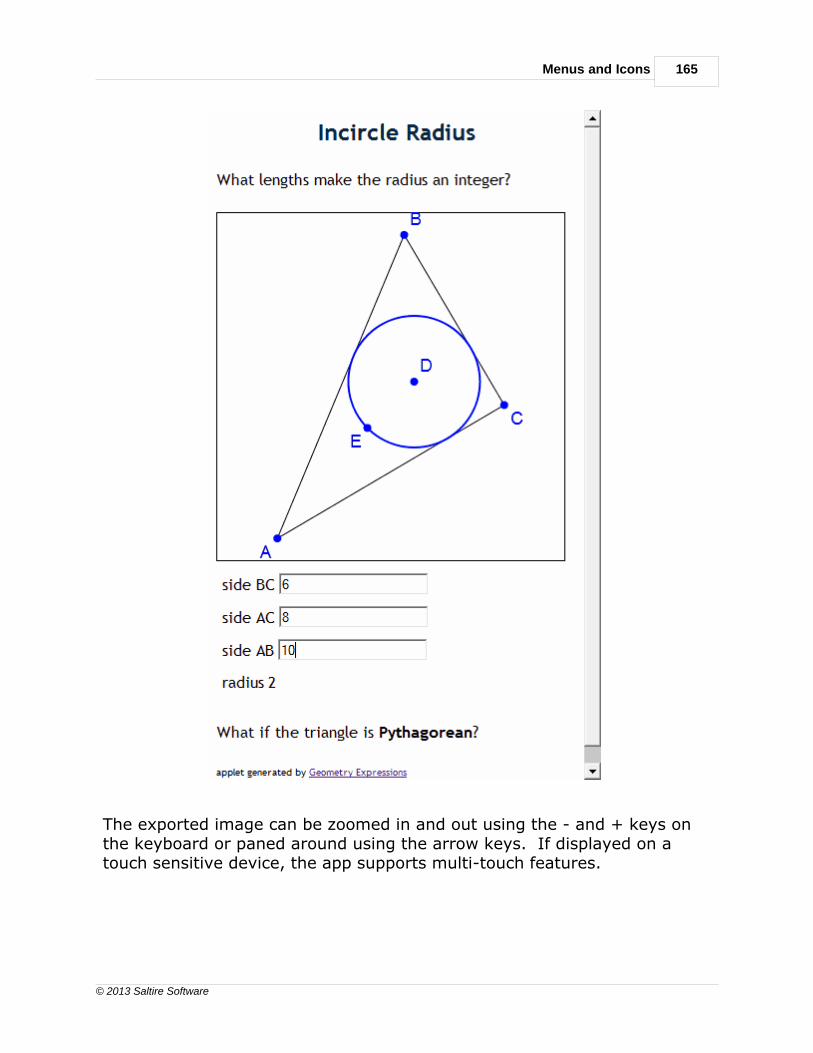
Menus and Icons 165
© 2013 Saltire Software
The exported image can be zoomed in and out using the - and + keys onthe keyboard or paned around using the arrow keys. If displayed on atouch sensitive device, the app supports multi-touch features.

166
© 2013 Saltire Software
Geometry Expressions Manual
JavaScript Animated Applet
In this applet, we'll draw a general function, f(x) and then create its
derivative at t (using the Point proportional constraint). Here is theGx drawing:
Here are the parameters we entered in the JavaScript Applet Generatordialog:

Menus and Icons 167
© 2013 Saltire Software
Selecting slider for the UI Type of variable t we now have the Go/Stopbutton to control the animation of t between the ranges defined in theVariables panel above.
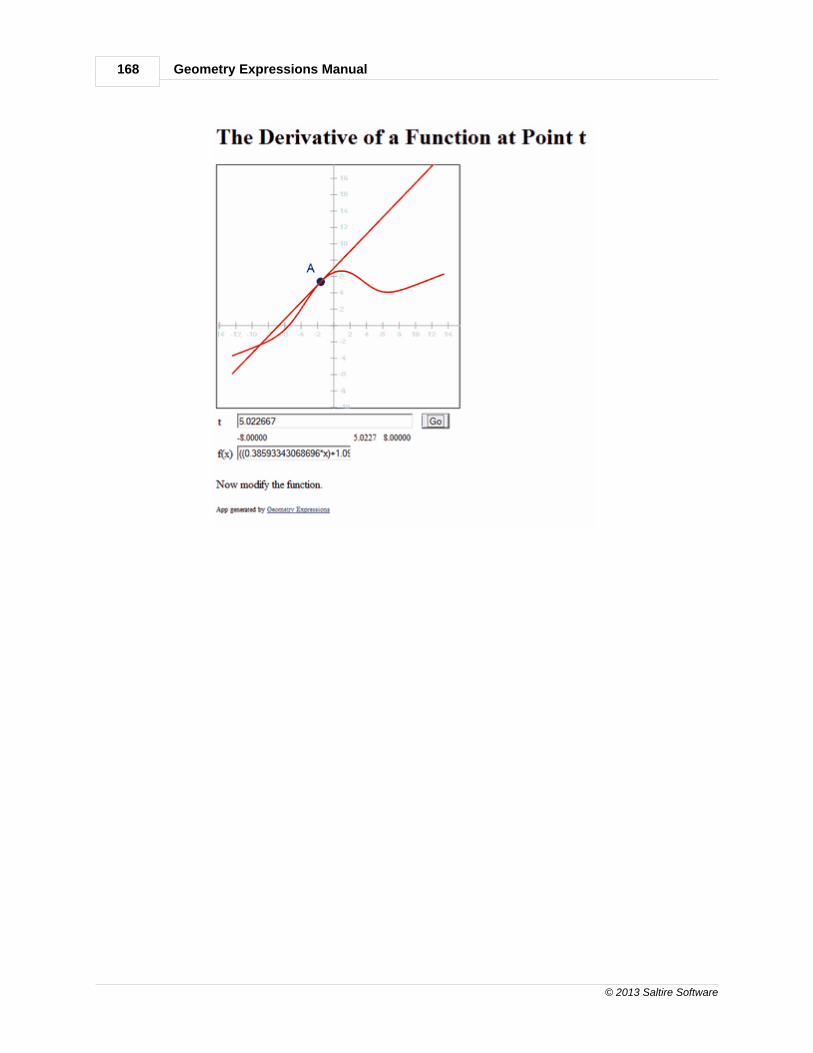
168
© 2013 Saltire Software
Geometry Expressions Manual

Menus and Icons 169
© 2013 Saltire Software
To modify the function, simply type a new one in the edit field. A multi-line function allows more options.
Creating Lua Applets
If you have a TI-NspireÔ calculator, you can put your GeometryExpressions model on it by creating an interactive Lua app.
Variables can be adjusted from a text box or with a slider. Any points inthe Geometry Expressions model constrained by variable Coordinates ora variable parameter for the Point Proportional constraint can be set asdraggable points in the Lua app.
After you create your Gx model select File / Export /Lua App. Fill outthe details in the Lua App Generator dialog.

170
© 2013 Saltire Software
Geometry Expressions Manual
Output directory - tells Gx where to put the file. It will create a file: name.tns in the specified directory.
Applet Name - is the name of the Lua (.tns) file.
Auto-scale - when set to True, the Lua applet automatically rescales thedrawing when the user changes the value of one of the inputs; when setto False, you are prompted to click-and-drag a rectangle around thedrawing after you click Ok.
Inputs - lets you choose which variables the user will be able to change,what text is displayed for the variable and what type of control to use.
Any variables in your Gx model may be selected as input variables inthe Lua app. See the topic detailing UI Types below.
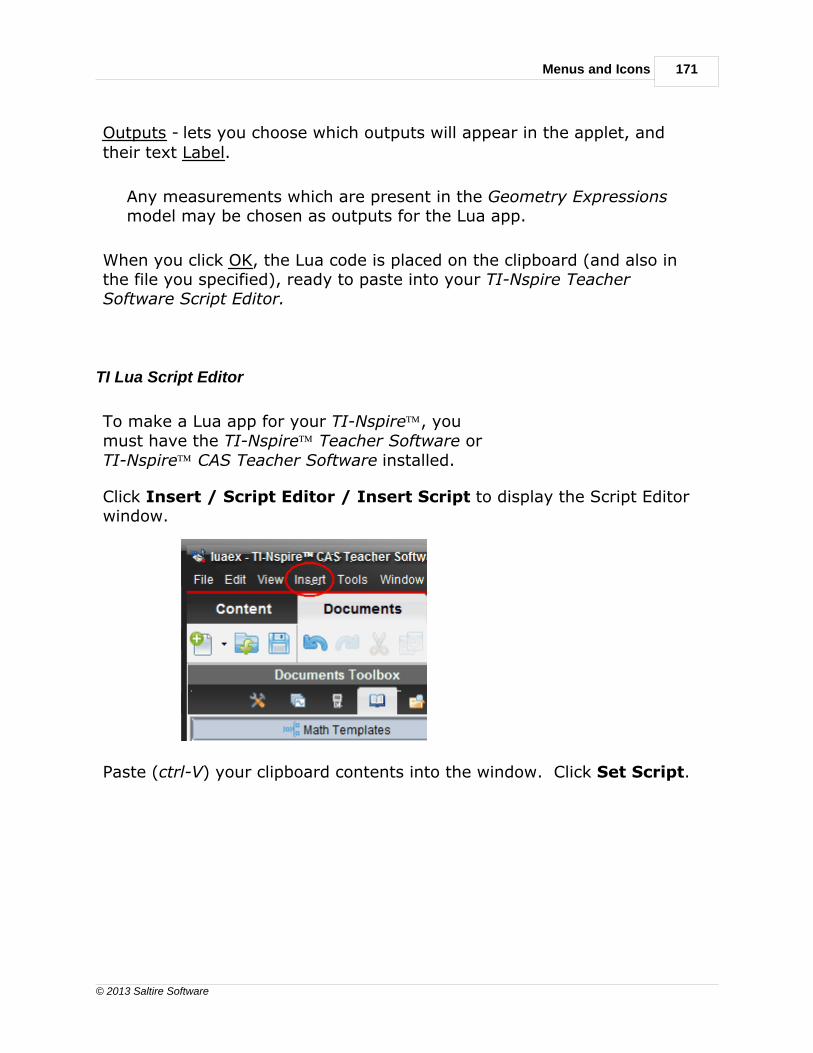
Menus and Icons 171
© 2013 Saltire Software
Outputs - lets you choose which outputs will appear in the applet, andtheir text Label.
Any measurements which are present in the Geometry Expressionsmodel may be chosen as outputs for the Lua app.
When you click OK, the Lua code is placed on the clipboard (and also inthe file you specified), ready to paste into your TI-Nspire TeacherSoftware Script Editor.
TI Lua Script Editor
To make a Lua app for your TI-NspireÔ, youmust have the TI-NspireÔ Teacher Software orTI-NspireÔ CAS Teacher Software installed.
Click Insert / Script Editor / Insert Script to display the Script Editorwindow.
Paste (ctrl-V) your clipboard contents into the window. Click Set Script.

172
© 2013 Saltire Software
Geometry Expressions Manual
The app appears in the previous window.
The exported image lets you zoom in and out using - and + keys on thekeyboard or pan the image using the arrow keys.
Creating OS X Dashboard Widgets
Dashboard Widgets are very similar to JavaScript Applets, but they sit onThe Mac Dashboard. Select File / Export /OS X Dashboard Widgets.
Fill out the details in the OS X Dashboard Widget Generator dialog.

Menus and Icons 173
© 2013 Saltire Software
Output directory - tells Gx where to put the files. It will create a folder: name.wdgt containing all the components of the widget.
Widget Name - is the name of the folder and the main .html file.
Auto-scale - when set to True, the Widget automatically rescales thedrawing when the user changes the value of one of the inputs; when setto False, you click-and-drag a rectangle around the drawing after youclick Ok.
Width and Height specify the size of the drawing in the Widget box.
Widget Title, Widget Header Text, and Widget Footer Text - enter yourtext for these sections.
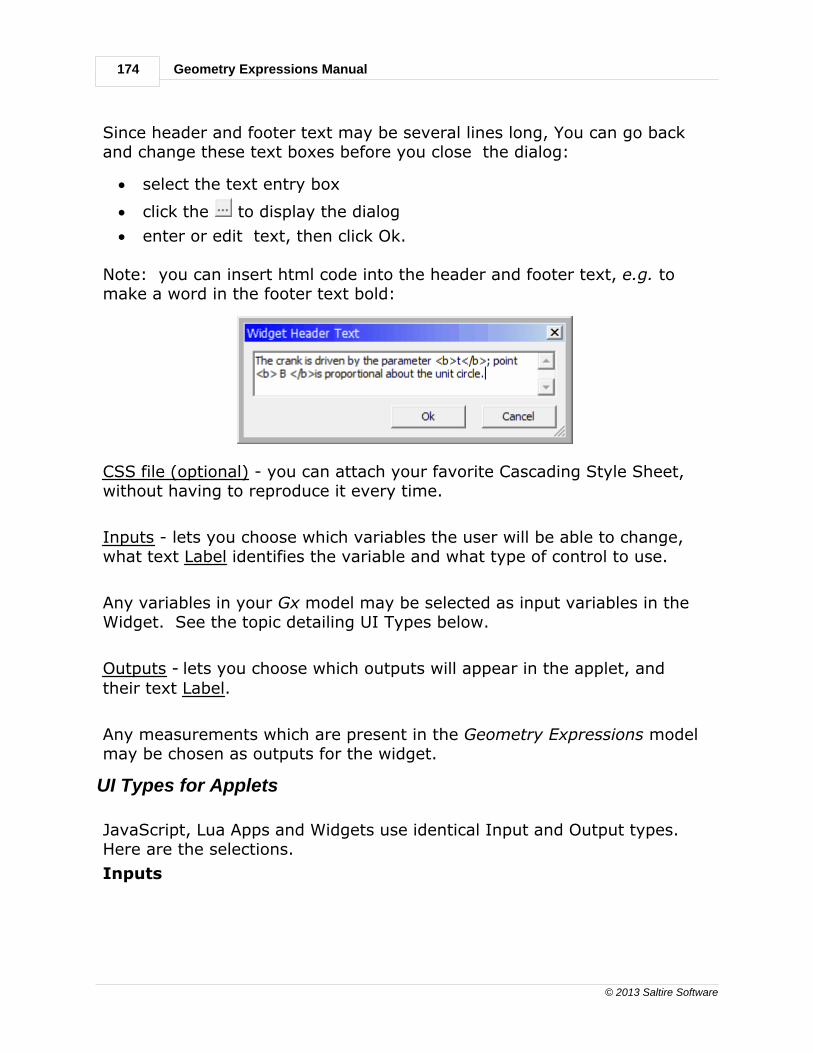
174
© 2013 Saltire Software
Geometry Expressions Manual
Since header and footer text may be several lines long, You can go backand change these text boxes before you close the dialog:
· select the text entry box
· click the to display the dialog
· enter or edit text, then click Ok.
Note: you can insert html code into the header and footer text, e.g. tomake a word in the footer text bold:
CSS file (optional) - you can attach your favorite Cascading Style Sheet,without having to reproduce it every time.
Inputs - lets you choose which variables the user will be able to change,what text Label identifies the variable and what type of control to use.
Any variables in your Gx model may be selected as input variables in theWidget. See the topic detailing UI Types below.
Outputs - lets you choose which outputs will appear in the applet, andtheir text Label.
Any measurements which are present in the Geometry Expressions modelmay be chosen as outputs for the widget.
UI Types for Applets
JavaScript, Lua Apps and Widgets use identical Input and Output types. Here are the selections.
Inputs
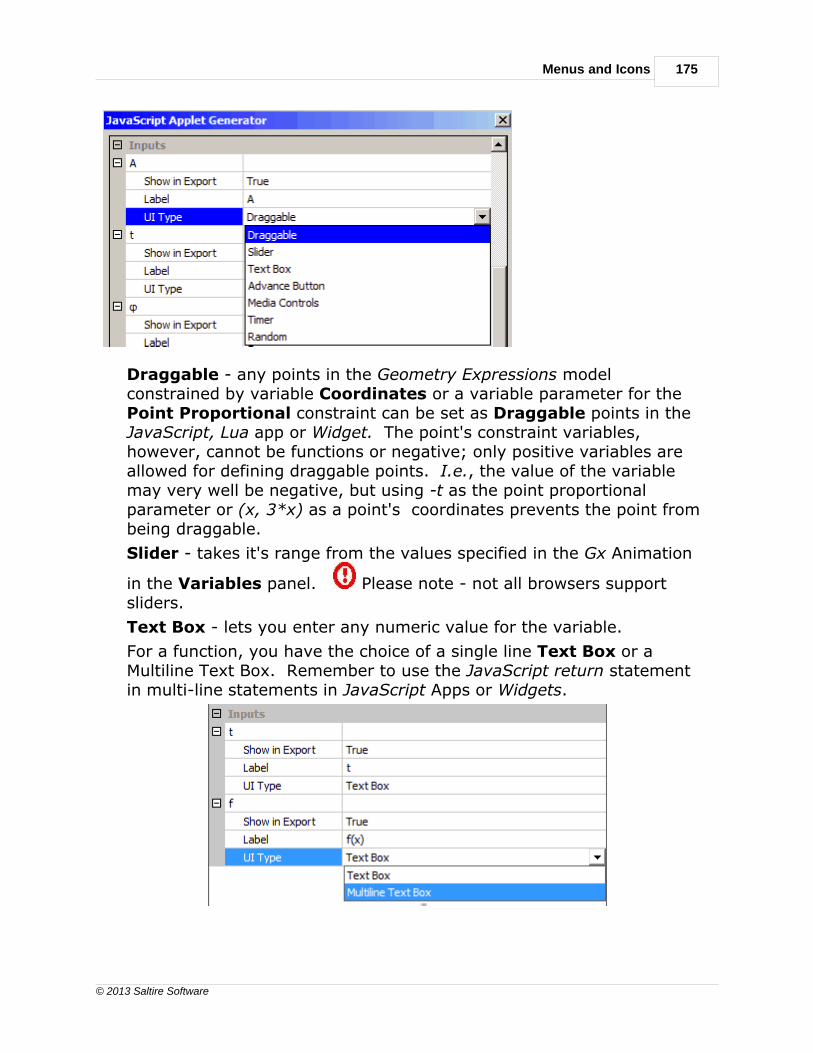
Menus and Icons 175
© 2013 Saltire Software
Draggable - any points in the Geometry Expressions modelconstrained by variable Coordinates or a variable parameter for thePoint Proportional constraint can be set as Draggable points in theJavaScript, Lua app or Widget. The point's constraint variables,however, cannot be functions or negative; only positive variables areallowed for defining draggable points. I.e., the value of the variablemay very well be negative, but using -t as the point proportionalparameter or (x, 3*x) as a point's coordinates prevents the point frombeing draggable.
Slider - takes it's range from the values specified in the Gx Animation
in the Variables panel. Please note - not all browsers supportsliders.
Text Box - lets you enter any numeric value for the variable.
For a function, you have the choice of a single line Text Box or aMultiline Text Box. Remember to use the JavaScript return statementin multi-line statements in JavaScript Apps or Widgets.
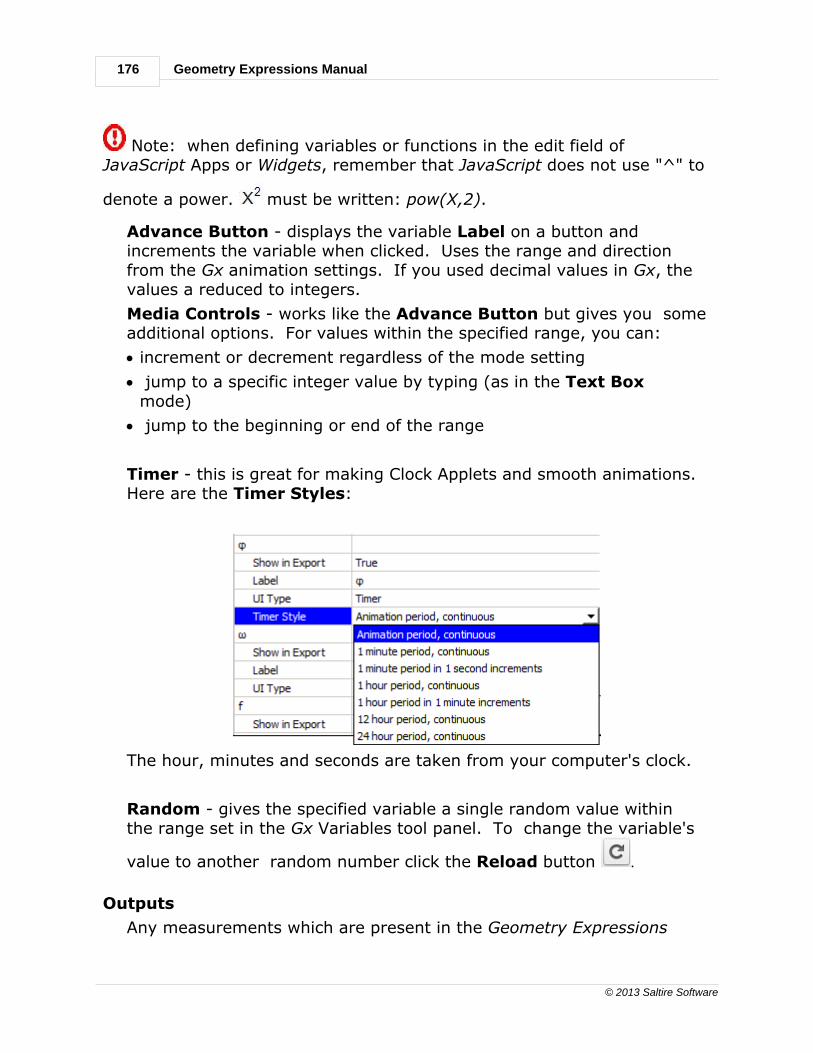
176
© 2013 Saltire Software
Geometry Expressions Manual
Note: when defining variables or functions in the edit field ofJavaScript Apps or Widgets, remember that JavaScript does not use "^" to
denote a power. must be written: pow(X,2).
Advance Button - displays the variable Label on a button andincrements the variable when clicked. Uses the range and directionfrom the Gx animation settings. If you used decimal values in Gx, thevalues a reduced to integers.
Media Controls - works like the Advance Button but gives you someadditional options. For values within the specified range, you can:
· increment or decrement regardless of the mode setting
· jump to a specific integer value by typing (as in the Text Boxmode)
· jump to the beginning or end of the range
Timer - this is great for making Clock Applets and smooth animations.Here are the Timer Styles:
The hour, minutes and seconds are taken from your computer's clock.
Random - gives the specified variable a single random value withinthe range set in the Gx Variables tool panel. To change the variable's
value to another random number click the Reload button .
Outputs
Any measurements which are present in the Geometry Expressions
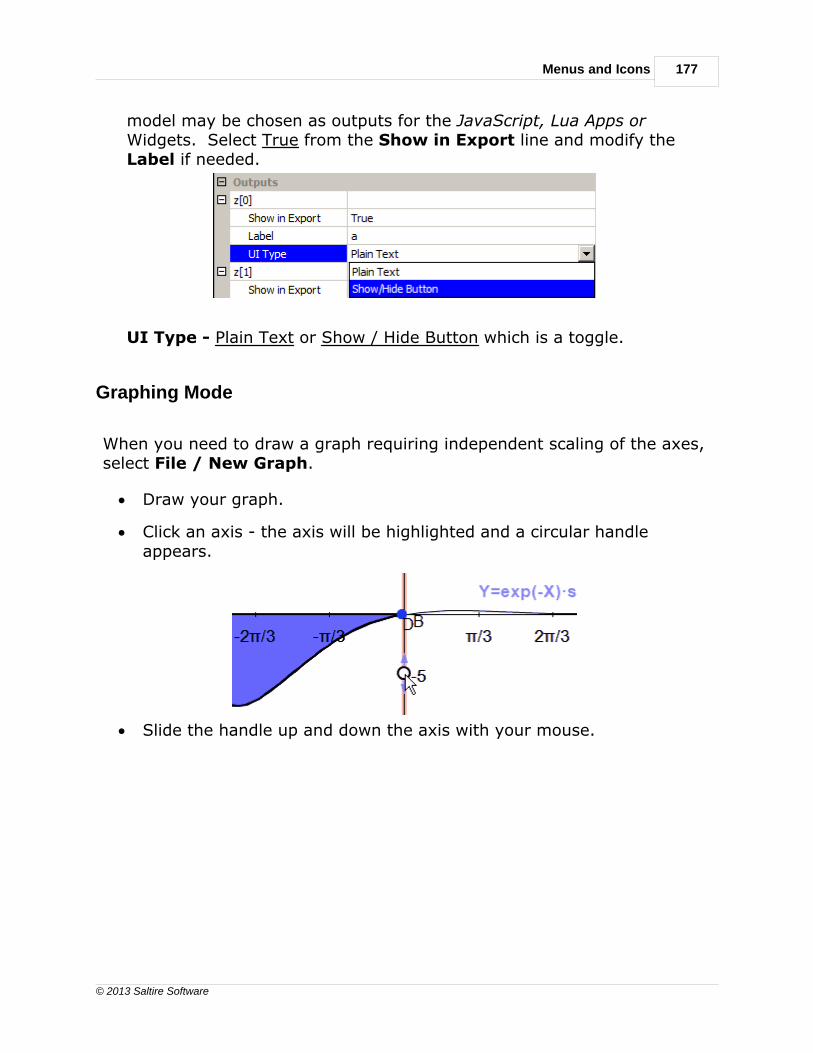
Menus and Icons 177
© 2013 Saltire Software
model may be chosen as outputs for the JavaScript, Lua Apps or Widgets. Select True from the Show in Export line and modify theLabel if needed.
UI Type - Plain Text or Show / Hide Button which is a toggle.
Graphing Mode
When you need to draw a graph requiring independent scaling of the axes,select File / New Graph.
· Draw your graph.
· Click an axis - the axis will be highlighted and a circular handle appears.
· Slide the handle up and down the axis with your mouse.
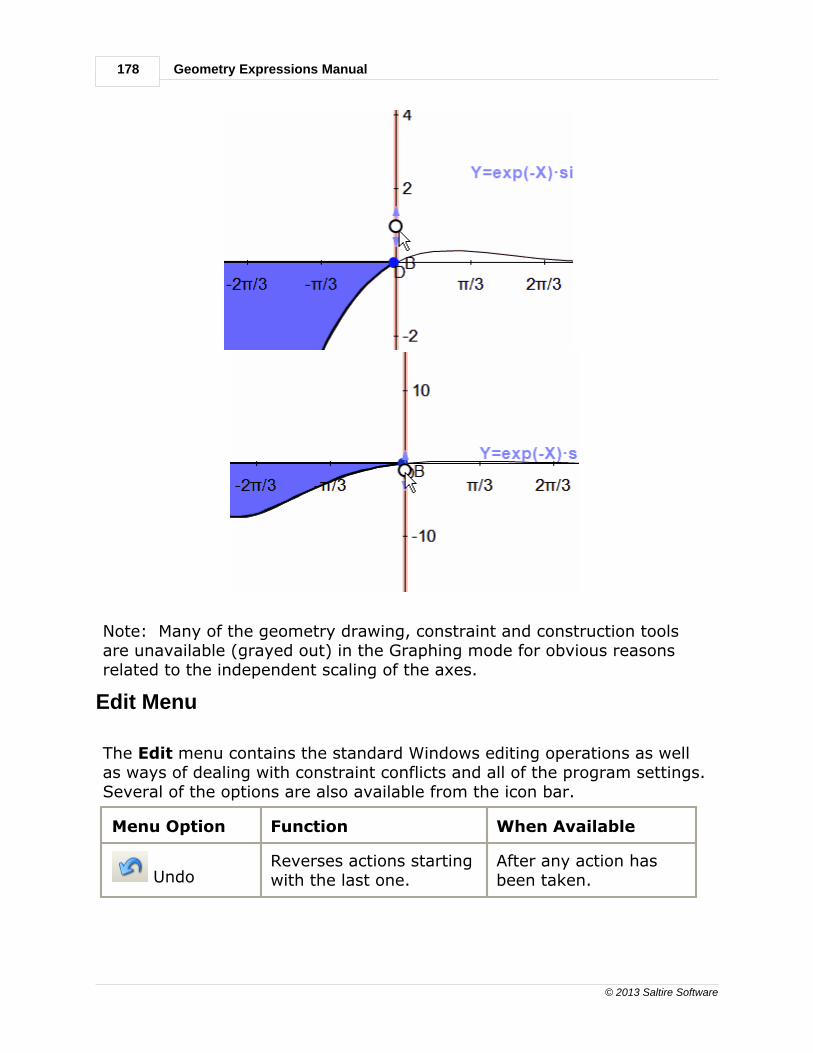
178
© 2013 Saltire Software
Geometry Expressions Manual
Note: Many of the geometry drawing, constraint and construction toolsare unavailable (grayed out) in the Graphing mode for obvious reasonsrelated to the independent scaling of the axes.
Edit Menu
The Edit menu contains the standard Windows editing operations as wellas ways of dealing with constraint conflicts and all of the program settings.Several of the options are also available from the icon bar.
Menu Option Function When Available
UndoReverses actions startingwith the last one.
After any action hasbeen taken.

Menus and Icons 179
© 2013 Saltire Software
RedoReinstates actionsstarting with the last onethat was undone.
After using Undo
Select When checked, the selectmode is active.
Select mode is alwaysactive except whenusing a Drawing tool ormoving or panning thedrawing.
Select All Selects everything in thedrawing window.
Always
Clear Selection Unselects any objectsthat are selected.
Always
CutDeletes an object, butsaves it so it can bepasted somewhere else.
An object is selected
CopyDoes not delete theobject, but saves is so itcan be pastedsomewhere else.
An object is selected
Copy As Displays a submenu ofchoices for copyingmathematics into otherprograms.
An expression orformula is selected
CopyDrawing
Copies everything in thedrawing window as anEnhanced Metafile (.emf)
Always
CopyRegion
Copies a section of thedrawing window inside arectangle made bydragging the cursor.
Always
PastePuts whatever has beencut or copied into thecurrent drawing
Object(s) cut or copied

180
© 2013 Saltire Software
Geometry Expressions Manual
Delete Deletes whatever isselected, without savingit.
One or more objectsselected
Arrange For placing selectedobjects on top of (bringforward) or underneath(send backward) otherobjects for easierselection and viewing.
One or more objectsselected
Send to Mathematica
Inputs the math to Mathematica when thealgebra system is runningin another window.
Windows versiononly
An output expressionor formula is selected
Convert toConstraint
Tries to convert aselected output [ 2q] toan input constraint ifthere is no conflict withother constraints
An output expression isselected
Convert toMeasurement
Converts the selectedconstraint into ameasurement (output)
An input constraint isselected
Convert to Real Converts a symboliccalculation to a real one
A symbolic output isselected
Convert toSymbolic
Converts a realcalculation to a symbolicone
A real output isselected
Details. . . Displays the Edit Textdialog to edit a block oftext
A block of text isselected
Parameters. . . Lets you edit theparameters of functions,loci and traces.
A function, locus ortrace is selected
Properties. . . Lets you edit the displayproperties of the selectedobject(s)
One or more objects ofthe same type areselected
Menus and Icons 181
© 2013 Saltire Software
Preferences . . . Sets the defaultappearance andproperties for theproject's drawing, textand mathematics
Always
NOTE: For the Mac version, Preferences are found under the GeometryExpressions menu.
Copying Mathematics
To copy expressions or functions into an Algebra system or anotherprogram:
· Select the math from the Diagram or the Output window.
· Select Edit / Copy As or right-click the selected expression todisplay the submenu of choices for copying expressions or functionsfrom Geometry Expressions to another program.
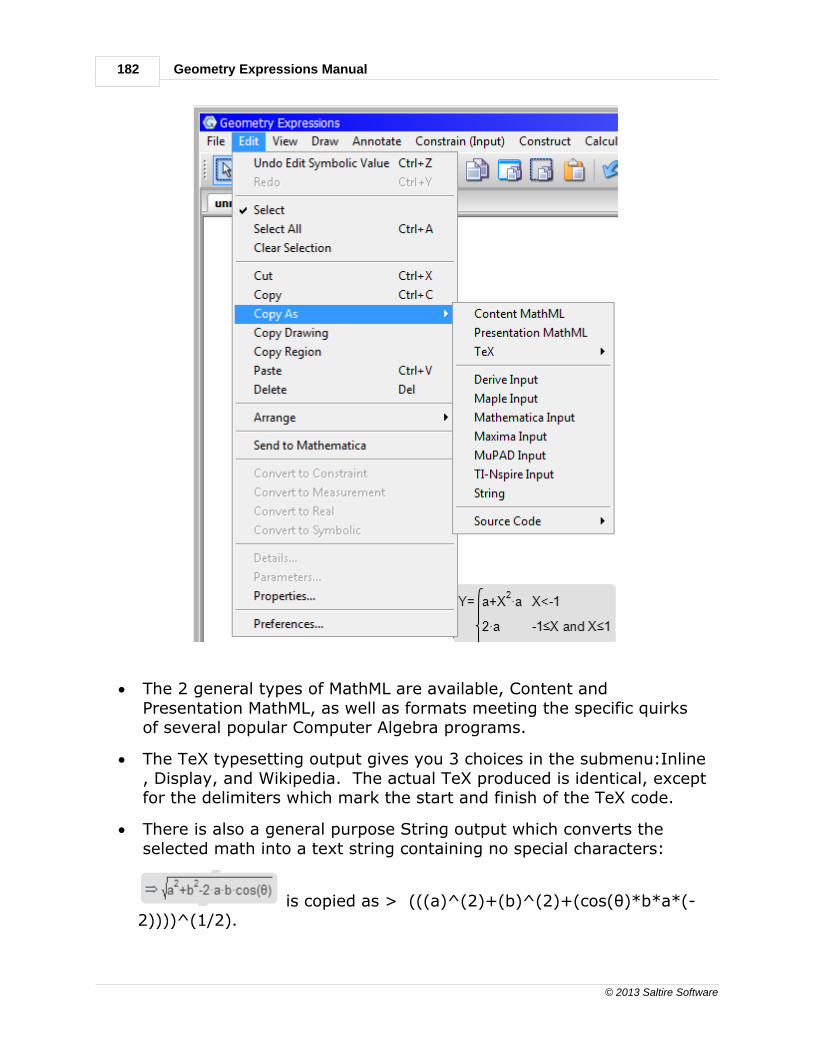
182
© 2013 Saltire Software
Geometry Expressions Manual
· The 2 general types of MathML are available, Content andPresentation MathML, as well as formats meeting the specific quirksof several popular Computer Algebra programs.
· The TeX typesetting output gives you 3 choices in the submenu:Inline, Display, and Wikipedia. The actual TeX produced is identical, exceptfor the delimiters which mark the start and finish of the TeX code.
· There is also a general purpose String output which converts theselected math into a text string containing no special characters:
is copied as > (((a)^(2)+(b)^(2)+(cos(θ)*b*a*(-2))))^(1/2).

Menus and Icons 183
© 2013 Saltire Software
· Generate Source Code from Geometry Expressions in a number ofdifferent languages:
When you make a submenu selection, the selected math is copied to the Windows clipboard, ready to be pasted into the appropriate application(Ctrl+V).
Generating Source Code
You can generate computer source code from Geometry Expressions in anumber of different languages.
There are two types of expression in Geometry Expressions:
· Scalar
· Vector
The source code will be in a different form depending on whether thereare intermediate variables present or not.
Note that there is not much difference between the languages in themathematical expressions they generate. The main differences are:
· C#, Java, Javascript, ActionScript, Visual Basic (.net), and Luaprefixes math functions with “Math.”
· C / C++ and VBA do not use any prefix for the math functions
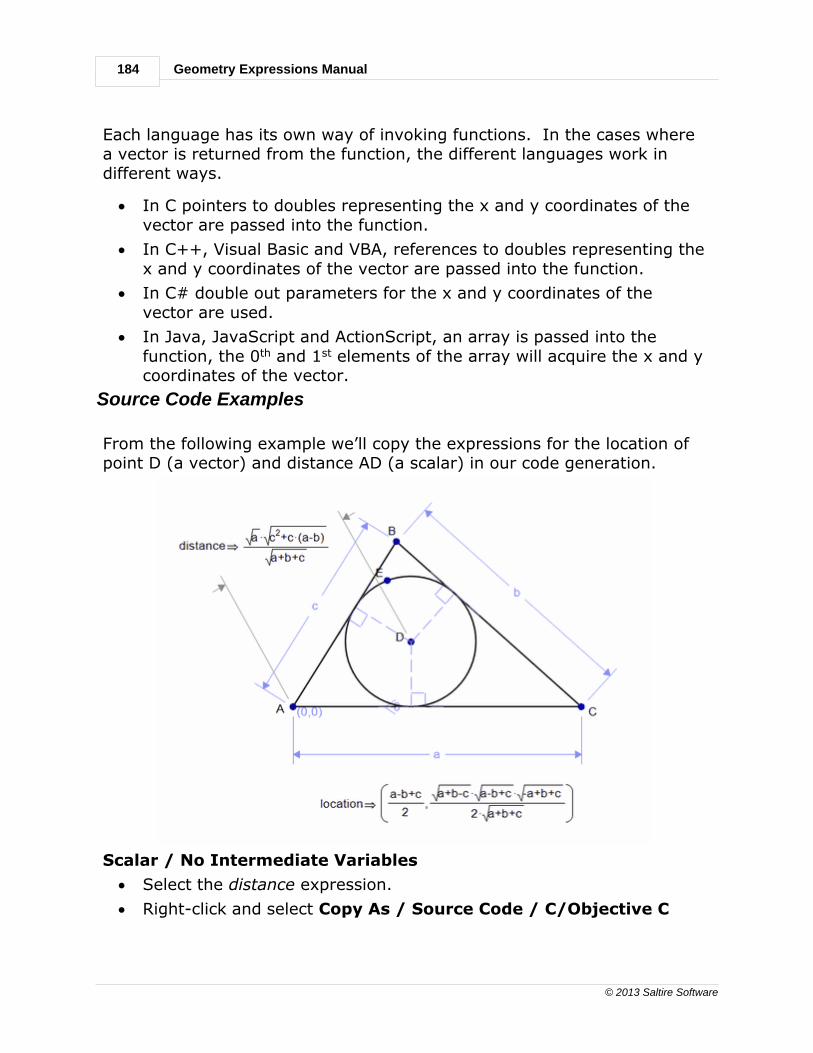
184
© 2013 Saltire Software
Geometry Expressions Manual
Each language has its own way of invoking functions. In the cases wherea vector is returned from the function, the different languages work indifferent ways.
· In C pointers to doubles representing the x and y coordinates of thevector are passed into the function.
· In C++, Visual Basic and VBA, references to doubles representing thex and y coordinates of the vector are passed into the function.
· In C# double out parameters for the x and y coordinates of thevector are used.
· In Java, JavaScript and ActionScript, an array is passed into thefunction, the 0th and 1st elements of the array will acquire the x and ycoordinates of the vector.
Source Code Examples
From the following example we’ll copy the expressions for the location ofpoint D (a vector) and distance AD (a scalar) in our code generation.
Scalar / No Intermediate Variables
· Select the distance expression.
· Right-click and select Copy As / Source Code / C/Objective C

Menus and Icons 185
© 2013 Saltire Software
In this case the code generates a single expression (here we aregenerating C):
(pow((pow(c,2)+((a+(b*-1))*c)),0.5)*pow((a+b+c),-0.5)*pow(a,0.5)).
Scalar / Intermediate Variables
With intermediate variables showing we get the following for the distanceexpression:
double distance(
double a ,
double b ,
double c )
{
double d_1;
double v_1;
double phi_0;
double d_2;
double d_0;
double u_1;
d_1 =(pow(((a*-1)+b+c),0.5)*pow((a+(b*-1)+c),0.5)*pow((a+b+(c*-1)),0.5)*pow((a+b+c),0.5));
v_1 = (d_1*pow(a,-1)*0.5);
phi_0 = ((a+b+c)*v_1*pow(c,-1)*pow(b,-1));
d_2 = (v_1*pow(b,-1)*a*-1);
d_0 = (pow(a,2)+(pow(b,2)*-1)+pow(c,2));
u_1 = (d_0*pow(a,-1)*0.5);
return(pow(fabs(phi_0),-1)*fabs(d_2)*pow((pow(c,2)+(u_1*c*2)+pow(u_1,2)+pow(v_1,2)),0.5)*pow(c,-1));
}
We see that the name of the function is the name of the expression inGeometry Expressions, its parameters are the input variables, and itsreturn value is the value of the expression.
Vector / Intermediate Variables
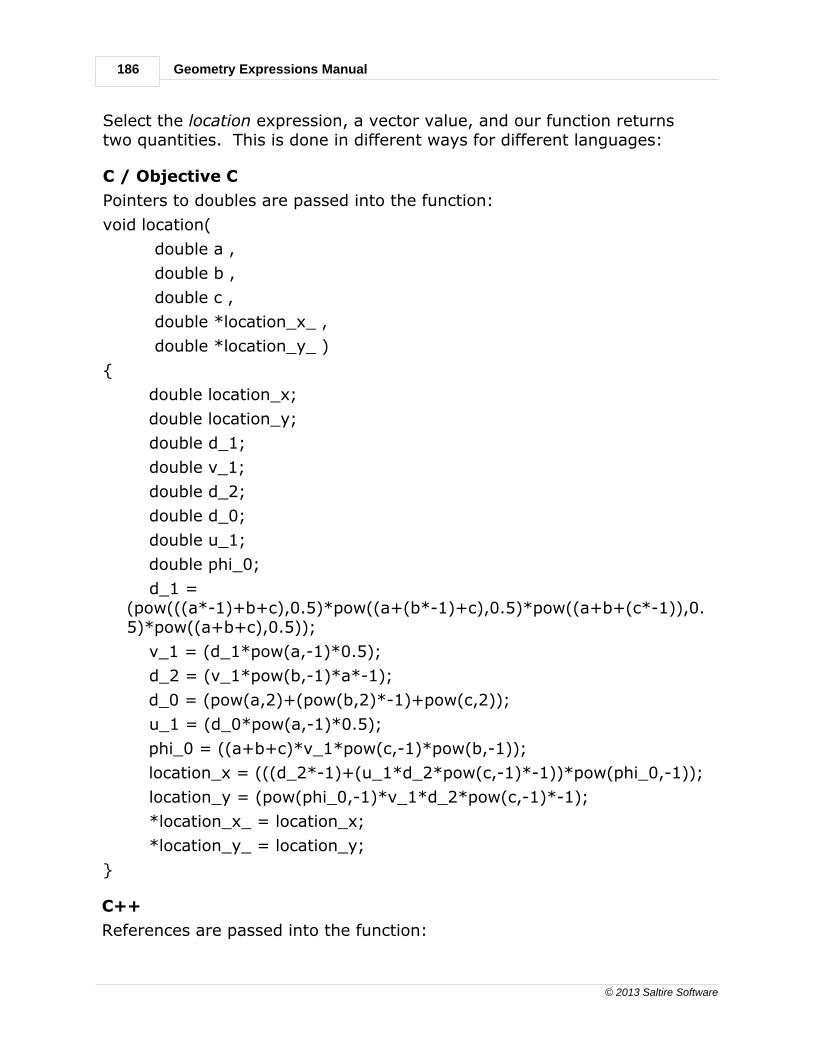
186
© 2013 Saltire Software
Geometry Expressions Manual
Select the location expression, a vector value, and our function returnstwo quantities. This is done in different ways for different languages:
C / Objective C
Pointers to doubles are passed into the function:
void location(
double a ,
double b ,
double c ,
double *location_x_ ,
double *location_y_ )
{
double location_x;
double location_y;
double d_1;
double v_1;
double d_2;
double d_0;
double u_1;
double phi_0;
d_1 =(pow(((a*-1)+b+c),0.5)*pow((a+(b*-1)+c),0.5)*pow((a+b+(c*-1)),0.5)*pow((a+b+c),0.5));
v_1 = (d_1*pow(a,-1)*0.5);
d_2 = (v_1*pow(b,-1)*a*-1);
d_0 = (pow(a,2)+(pow(b,2)*-1)+pow(c,2));
u_1 = (d_0*pow(a,-1)*0.5);
phi_0 = ((a+b+c)*v_1*pow(c,-1)*pow(b,-1));
location_x = (((d_2*-1)+(u_1*d_2*pow(c,-1)*-1))*pow(phi_0,-1));
location_y = (pow(phi_0,-1)*v_1*d_2*pow(c,-1)*-1);
*location_x_ = location_x;
*location_y_ = location_y;
}
C++
References are passed into the function:
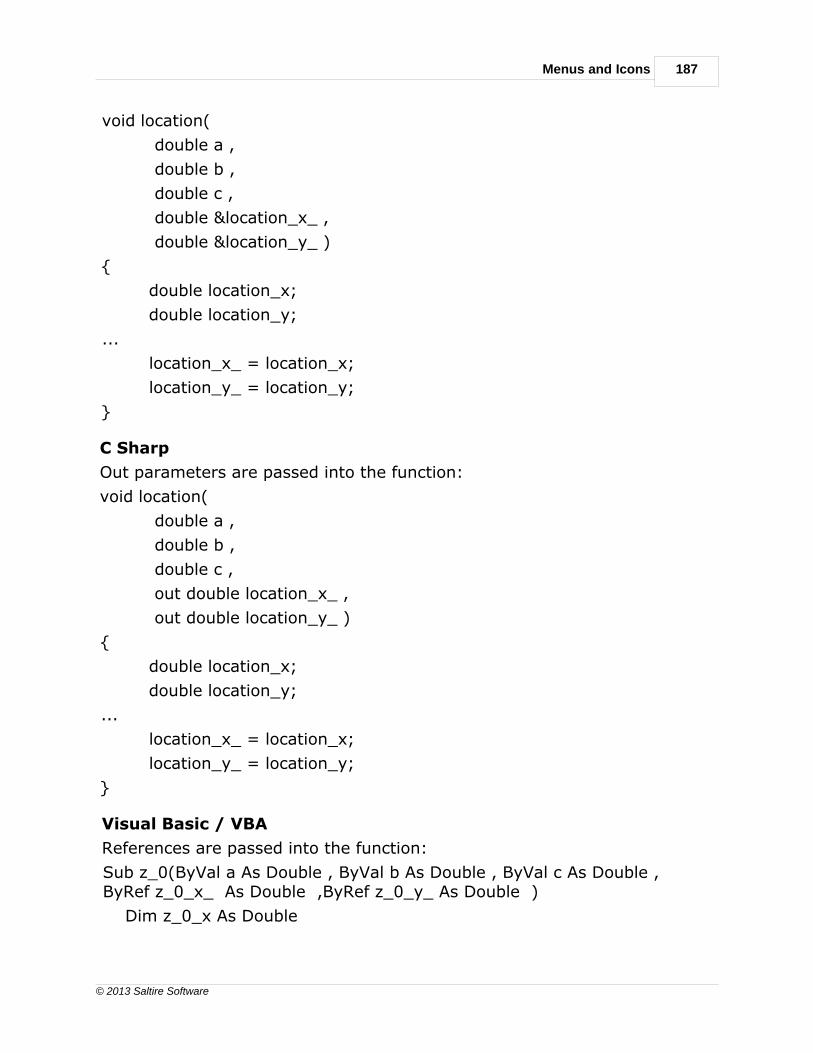
Menus and Icons 187
© 2013 Saltire Software
void location(
double a ,
double b ,
double c ,
double &location_x_ ,
double &location_y_ )
{
double location_x;
double location_y;
...
location_x_ = location_x;
location_y_ = location_y;
}
C Sharp
Out parameters are passed into the function:
void location(
double a ,
double b ,
double c ,
out double location_x_ ,
out double location_y_ )
{
double location_x;
double location_y;
...
location_x_ = location_x;
location_y_ = location_y;
}
Visual Basic / VBA
References are passed into the function:
Sub z_0(ByVal a As Double , ByVal b As Double , ByVal c As Double ,ByRef z_0_x_ As Double ,ByRef z_0_y_ As Double )
Dim z_0_x As Double

188
© 2013 Saltire Software
Geometry Expressions Manual
Dim z_0_y As Double
…
z_0_x_ = z_0_x
z_0_y_ = z_0_y
End Sub
Java
An array of doubles of size 2 is passed in and populated by the function:
double location(
double a ,
double b ,
double c ,
double[] location_v )
{
double location(
double a ,
double b ,
double c ,
double[] location_v )
{
double location_x = 0;
double location_y = 0;
...
location_v[0] = location_x;
location_v[1] = location_y;
}
JavaScript
An array is passed in and populated by the function:
function location(
a ,
b ,
c ,
location_v )
{

Menus and Icons 189
© 2013 Saltire Software
var location_x = 0;
var location_y = 0;
...
location_v[0] = location_x;
location_v[1] = location_y;
}
Action Script
An array is passed in and populated by the function:
public function location(
a:Number ,
b:Number ,
c:Number ,
location_v:Array) )
:void
{
var location_x:Number;
var location_y:Number;
…
location_v[0] = location_x;
location_v[1] = location_y;
}
View Menu
The table below lists the complete summary of View functions.
Menu Option Function When Available
Hide Hides a selection One or more elementsare selected.
Show all Displays any entities thatwere hidden
One or more elementsare hidden.
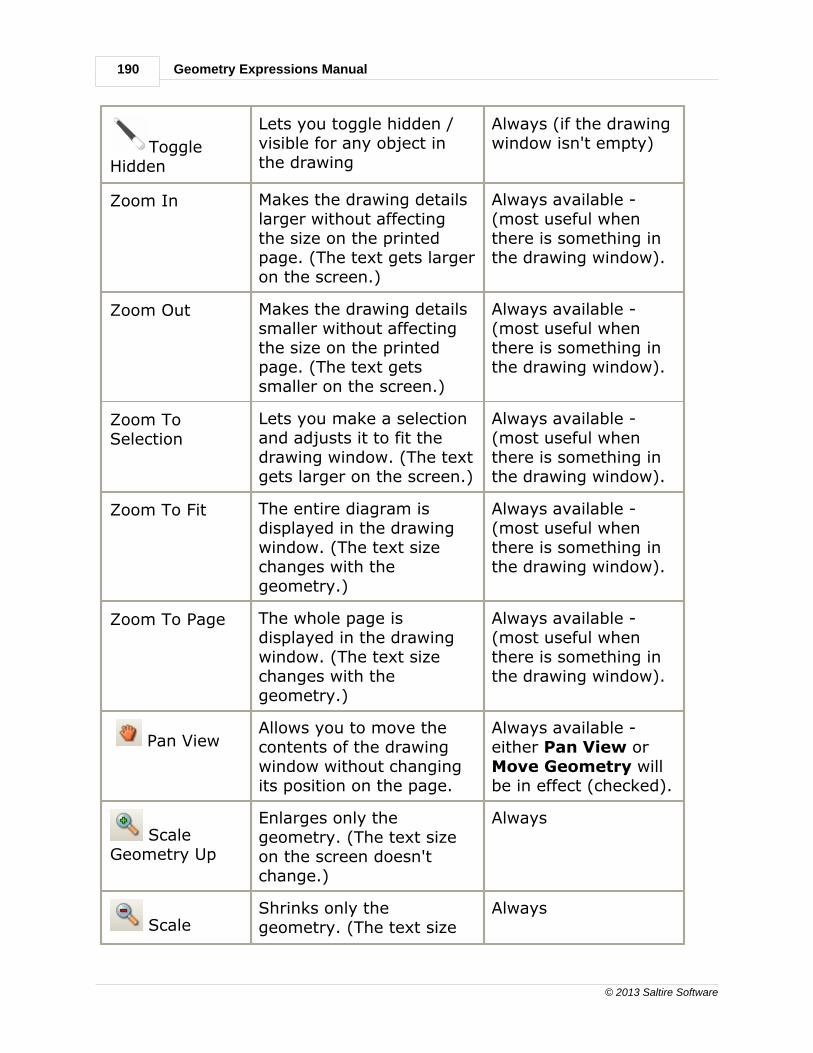
190
© 2013 Saltire Software
Geometry Expressions Manual
ToggleHidden
Lets you toggle hidden /visible for any object inthe drawing
Always (if the drawingwindow isn't empty)
Zoom In Makes the drawing detailslarger without affectingthe size on the printedpage. (The text gets largeron the screen.)
Always available -(most useful whenthere is something inthe drawing window).
Zoom Out Makes the drawing detailssmaller without affectingthe size on the printedpage. (The text getssmaller on the screen.)
Always available -(most useful whenthere is something inthe drawing window).
Zoom ToSelection
Lets you make a selectionand adjusts it to fit thedrawing window. (The textgets larger on the screen.)
Always available -(most useful whenthere is something inthe drawing window).
Zoom To Fit The entire diagram isdisplayed in the drawingwindow. (The text sizechanges with thegeometry.)
Always available -(most useful whenthere is something inthe drawing window).
Zoom To Page The whole page isdisplayed in the drawingwindow. (The text sizechanges with thegeometry.)
Always available -(most useful whenthere is something inthe drawing window).
Pan ViewAllows you to move thecontents of the drawingwindow without changingits position on the page.
Always available -either Pan View orMove Geometry willbe in effect (checked).
ScaleGeometry Up
Enlarges only thegeometry. (The text sizeon the screen doesn'tchange.)
Always
ScaleShrinks only thegeometry. (The text size
Always
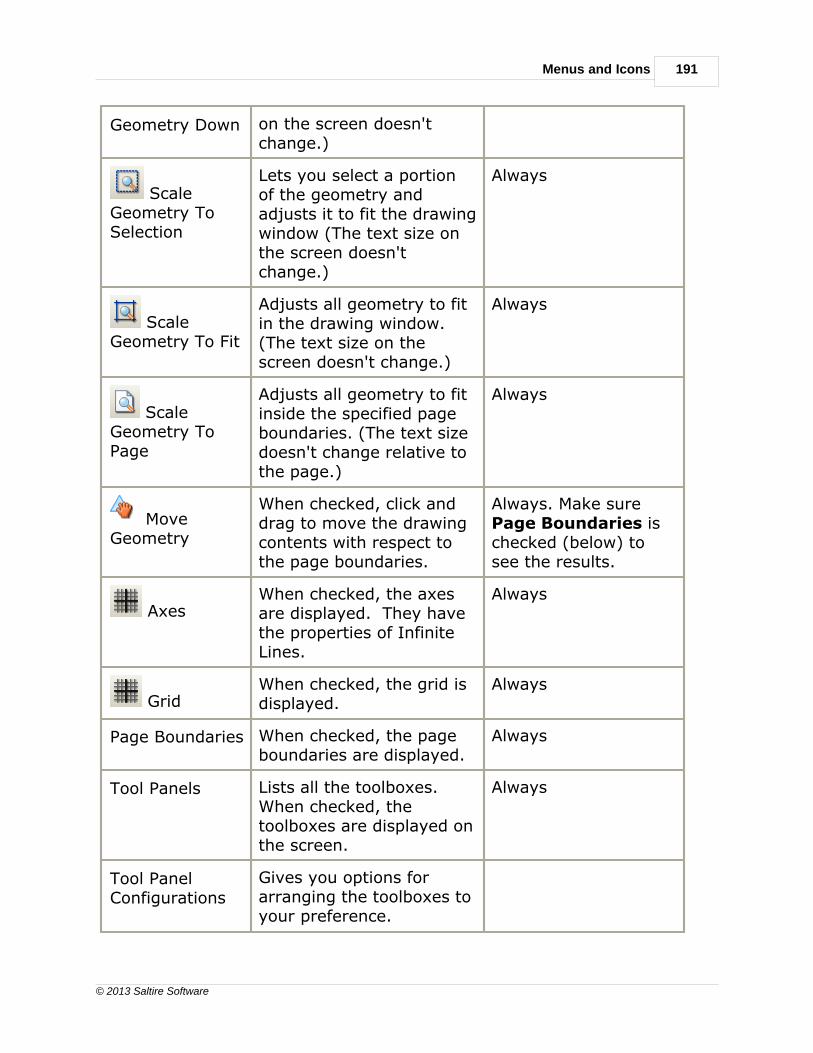
Menus and Icons 191
© 2013 Saltire Software
Geometry Down on the screen doesn'tchange.)
ScaleGeometry ToSelection
Lets you select a portionof the geometry andadjusts it to fit the drawingwindow (The text size onthe screen doesn'tchange.)
Always
ScaleGeometry To Fit
Adjusts all geometry to fitin the drawing window.(The text size on thescreen doesn't change.)
Always
ScaleGeometry ToPage
Adjusts all geometry to fitinside the specified pageboundaries. (The text sizedoesn't change relative tothe page.)
Always
MoveGeometry
When checked, click anddrag to move the drawingcontents with respect tothe page boundaries.
Always. Make sure Page Boundaries ischecked (below) tosee the results.
AxesWhen checked, the axesare displayed. They havethe properties of InfiniteLines.
Always
GridWhen checked, the grid isdisplayed.
Always
Page Boundaries When checked, the pageboundaries are displayed.
Always
Tool Panels Lists all the toolboxes. When checked, thetoolboxes are displayed onthe screen.
Always
Tool PanelConfigurations
Gives you options forarranging the toolboxes toyour preference.

192
© 2013 Saltire Software
Geometry Expressions Manual
Output When checked, the outputwindow is displayed.
Always
Language The current version of Geometry Expressions canbe displayed in English,French, German,Spanish, Polish, orRussian. Choose one andrestart the program.
Always
Checked menu options are toggles:
· Checked indicates the option / mode is active or displayed.
· Unchecked indicates the option / mode is inactive or hidden.
· Except Pan View and Move Geometry where one or the other ischecked.
Click the selection to change its state.
Some menu items have icon shortcuts found on the icon bar at the top ofthe screen.
Zooming and Scaling
The View menu has Zoom operations pertaining to the screen view, andScale operations pertaining to the page view.
· Zooming makes the drawing details smaller without affecting the sizeon the printed page. The text (constraints, output and annotation)changes size with the rest of the drawing.
· Scaling adjusts the size of the geometry relative to the page, but thetext doesn't change size in the drawing window. Check View / PageBoundaries to see this work.
The Scale functions used from the icon bar at the top of the screen can bechanged to Zoom functions by holding the ctrl key while clicking the icon.This is handy if you need to change the size of the text on the screen:
· A Scale down followed by a Zoom in [ctrl] has the effect
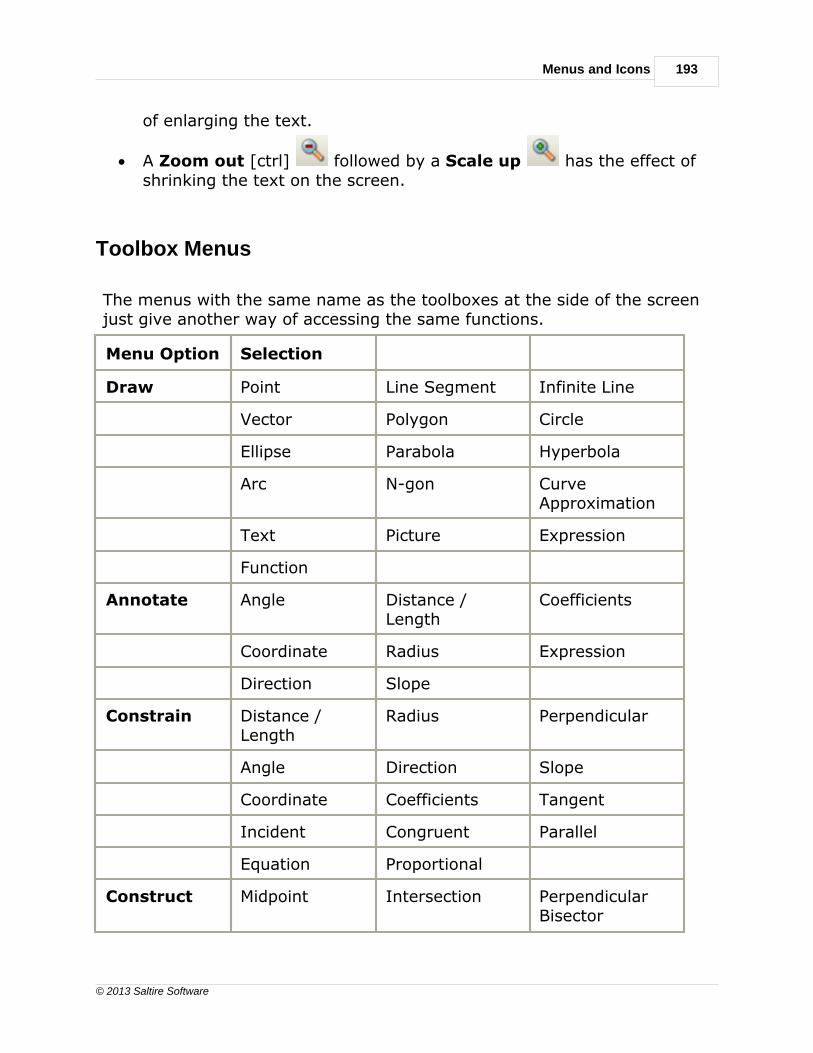
Menus and Icons 193
© 2013 Saltire Software
of enlarging the text.
· A Zoom out [ctrl] followed by a Scale up has the effect ofshrinking the text on the screen.
Toolbox Menus
The menus with the same name as the toolboxes at the side of the screenjust give another way of accessing the same functions.
Menu Option Selection
Draw Point Line Segment Infinite Line
Vector Polygon Circle
Ellipse Parabola Hyperbola
Arc N-gon CurveApproximation
Text Picture Expression
Function
Annotate Angle Distance /Length
Coefficients
Coordinate Radius Expression
Direction Slope
Constrain Distance /Length
Radius Perpendicular
Angle Direction Slope
Coordinate Coefficients Tangent
Incident Congruent Parallel
Equation Proportional
Construct Midpoint Intersection PerpendicularBisector
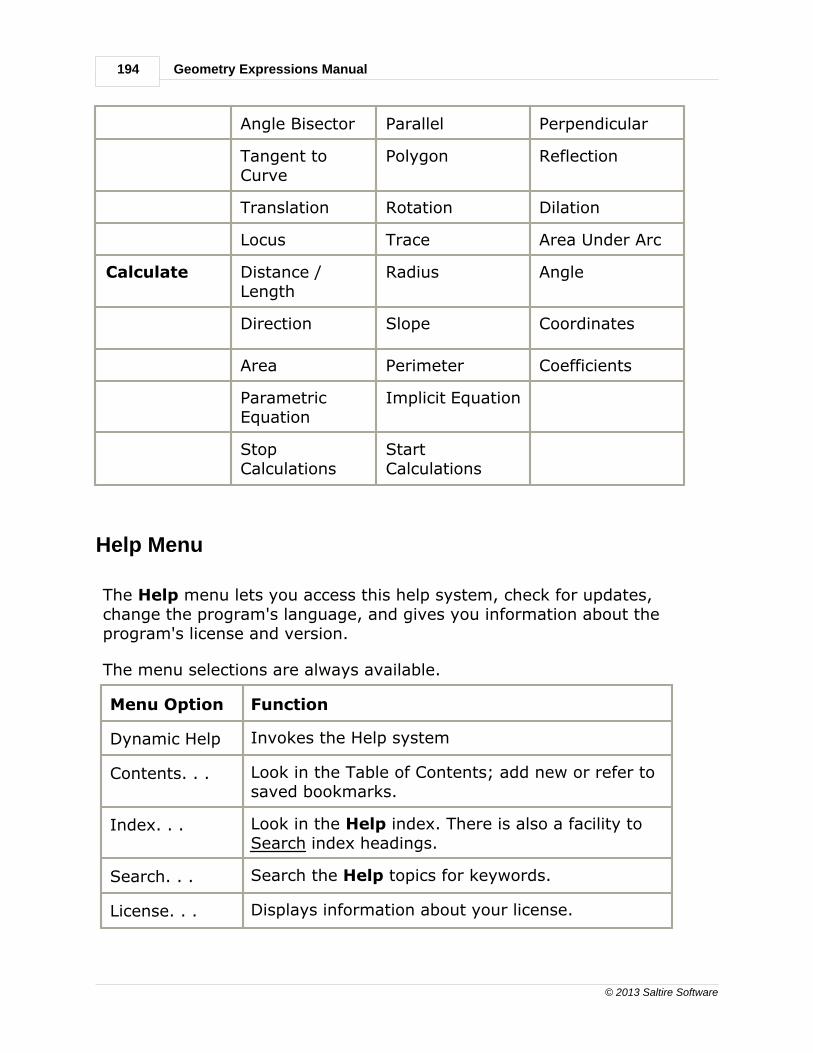
194
© 2013 Saltire Software
Geometry Expressions Manual
Angle Bisector Parallel Perpendicular
Tangent toCurve
Polygon Reflection
Translation Rotation Dilation
Locus Trace Area Under Arc
Calculate Distance /Length
Radius Angle
Direction Slope Coordinates
Area Perimeter Coefficients
ParametricEquation
Implicit Equation
StopCalculations
StartCalculations
Help Menu
The Help menu lets you access this help system, check for updates,change the program's language, and gives you information about theprogram's license and version.
The menu selections are always available.
Menu Option Function
Dynamic Help Invokes the Help system
Contents. . . Look in the Table of Contents; add new or refer tosaved bookmarks.
Index. . . Look in the Help index. There is also a facility toSearch index headings.
Search. . . Search the Help topics for keywords.
License. . . Displays information about your license.
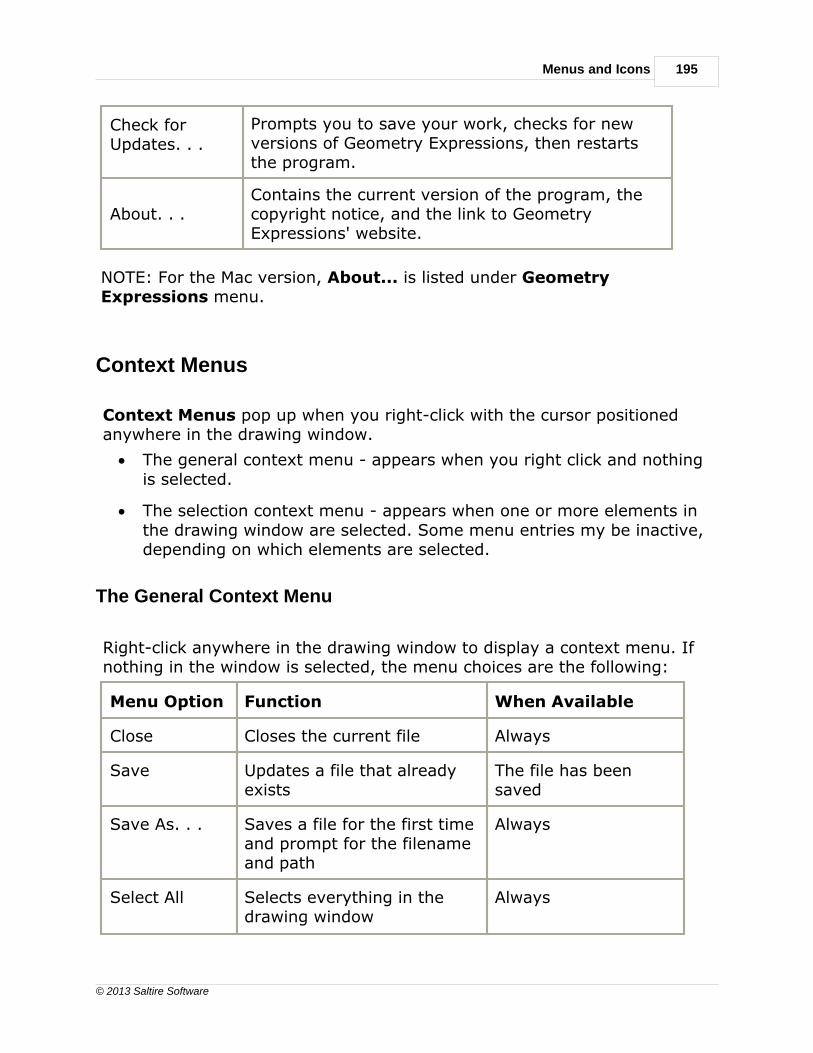
Menus and Icons 195
© 2013 Saltire Software
Check forUpdates. . .
Prompts you to save your work, checks for newversions of Geometry Expressions, then restartsthe program.
About. . .Contains the current version of the program, thecopyright notice, and the link to GeometryExpressions' website.
NOTE: For the Mac version, About... is listed under GeometryExpressions menu.
Context Menus
Context Menus pop up when you right-click with the cursor positionedanywhere in the drawing window.
· The general context menu - appears when you right click and nothingis selected.
· The selection context menu - appears when one or more elements inthe drawing window are selected. Some menu entries my be inactive,depending on which elements are selected.
The General Context Menu
Right-click anywhere in the drawing window to display a context menu. Ifnothing in the window is selected, the menu choices are the following:
Menu Option Function When Available
Close Closes the current file Always
Save Updates a file that alreadyexists
The file has beensaved
Save As. . . Saves a file for the first timeand prompt for the filenameand path
Always
Select All Selects everything in thedrawing window
Always
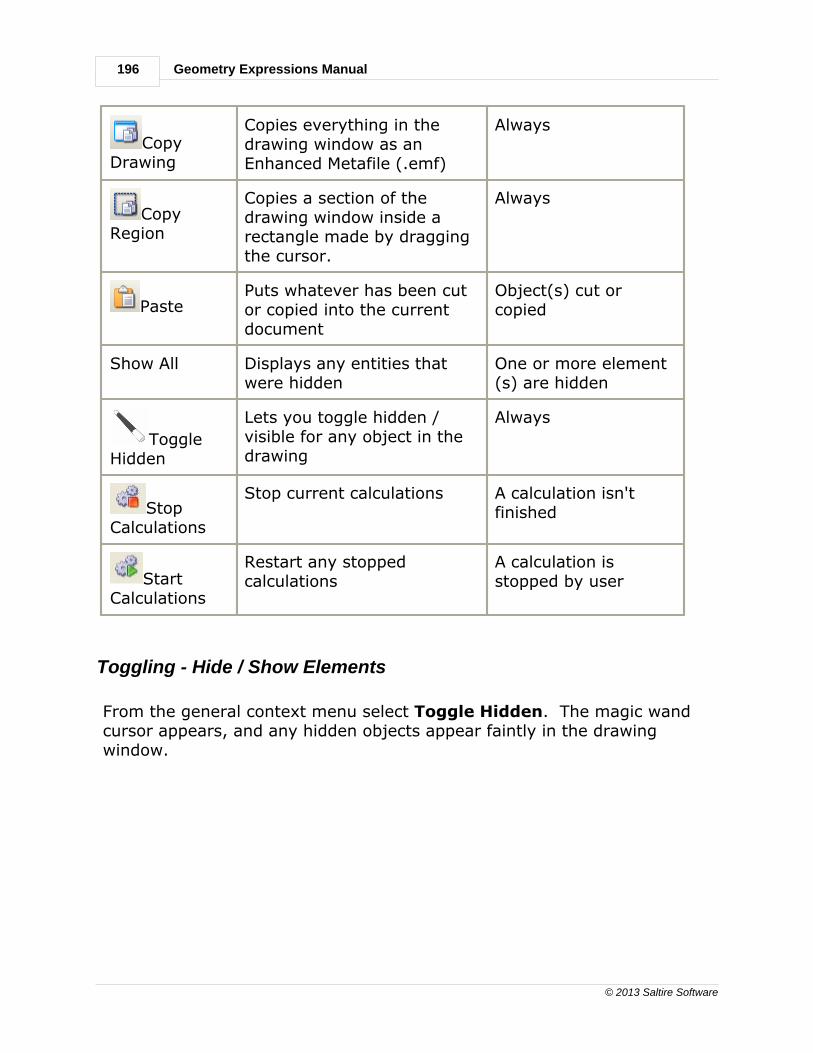
196
© 2013 Saltire Software
Geometry Expressions Manual
CopyDrawing
Copies everything in thedrawing window as anEnhanced Metafile (.emf)
Always
CopyRegion
Copies a section of thedrawing window inside arectangle made by draggingthe cursor.
Always
PastePuts whatever has been cutor copied into the currentdocument
Object(s) cut orcopied
Show All Displays any entities thatwere hidden
One or more element(s) are hidden
ToggleHidden
Lets you toggle hidden /visible for any object in thedrawing
Always
StopCalculations
Stop current calculations A calculation isn'tfinished
StartCalculations
Restart any stoppedcalculations
A calculation isstopped by user
Toggling - Hide / Show Elements
From the general context menu select Toggle Hidden. The magic wandcursor appears, and any hidden objects appear faintly in the drawingwindow.
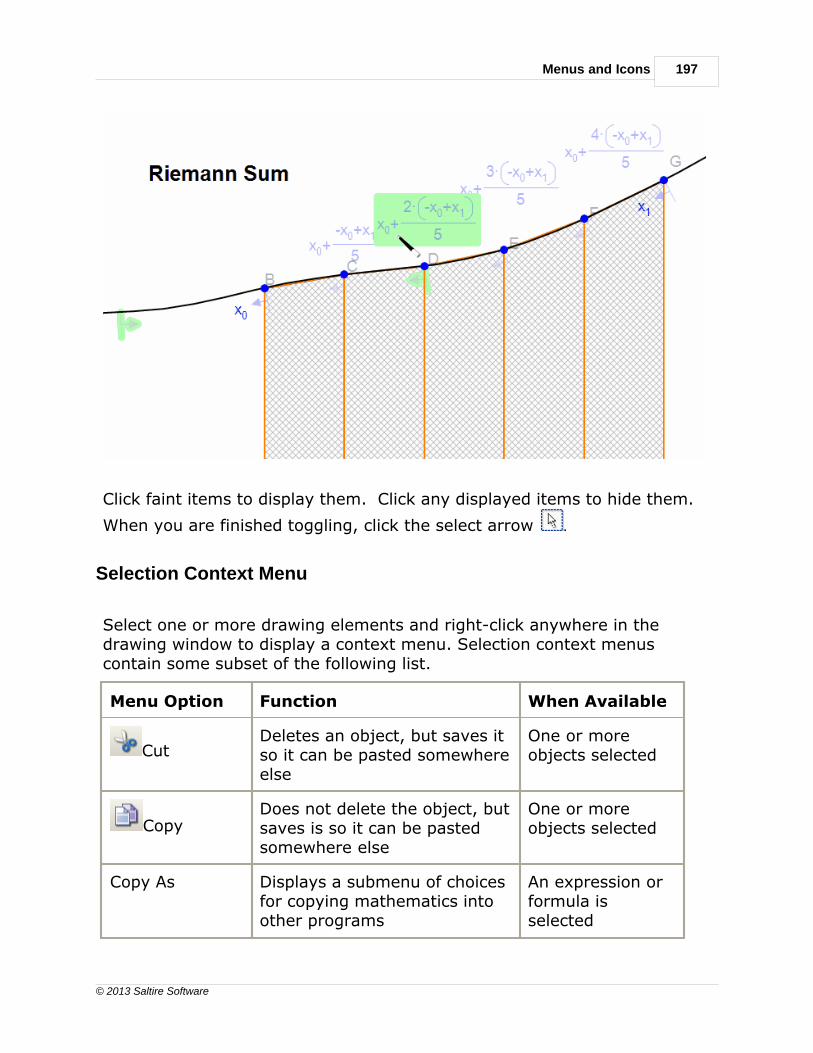
Menus and Icons 197
© 2013 Saltire Software
Click faint items to display them. Click any displayed items to hide them.
When you are finished toggling, click the select arrow .
Selection Context Menu
Select one or more drawing elements and right-click anywhere in thedrawing window to display a context menu. Selection context menuscontain some subset of the following list.
Menu Option Function When Available
CutDeletes an object, but saves itso it can be pasted somewhereelse
One or moreobjects selected
CopyDoes not delete the object, butsaves is so it can be pastedsomewhere else
One or moreobjects selected
Copy As Displays a submenu of choicesfor copying mathematics intoother programs
An expression orformula isselected

198
© 2013 Saltire Software
Geometry Expressions Manual
Send to Mathematica
Inputs the selected expressionto Mathematica when thealgebra system is running inanother window
An outputexpression orformula isselected
PastePuts whatever has been cut orcopied into the currentdocument
Object(s) cut orcopied
Delete Deletes whatever is selected,without saving it.
One or moreobjects selected
Hide Makes the selected objectsinvisible
One or moreobjects selected
EditParameters...
Lets you edit the domain of apolar or parametric function orthe parameters of a locus ortrace.
A function, locus,or trace isselected
Arrange For placing selected objects ontop of (bring forward) orunderneath (send backward)other objects for easierselection and viewing
One or moreobjects selected
Constrain(Input)
Displays a submenu identicalto the one in the same drop-down menu on the Menu Bar
Geometryselected
Construct Displays a submenu identicalto the one in the same drop-down menu on the Menu Bar
Geometryselected
Calculate(Output)
Displays a submenu identicalto the one in the same drop-down menu on the Menu Bar
Geometryselected
VisibilityCondition
Lets you enter an equationspecifying when the selectedobject(s) are visible.
One or moreobjects selected
Point Properties Lets you change the selectedpoint's color and size
One or morepoints selected
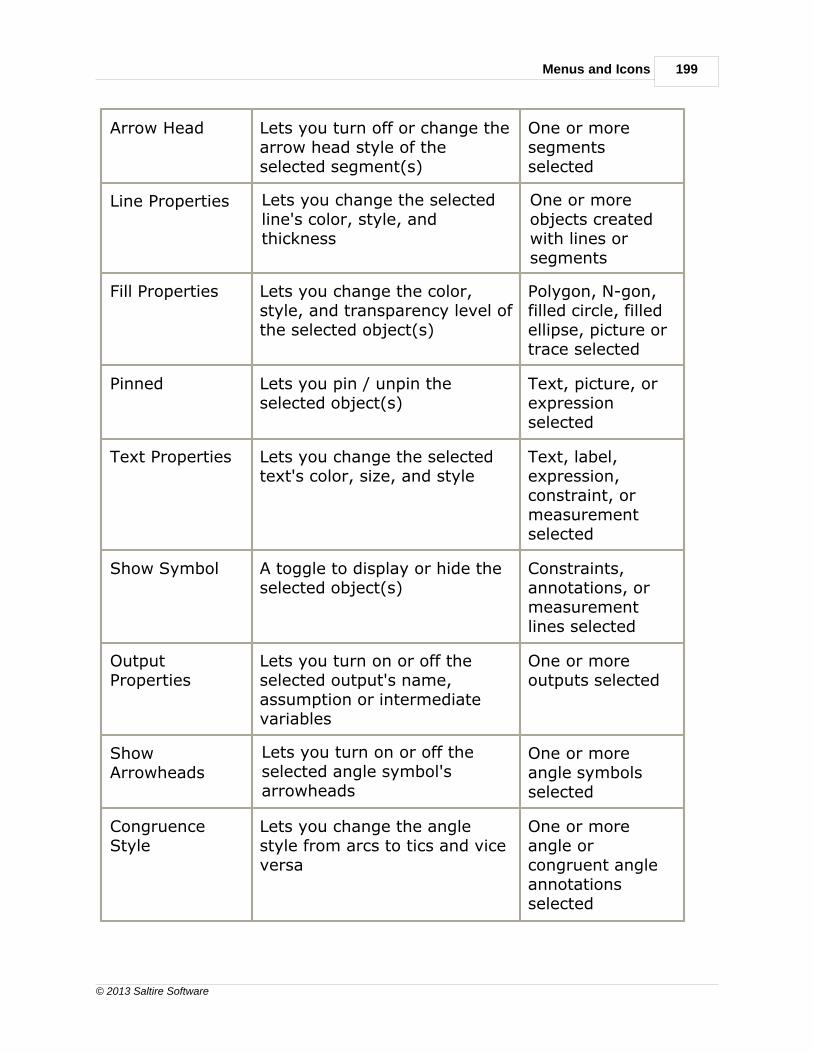
Menus and Icons 199
© 2013 Saltire Software
Arrow Head Lets you turn off or change thearrow head style of theselected segment(s)
One or moresegmentsselected
Line Properties Lets you change the selectedline's color, style, andthickness
One or moreobjects createdwith lines orsegments
Fill Properties Lets you change the color,style, and transparency level ofthe selected object(s)
Polygon, N-gon,filled circle, filledellipse, picture ortrace selected
Pinned Lets you pin / unpin theselected object(s)
Text, picture, orexpressionselected
Text Properties Lets you change the selectedtext's color, size, and style
Text, label, expression,constraint, ormeasurementselected
Show Symbol A toggle to display or hide theselected object(s)
Constraints,annotations, ormeasurementlines selected
OutputProperties
Lets you turn on or off theselected output's name,assumption or intermediatevariables
One or moreoutputs selected
ShowArrowheads
Lets you turn on or off theselected angle symbol'sarrowheads
One or more angle symbolsselected
CongruenceStyle
Lets you change the anglestyle from arcs to tics and viceversa
One or moreangle orcongruent angleannotationsselected

200
© 2013 Saltire Software
Geometry Expressions Manual
Tic / Arc Count Lets you change the number oftic/arc counts of selectedannotations
One or morecongruent,congruent angle,or parallel annotationsselected
Axes Properties Lets you turn the labels on theaxes on/off or change thenumber of subdivisions or unitsto display
One or both axesselected
All Properties. . . Lets you edit the displayproperties of the selectedobject(s)
One or severalsimilar objectsare selected
[Convert toCalculation(Output)]
Deletes the selected constraintand calculates the equivalentoutput
A constraint isselected
[Convert toConstraint(Input)]
Changes the calculation to aninput constraint
An outputexpression isselected
[Convert toReal]
Changes a symbolic output toa real output value
A symbolic outputexpression isselected
[Convert toSymbolic]
Changes a real output value toa symbolic output expression
A real outputvalue is selected
Axes Display Properties
The Axes Display can be set in the default settings, Edit / Preferencesunder the Grid, Axis, Page tab, or you can change them for an individualdrawing from the Selection Context menu.
To invoke the Selection Context menu:
1. Select one or both axes
2. Right click the mouse

Menus and Icons 201
© 2013 Saltire Software
The All Properties selection brings up all the Display Properties dialogfor the axes.
You can configure the X and Y axes in many ways. There are the usualattributes of lines and text.
Show Labels - is useful when the axis labels lie under some part of yourdiagram making it hard to read. You can turn these off on one or bothaxes with the attribute set to False.
Units - can be set to the usual decimal, but with trig functions you may
find the Degrees, Radians or Radians/3 units more appropriate. If youuse the Degrees or Radians units in trig functions, don't forget to set yourAngle Mode to Radians on the status bar.

202
© 2013 Saltire Software
Geometry Expressions Manual
Visibility Condition
You can set any mathematical condition for one or more object's visibility.Use this with the Animation tools for some great effects. Here are thesteps:
1. Select the object(s) that you want to change visibility.
2. Right-click and select Visibility Condition from the SelectionContext menu.
3.Enter the expression for a defined variable for which you would like
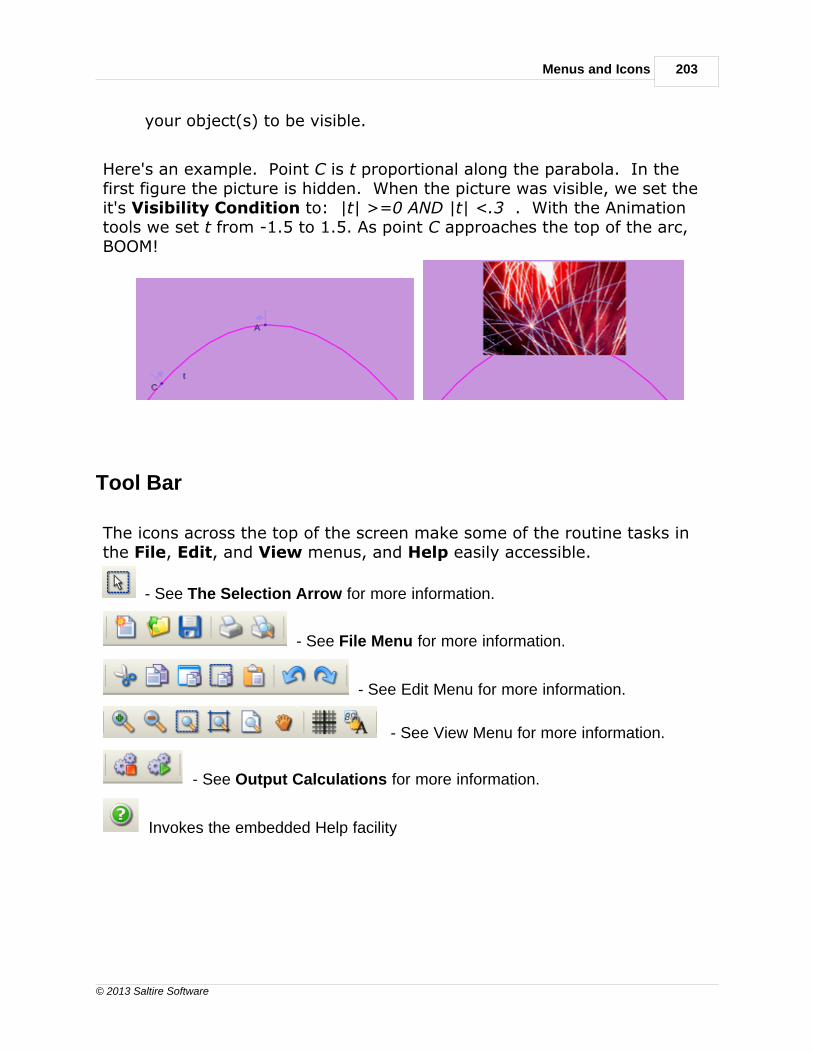
Menus and Icons 203
© 2013 Saltire Software
your object(s) to be visible.
Here's an example. Point C is t proportional along the parabola. In thefirst figure the picture is hidden. When the picture was visible, we set theit's Visibility Condition to: |t| >=0 AND |t| <.3 . With the Animationtools we set t from -1.5 to 1.5. As point C approaches the top of the arc,BOOM!
Tool Bar
The icons across the top of the screen make some of the routine tasks inthe File, Edit, and View menus, and Help easily accessible.
- See The Selection Arrow for more information.
- See File Menu for more information.
- See Edit Menu for more information.
- See View Menu for more information.
- See Output Calculations for more information.
Invokes the embedded Help facility

X More About Geometry Expressions

206
© 2013 Saltire Software
Geometry Expressions Manual
What's New in Geometry Expressions?
Our JavaScript Apps, Lua Apps and Dashboard Widget generationcapabilities were so popular, we added several new features.
There are new Input controls for variables -
· Advance Button lets you increment a variable
· Media Button gives you more controls to change the variable
· Random generates a random value within your specified range
· Time is handy for making clock apps and other animated apps
Outputs can now be attached to a Show / Hide Button. This featurecombined with the Random input type is very handy for making practiceApps where students can check their answers by clicking an answerbutton, then reload the page with a new problem.
A new feature in Geometry Expressions that caries over into anygenerated Applet is the Visibility Condition which lets you show anyobject under a mathematical condition.
Now you are not limited to only one of Constraints, Annotations, orCalculations on a single object. If you like, you can have all three! So,for example, you could have an angle annotation on the supplementaryangle of a constrained angle.
Other new features include:
· a new export file format, Scalable Vector Graphics (.svg)
· two new Built-In Functions - ceil() and floor(), a handy way toconvert a value to an integer.

More About Geometry Expressions 207
© 2013 Saltire Software
Where is the Geometry Expressions Website?
Information on upgrades, additional technical support and loads of greatexamples can be found on the Geometry Expressions website at: www.GeometryExpressions.com.
Can I See Some Examples?
Yes! We're on YouTube!
You can also sign up for a live Webinar. Send us a note and we'll get backto you with a date and time.


Index 209
© 2013 Saltire Software
Index
- . -.bmp 157
.emf 157
.gx 32
.gxw 32
.jpg 157
.png 157
.tiff 157
.xmp 157
- 3 -3-D drawing 114
- A -absolute value notation 139
ActionScript 183
adjusting
drawing 74
text size 192
angle
annotation 115
bisector 100
calculate 125
constraint 85
mode 15
supplement 125
animation 147
console 149
duration 149
export file 160
modes 149
parameter based 150
values 149
with Locus tool 150
annotation 111
angle 115
coefficients 117
congruent 118
congruent angle 119
coordinate 117
direction 116
distance 113
distinguish from constraints 77
expression 121
length 113
parallel 121
perpendicular 114
radius 113
slope 116
symbols 140
text 57
Applets 161, 169
Inputs 174
Multiline Text Box 168
Outputs 176
UI Types 174
Arcs 50
Area between curves 51
area calculation 128
area under the curve 110
assumptions 133
axes 43
display properties 200
scaling 177
units 200
- B -Background color 24
bisector
angle 100
perpendicular 99
built-in functions 136, 139
- C -C 183
C# 183
C++ 183
calculations 122
angle 125
area 128
coordinates 128
direction 127
distance / length 124
implicit equations 130

210
© 2013 Saltire Software
Geometry Expressions Manual
calculations 122
parametric equations 130
perimeter 129
radius 124
slope 127
vector coefficients 129
Calculus 110
check boxes 134
circles 46
coefficients
annotation 117
constraint 87
conflicts, constraint 81
congruence 89
angle annotation 119
annotation 118
constraints 75
angle 85
changing 77
conflicts 81
congruent line segments 89
coordinate 87
direction 86
distance 83
distinguish from annotations 77
equation 91
incident 88
length 83
parallel line segments 90
perpendicular 84
point proportional along curve 91
radius 84
slope 86
system added 78
tangents 88
vector coefficients 87
constructions 96
angle bisector 100
area under arc 110
dilation 104
intersection 98
locus of points 105
midpoints 98
parallel 100
perpendicular bisector 99
perpendicular lines 101
reflection 102
rotation 103
tangent 101
trace 107
translation 103
Context Menus 195
Visibility Condition 202
Convert to
Input / Output 197
Symbolic / Real 197
coordinates
annotation 117
calculation 128
constraint 87
copy and paste mathematics 36
Copy As
mathematics 181
MathML input 181
String input 181
curve approximations 56
Curvilinear polygon 51
- D -Dashboard Widgets 172
Defaults 28
text font 58
degrees 15
dilation 104
direction
annotation 116
calculate 127
constraint 86
Display 14
configuration 21
customizing 18
output properties 131
Settings 28
distance
annotation 113
calculation 124
constraint 83
Distinguish Constraints / Annotations 77
division editing tool 137
drawing
adjusting 74
arcs 50
circles 46
constraints 75

Index 211
© 2013 Saltire Software
drawing
curve approximations 56
ellipses 47
expressions 60
hyperbola 49
line segments 42
lines 43
parabolas 48
points 41
polygons 45
Preferences and Properties 40
regular polygons 55
text 57
tools 40
vectors 44
- E -Edit Menu 178
Copy As 181
Preferences 28
Settings 28
Ellipse 47
envelope 105
Equations
constraint 91
implicit 91
implicit: calculating 130
examples 38
exporting drawings 157
Animation files 160
HTML 159
Image files 159
JavaScript Applet animated example 166
JavaScript Applet example 164
JavaScript files 161
Lua applets 169
widgets 172
Expression
annotation 121
Draw tool 60
- F -Figure Gallery
controls 155
Import 153
File Handling 32
workbooks & individual files 33
File Menu 152
Export 157
Import from the Figure Gallery 153
import from the Geometry Atlas 155
functions 61
built-in 136, 139
cartesian 62
domain 65, 67
f(X) 64
handles 62, 65, 67
list 144
parametric 67
piecewise 69
polar 65
- G -Geometry Atlas 155
Graphing mode 177
Greek letters 137
- H -help
using the Help system 11
Help Menu 194
Hide, toggle 196
HTML export files 159
Hyperbola 49
- I -Icon Bar 203
image export 157
Image export files 159
Import files
from the Figure Gallery 153
from the Germetry Atlas 155
incidence 41, 88
Input constraints 75
integrals 110
intermediate veriables 133
intersections 98

212
© 2013 Saltire Software
Geometry Expressions Manual
- J -Java 183
JavaScript export files 161
animated example 166
example 164
using multi-line functions 166
JavaScript, Source code 183
- L -length
annotation 113
calculation 124
constraint 83
line
infinite 43
intersections 98
parallel construction 100
segments 42
linked text 11
locking variables 147
using the lock 145
locus of points 105
curves and animation 150
Lua Apps 169, 171
- M -MathML 36, 181
Menus
Annotate 111
Calculate (Output) 122
Constrain (Input) 75
Construct 96
Context 195, 197
Draw 40
Edit 178
File 152
Help 194
View 189
Metafile 157
midpoints 98
move the drawing 74
multiple drawings 32
- N -New features 206
N-gons 55
- O -Objective C 183
output
assumptions 133
calculations 122
check boxes 134
name 134
properties 131
window 189
- P -page tabs 32
arranging 22
Parabola 48
parallel 90
annotation 121
construction 100
parametric equations
output 130
Parametric Variable 105, 107
parentheses for math notation 139
perimeter calculation 129
perpendicular
annotation 114
bisector 99
constraint 84
construction 101
Pictures 58
Piecewise Functions 69
parametric example 70
points 41
constrained along a curve 91
polygons
construction 102
drawing 45
regular 55
Preferences 28
Properties

Index 213
© 2013 Saltire Software
Properties
Axes 200
- R -radians 15
radius
annotation 113
calculate 124
constraint 84
Reflection 102
reserved words 136
rotation 103
- S -Scale 74, 192
scaling the axes 177
screen layout 14
selecting
geometry 72
multiple objects 73
Settings 28
show output 134
slope
annotation 116
calculate 127
constraint 86
Smartboard Mode 74
source code 183
examples 184
square root editing tool 138
status bar 15
subscript / superscript 138
Supplemetary Angles 125
symbols 136
division 137
Greek letters 137
parentheses & absolute value 139
square root 138
subscript / superscript 138
- T -tangents 88, 101
text 57
Edit Text dialog 58
size 192
TI-Nspire
Script Editor 171
Toolbox Menus 193
toolboxes
arranging 19
configuration 21
floating / anchored 19
hiding / showing 20
Trace 107
translation 103
- V -variables 143
functions list 144
list 144
locking 147
value 147
VBA 183
vectors
calculate coefficients 129
constraints: coefficients 87
drawing 44
View Menu 189
Visibility Condition 202
Visual Basic 183
- W -Widgets 172
Workbook files 33
workspace 32
- Z -Zoom 74, 192