Embed Size (px)
Citation preview

INT. J. REMOTE SENSING, 1991, VOL. 12, NO. 1 1, 2321-2342
Geomorphology and reflectance patterns of vegetation-covered dunes at the Tsodilo Hills, north-west Botswana
P. A. JACOBBERGER and D. M. HOOPER Center for Earth and Planetary Studies, National Air and Space Museum. Smithsonian Institution, Washington, D.C. 20560, U.S.A.
(Received 2 August 1989; in Jinal form 6 April 1990)
Abstract. Seasonal reflectance variations in semi-arid environments provide a means of assessing vegetation health and density as well as monitoring landform processes. We have used multi-temporal Landsat Thematic Mapper scenes with field measurements to map geomorphology and vegetation density in a stabilized dune environment and to measure seasonal reflectance changes for a series of ten geomorphological and vegetation units on the Kalahari-age linear dunes near the Tsodilo Hills, northwestern Botswana. Dune morphology is degraded and dunes are stabilized by mopane woodland vegetation. Units were chosen based on differences in landform and proportion of trees, forbs and bare soil. Reflectance curves and Normalized Difference Vegetation Indices (NDVI) calculated for December 1986 and March, June and August 1987 show that dune crests have the strongest seasonal variability in colour and brightness. Interdune corridors show a few percentage variation and sandy plains units in general showed little seasonal variation. The geomorphological link with reflectance and NDVI values may be due to biomass production and zoning of vegetation with slope, drainage and subtle soil differences.
1. Introduction The Kalahari physiographic province covers more than 2.5 million km2 of central
southern Africa, including a large portion of western Botswana, Namibia and South Africa (Foster et al. 1982). Within northwestern Botswana, the Kalahari is dominated by vast tracts of old linear sand dunes, now degraded in form and stabilized by vegetation. These dunes, though now fixed in place, were once mobile and formed under presumably more arid conditions than exist today. Grove (1969) called attention to the geomorphological and paleoclimatological similarities between the Kalahari sandveldt and the Sahel farther north. Since the onset of the Sahelian droughts of the last three decades, vegetation density in the Sahel has declined, but the stabilized dunes of northwestern Botswana remain well-vegetated under Bots- wana's semi-arid climate.
Geomorphology plays an accepted role in controlling vegetation distribution and density and, in turn, geomorphology acts as a control on seasonal reflectance variations as well as aperiodic, drought-related environmental change. While the influence of geomorphology on vegetation and reflectance properties has been well studied in temperate environments, less information is available for arid environ- ments. In particular, the impact of geomorphologically-controlled zoning and the magnitude of seasonal change in vegetation on stabilized Sahelian dunes has been difficult to assess; previous studies in stabilized dune environments in the Sahel have suggested that reflectance patterns differ for dunes and interdune corridors, but these
0143-1161/91 $3.00 0 1991 Taylor & Francis Ltd

P. A. Jacobberger and D. M. Hooper
variations are at the limits of sensor resolution in the present-day Sahel because of low overall vegetation density and the ephemeral nature of rainfall and vegetation growth (Jacobberger 1989).
Better characterization of seasonal reflectance changes on stabilized dunes and the influence of these landforms on vegetation is important to the study of desert processes and land degradation processes, and for the interpretation of satellite image data used in monitoring efforts for desert and semi-arid regions. Assuming that dunes do exert control on vegetation and thus reflectance, then seasonal, landform-related factors should be most evident where vegetation is dense. In order to measure these variations more fully, it is necessary to look at stabilized dunes that are more densely vegetated than are those in the Sahel.
To determine the magnitude of colour changes in a well-vegetated semi-arid environment, we chose to study a series of stabilized linear dunes in the Kalahari using multi-temporal Landsat Thematic Mapper (TM) data. Our objectives were: (I) to describe the landforms in a vegetated dune environment in north-west Botswana, (2) to relate morphologic units to reflectance patterns observed in TM data, and (3) to measure and test seasonal reflectance changes of morphologic units through a full year. The current study is part of an effort to establish baseline reflectance information related to surface processes and surface change in stabilized and active dune environments, over a range of climatic conditions (Jacobberger 1989).
2. Regional physiography and climate Kalahari sediments cover portions of Zaire to South Africa, and from Namibia to
Zimbabwe. This broad expanse of continental sediments includes sands, gravels and other deposits of fluvial, aeolian and lacustrine origin, collectively designated the Kalahari Beds (Thomas 1988). The Kalahari Beds are of variable age and thickness (Hutchins et al. 1976). They form a geomorphologically diverse but low relief landscape across most of central southern Africa; elevation above mean sea level ranges from 850 to lOOOm, but the terrain contains dunes, fluvial systems and relict lacustrine features in close juxtaposition. The Kalahari Desert is broadly construed to be that portion of the Kalahari covered by unconsolidated sands, a region that includes much of western Botswana (Lancaster 1981, Thomas 1988).
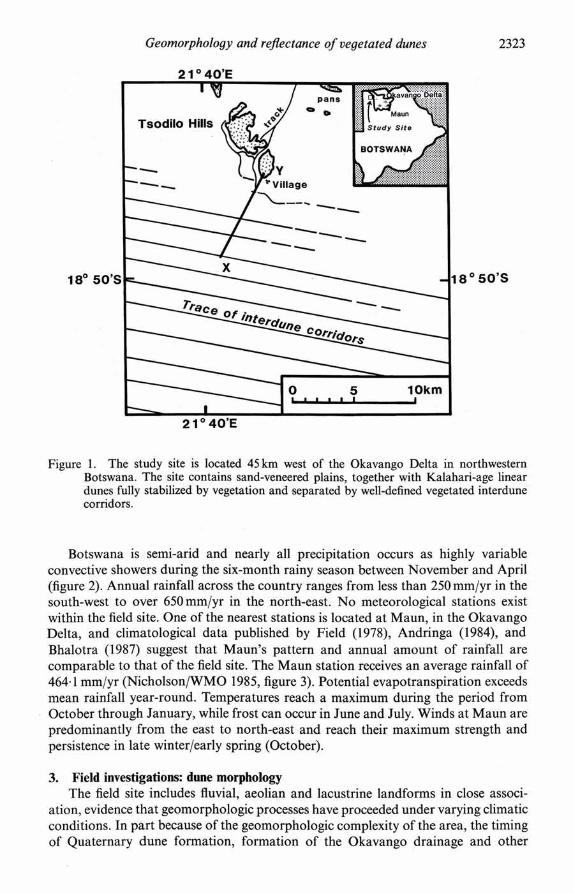
The field study site is a 27 km x 27 km area in the Ngamiland District, centred at approximately 18"501S latitude and 21°45'E longitude (figure 1). The 400m high Tsodilo Hills, composed of Late Proterozoic quartz schist, are the only basement outcrop in the field site (Neumann-Redlin 1981). Most of the field site is sand- covered, and vegetation on the dunes ranges from 20 to 100 per cent.
Using the nomenclature of White (1983), northwestern Botswana is located in the transition zone between undifferentiated woodland to acacia deciduous bushland and wooded grassland; Cooke (1980) called the vegetation of this region Mopane woodland, after the dominant woody species Colophospermum mopane (table 1 ) . This part of the semi-arid Kalahari savanna lacks perennial surface water and is a landscape of degraded dune fields, relict sand sheets, pans (ephemerally flooded depressions) and fossil river valleys. Inselbergs of crystalline rock such as the Tsodilo Hills are widely separated across northwestern Botswana. Approximately 45 km to the east of the Tsodilo Hills, the Okavango Delta forms the structurally-controlled inland termination of the Okavango River, which flows south-east into Botswana from the Angolan Highlands.
Geomorphology and reflectance of vegetated dunes
2 1 " 40'E
50's
21" 40'E
Figure 1. The study site is located 45 km west of the Okavango Delta in northwestern Botswana. The site contains sand-veneered plains, together with Kalahari-age linear dunes fully stabilized by vegetation and separated by well-defined vegetated interdune corridors.
Botswana is semi-arid and nearly all precipitation occurs as highly variable convective showers during the six-month rainy season between November and April (figure 2). Annual rainfall across the country ranges from less than 250 mmlyr in the south-west to over 650mmlyr in the north-east. No meteorological stations exist within the field site. One of the nearest stations is located at Maun, in the Okavango Delta, and climatological data published by Field (1978), Andringa (1984), and Bhalotra (1987) suggest that Maun's pattern and annual amount of rainfall are comparable to that of the field site. The Maun station receives an average rainfall of 464.1 mmlyr (Nicholson/WMO 1985, figure 3). Potential evapotranspiration exceeds mean rainfall year-round. Temperatures reach a maximum during the period from October through January, while frost can occur in June and July. Winds at Maun are predominantly from the east to north-east and reach their maximum strength and persistence in late winterlearly spring (October).
3. Field investigations: dune morphology The field site includes fluvial, aeolian and lacustrine landforms in close associ-
ation, evidence that geomorphologic processes have proceeded under varying climatic conditions. In part because of the geomorphologic complexity of the area, the timing of Quaternary dune formation, formation of the Okavango drainage and other

P. A. Jacobberger and D. M. Hooper
details of chronology and extent are as yet unresolved. Investigators agree that the Kalahari dune system formed during a period of hyper-aridity across southern Africa, which occurred between the Late Pliocene and Early Pleistocene (Grove 1969, Cooke 1980). Formation of the dunes predates the incision of the Okavango drainage system and delta, as evidenced by the truncation of dunes by river channels. The endoreic Okavango drainage system is thought to have formed in response to downwarping and movement along the southern terminus of the African Rift System; tectonic activity assisted in the inundation of the dunes and the region is still tectonically active (Baillieul 1975). Shaw (1985) noted a series of concentric shorelines around the Okavango Delta and Makgadikgadi Pans, suggesting that there have been episodes of increased precipitation and possibly increased inflow during the Late Quaternary.
The dunes south of Tsodilo are strikingly linear and parallel; although their morphology is heavily degraded, dune forms are visible on Landsat data, apparently due to differences in stabilizing vegetation between dune crests and interdune corridors (figure 4). The dunes trend roughly east-west (azimuth 102"), average 2 km in crest-to-crest wavelength, and attain a maximum height of 25 m. Individual dunes are several tens of kilometres long, so that they run uninterrupted east-west through the field site. Because of their subdued topography, the dunes do not cast shadows visible in satellite imagery, even at low sun angles. In the field, traverses were taken across dunes, and slopes of 2" to 4" were measured on the broad dune crests and flanks, with locally steeper slopes; for comparison, the angle of repose for quartz sand in active dunes is 34". Grove (1969) also mentioned these extremely low slopes, and
Table 1. Vegetation types.
Trees and shrubs Acacia sp. Adansonia digitata Bauhinia macrantha Burkea africana Colophospermum mopane Combretum collinum Commiphora sp. Croton sp. Grewia sp. Lonchocarpus sp. Ochna pulchra Peltophorum africanum Pterocarpus angolensis Ricinodendron rautanenii Terminalia sericea Ziziphus mucronata
Grasses Anthephora sp. Digitaria pentzii Eragrostis sp. Pancium sp. Pogonarthria squarrosa Schmidtia sp. Stipagrostis uniplumis
Sources: Smith (1976), Field (1978), and White (1983).
Geomorphology and reflectance of vegetated dunes
Figure 2. Rainfall peaks in the summer months (January-February) and is at its minimum in July and August. .The centre curve shows average monthly rainfall values. The upper and lower curves indicate the maximum and minimum recorded values for each month.
I Annual Rainfall for Maun, Botswana 1922 -1985
YEAR
Incomplete data I 3
1980 * .
Figure 3. Annual rainfall recorded for Maun (best estimate available for rainfall in the field site). Pre-1982 data are from Nicholson/World Meteorological Organization (WMO), 1985. Data for 1983-1985 are estimated from Bhalotra (1987).

P. A. Jacobberger and D. M. Hooper
Figure 4. Colour composite of the field site using TM bands 1, 3 and 4 coded as blue, green and red. Dunes show as broad linear features separated by narrow dark corridors. The Tsodilo Hills appear in the upper centre. Scale =900 x 900 pixels, or 27 x 27 km.
suggested that current dune form and spacing meant that the dunes were as much as 90 m in height while active. Figure 5 was taken on a dune crest typical of the field site in August 1987. Figure 6 shows one traverse profile across the dunes.
Interdune corridors are typically narrow, flat, and grass-covered with a few percentage of trees and scrub (figure 7). The corridors are sand-filled, which explains the lack of lag surfaces. Interdune corridor width varies from 0.4 km to 1.0 km. Dense tree thickets occur locally within some corridors.
The trend of the dunes in the northern half of the field site adjacent to the Tsodilo Hills differs from those farther south, due to the effect of the Tsodilo Hills on wind direction and sand transport during dune formation. Thematic Mapper data and field mapping show that sand has been deposited against the eastern slopes of the hills. Dunes are lacking on the western side, and a sand-free area stretches to the west for several kilometers. A sand ridge (possibly a transverse dune) extends southward from the base of the southern-most peak. Grove (1969) has proposed that the plain created in the Tsodilo wind shadow was at one time occupied by a shallow ephemeral lake fed by runoff and seepage from the hills. The present and past wind regimes appear to be similar, since east to north-east winds still dominate in all seasons at Maun.
Relict stream channels and gullies provide evidence for fluvial erosion of the dune system. In the north-east corner of the study site the linearity of the dune field is obscured, small fluvial channels are visible, and the dunes have a mottled appearance in satellite images. A few ephemeral or abandoned stream channels cut diagonally across dune fields and others follow interdune corridors. In the field, these fluvial features are not obvious. Since no surface water was observed in these channels in any of our TM images, and because of their subdued field morphology, it is likely that

Geomorphology and reflectance of vegetated dunes
these are abandoned streams rather than active ephemerals. No active fluvial channels were identified in interdune corridors within the study site, but a few small pans were found.
4. Thematic mapper analyses Four digital Landsat TM quarter scenes of the field site were acquired to examine
seasonality, in December of 1986 and in March, June and August of 1987. The August 1987 scene was acquired while fieldwork was in progress. TM data were chosen for this study since the spatial resolution is high enough for geomorphological mapping and since TM spectral resolution is sufficient to resolve seasonal differences in colour and brightness.
Preliminary enhancement and analysis of satellite data provided a set of images for field use, from which major topographic units and vegetation could be deter- mined. These images were used to establish traverse lines, and to locate field stations with homogeneous, representative vegetation for subsequent statistical analysis. Fieldwork was conducted during July and August 1987. Reconnaissance mapping and traverses were made through the dunes south of the Tsodilo Hills. In the field, we measured both dune shape and basic differences in vegetation composition and cover.
Field stations were plotted on image data using a combination of pace and compass traversing and triangulation, together with point locations obtained from a Magnavox MX-4102 satellite navigation station. Compass bearings for triangulation were sighted on the Tsodilo Hills. Vegetation density was estimated visually along traverses, based on the percentage of three components: (1) Trees, shrubs, and other woody vegetation; (2) grasses and forbs; and (3) bare soil or sand, for areas at least
Figure 5. Dune crest vegetation in August 1987. Dune crests are typically well vegetated and broad, as seen in the foreground. The adjacent interdune corridor and another dune crest are also visible.

P. A. Jacobberger and D. M. Hooper
Kilometers
Figure 6 . Sample field-measured topographic traverse across three linear dunes south of the Tsodilo Hills. This traverse was taken along the line shown in figure 1 (vertical exaggeration = 20 x ). Actual slopes on dune flanks are less than four degrees.
one TM pixel across (30 x 30 m), and larger where possible. These percentage cover estimates were constrained by access and the need to cover a large field area in a short time, and thus the traverse results were not detailed as to species. They were intended solely as a means of rapidly categorizing the relative distribution of soils and plant material in areas already known to have vegetation differences based on satellite data.
Figure 7. The interdune corridor shown here is dominated by grasses and forbs, with scattered woody plants and bare soil visible (foreground). The low rise of an adjacent, tree-covered dune appears in the background.

Geornorphology and repectance of vegetated dunes
Field stations were also categorized using basic geomorphological criteria (sand- covered plain, dune crest, or interdune corridor). Also considered were areal extent and confidence in locating the field station on image data. Based on field data together with initial TM image interpretation, ten geomorphologic/vegetation units were chosen. Of the ten units established, three are plains, three represent dune crests and four describe interdune corridors (table 2). Figure 8 shows the relative proportion of woody to herbaceous vegetation and soil for each unit.
Geometrically-corrected 900 x 900 pixel subscenes of the field site were extracted and coregistered from the four TM quarter scenes. RMS errors on the coregistrations show registration accuracies to be within three pixels, or 90m over the 27 x 27 km scene.
Since field work was underway at the time of acquisition of the August 1987 TM scene, this image was used as the 'base map' for analysis of the sequence of four seasonal images. Field stations were plotted on the August TM image, each defining a homogeneous area averaging 300 x 300 m or 10 x 10 pixels, and each was assigned to one of the ten geomorphologic/vegetation units described in the previous section. A supervised maximum likelihood classifier was used to bin all pixels in the August scene into one of the ten units (excluding shadows and steep terrain on the Tsodilo Hills; these were handled separately). The resulting classified image was used as an overlay to extract reflectance curves and vegetation indices from all four TM images (December 1986, and March, June and August 1987).
4.1. Reflectance calculations Reflectance curves were compiled for each field unit for each scene, yielding
measures of seasonal variability in colour and brightness as a function of landform and vegetation. Seasonal variations are here expressed as a percentage of reflectance in order to standardize the data against solar elevation angle and Earth-Sun distance, using Markham and Barker's (1986) equations:
where Qcal = calibrated and quantized scaled radiance in DNs, L,,, =spectral radiance at Q,,, = 0, Lmax, = spectral radiance at Qcal = Qcalmax, Q,,,,,, = range of re-scaled radiance in DNs, L, = spectral radiance, and
Table 2. Description of geomorphologic and vegetation units.
Percentage of Unit Description field area
Unvegetated plains Plains with open canopy Plains with grass and open canopy Dune crests with dense tree cover Dune crests with trees and grass Dune crests with partial tree cover Sparsely vegetated interdune corridors Grass-covered interdune corridors Tree- and grass-covered corridors Tree and shrub thickets in corridors

P. A. Jacobberger and D. M. Hooper
Trees & Scrub Percent
Grass
Figure 8. Ternary diagram showing relationships among the ten geomorphologic/vegetation units defined in the field. Units range from predominantly bare soil or sand (see unit 1) to nearly 100 per cent vegetated (see units 4 and 8). Geomorphologically, units 1-3 are plains, units 4-6 are dune crests, and units 7-10 are interdune corridors.
where p,= unit-less effective at-satellite reflectance, LA= spectral radiance at sensor aperture (mW cm- ster- ' pm- I), d= Earth-Sun distance in AU, ESun, = mean solar exoatmospheric irradiance (mW cm-2 pm- '), and 0, = solar zenith angle in degrees.
Table 3 presents the seasonal reflectance values for each of the ten field units and figure 9 shows representative reflectance curves for units 1, 5, 7 and 8. The curves form several groups, visually separable by overall brightness and the emergence of negative slopes between TM4 and TM5 in the wet season scenes (December and March) for some units. Units dominated geomorphologically by sand plains tended to have lower vegetation densities than either dune crests or interdune corridors and these are the units that lack a strong TM4 response. Field observations of the low vegetation density in these areas are consistent with their flat, soil-like spectral responses and lack of seasonal change. One of these units is undoubtedly also the brightest overall (unit 1, unvegetated plains); its signature is essentially that of bare Kalahari sand (figure 10). Unit 7 (sparsely vegetated interdune corridors) also has high overall reflectance, but does exhibit the wet season TM4 response indicating the presence of vegetation (60 per cent by field observations). The response characteristics of the interdune corridors are the most complex, showing wide variability in the magnitude of TM4 response as well as in visible wavelengths. In contrast, dune crest

Table 3. Mean TM-based reflectances and standard deviations for geomorphologic/vegetation units.
Unit 1 Colour code: white Description: unvegetated plains
24 December 1986 TM band 1 2 3 4 5 Mean reflect. (%) 16.27 16.17 18.13 32.95 35.24 Std. dev. (%) 0.80 0.71 1.31 1.79 1.48
TM band Mean reflect. (%) Std. dev. (%)
TM band Mean reflect. (%) Std. dev. (%)
30 March 1987 1 2 3 4 5
14.10 13.49 14.62 28.71 30.26 1.10 1.03 2.22 1.62 3.03
2 June 1987 1 2 3 4 5 7
15.25 14.47 17.67 27.49 33.66 28.42 0.97 0.77 1.66 1.62 2.43 3.46
Unit 2 Colour code: light blue
9 0
Description: plains with open canopy
24 December 1986 3- 0
7 1 2 3 4 5 7 F 30.85 15.09 14-12 15.26 27.97 31.10 26.35 2.07 0.64 0.70 1.36 1.88 1-69 2.64
30 March 1987 7 1 2 3 4 5 7
24.60 13-49 12.38 13.13 25.59 28-16 22.66 2
3.78 0.73 0.73 1.66 1-54 2.21 3.01
5 August 1987 TM band 1 . 2 3 4 5 7 Mean reflect. (%) 16.52 16.08 20.02 28.90 37-44 32.64 Std. dev. (%) 1.10 0.82 1.60 1.79 2.68 4.16
2 June 1987 1 2 3 4 5 7
14.41 12.98 15.55 24.48 30.88 25.54 0.32 0.40 1.30 1.50 1-41 2.28
5 August 1987 1 2 3 4 5 7
15.63 14.65 17.88 26-03 34.84 29.80 0.50 0.56 1.53 1.75 1.43 2.35
(continued)

Table 3 (continued).
TM band Mean reflect. (%) Std. dev. (%)
TM band Mean reflect. (%) Std. dev. (%)
TM band Mean reflect. (%) Std. dev. (%)
-
Unit 3 Unit 4 Colour code: dark blue Colour code: brown Description: plains with grass and open canopy Description: dune crests with dense tree cover
3 24 December 1986 24 December 1986
TM band 1 2 3 4 5 7 1 2 3 4 5 7 a Mean reflect. (%) 13.51 11.92 12.60 23.43 27.86 22.62 12.98 11.83 12-49 27-64 26.31 20-23 2 Std. dev. (%) 0.38 0.29 1.13 0.64 2.17 2.35 0.38 0.39 1.19 0.96 1-28 1.94 $.
a- n 30 March 1987 30 March 1987 4
1 2 3 4 5 7 1 2 3 4 5 7 3 12.31 10-73 10.96 22-04 25.36 20.00 11.93 10.72 11.22 24.93 24.72 18.29 3 0.60 0.56 1.39 1.65 2.70 2.84 0.50 0.47 1.31 1.16 1.81 2.14 &
pl 2 June 1987 2 June 1987
1 2 3 4 5 7 1 2 3 4 5 7 g 13.32 11.28 13.05 20.68 27.44 22.71 13.07 11.43 14.26 23.70 28.94 22-05 3 0.41 0.35 1.35 1-77 3.01 2.84 0.21 0.14 1.03 1.42 1.69 1.61
B 5 August 1987 5 August 1987
1 2 3 4 5 7 1 2 3 4 5 7 14.30 12.68 14.93 21.85 31-19 26.92 14.17 13.08 16.38 24.82 32.66 26-06 0.54 0.58 1.56 1.90 3.17 3.18 0.39 0.31 1.20 1.50 1-62 1.62

Table 3 (continued).
Unit 5 Unit 6 Colour code: light green Colour code: dark green Description: dune crests with trees and grass Description: dune crests with partial tree cover
24 December 1986 24 December 1986 TM band 1 2 3 4 5 7 1 2 3 4 5 Mean reflect. (%) 14.26 13.97 15.08 33.25 28.79 23.07 12.52 11.26 11.44 28.53 25.34 Std. dev. (%) 1.35 0.93 1.82 2.46 2.85 2.69 0.46 0.00 0.70 1.65 1.73
TM band Mean reflect. (%) Std. dev. (%)
TM band Mean reflect. (%) Std. dev. (%)
TM band Mean reflect. (%) Std. dev. (%)
30 March 1987 2 3 4 5 7
11.84 12.78 26.52 26.78 20.62 0.50 1.67 2.23 3.03 2.85
2 June 1987 2 3 4 5 7
12.56 15.69 25.12 30.91 24.40 0.14 1.13 1.62 2.22 2.04
30 March 1987 1 2 3 4 5
11.53 10.27 10.49 24.50 24.14 0.08 0.00 0.72 1.49 1.98
2 June 1987 1 2 3 4 5
12.80 11.09 13.77 23.12 28.88 0.00 0.00 0.65 0.82 1.92
5 August 1987 5 August 1987 1 2 3 4 5 7 1 2 3 4 5
14.86 14.29 18.04 26.81 34.87 28.46 13.97 12.79 15.90 24.42 32.78 0.88 0.23 1.77 2.39 3.09 2.43 0.00 0.00 0.80 1.25 2.58

Table 3 (continued).
Unit 7 Unit 8 Colour code: red Colour code: gold Description: sparsely vegetated interdune corridors Description: grass-covered interdune corridors
TM band Mean reflect. (%) Std. dev. (%)
TM band Mean reflect. (%) Std. dev. (%)
TM band Mean reflect. (%) Std. dev. (%)
TM band Mean reflect. (%) Std. dev. (%)
24 December 1986 3 4
20.42 36.31 1.65 2.62
30 March 1987 3 4
15.91 30.06 1.69 1.82
2 June 1987 3 4
18.54 29.02 1.28 1-70
5 August 1987 3 4
20.81 30.46 1.24 1.68
24 December 1986 3 4
16.40 27.81 0.97 1.20
30 March 1987 3 4
12.98 26.18 1.22 1-03
2 June 1987 3 4
16.58 25.49 0.85 0.86
5 August 1987 3 4
18.74 26.82 1.13 1.20
Table 3 (continued).
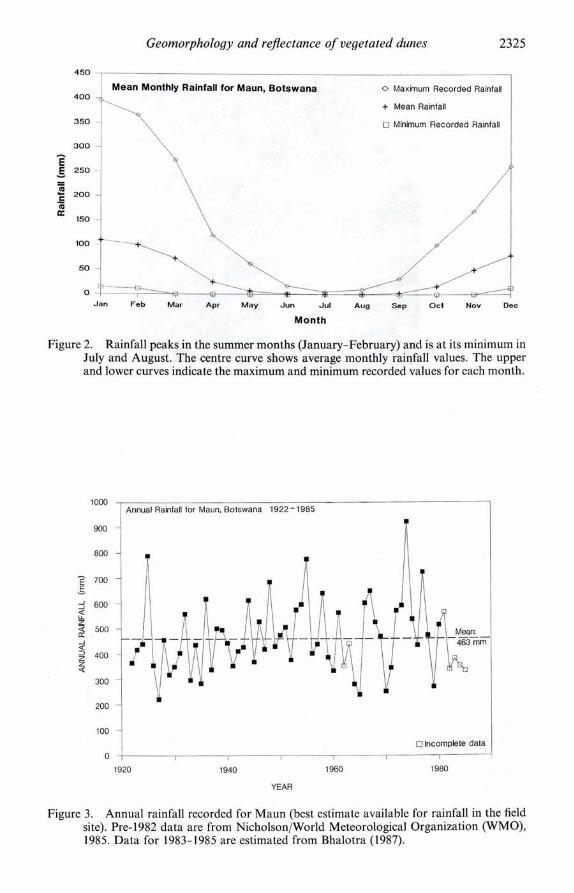
Unit 9 Colour code: yellow Description: tree and grass-covered interdune corridors
24 December 1986 TM band 1 2 3 4 5 7 Mean reflect. (%) 16.52 15.72 16.61 33.33 29.81 24.85 Std, dev. (%) 1.24 1-60 2-40 2.40 2.03 2.68
TM band Mean reflect. (%) Std. dev. (%)
TM band Mean reflect. (%) Std. dev. (%)
30 March 1987 1 2 3 4 5 7
13.98 12.96 13.59 28.27 27.10 20.87 0.94 1.04 1.92 1.64 2.02 2.50
2 June 1987 1 2 3 4 5 7
14.95 13.68 16.78 27.70 31.68 24.61 0.62 0.67 1.32 1.26 0.70 1-47
5 August 1987 TM band 1 2 3 4 5 7 Mean reflect. (%) 16.31 15.44 19.06 28.86 35-73 28.81 Std. dev. (%) 0.71 0.70 1.46 1-48 0.68 1-60
Unit 10 Colour code: grey 6 Description: tree and shrub thickets in interdune corridors $
0
24 December 1986 2- 0
1 2 3 4 5 7 3 14.66 13.68 14.21 30.64 27.74 21.58 ? 0.99 0-78 1.64 2.25 1.85 2-15 L
30 March 1987 1 2 3 4 5 7 $2 0
12.95 11.80 12.17 26.27 25.73 19.19 0-64 0.57 1.50 1.71 2.08 2.19 $
(D
2 June 1987 < 1 2 3 4 5 7
C
13.98 12.50 15.15 25.21 29.92 22.86 $ - 0.24 0.33 1.32 1-54 1.80 1.50 &
5 August 1987 1
B 2 3 4 5 7 3
15.36 14.31 17.62 26.62 34.25 27.32 2 0.55 0-36 1-38 1.79 2.18 1-55

P. A. Jacobberger and D. M. Hooper
units all have strong seasonal peaks in TM4 and all curves are similar despite up to 30 per cent differences in the proportion of woody to herbaceous vegetation among units.
For most units, visible wavelengths vary seasonally less than 3 per cent for TM1 to 6 per cent in TM3. Standard deviations for TM1, TM2 and TM3 reflectances are less than 1 per cent, so that visible wavelength variations are statistically significant though small. In the infrared, grass-dominated units have less seasonal variation relative to units dominated by woody vegetation; tree-dominated units uniformly exhibit a strong wet season TM4 response. The dense tree groves of unit 6 have the lowest reflectances overall of any of the ten units.
4.2. Normalized difference vegetation index (ND VZ) calculations Since infrared responses associated with vegetation seem to account for most of
the variance in these data, it is appropriate to look at these wavelengths in more detail. Vegetation indices provide a way to reduce the dimensionality in multi-spectral datasets while preserving information related to seasonal vegetation growth and senescence. Most indices utilize the spectral slope between infrared and visible channels as a measure of vegetation biomass (Colwell 1974). The Normalized Difference Vegetation Index (NDVI) quantified by Tucker (1979) is one widely known index, because of its use in measuring biomass from NOAAIAVHRR satellite
UNlT 1 UIWMUd *I",
0 ,
UNlT 5 Dun. cm,. nth b.. snd C-
UNlT 7 sp .,,.I" Y.Q .,.,. d ,",.dun. C.rrid0"
0 .
UNlT 8 ,O , 0 . . - a , 0 ,
Figure 9. (a)-(d). Seasonal reflectance variations for units 1, 5, 7 and 8. Standard deviations are less than symbol size (numeric values are included in table 3).

Geomorphology and reflectance of vegetated dunes
Tsodilo Dune S a n d Ref lec tance (Relative to BaS04)
0.6
Wavelength (pm)
Figure 10. Laboratory reflectance curve (relative to BaS04) for Kalahari dune crest sand within the field site. The sand is dark compared with other dune sands due to the inclusion of organic material, but is otherwise spectrally featureless at this resolution.
data on a global basis (Tucker et al. 1985). For use with TM data, the NDVI can be expressed as
NDVI = (TM4 -TM3)/(TM4 + TM3)
NDVIs were calculated from each T M scene for each unit (table 4). Dune crests exhibit the highest seasonal NDVI ranges and peak in the December
scene. Interdune corridors generally follow in range, with the exception of unit 7, the
Table 4. Normalized Difference Vegetation Indices.
Unit 24 December 1986 30 March 1987 6 June 1987 5 August 1987

P. A . Jacobberger and D. M. Hooper
sparsely vegetated corridor unit. This unit also has the lowest overall NDVI for March, the time at which other interdune corridor units show peak NDVI. The three plains units show little seasonal NDVI variation, in keeping with the lack of variation in infrared reflectance discussed in the previous section.
Figure 11 shows the relation between NDVI and the percentage of trees, grass and soil, respectively. It appears from these plots and the accompanying statistics that the highest correlation of NDVI is with tree cover and figure 8 suggests that dune crests are dominated by trees, interdune corridors by grasses and plains units by soil. However, the timing of fieldwork in the dry season when most forbs were dormant may be partially responsible for the correlation. Trees are countable even when dry, but the proportion of grasses to bare soil will vary with season. This could be represented graphically in figure 8 as a migration of units parallel to the grass-soil line but invariant with respect to percentage tree cover.
If the timing of fieldwork were the source of the sensitivity to tree cover, one would expect to see higher correlations among NDVI and percentage trees, grass and soil in the August data than are present in other scenes. Examination of table 4 suggests that this is the case, at least in part. Prince and Astle (1986) considered the effect of trees on vegetation measures (in their study, MSS band 715 ratios) and found
Seasonal NDVI vs. % Grass 0 28
0 2" I
Seasonal NDVI vs. % Trees 0 26
0 24 1
Seasonal NDVI vs. % Soil
Figure 11. (a)-(c). Seasonal NDVI versus percentage grass, trees and soil cover for each unit. Strong correlations between NDVI and percentage grass, trees or soil are not apparent. (Note that NDVIs are calculated from single TM scenes and do not represent integrated seasonal values.)

Geomorphology and reflectance of vegetated dunes
that tree cover did not obscure their results for vegetation biomass in eastern Botswana; they suggest that tree canopy may actually increase the magnitude of changes observed for underlying herbaceous vegetation. Prince and Tucker (1986) also considered the effects of tree canopy, and concluded that substantial tree cover can play a role in raising NDVI values.
Comparisons of NDVI with NDVI range (figure 12) also support the existence of a relation between NDVI and underlying geomorphological unit. In figure 12 data are plotted using measures of vegetation density and composition (total biomass) versus total seasonal variability in biomass, but clusters can be isolated that are consistent with respect to landform. The highest NDVIs and total range of NDVI? occur on dune crests, while the lowest NDVIs and total NDVI range are associated with plains; interdune corridors are intermediate. These clusters are apparent despite broad variations in total cover and composition within geomorphological groups and are probably related to biomass production and vegetation zoning by landform through differences in slope, drainage, microclimate and perhaps trace soil constituents. Addition of geomorphological information to studies involving NDVI calculations should improve the results.
Unit 8, grass-covered interdune corridors, is of particular note for both its seasonal reflectance patterns and NDVI values. Compared with data for other units, this unit's values most closely resemble those of the sparsely-vegetated plains (units 1, 2 and 3). Prior to fieldwork, this unit was deemed to be sparsely vegetated and,
MARCH NDVI vs. NDVI RANGE
NDVI Range
Figure 12. March NDVI versus total NDVI range, with grouping of units by geomorphologic characteristics. Units 1-3 are sandy plains, units 4-6 are dune crests, and units 7-10 are interdune corridors. Dune crests show both the highest NDVI and highest range of NDVI. Plains have the lowest NDVI and range as a group, and interdune corridors are intermediate. Unit 7 is an exception, plotting as the lowest of all units in both NDVI and NDVI range, due to its high percentage of bare sand.

2340 P. A. Jacobberger and D. M. Hooper
because of the high overall reflectance, salinity or other soil damage was suspected. However, intense field checking of unit 8 verified that the unit was very densely covered with waist-high grass (for example, Stipagrostis), and was in no way subject to soil damage or vegetation loss. This type of ground cover's anomalous reflectance response is the subject of current investigations and highlights the need for substan- tive ground truthing and extremely careful interpretation of remote sensing observa- tions in arid environments.
5. Conclusions (i) We have looked at the TM-based reflectance characteristics of a well-vegetated
dune environment, from a geomorphological perspective. While most of the seasonal variance in the data is clearly explained by vegetation, landform plays a role in controlling vegetation and therefore controls both reflectance and NDVI range. In this study dune crests show higher seasonal variability than interdune corridors, even though total vegetation densities can be equivalent. The species composition and diversity of vegetation on the morphological units were not addressed in detail and our results could be extended and improved by such inclusion. The influence of landform on NDVI and NDVI range is apparent, however, even where geomorphologic units show great diversity in total vegetation cover and composition. The geomorphologi- cal influence is most clearly expressed in the zoning of vegetation with morphological factors including slope, drainage, soil constituents and perhaps insolation. The implication of such a relation is that where NDVI or reflectance measurements are to be used for detailed vegetation assessments, erosion measurements or desertification monitoring, landform and soils information should be included to account for landform-related differences that might otherwise look like land management differences.
(ii) These data support the indepedence of NDVI from particular components of total biomass. Total NDVI ranges are smallest for open canopy, plains units, and are greatest for dune crests. Comparison of the correlations between NDVI and vegetation components at first suggests a sensitivity of the NDVI to tree cover, but upon examination we believe this to be an artefact of sampling procedure.
(iii) Peak NDVI values occur in December 1986 or March 1987 (the growing season), whereas the lowest values occur in August 1987 (the dry season). Both the seasonal pattern and amplitudes of the data agree with prior, field-checked results for the Kalahari (Prince and Tucker 1986, Choudhury and Tucker 1987). Comparison of the reflectance curves and NDVI values for plains units and interdune corridors does suggest that caution is warranted in interpreting dry season values, and highlights the importance of field checking. In particular, our interdune corridor unit 8 is quite similar in both seasonal reflectance patterns and NDVIs to our sparsely-vegetated plains units, even though field checking verified nearly 100 per cent cover in the form of waist-high dry grasses and forbs. In both single-scene and multi-temporal satellite- data-only assessments of surface condition, the statistics for unit 8 suggest that it is sparsely vegetated and thus could be 'damaged' or in fragile condition. Field information clearly showed that this was not the case. We emphasize the need for field substantiation of satellite results, for extreme care in interpretation, and the need for continued theoretical and practical investigations into the geomorphologic processes and response characteristics of vegetation and soils in semi-arid regions.
Acknowledgments This project was supported through NASA Contract NAS5-28774. Our sincere
thanks go to Mrs D. L. D. Gopolang of the Office of the President, Republic of

Geomorphology and reflectance of vegetated dunes
Botswana, for her support of the field programme and to Mrs Trudie E. Thompson of the Embassy of the United States of America to Botswana for her assistance. Thanks are extended to D r Thomas R. Watters for reviewing an earlier version of the paper and to D r P. Helfenstein and D r J. Veverka for providing advice and access to the Cornell University goniometer. We also sincerely wish to thank two anonymous reviewers for their very helpful comments and suggestions on ways to improve the manuscript.
References ANDRINGA, J., 1984, The climate of Botswana in histograms. Botswana Society, Gaborone,
Botswana Notes and Records, 16, 1 17-125. BAILLIEUL, T. A., 1975, A reconnaissance survey of the cover sands in the Republic of
Botswana. Journal of Sedimentary Petrology, 45,494-503. BHALOTRA, Y. P. R., 1987, Climate of Botswana: Part ZI-Elements of Climate. (Gaborone:
Department of Meteorological Services), 104 p. CHOUDHURY, B. J., and TUCKER, C . J., 1987, Satellite observed seasonal and inter-annual
variation of vegetation over the Kalahari, the Great Victoria Desert, and the Great Sandy Desert: 1979-1984. Remote Sensing of Environment, 23,233-242.
COLWELL, J. E., 1974, Vegetation canopy reflectance, Remote Sensing of Environment, 3, 175-183.
COOKE, H. J., 1980, Landform evolution in the context of climatic change and neo-tectonism in the Middle Kalahari of north-central Botswana. Transactions, Institute of British Geographers, New Series, 5, 80-99.
FIELD, D. I., 1978, A Handbook of Basic Ecology for Range Management in Botswana, 2nd edition (Gaborone; Land Utilisation Division, Ministry of Agriculture), 119 p..
FOSTER, S. S. D., BATH, A. H., FARR, J. L., and LEWIS, W. J., 1982, The likelihood of active groundwater recharge in the Botswana Kalahari. Journal of Hydrology, 55, 113-136.
GROVE, A. T., 1969, Landforms and climatic change in the Kalahari and Ngamiland. Geographical Journal, 135, 191-212.
HUTCHINS, D. G., HUTTON, L. G., HUTTON, S. M., JONES, C. R., and LOEHNERT, E. P., 1976, A summary of the geology, seismicity, geomorphology and hydrology of the Okavango Delta. Botswana Geological Survey Bulletin, 7, 25 p.
JACOBBERGER, P., 1989, Reflectance characteristics and surface processes in stabilized dune environments. Remote Sensing of Environment, 28, 287-295.
LANCASTER, N., 1981, Palaeoenvironmental implications of fixed dune systems in southern Africa. Palaeogeography, Palaeoclimatology, and Palaeoecology, 33, 327-346.
MARKHAM, B. L., and BARKER, J. L., 1986, Landsat MSS and TM Post-calibration Dynamic Ranges, Exoatmospheric ReJectances and At-Satellite Temperatures (Lanham, Mary- land: EOSAT Landsat Data User Notes), 1, pp. 1-8.
NEUMANN-REDLIN, C., 198 1, 1: 500 000 Hydrogeological Reconnaissance Map (map text) (Lobatse: Geological Survey Department).
NICHOLSON, S., (World Meterological Organization), 1985, World Monthly Surface Station Climatology Data Set: Ashville, North Carolina, NOAAINEDIS National Climate Data Center, computer compatible tape.
PRINCE, S. D., and ASTLE, W. L., 1986, Satellite remote sensing of rangelands in Botswana I: Landsat MSS and herbaceous vegetation. International Journal of Remote Sensing, 7 , 1533-1554.
PRINCE, S. D., and TUCKER, C. J., 1986, Satellite remote sensing of rangelands in Botswana 11. NOAA AVHRR and herbaceous vegetation. International Journal of Remote Sensing, 7, 1555-1570.
SHAW, P., 1985, Late Quaternary landforms and environmental change in north-west Bots- wana: the evidence of Lake Ngami and the Mababe Depression. Transactions of the Institute of British Geographers, New Series, 10, 333-346.
SMITH, P. A., 1976, An outline of the vegetation of the Okavango drainage system. In Proceedings of the Symposium on the Okavango Delta and its Future Utilisation (Gaborone: Botswana Society), pp. 93-1 12.
THOMAS, D. S. G., 1988, The nature and depositional setting of arid and semi-arid Kalahari sediments, Southern Africa. Journal of Arid Environments, 14, 17-26.

2342 Geomorphology and reflectance of vegetated dunes
TUCKER, C. J., 1979, Red and photographic infrared linear combinations for monitoring vegetation. Remote Sensing of Environment, 8, 127-150.
TUCKER, C. J., TOWNSHEND, J. R. G., and GOFF, T. E., 1985, African land-cover classification using satellite data. Science, 227, 369-375.
WHITE, F., 1983, The vegetation of Africa (descriptive memoir). UNESCO (United Nations Educational, Scientific and Cultural Organization), 356 p.