Embed Size (px)
Citation preview
GEOP 415
Part 1
Essentials of Seismic Interpretation
Chapter 4
Seismic Stratigraphic Interpretation
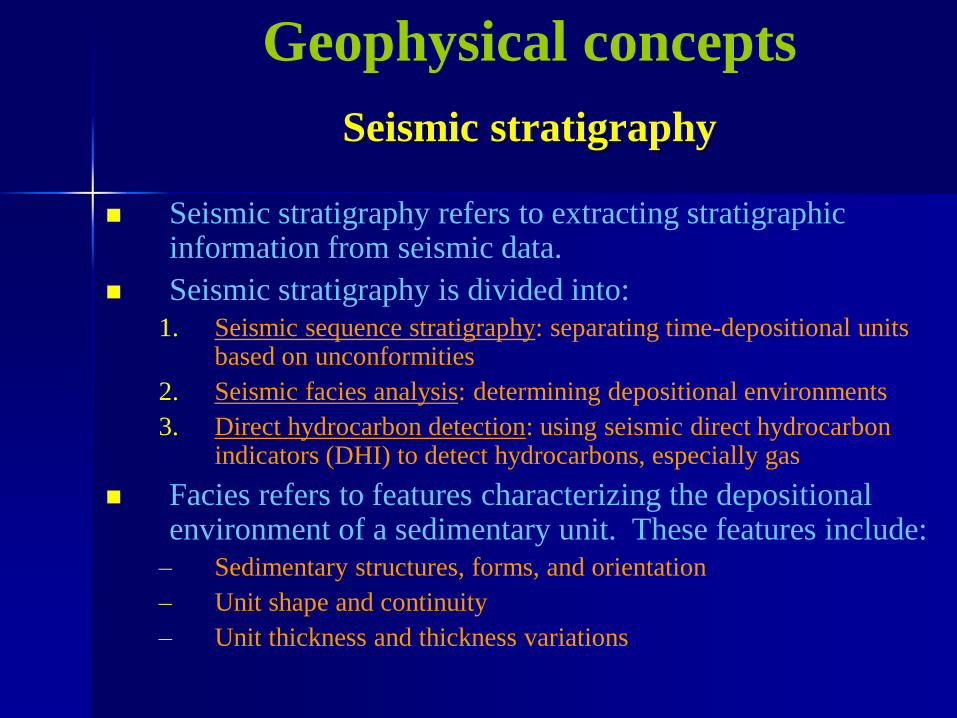
Geophysical concepts
Seismic stratigraphy
Seismic stratigraphy refers to extracting stratigraphic information from seismic data.
Seismic stratigraphy is divided into: 1. Seismic sequence stratigraphy: separating time-depositional units
based on unconformities
2. Seismic facies analysis: determining depositional environments
3. Direct hydrocarbon detection: using seismic direct hydrocarbon indicators (DHI) to detect hydrocarbons, especially gas
Facies refers to features characterizing the depositional environment of a sedimentary unit. These features include: – Sedimentary structures, forms, and orientation
– Unit shape and continuity
– Unit thickness and thickness variations
Geophysical concepts
Seismic sequence stratigraphy
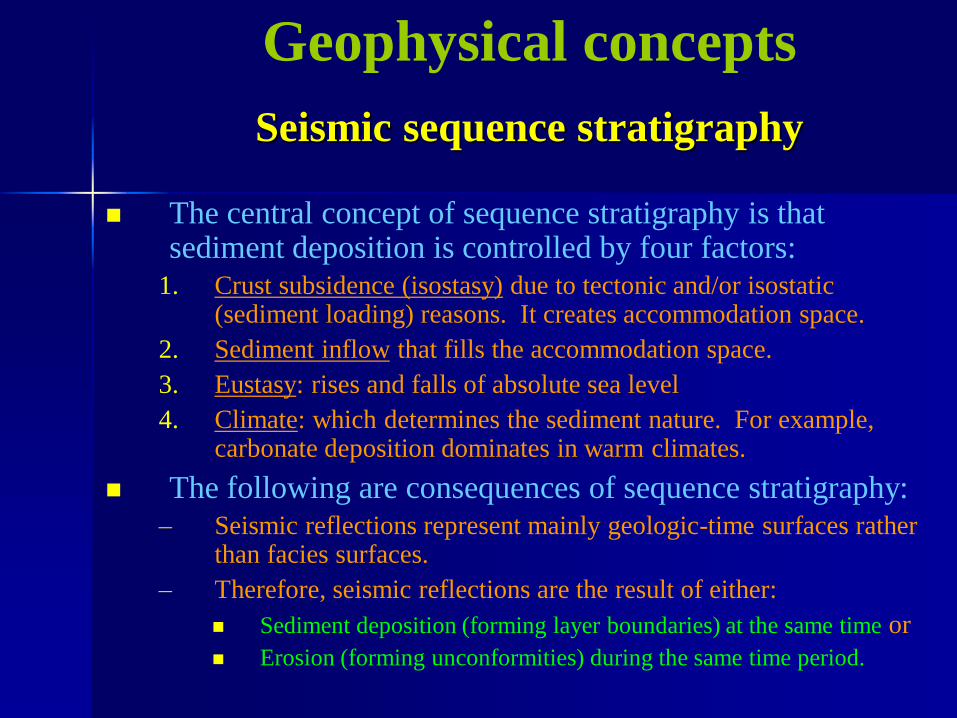
The central concept of sequence stratigraphy is that sediment deposition is controlled by four factors:
1. Crust subsidence (isostasy) due to tectonic and/or isostatic (sediment loading) reasons. It creates accommodation space.
2. Sediment inflow that fills the accommodation space.
3. Eustasy: rises and falls of absolute sea level
4. Climate: which determines the sediment nature. For example, carbonate deposition dominates in warm climates.
The following are consequences of sequence stratigraphy: – Seismic reflections represent mainly geologic-time surfaces rather
than facies surfaces.
– Therefore, seismic reflections are the result of either:
Sediment deposition (forming layer boundaries) at the same time or
Erosion (forming unconformities) during the same time period.
Geophysical concepts
Seismic sequence stratigraphy
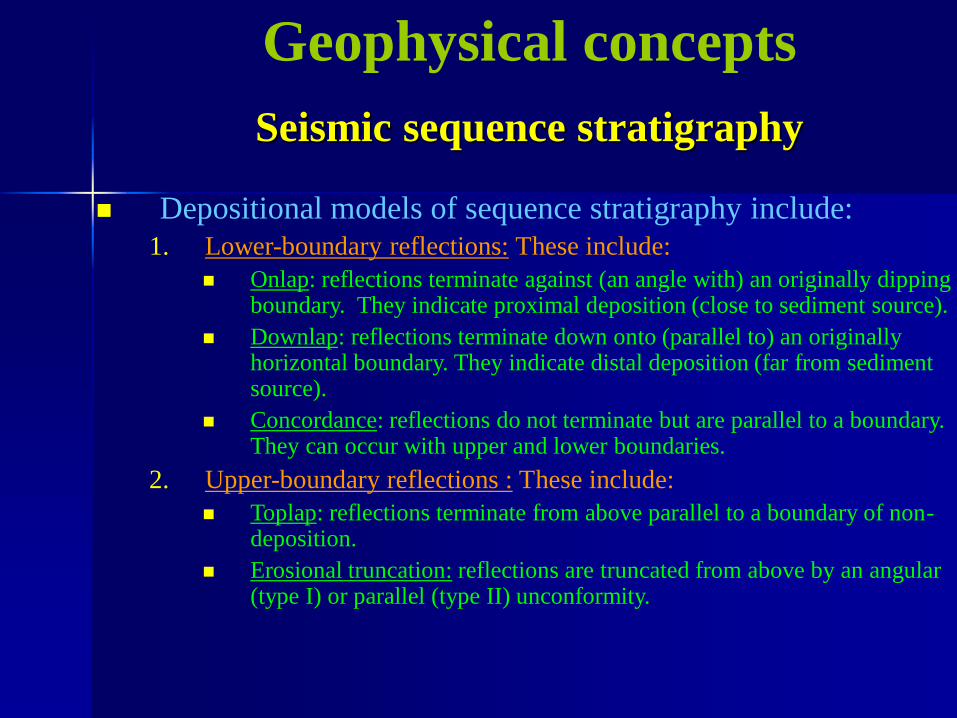
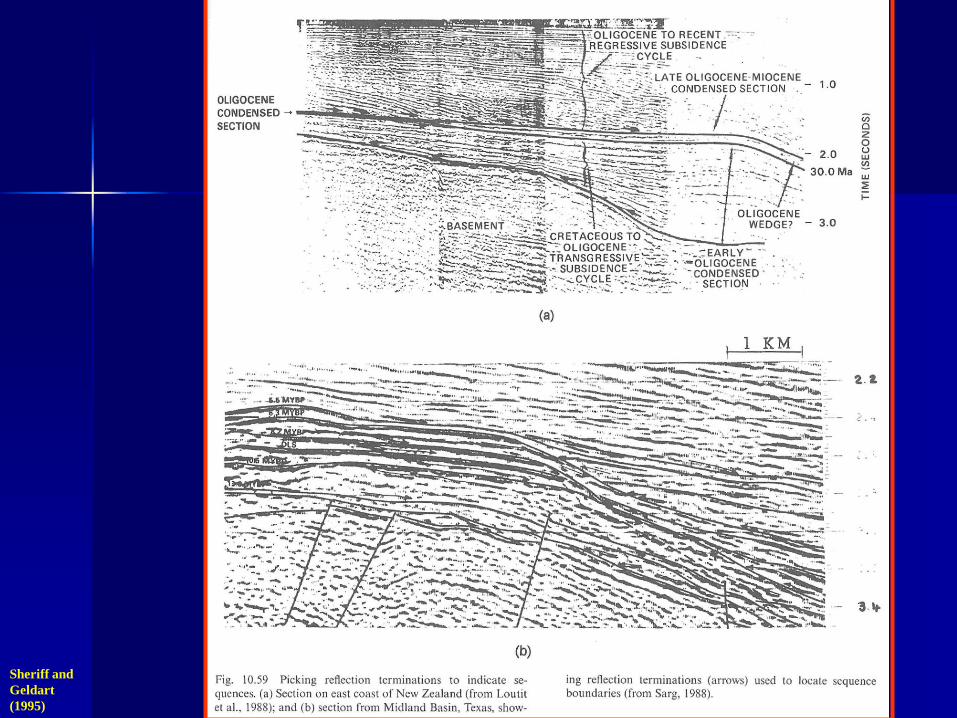
Depositional models of sequence stratigraphy include: 1. Lower-boundary reflections: These include:
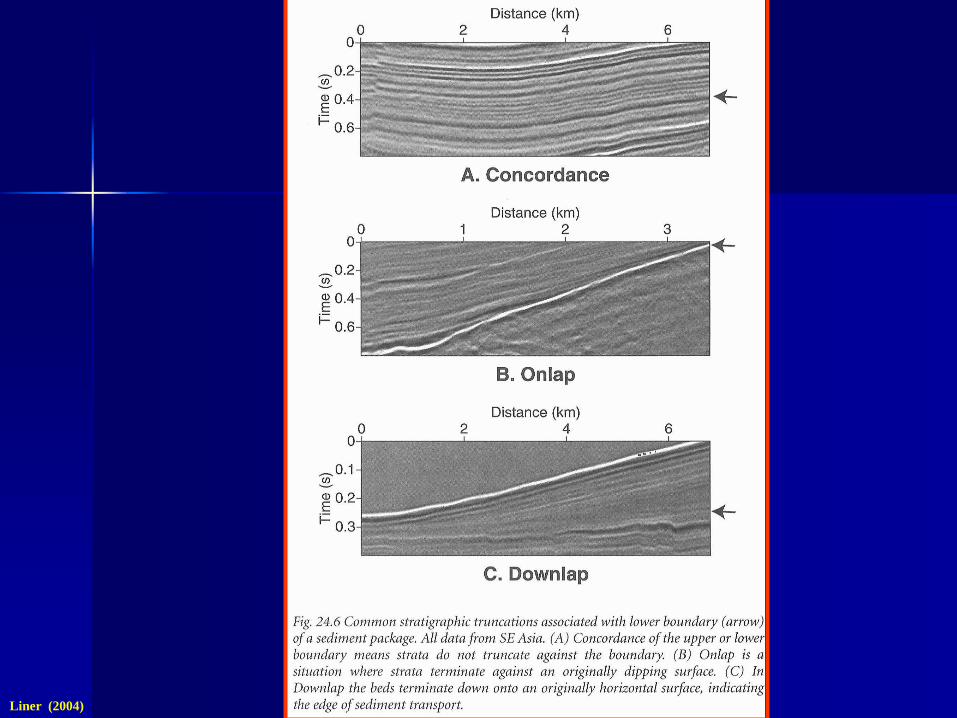
Onlap: reflections terminate against (an angle with) an originally dipping boundary. They indicate proximal deposition (close to sediment source).
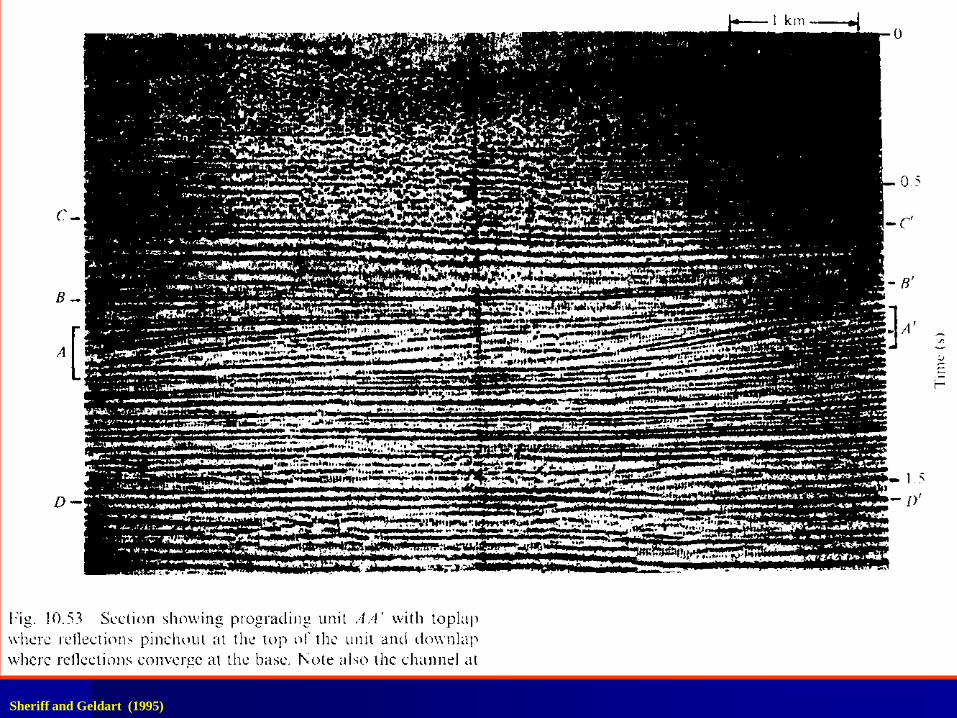
Downlap: reflections terminate down onto (parallel to) an originally horizontal boundary. They indicate distal deposition (far from sediment source).
Concordance: reflections do not terminate but are parallel to a boundary. They can occur with upper and lower boundaries.
2. Upper-boundary reflections : These include:
Toplap: reflections terminate from above parallel to a boundary of non-deposition.
Erosional truncation: reflections are truncated from above by an angular (type I) or parallel (type II) unconformity.
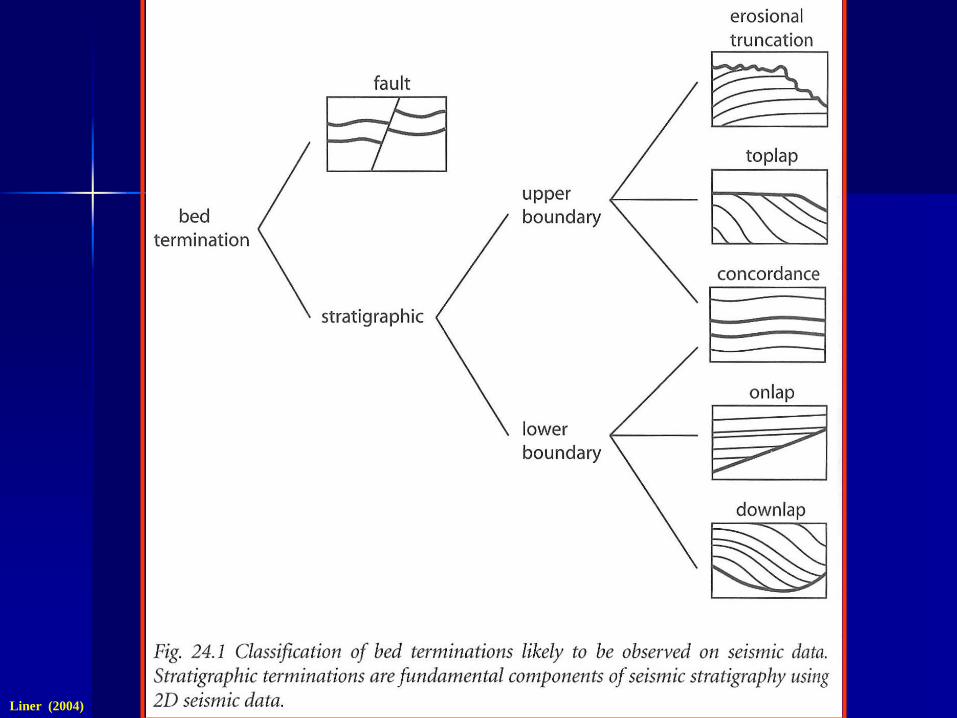
Liner (2004)
Liner (2004)
Liner (2004) Sheriff and Geldart (1995)
Geophysical concepts
Seismic sequence stratigraphy
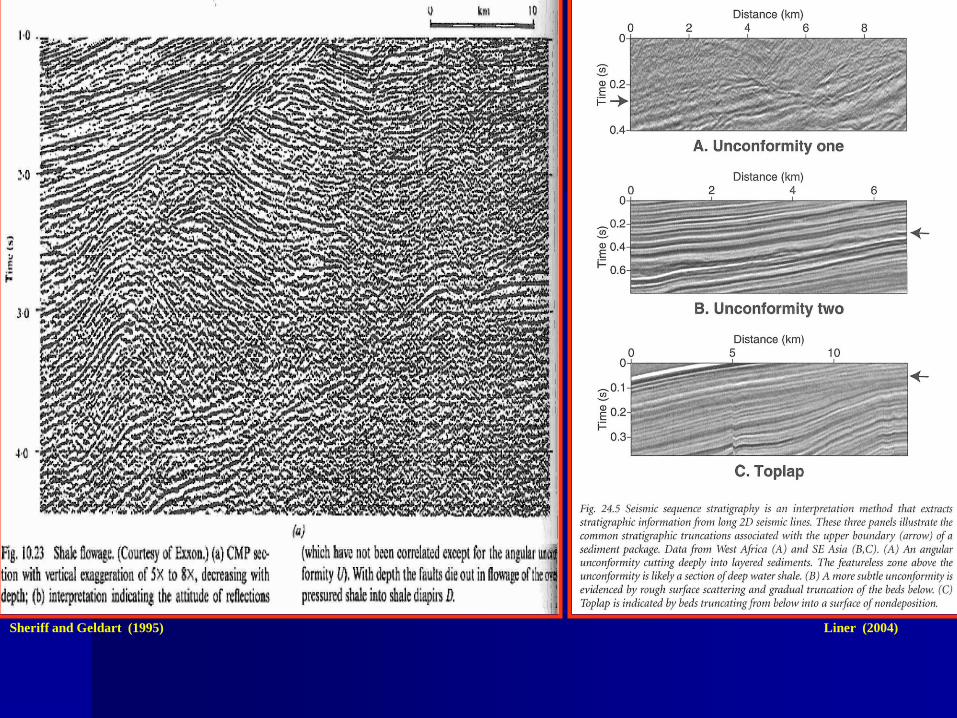
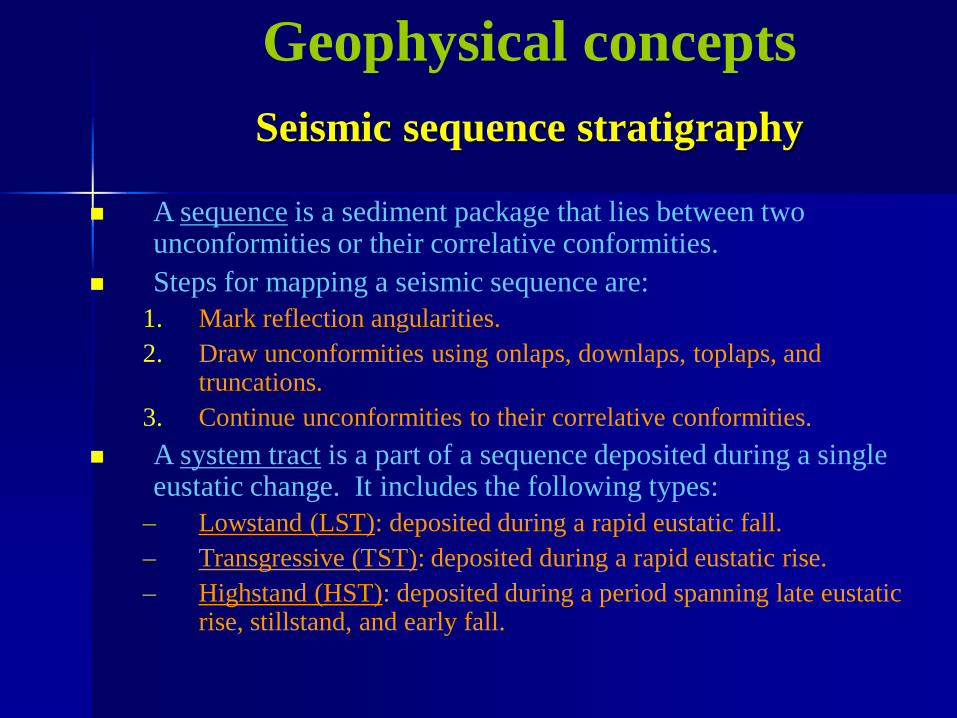
A sequence is a sediment package that lies between two unconformities or their correlative conformities.
Steps for mapping a seismic sequence are:
1. Mark reflection angularities.
2. Draw unconformities using onlaps, downlaps, toplaps, and truncations.
3. Continue unconformities to their correlative conformities.
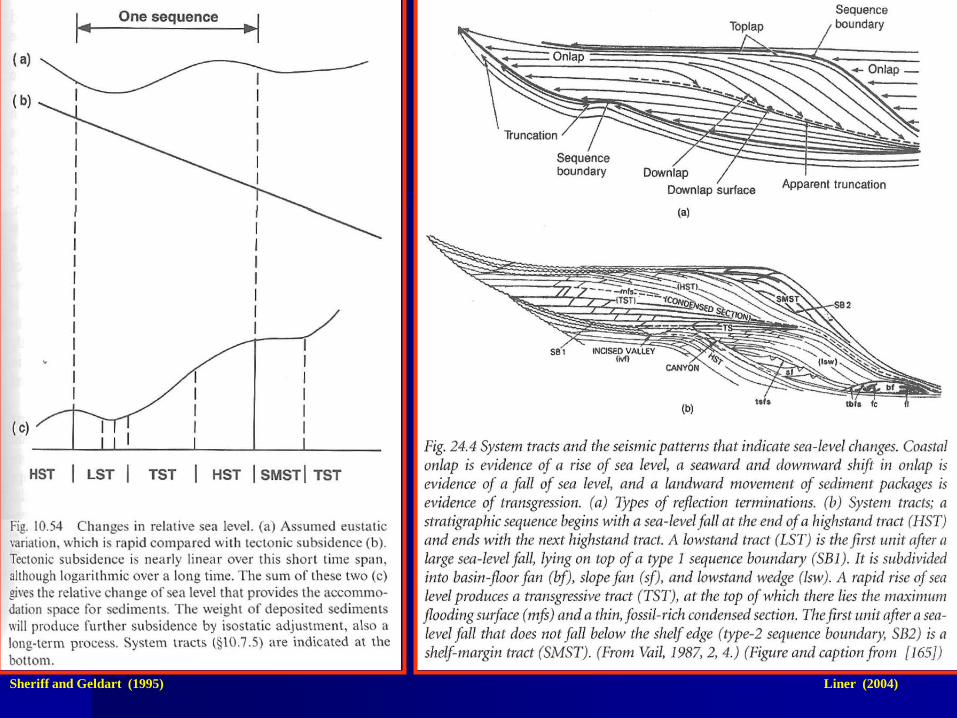
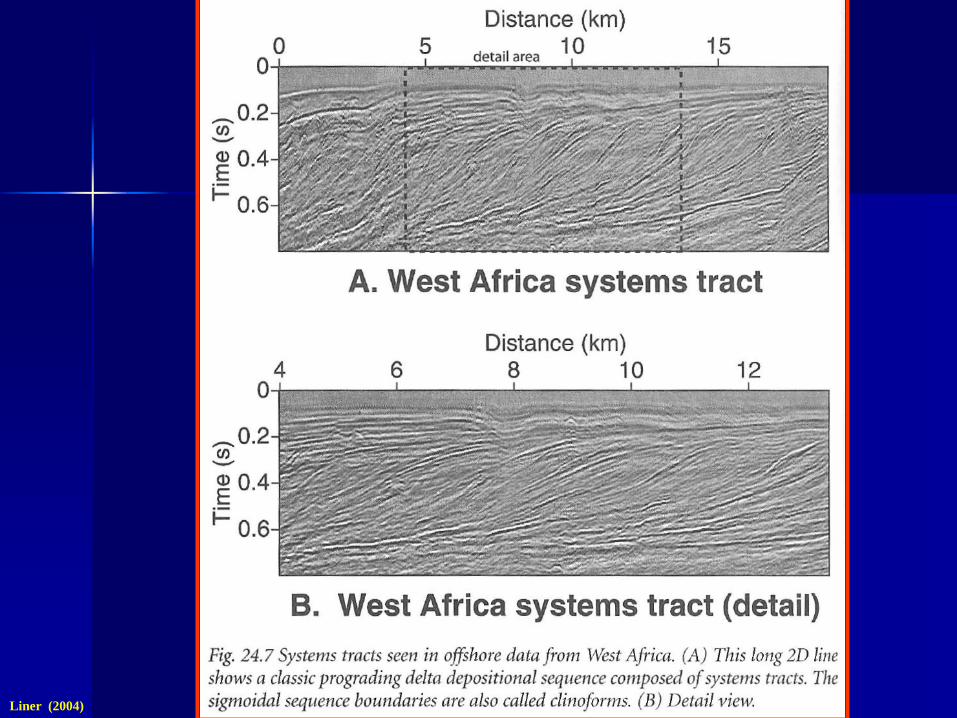
A system tract is a part of a sequence deposited during a single eustatic change. It includes the following types:
– Lowstand (LST): deposited during a rapid eustatic fall.
– Transgressive (TST): deposited during a rapid eustatic rise.
– Highstand (HST): deposited during a period spanning late eustatic rise, stillstand, and early fall.
Liner (2004) Sheriff and Geldart (1995)
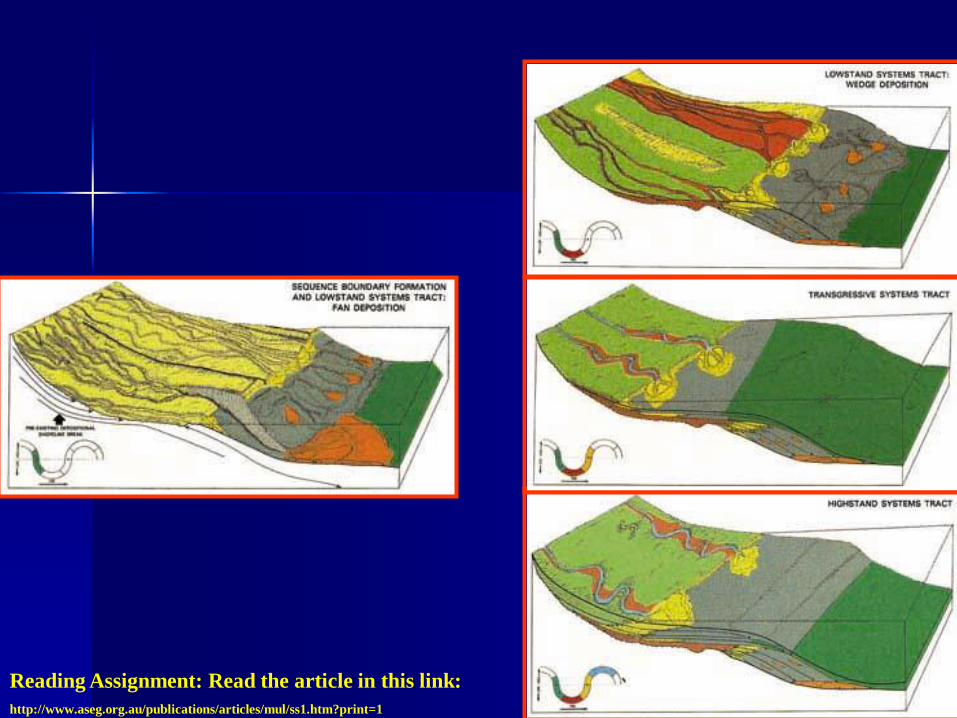
Reading Assignment: Read the article in this link:
http://www.aseg.org.au/publications/articles/mul/ss1.htm?print=1
Sheriff and
Geldart
(1995)
Liner (2004)
Sheriff and Geldart (1995)
Geophysical concepts
Seismic facies analysis
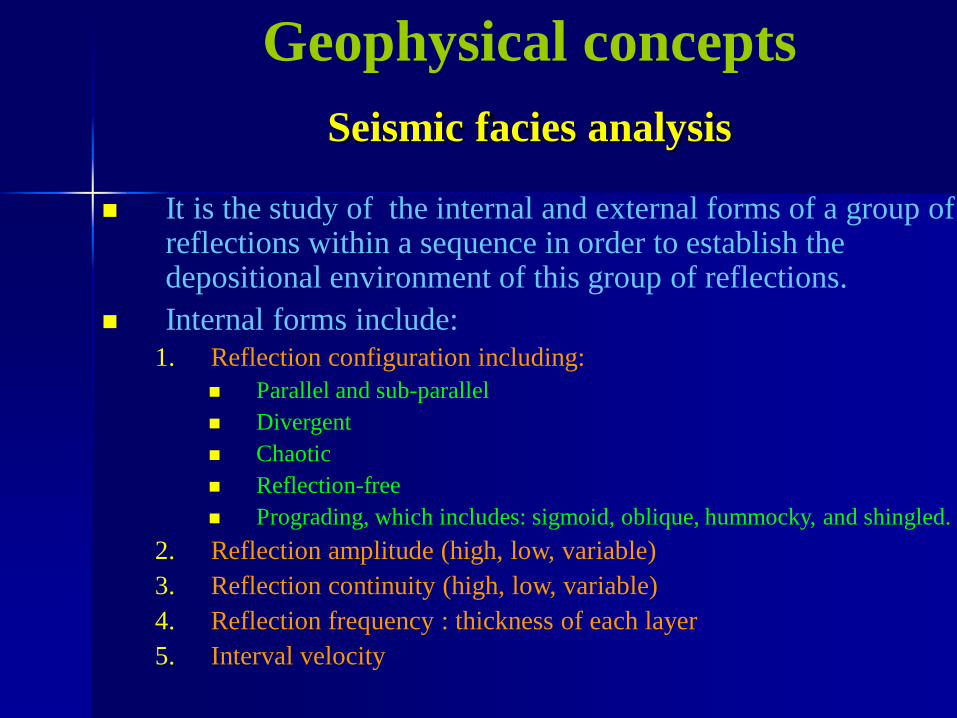
It is the study of the internal and external forms of a group of reflections within a sequence in order to establish the depositional environment of this group of reflections.
Internal forms include: 1. Reflection configuration including:
Parallel and sub-parallel
Divergent
Chaotic
Reflection-free
Prograding, which includes: sigmoid, oblique, hummocky, and shingled.
2. Reflection amplitude (high, low, variable)
3. Reflection continuity (high, low, variable)
4. Reflection frequency : thickness of each layer
5. Interval velocity
Geophysical concepts
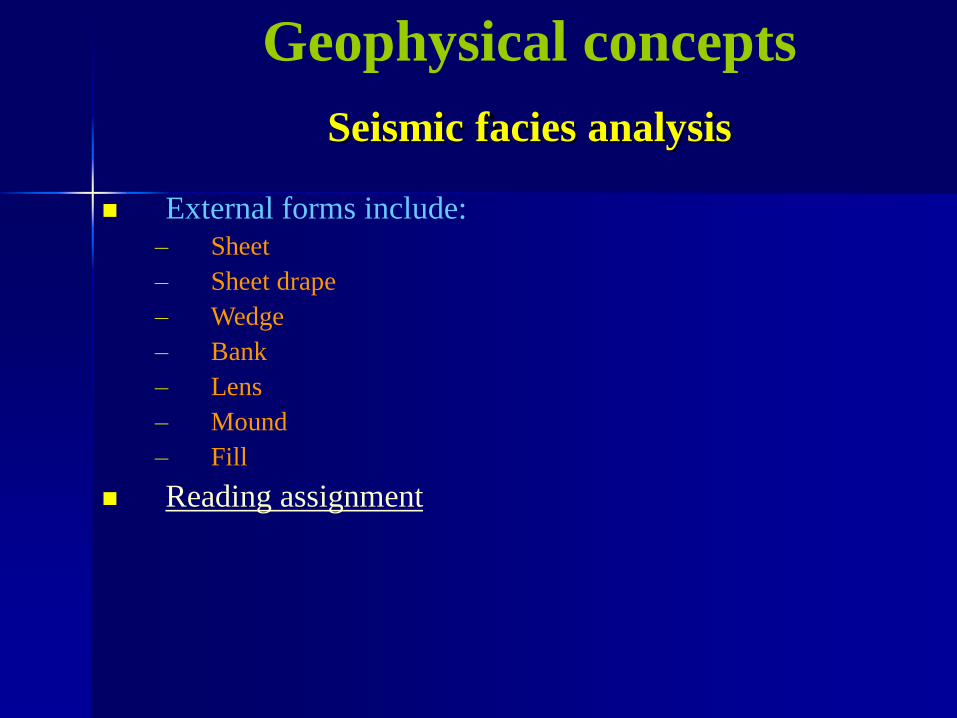
Seismic facies analysis
External forms include: – Sheet
– Sheet drape
– Wedge
– Bank
– Lens
– Mound
– Fill
Reading assignment
Geophysical concepts
Seismic facies analysis
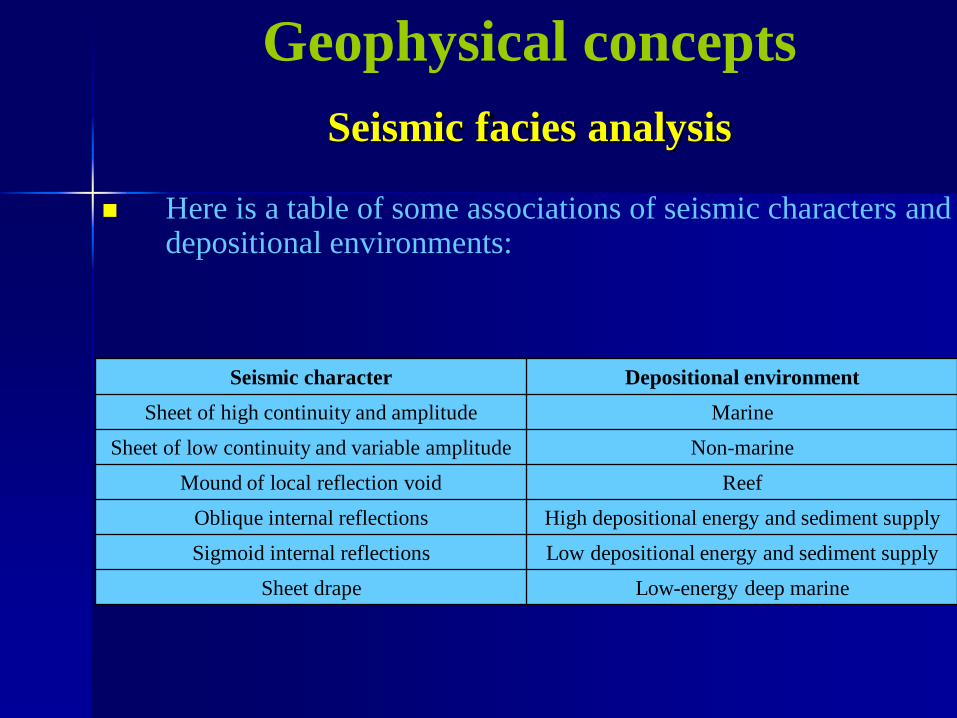
Seismic character Depositional environment
Sheet of high continuity and amplitude Marine
Sheet of low continuity and variable amplitude Non-marine
Mound of local reflection void Reef
Oblique internal reflections High depositional energy and sediment supply
Sigmoid internal reflections Low depositional energy and sediment supply
Sheet drape Low-energy deep marine
Here is a table of some associations of seismic characters and depositional environments:
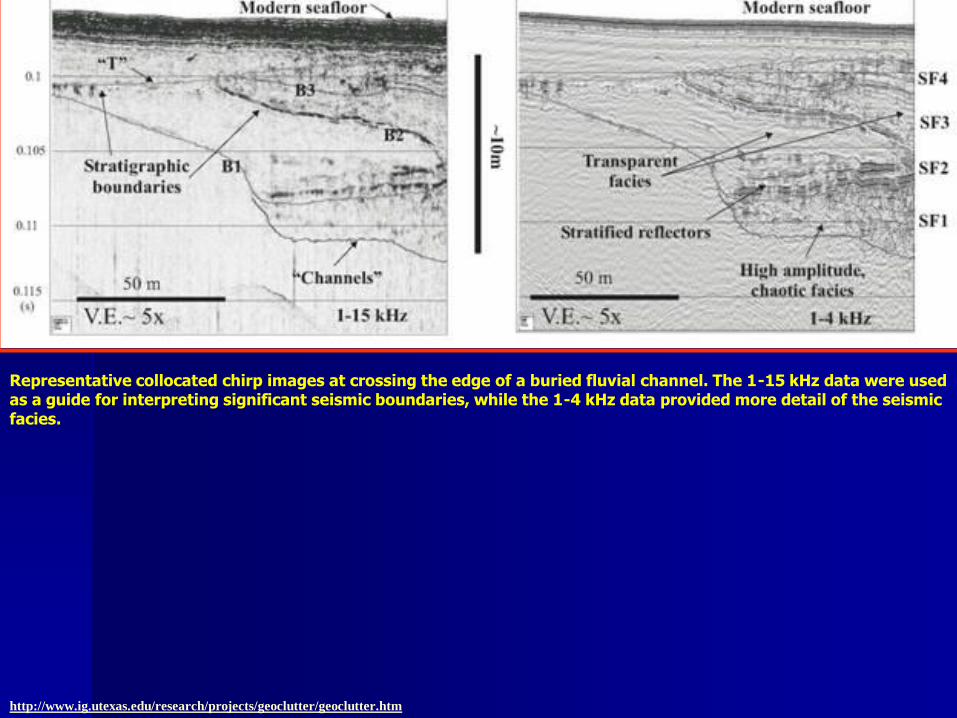
Representative collocated chirp images at crossing the edge of a buried fluvial channel. The 1-15 kHz data were used as a guide for interpreting significant seismic boundaries, while the 1-4 kHz data provided more detail of the seismic facies.
http://www.ig.utexas.edu/research/projects/geoclutter/geoclutter.htm
Geophysical concepts
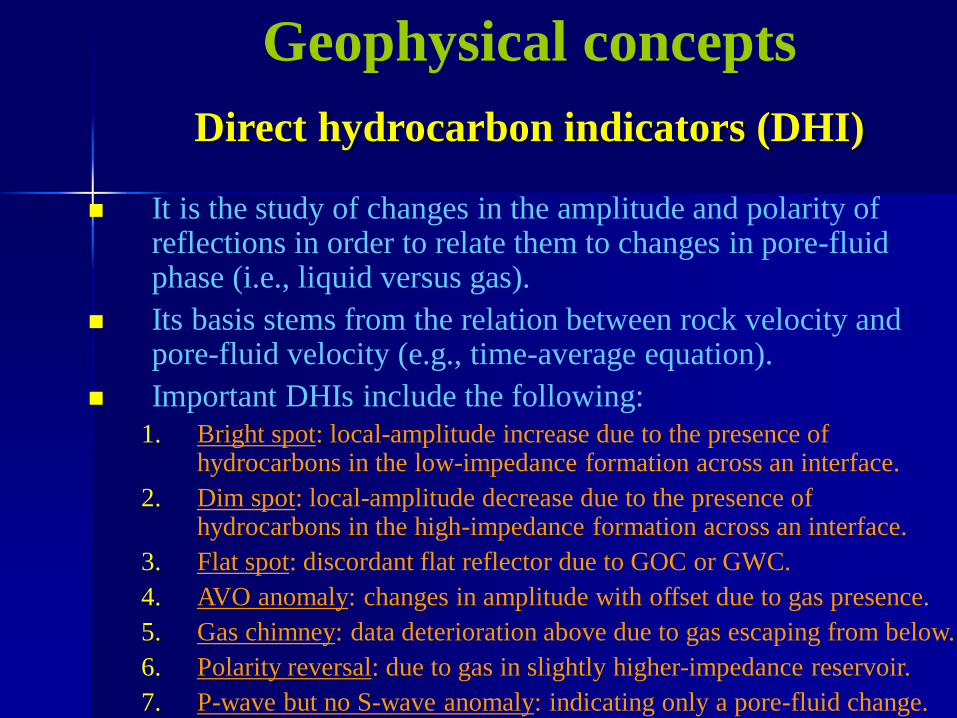
Direct hydrocarbon indicators (DHI)
It is the study of changes in the amplitude and polarity of reflections in order to relate them to changes in pore-fluid phase (i.e., liquid versus gas).
Its basis stems from the relation between rock velocity and pore-fluid velocity (e.g., time-average equation).
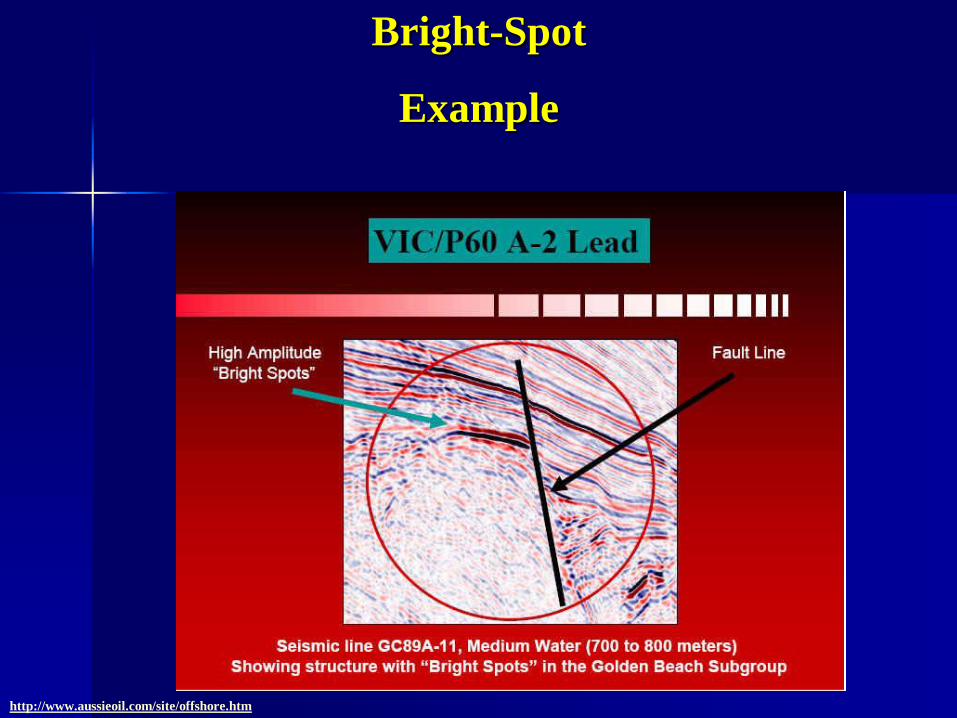
Important DHIs include the following: 1. Bright spot: local-amplitude increase due to the presence of
hydrocarbons in the low-impedance formation across an interface.
2. Dim spot: local-amplitude decrease due to the presence of hydrocarbons in the high-impedance formation across an interface.
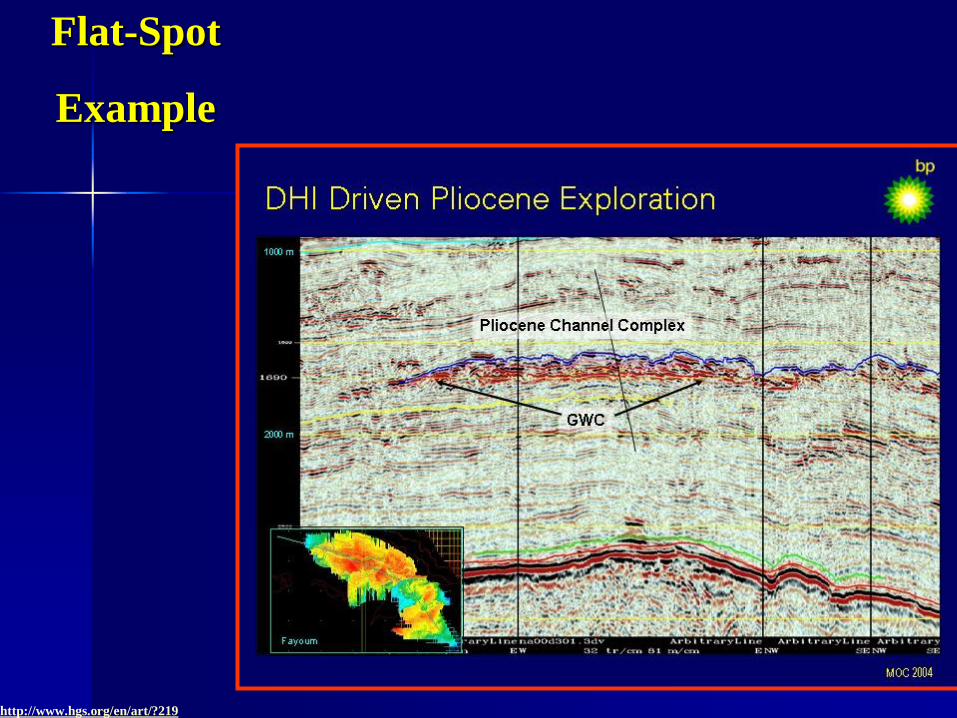
3. Flat spot: discordant flat reflector due to GOC or GWC.
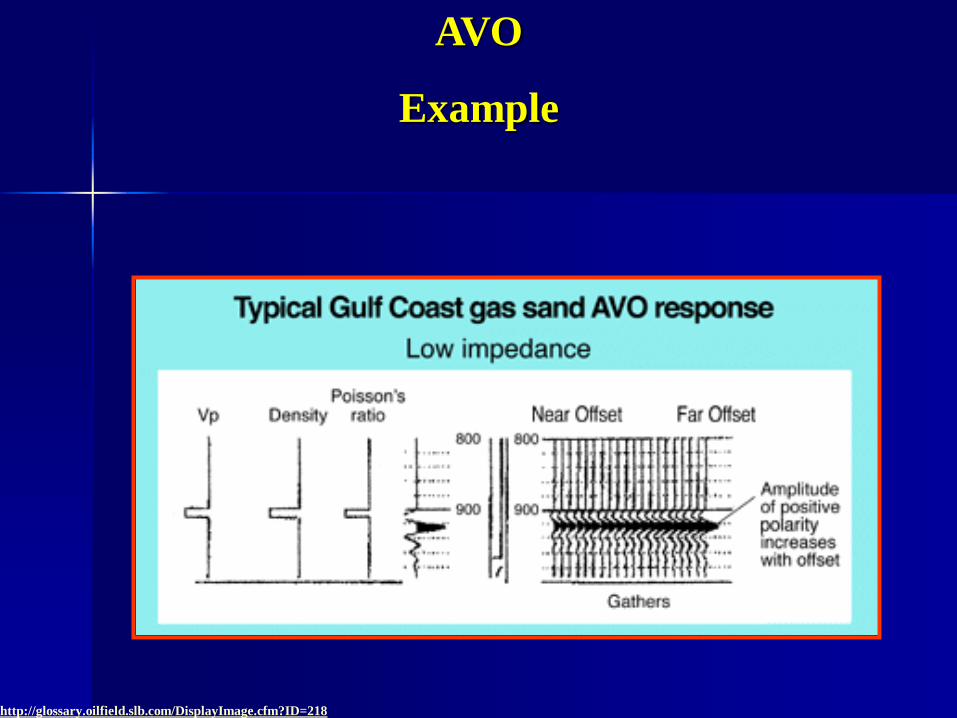
4. AVO anomaly: changes in amplitude with offset due to gas presence.
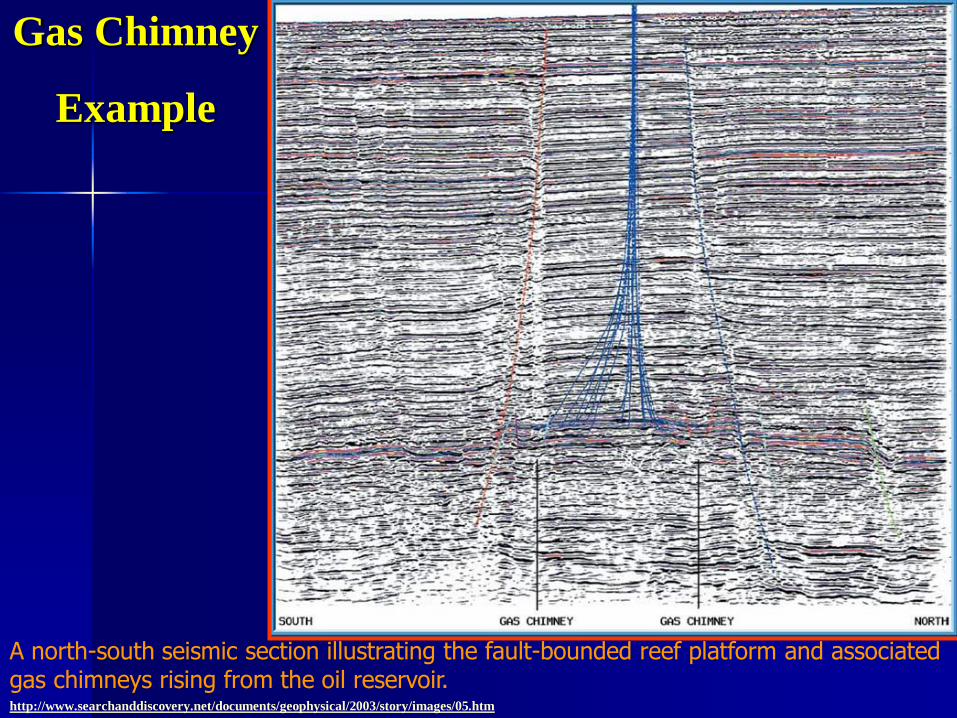
5. Gas chimney: data deterioration above due to gas escaping from below.
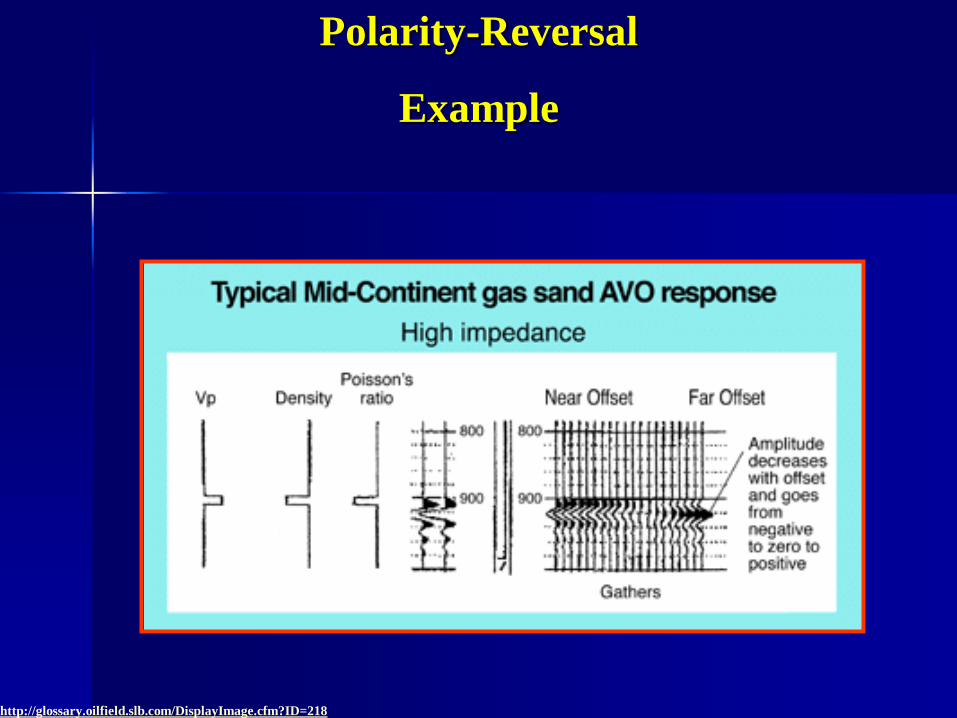
6. Polarity reversal: due to gas in slightly higher-impedance reservoir.
7. P-wave but no S-wave anomaly: indicating only a pore-fluid change.
Bright-Spot
Example
http://www.aussieoil.com/site/offshore.htm
AVO
Example
http://glossary.oilfield.slb.com/DisplayImage.cfm?ID=218
Gas Chimney
Example
http://www.searchanddiscovery.net/documents/geophysical/2003/story/images/05.htm
A north-south seismic section illustrating the fault-bounded reef platform and associated gas chimneys rising from the oil reservoir.
Polarity-Reversal
Example
http://glossary.oilfield.slb.com/DisplayImage.cfm?ID=218
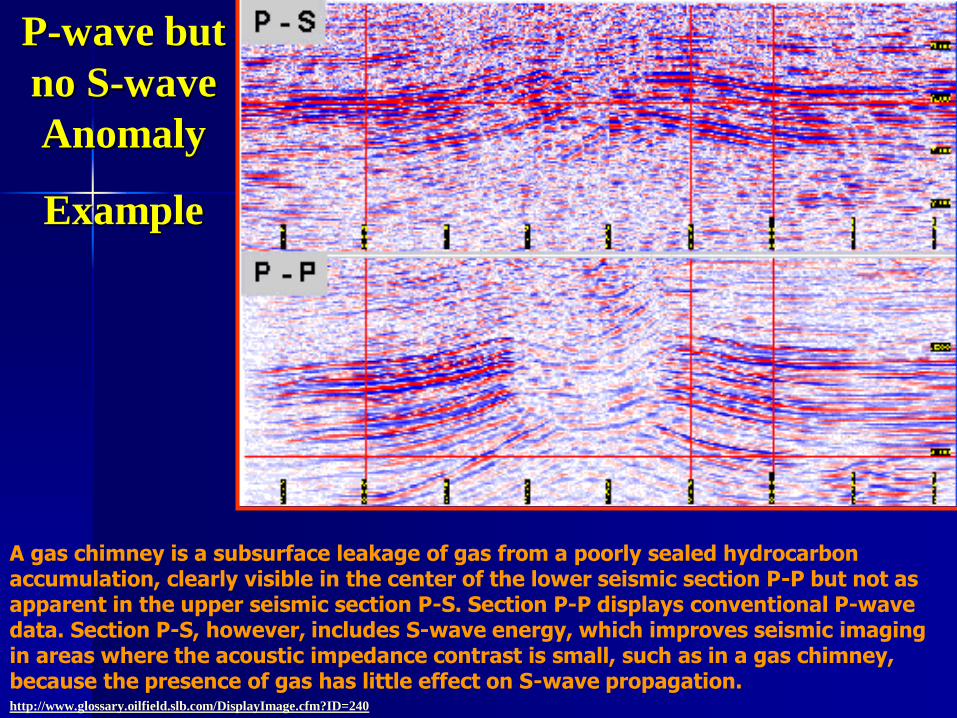
P-wave but
no S-wave
Anomaly
Example
http://www.glossary.oilfield.slb.com/DisplayImage.cfm?ID=240
A gas chimney is a subsurface leakage of gas from a poorly sealed hydrocarbon accumulation, clearly visible in the center of the lower seismic section P-P but not as apparent in the upper seismic section P-S. Section P-P displays conventional P-wave data. Section P-S, however, includes S-wave energy, which improves seismic imaging in areas where the acoustic impedance contrast is small, such as in a gas chimney, because the presence of gas has little effect on S-wave propagation.

Maps of P-P and P-SV amplitude-based seismic facies (top) across a carbonate interval of West Texas and vertical sections through these P-P and P-SV data volumes along inline 67 (bottom). A unique P-SV amplitude facies follows the trend of productive stratigraphic-trap wells (right); the P-P amplitude facies does not (left).
Comparison of deep, depth-equivalent, P-P and P-SV data windows, Gulf of Mexico. These data are a classic example of the principle of elastic-wavefield seismic stratigraphy in that the sequence geometry defined by P-SV features 1 and 2 differs from the P-P geometry.
http://www.netl.doe.gov/technologies/oil-gas/Petroleum/projects/EP/Explor_Tech/15396.htm
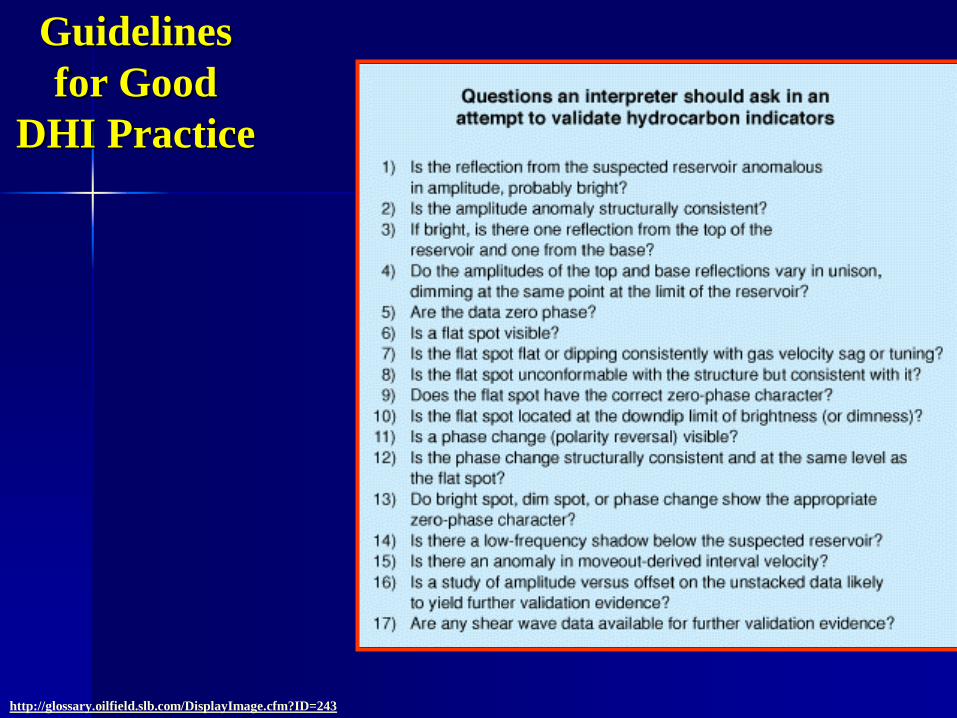
Guidelines
for Good
DHI Practice
http://glossary.oilfield.slb.com/DisplayImage.cfm?ID=243


![WAC 415 - 02 CHAPTER - Washingtonleg.wa.gov/CodeReviser/WACArchive/Documents/2015/WAC 415 - 02... · (2/27/14) [Ch. 415-02 WAC p. 1] Chapter 415-02 Chapter 415-02 WAC GENERAL PROVISIONS](https://img.pdfslide.net/doc/110x75/5ad016617f8b9aca598d40d7/wac-415-02-chapter-415-0222714-ch-415-02-wac-p-1-chapter-415-02.jpg)