Embed Size (px)
Citation preview
GeoPark Investor DayN e w Yo r k , N o v e m b e r 1 9 , 2 0 1 8
2
• The material that follows comprises information about GeoPark Limited (“GeoPark” or the “Company”) and its subsidiaries, as of the date of the presentation. It has been prepared solely for informational purposes and should not be treated as giving legal, tax, investment orother advice to potential investors. The information presented or contained herein is in summary form and does not purport to be complete.
• No representations or warranties, express or implied, are made as to, and no reliance should be placed on, the accuracy, fairness, or completeness of this information. Neither GeoPark nor any of its affiliates, advisers or representatives accepts any responsibilitywhatsoever for any loss or damage arising from any information presented or contained in this presentation. The information presented or contained in this presentation is current as of the date hereof and is subject to change without notice, and its accuracy is notguaranteed. Neither GeoPark nor any of its affiliates, advisers or representatives makes any undertaking to update any such information subsequent to the date hereof.
• This presentation contains forward-looking statements, which are based upon GeoPark and/or its management’s current expectations and projections about future events. When used in this presentation, the words “believe,” “anticipate,” “intend,” “estimate,” “expect,”“should,” “may” and similar expressions, or the negative of such words and expressions, are intended to identify forward-looking statements, although not all forward-looking statements contain such words or expressions. Additionally, all information, other than historicalfacts included in this presentation, regarding strategy, future operations, drilling plans, estimated reserves, estimated resources, future production, estimated capital expenditures, projected costs and costs reductions, cash flows or cash flows growth, GDP growth, thepotential of drilling prospects, potential production from existing assets and other plans and objectives of management for 2019 and beyond is forward-looking information. Such statements and information are subject to a number of risks, uncertainties and assumptions.Forward-looking statements are not guarantees of future performance and actual results may differ materially from those anticipated due to many factors, including oil and natural gas prices, industry conditions, drilling results, uncertainties in estimating reserves andresources, availability and cost of drilling rigs, production equipment, supplies, personnel and oil field services, availability of capital resources and other factors. As for forward-looking statements that relate to future financial results and other projections, actual results maybe different due to the inherent uncertainty of estimates, forecasts and projections. Because of these uncertainties, potential investors should not rely on these forward-looking statements. Neither GeoPark nor any of its affiliates, directors, officers, agents or employees, norany of the shareholders or under shall be liable, in any event, before any third party (including investors) for any investment or business decision made or action taken in reliance on the information and statements contained in this presentation or for any consequential,special or similar damages.
• Statements related to resources are deemed forward-looking statements as they involve the implied assessment, based on certain estimates and assumptions, that the resources will be discovered and can be profitably produced in the future. Specifically, forward-lookinginformation contained herein regarding "resources" may include: estimated volumes and value of the Company's oil and gas resources and the ability to finance future development; and, the conversion of a portion of resources into reserves.
• The information included in this presentation regarding estimated quantities of proved, probable or possible reserves in Chile, Colombia, Brazil, and Peru as of December 31, 2017; are derived, in part, from the reports prepared by DeGolyer and MacNaughton, or D&M,independent reserves engineers. Certified reserves refers to net reserves independently evaluated by the petroleum consulting firm, D&M. Certain reserves data, such as those based on the D&M report, were prepared under SEC standards, and certain other data wereprepared under Petroleum Resources Management System (PRMS) standards.
• The information included in this presentation regarding estimated exploration resources in Colombia, Chile, Brazil, and Peru as of December 31, 2015, 2016 or 2017; are derived, in part, from the reports prepared by Gaffney, Cline & Associates, or GCA. The accuracy ofany resource estimate is a function of the quality of the available data and of engineering and geological interpretation. Results of drilling, testing and production that postdate the preparation of the estimates may justify revisions, some or all of which may be material.Accordingly, resource estimates are often different from the quantities of oil and gas that are ultimately recovered, and the timing and cost of those volumes that are recovered may vary from that assumed.
• Prospective Resources are those quantities of petroleum that are estimated, as of a given date, to be potentially recoverable from undiscovered accumulations by application of future development projects. Prospective Resources have both an associated “chance ofdiscovery” and a “chance of development” (per PRMS). Prospective Resources are further subdivided in accordance with the level of certainty associated with recoverable estimates, assuming their discovery and development, and may be sub-classified based on projectmaturity. There is no certainty that any portion of the Prospective Resources will be discovered. If discovered, there is no certainty that it will be commercially viable to produce any portion of the resources. Prospective Resource volumes are presented as unrisked. The riskor chance of finding a minimum hydrocarbon volume that can flow to surface is presented as Geological Chance of Success (GCoS).
• Certain data in this presentation was obtained from various external sources, and neither GeoPark nor its affiliates, advisers or representatives has verified such data with independent sources. Accordingly, neither GeoPark nor any of its affiliates, advisers orrepresentatives makes any representations as to the accuracy or completeness of that data, and such data involves risks and uncertainties and is subject to change based on various factors.
• This presentation contains a discussion of Adjusted EBITDA, which is not an IFRS measure. We define Adjusted EBITDA as profit for the period before net finance cost, income tax, depreciation, amortization and certain non-cash items such as impairments and write-offsof unsuccessful exploration and evaluation assets, accrual of stock options and stock awards and bargain purchase gain on acquisition of subsidiaries. Adjusted EBITDA is included in this presentation because it is a measure of our operating performance and ourmanagement believes that Adjusted EBITDA is useful to investors because it is frequently used by securities analysts, investors and other interested parties in their evaluation of the operating performance of companies in industries similar to ours. Adjusted EBITDA shouldnot be considered a substitute for financial information presented or prepared in accordance with IFRS. Adjusted EBITDA, as determined and measured by us, should also not be compared to similarly titled measures reported by other companies.
• Rounding amounts and percentages: Certain amounts and percentages included in this document have been rounded for ease of presentation. Percentage figures included in this document have not in all cases been calculated on the basis of such rounded figures but onthe basis of such amounts prior to rounding. For this reason, certain percentage amounts in this document may vary from those obtained by performing the same calculations using the figures in the financial statements. In addition, certain other amounts that appear in thisdocument may not sum due to rounding.
Disclaimer
3
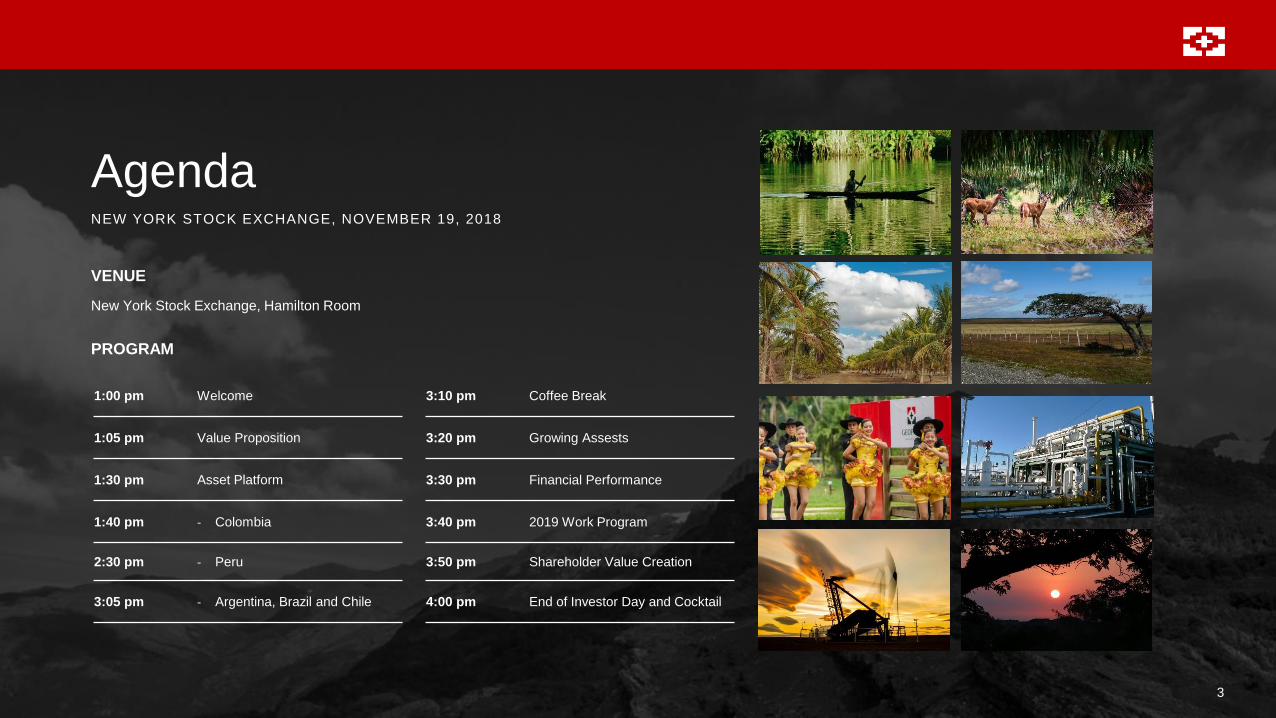
Agenda
VENUE
New York Stock Exchange, Hamilton Room
PROGRAM
1:00 pm Welcome
1:05 pm Value Proposition
1:30 pm Asset Platform
1:40 pm - Colombia
2:30 pm - Peru
3:05 pm - Argentina, Brazil and Chile
NEW YORK STOCK EXCHANGE, NOVEMBER 19, 2018
3:10 pm Coffee Break
3:20 pm Growing Assests
3:30 pm Financial Performance
3:40 pm 2019 Work Program
3:50 pm Shareholder Value Creation
4:00 pm End of Investor Day and Cocktail
4
VALUE PROPOSITION
5
VAL U E PR O PO SI T I O N
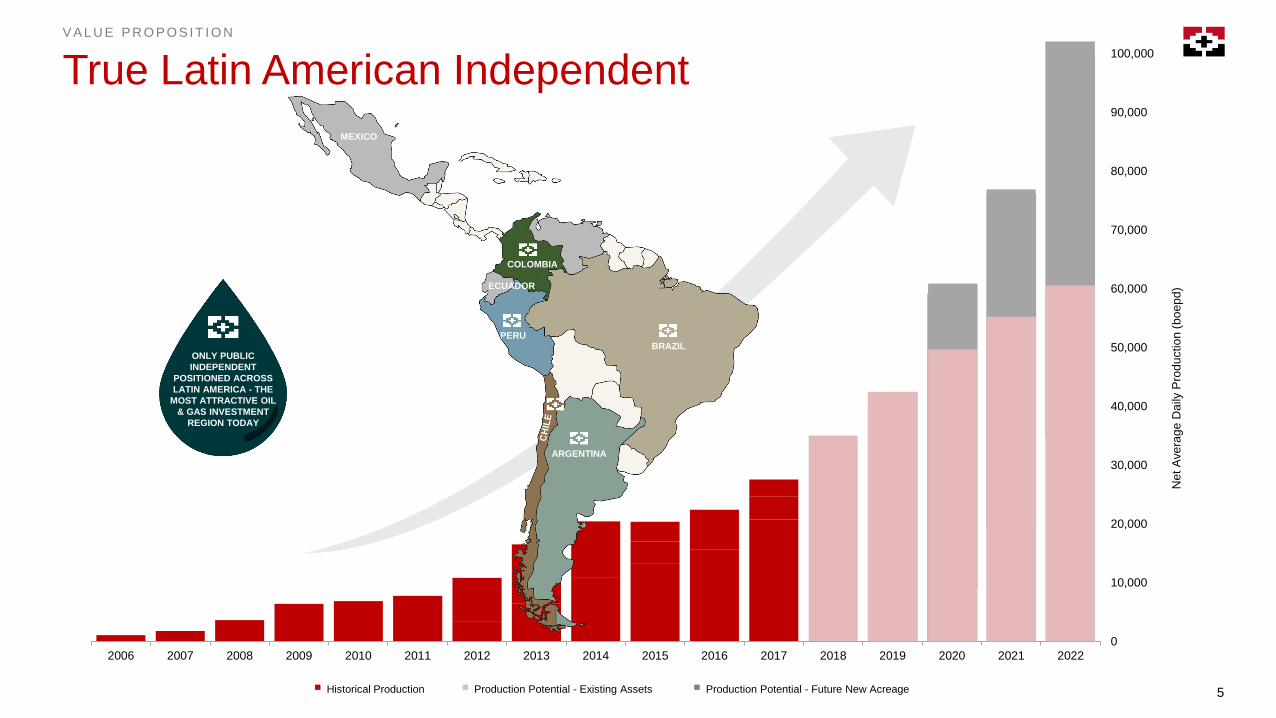
True Latin American Independent
0
10,000
20,000
30,000
40,000
50,000
60,000
70,000
80,000
90,000
100,000
2006 2007 2008 2009 2010 2011 2012 2013 2014 2015 2016 2017 2018 2019 2020 2021 2022
Historical Production Production Potential - Existing Assets Production Potential - Future New Acreage
ONLY PUBLIC
INDEPENDENT
POSITIONED ACROSS
LATIN AMERICA - THE
MOST ATTRACTIVE OIL
& GAS INVESTMENT
REGION TODAY
ARGENTINA
BRAZILPERU
COLOMBIA
MEXICO
ECUADOR
Net A
ve
rag
e D
aily
Pro
du
ctio
n (
bo
ep
d)
6
COUNTRIES HYDROCARBON BASINS BLOCKS EXPLORATION RESOURCES ACRES
VAL U E PR O PO SI T I O N
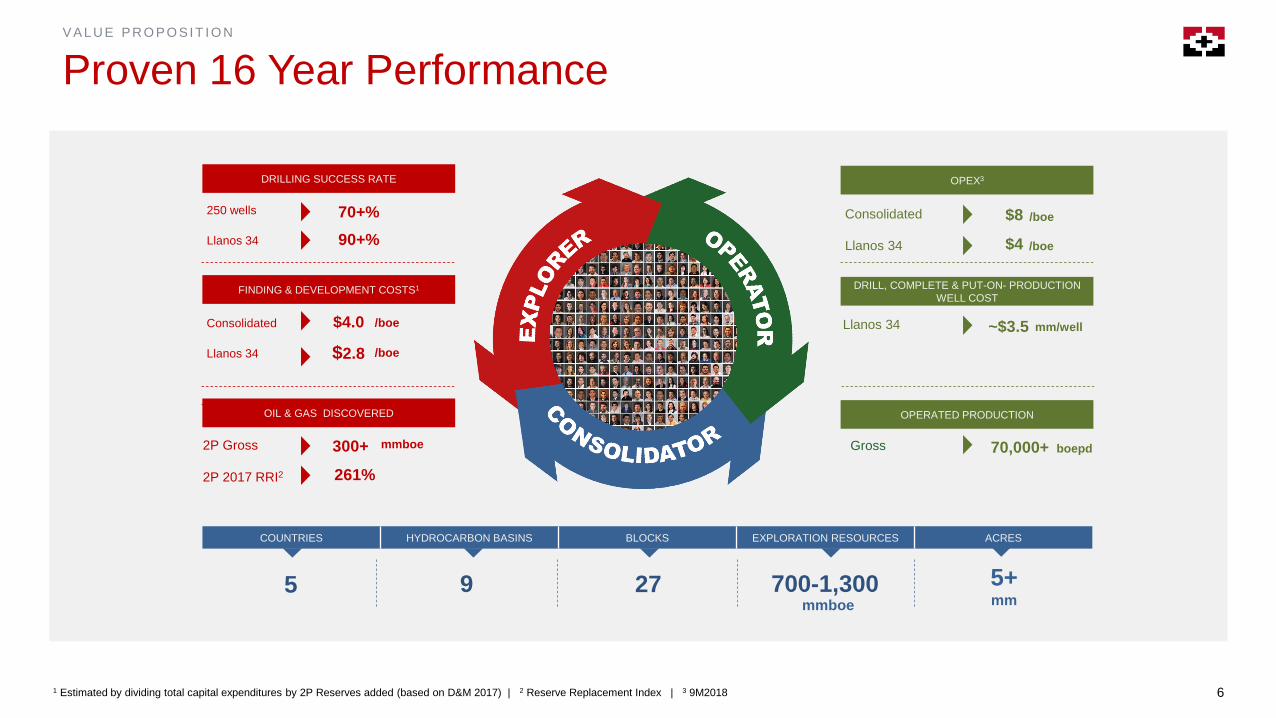
Proven 16 Year Performance
1 Estimated by dividing total capital expenditures by 2P Reserves added (based on D&M 2017) | 2 Reserve Replacement Index | 3 9M2018
250 wells
Llanos 34
70+%
90+%
Consolidated
Llanos 34
/boe
$2.8 /boe
2P Gross
2P 2017 RRI2 261%
$4.0
300+ mmboe
9 27 5+mm
Llanos 34
Consolidated
Llanos 34
Gross
$8 /boe
$4 /boe
~$3.5 mm/well
70,000+ boepd
DRILLING SUCCESS RATE
700-1,300mmboe
5
FINDING & DEVELOPMENT COSTS1
OIL & GAS DISCOVERED
OPEX3
DRILL, COMPLETE & PUT-ON- PRODUCTION
WELL COST
OPERATED PRODUCTION
7
VAL U E PR O PO SI T I O N
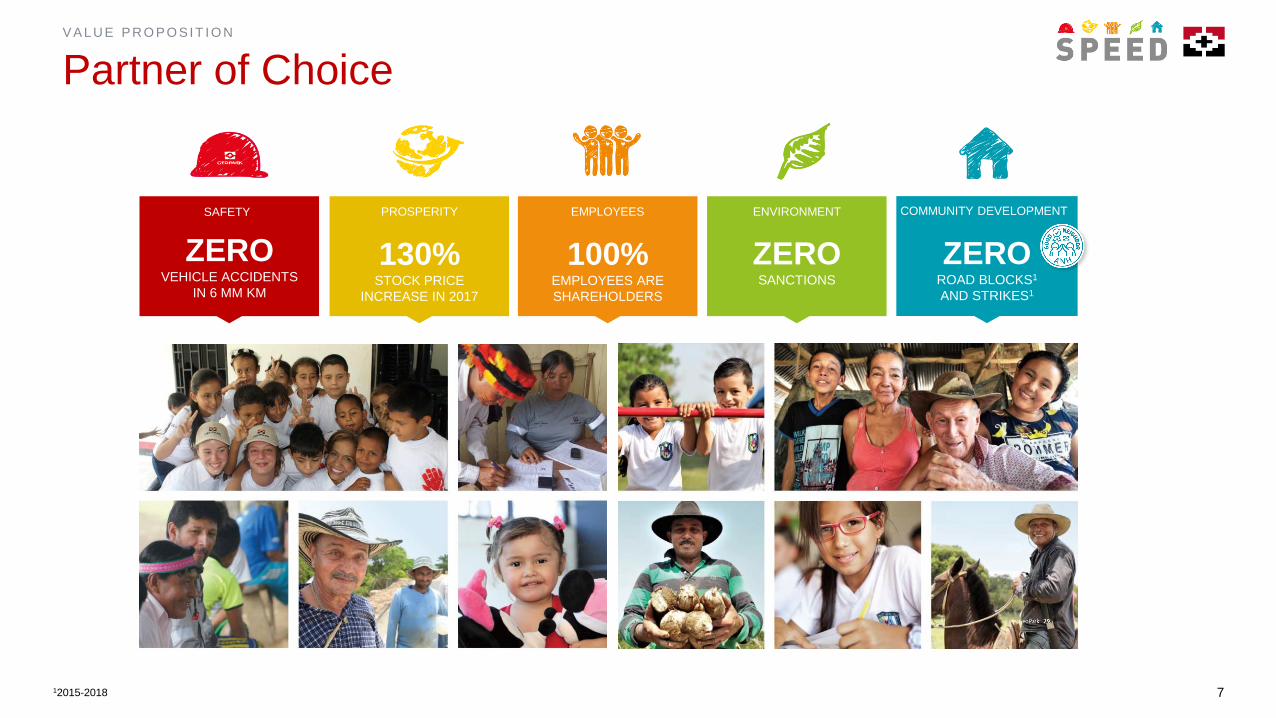
Partner of Choice
12015-2018
SAFETY
ZEROVEHICLE ACCIDENTS
IN 6 MM KM
130%STOCK PRICE
INCREASE IN 2017
PROSPERITY
100%EMPLOYEES ARE
SHAREHOLDERS
EMPLOYEES
ZEROSANCTIONS
ENVIRONMENT
ZEROROAD BLOCKS1
AND STRIKES1
COMMUNITY DEVELOPMENT
8
ASSET PLATFORM
9
ASSET PL AT F O R M
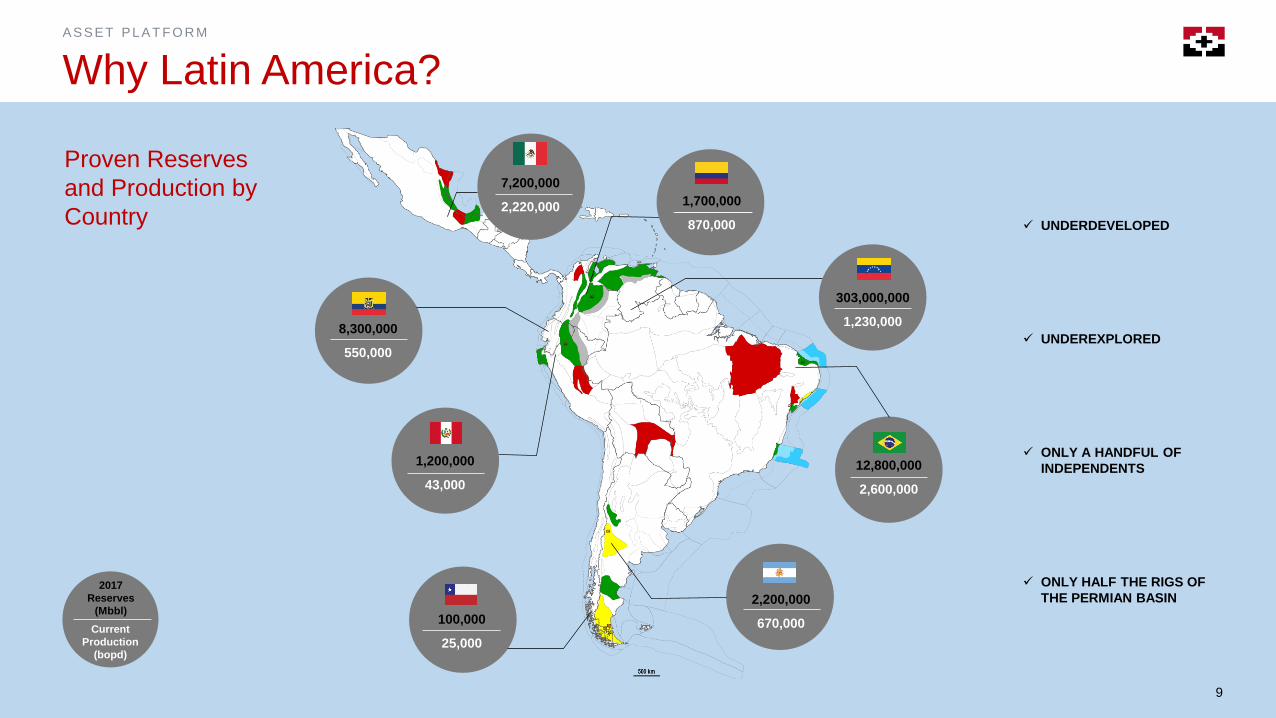
Why Latin America?
Proven Reserves
and Production by
Country
✓ UNDEREXPLORED
✓ ONLY A HANDFUL OF
INDEPENDENTS
✓ UNDERDEVELOPED
✓ ONLY HALF THE RIGS OF
THE PERMIAN BASIN2017
Reserves
(Mbbl)
Current
Production
(bopd)
12,800,000
2,600,000
7,200,000
2,220,000
8,300,000
550,000
2,200,000
670,000100,000
25,000
303,000,000
1,230,000
1,700,000
870,000
1,200,000
43,000
9
10
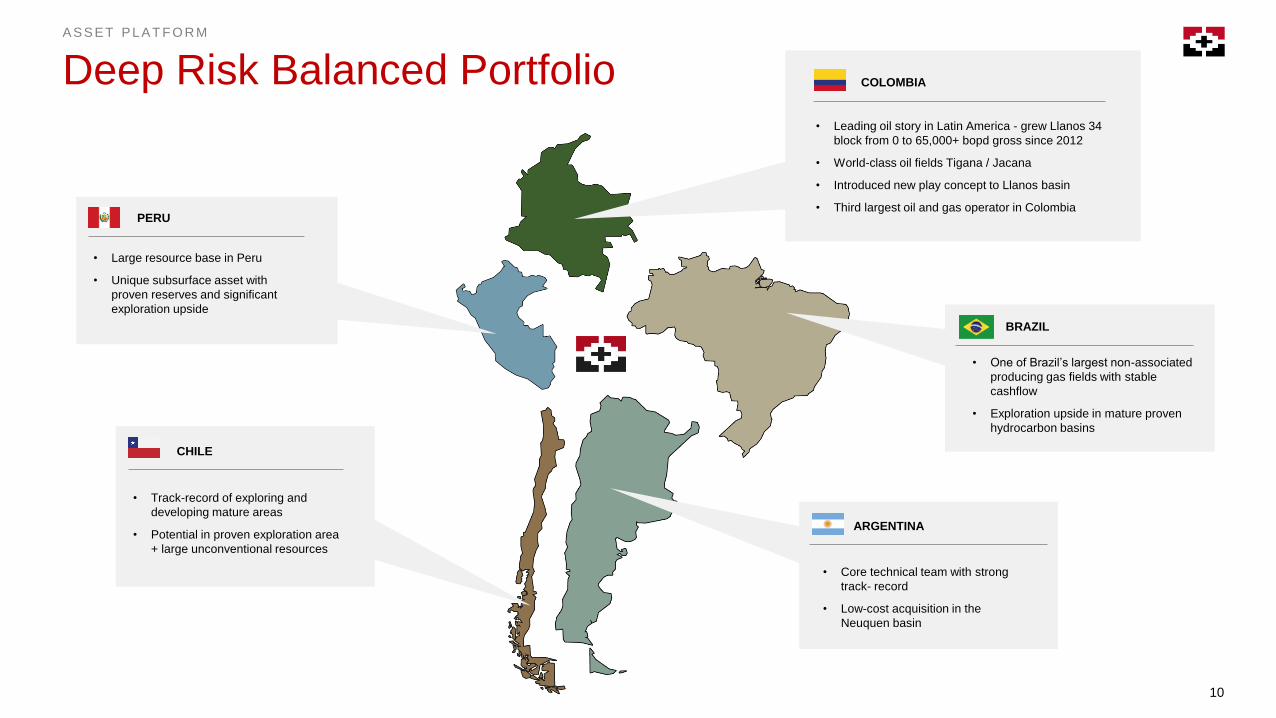
ASSET PL AT F O R M
Deep Risk Balanced Portfolio• Leading oil story in Latin America - grew Llanos 34
block from 0 to 65,000+ bopd gross since 2012
• World-class oil fields Tigana / Jacana
• Introduced new play concept to Llanos basin
• Third largest oil and gas operator in Colombia
COLOMBIA
• One of Brazil’s largest non-associated
producing gas fields with stable
cashflow
• Exploration upside in mature proven
hydrocarbon basins
BRAZIL
• Core technical team with strong
track- record
• Low-cost acquisition in the
Neuquen basin
ARGENTINA
• Large resource base in Peru
• Unique subsurface asset with
proven reserves and significant
exploration upside
PERU
• Track-record of exploring and
developing mature areas
• Potential in proven exploration area
+ large unconventional resources
CHILE
11
COLOMBIA
ASSET PL AT F O R M
12
ASSET PL AT F O R M – C O L O M BI A
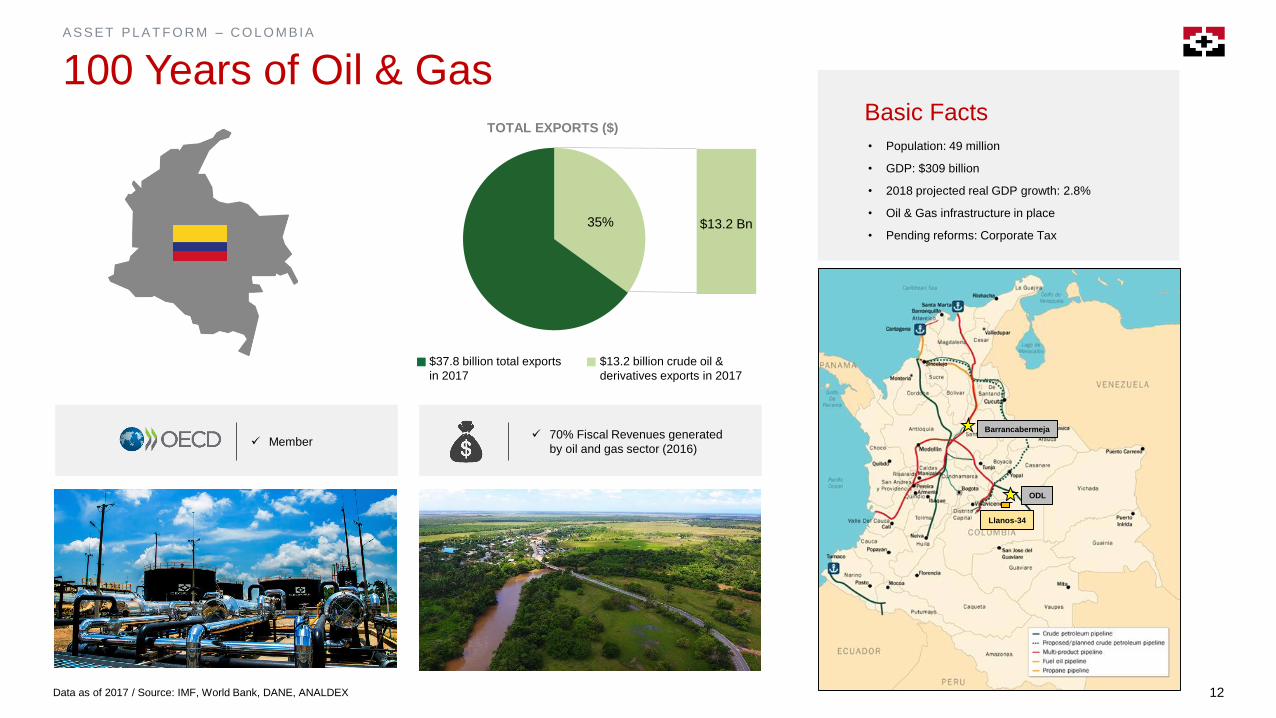
100 Years of Oil & Gas
Data as of 2017 / Source: IMF, World Bank, DANE, ANALDEX
• Population: 49 million
• GDP: $309 billion
• 2018 projected real GDP growth: 2.8%
• Oil & Gas infrastructure in place
• Pending reforms: Corporate Tax
Barrancabermeja
ODL
Llanos-34
Basic Facts
$37.8 billion total exports
in 2017
$13.2 billion crude oil &
derivatives exports in 2017
✓ Member✓ 70% Fiscal Revenues generated
by oil and gas sector (2016)
TOTAL EXPORTS ($)
35% $13.2 Bn
13
ASSET PL AT F O R M – C O L O M BI A
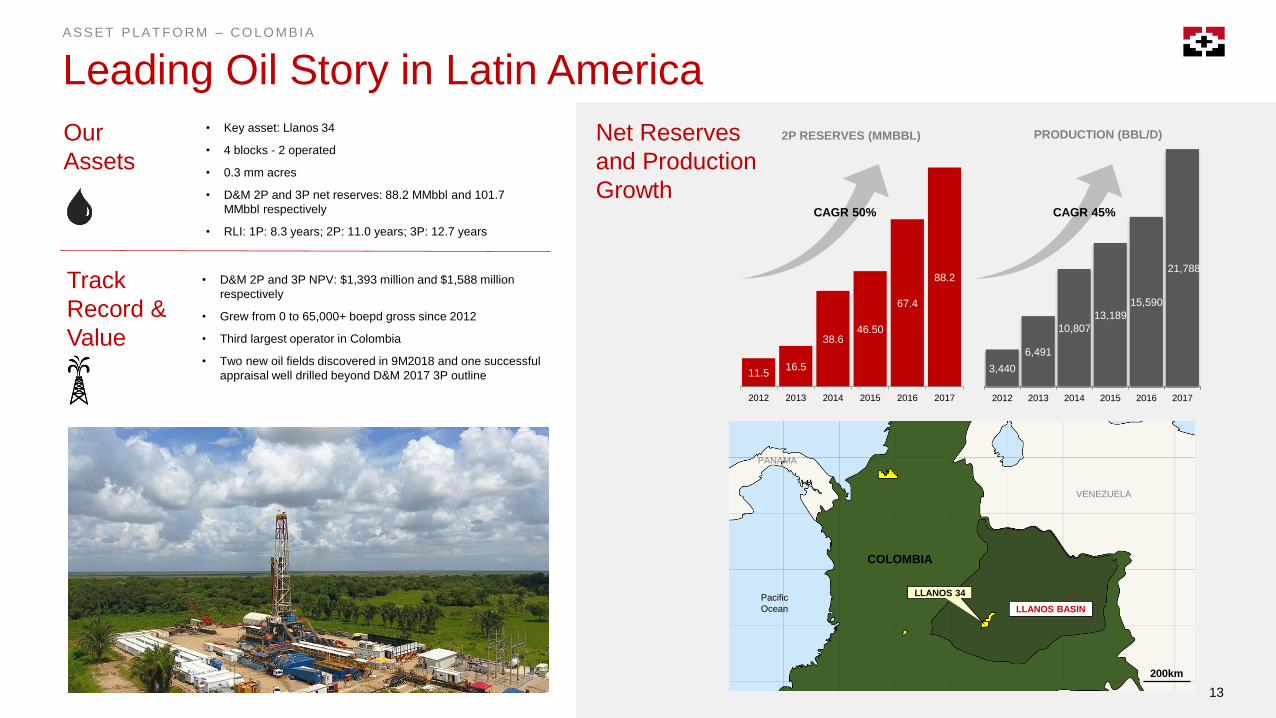
Leading Oil Story in Latin America
11.516.5
38.646.50
67.4
88.2
2012 2013 2014 2015 2016 2017
3,440
6,491
10,807
13,189
15,590
21,788
2012 2013 2014 2015 2016 2017
• Key asset: Llanos 34
• 4 blocks - 2 operated
• 0.3 mm acres
• D&M 2P and 3P net reserves: 88.2 MMbbl and 101.7
MMbbl respectively
• RLI: 1P: 8.3 years; 2P: 11.0 years; 3P: 12.7 years
Net Reserves
and Production
Growth
2P RESERVES (MMBBL) PRODUCTION (BBL/D)
CAGR 45%CAGR 50%
Pacific
Ocean
PANAMA
VENEZUELA
COLOMBIA
200km
LLANOS BASIN
LLANOS 34
Our
Assets
Track
Record &
Value
• D&M 2P and 3P NPV: $1,393 million and $1,588 million
respectively
• Grew from 0 to 65,000+ boepd gross since 2012
• Third largest operator in Colombia
• Two new oil fields discovered in 9M2018 and one successful
appraisal well drilled beyond D&M 2017 3P outline
13
14
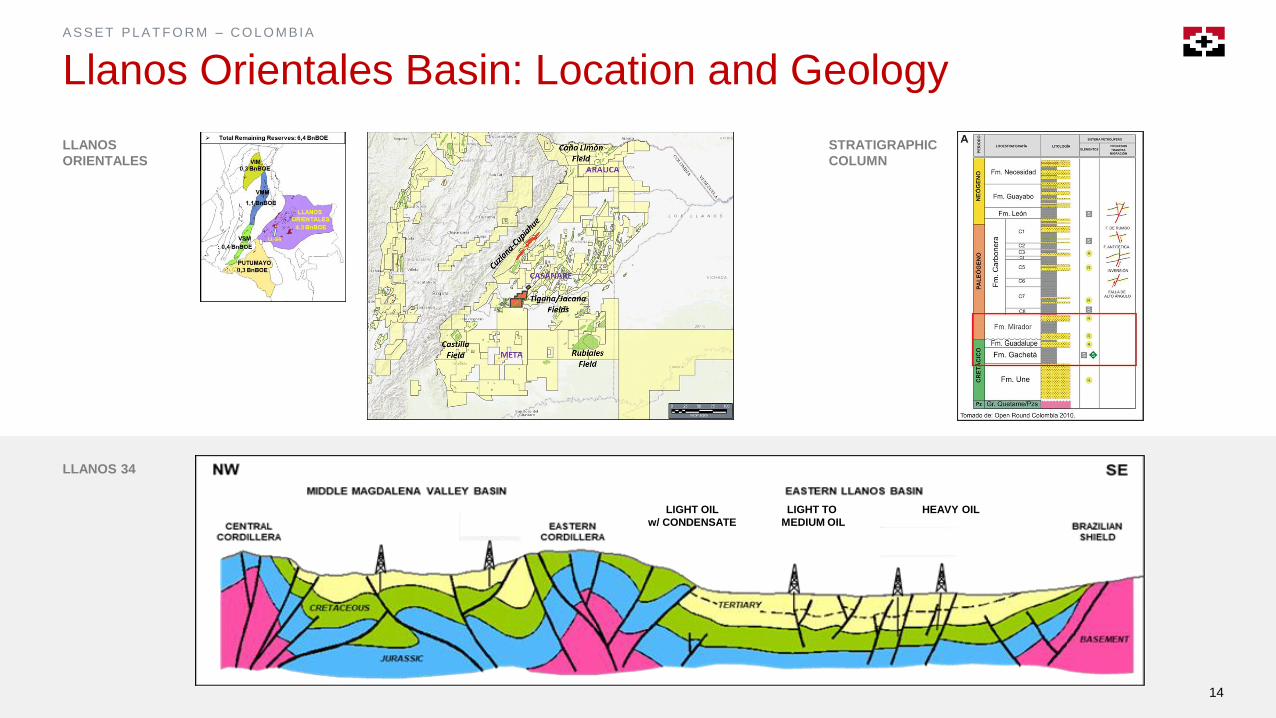
ASSET PL AT F O R M – C O L O M BI A
Llanos Orientales Basin: Location and Geology
LLANOS
ORIENTALES
STRATIGRAPHIC
COLUMN
LLANOS 34
MORONA BLOCK
LIGHT OIL
w/ CONDENSATE
LIGHT TO
MEDIUM OIL
HEAVY OIL
14
15
ASSET PL AT F O R M – C O L O M BI A
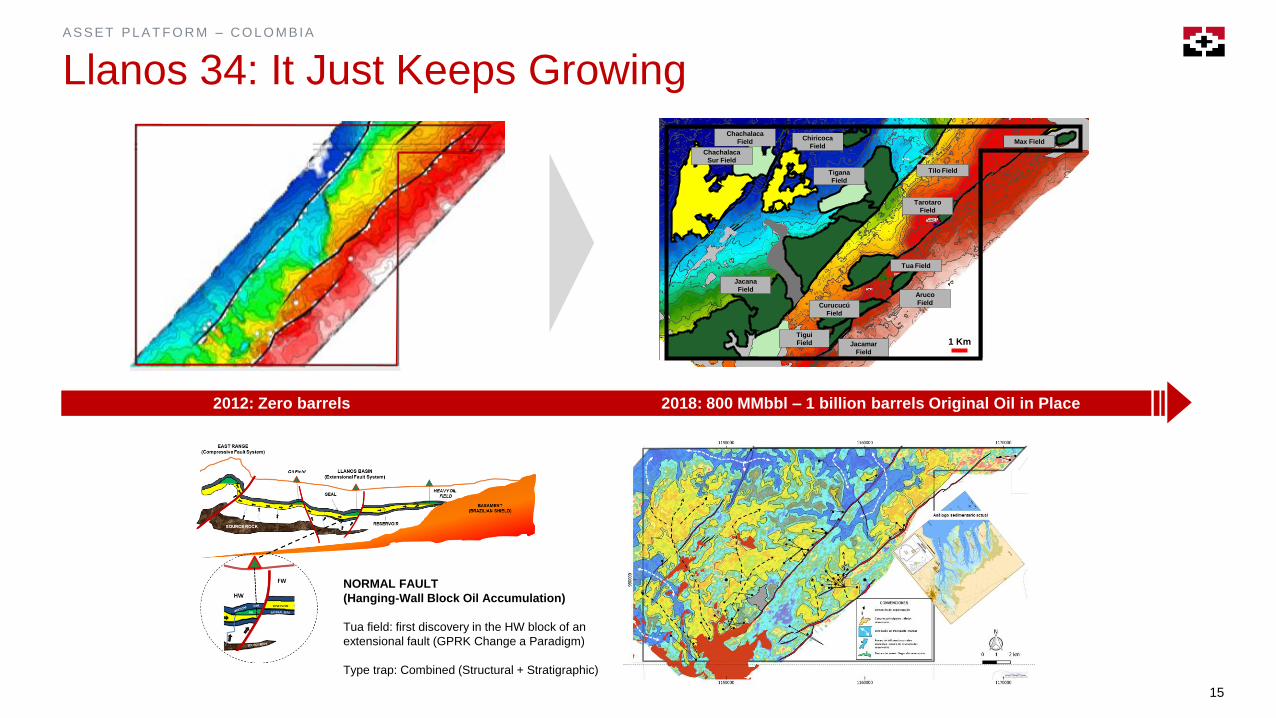
Llanos 34: It Just Keeps Growing
NORMAL FAULT
(Hanging-Wall Block Oil Accumulation)
Tua field: first discovery in the HW block of an
extensional fault (GPRK Change a Paradigm)
Type trap: Combined (Structural + Stratigraphic)
2012: Zero barrels 2018: 800 MMbbl – 1 billion barrels Original Oil in Place
Jacana
Field
Tilo Field
Chachalaca
Field Chiricoca
Field
Jacamar
Field
Curucucú
Field
Aruco
Field
Tarotaro
Field
Tua Field
Tigana
Field
1 KmTigui
Field
Chachalaca
Sur Field
Max Field
16
ASSET PL AT F O R M – C O L O M BI A
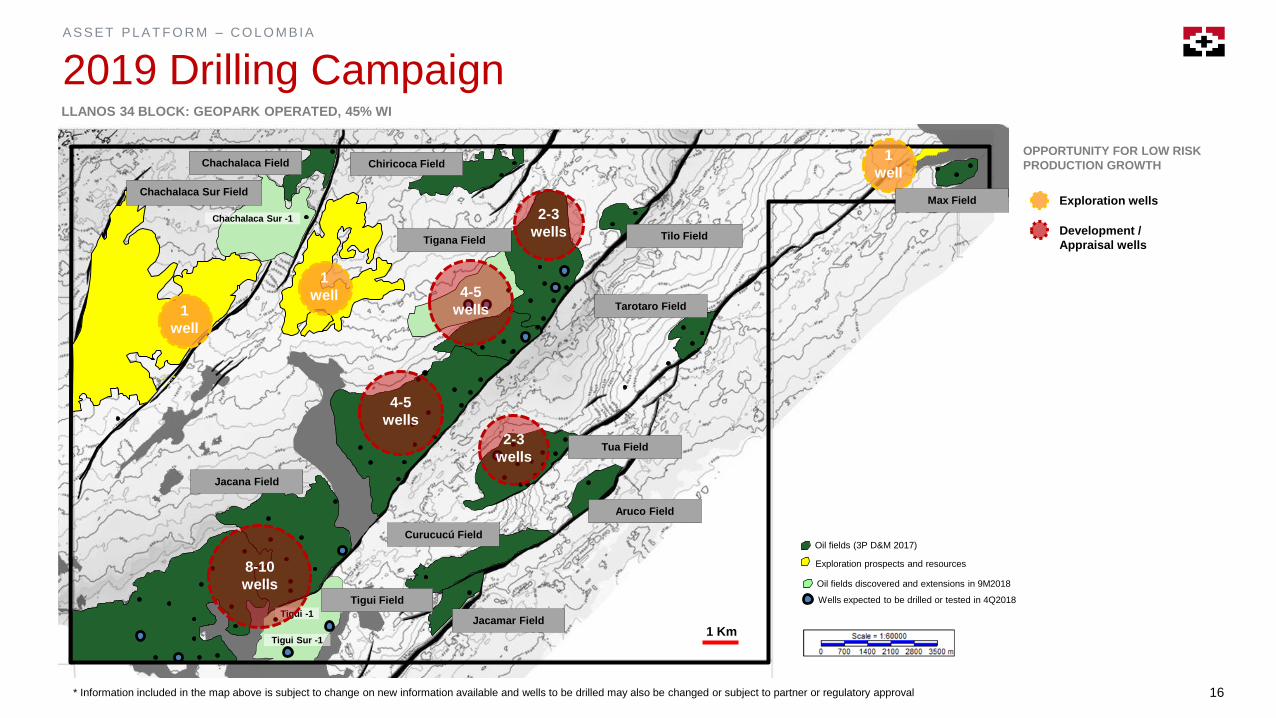
2019 Drilling Campaign
* Information included in the map above is subject to change on new information available and wells to be drilled may also be changed or subject to partner or regulatory approval
LLANOS 34 BLOCK: GEOPARK OPERATED, 45% WI
Jacana Field
Tilo Field
Chachalaca Field Chiricoca Field
Jacamar Field
Curucucú Field
Aruco Field
Tarotaro Field
Tua Field
Chachalaca Sur -1
Tigui -1
Tigui Sur -1
Tigana Field
1 Km
Tigui Field
2-3
wells
4-5
wells
4-5
wells
8-10
wells
2-3
wells
1
well
1
well
OPPORTUNITY FOR LOW RISK
PRODUCTION GROWTH
Development /
Appraisal wells
Exploration wells
1
well
Chachalaca Sur FieldMax Field
Oil fields (3P D&M 2017)
Exploration prospects and resources
Wells expected to be drilled or tested in 4Q2018
Oil fields discovered and extensions in 9M2018
17
ASSET PL AT F O R M – C O L O M BI A
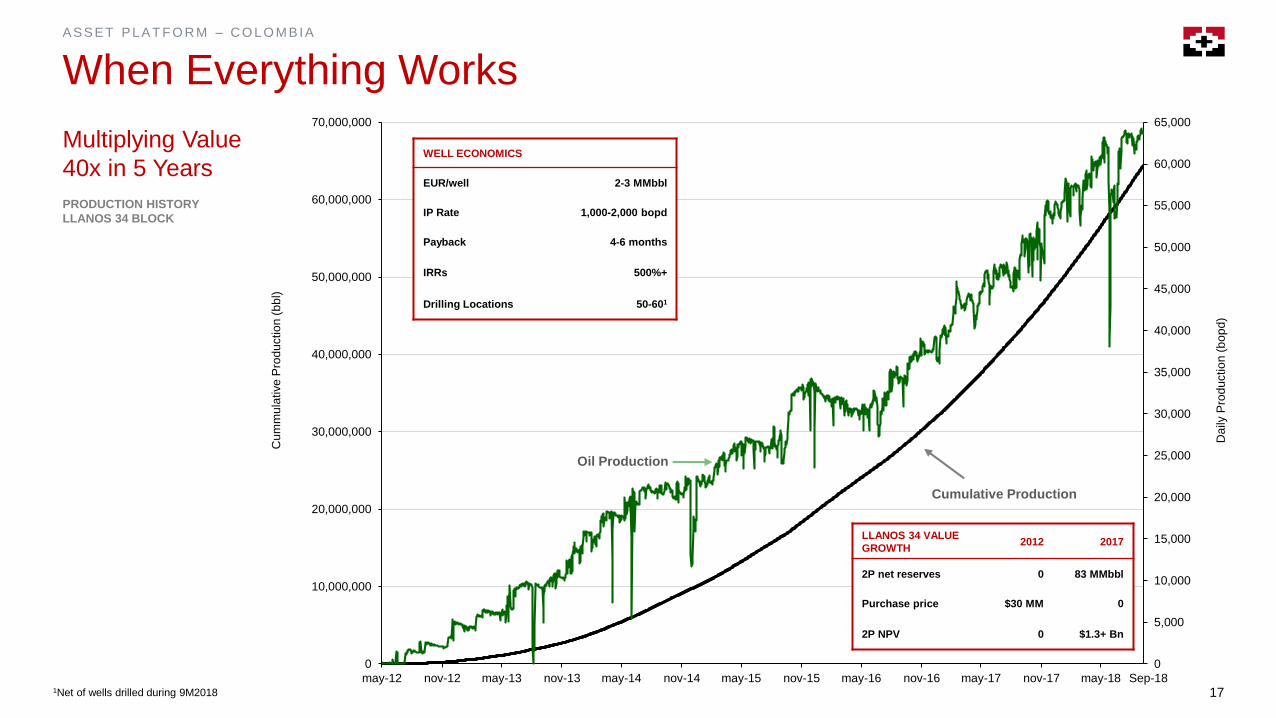
When Everything Works
1Net of wells drilled during 9M2018
PRODUCTION HISTORY
LLANOS 34 BLOCK
Multiplying Value
40x in 5 Years
0
5,000
10,000
15,000
20,000
25,000
30,000
35,000
40,000
45,000
50,000
55,000
60,000
65,000
0
10,000,000
20,000,000
30,000,000
40,000,000
50,000,000
60,000,000
70,000,000
may-12 nov-12 may-13 nov-13 may-14 nov-14 may-15 nov-15 may-16 nov-16 may-17 nov-17 may-18
Daily
Pro
du
ctio
n(b
op
d)
Cum
mu
lative
Pro
du
ctio
n (
bb
l)
LLANOS 34 VALUE
GROWTH2012 2017
2P net reserves 0 83 MMbbl
Purchase price $30 MM 0
2P NPV 0 $1.3+ Bn
Oil Production
Cumulative Production
WELL ECONOMICS
EUR/well 2-3 MMbbl
IP Rate 1,000-2,000 bopd
Payback 4-6 months
IRRs 500%+
Drilling Locations 50-601
Sep-18
18
ASSET PL AT F O R M – C O L O M BI A
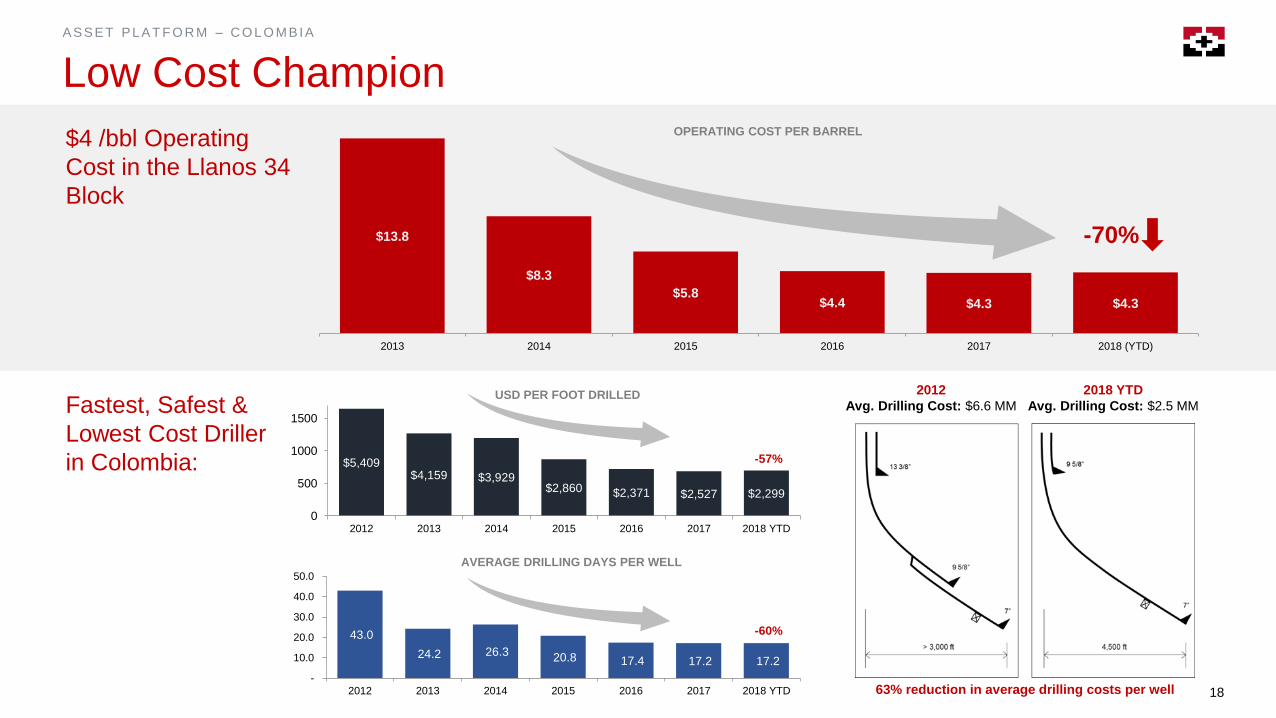
Low Cost Champion
$4 /bbl Operating
Cost in the Llanos 34
Block
Fastest, Safest &
Lowest Cost Driller
in Colombia:
2012
Avg. Drilling Cost: $6.6 MM
2018 YTD
Avg. Drilling Cost: $2.5 MM
$13.8
$8.3
$5.8$4.4 $4.3 $4.3
2013 2014 2015 2016 2017 2018 (YTD)
-70%
$5,409$4,159 $3,929
$2,860 $2,371 $2,527 $2,299
0
500
1000
1500
2012 2013 2014 2015 2016 2017 2018 YTD
43.0
24.2 26.3 20.8 17.4 17.2 17.2
-
10.0
20.0
30.0
40.0
50.0
2012 2013 2014 2015 2016 2017 2018 YTD 63% reduction in average drilling costs per well
USD PER FOOT DRILLED
AVERAGE DRILLING DAYS PER WELL
-57%
-60%
OPERATING COST PER BARREL
19
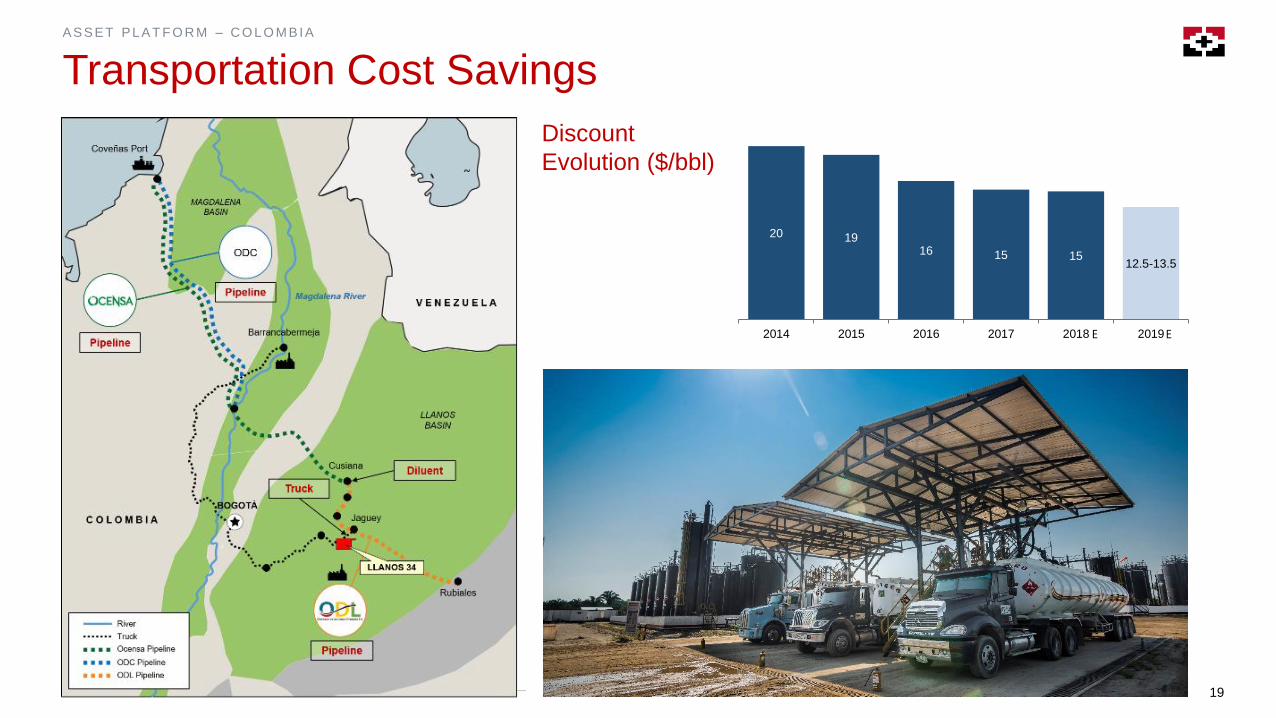
ASSET PL AT F O R M – C O L O M BI A
Transportation Cost Savings
Discount
Evolution ($/bbl)
20 1916 15 15
12.5-13.5
2014 2015 2016 2017 2018 2019EE
20
PERU
ASSET PL AT F O R M
21
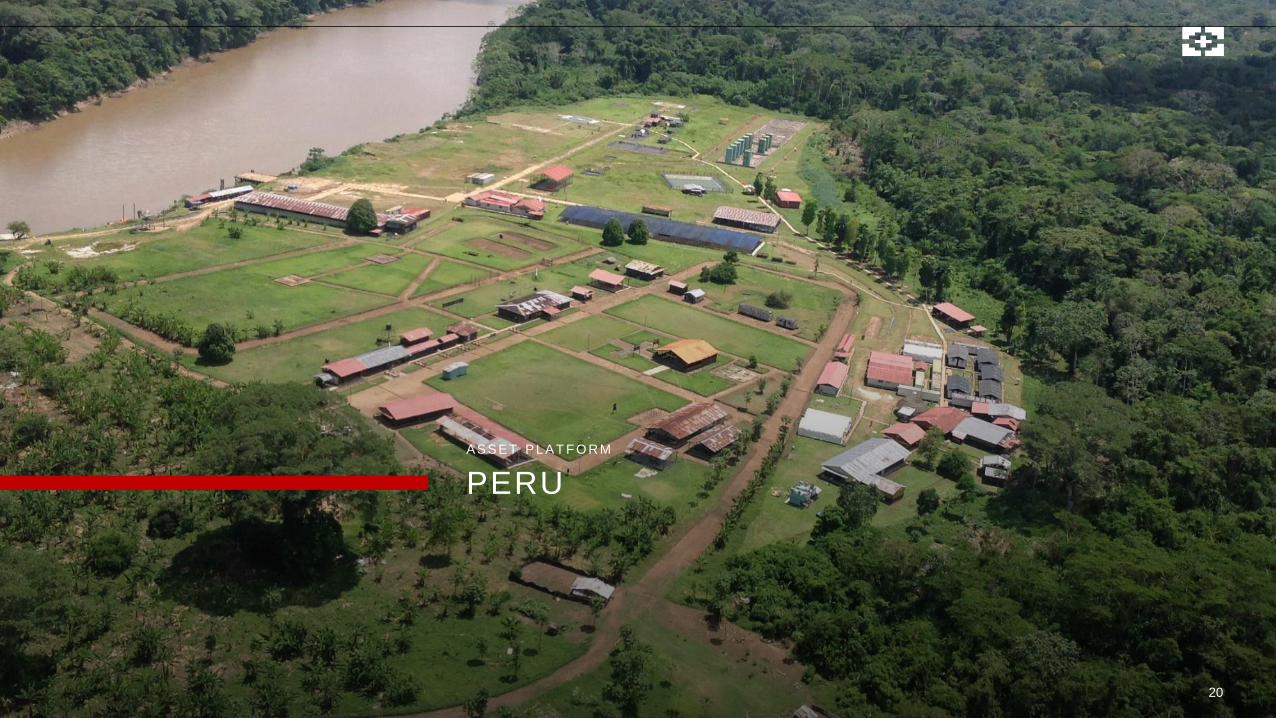
ASSET PL AT F O R M – PER U
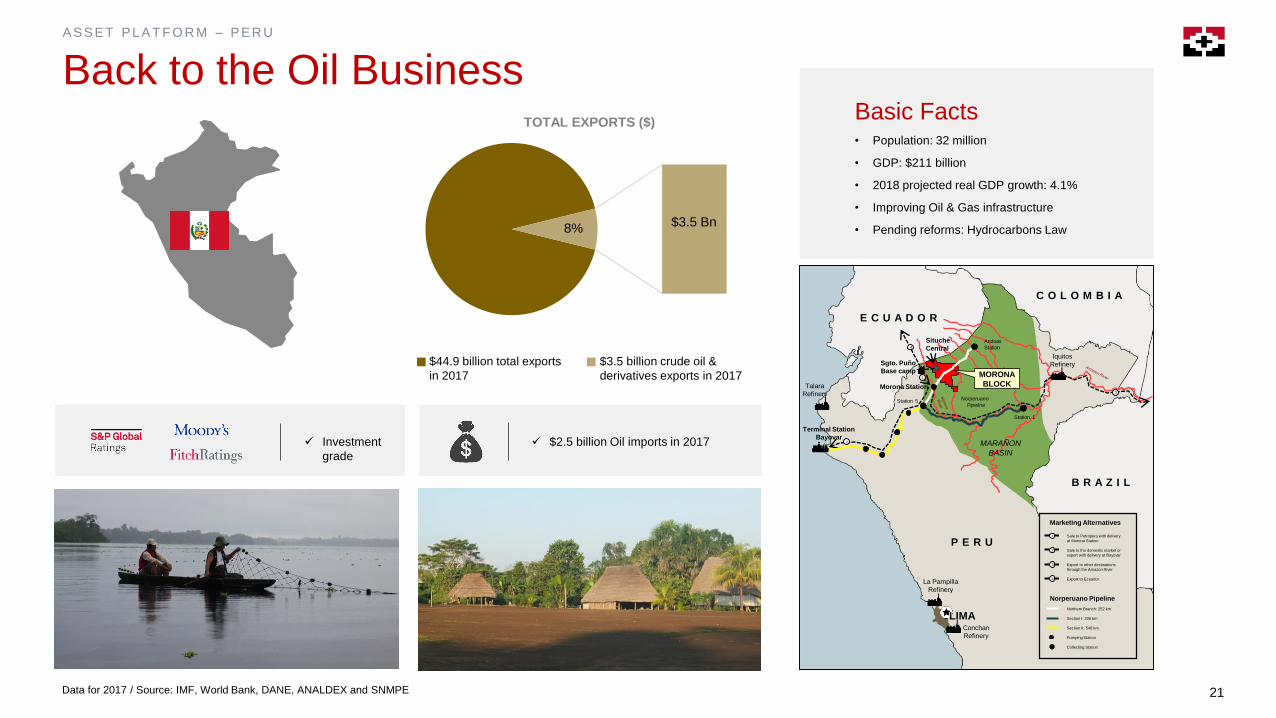
Back to the Oil Business
Data for 2017 / Source: IMF, World Bank, DANE, ANALDEX and SNMPE
Basic Facts• Population: 32 million
• GDP: $211 billion
• 2018 projected real GDP growth: 4.1%
• Improving Oil & Gas infrastructure
• Pending reforms: Hydrocarbons Law
P E R U
LIMA
E C U A D O R
B R A Z I L
C O L O M B I A
Terminal Station
Bayovar
Talara
Refinery
Iquitos
Refinery
MARAÑON
BASIN
Station 1
Andoas
Station
3
Norperuano
Pipeline
Sgto. Puño
Base camp
Station 5
4
2
Morona Station
MORONA
BLOCK1
La Pampilla
Refinery
Conchan
Refinery
Northern Branch: 252 km
Section I: 306 km
Section II: 548 km
Pumping Station
Collecting Station
Norperuano Pipeline
Marketing Alternatives
1
2
3
4
Sale to Petroperu with delivery
at Morona Station
Sale to the domestic market or
export with delivery at Bayovar
Export to other destinations
through the Amazon River
Export to Ecuador
Situche
Central
$3.5 Bn8%
TOTAL EXPORTS ($)
$44.9 billion total exports
in 2017
$3.5 billion crude oil &
derivatives exports in 2017
✓ Investment Grade
Economy✓ Investment
grade
✓ $2.5 billion Oil imports in 2017
22
ASSET PL AT F O R M – PER U
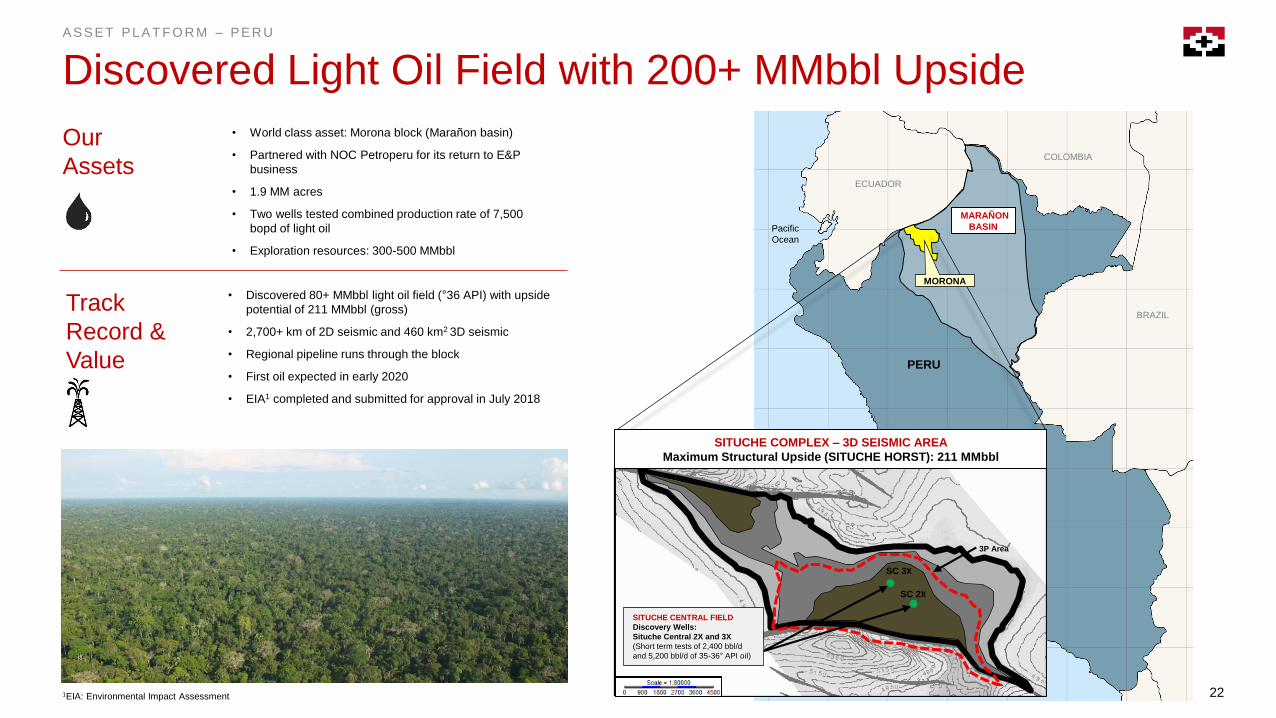
Discovered Light Oil Field with 200+ MMbbl Upside
• World class asset: Morona block (Marañon basin)
• Partnered with NOC Petroperu for its return to E&P
business
• 1.9 MM acres
• Two wells tested combined production rate of 7,500
bopd of light oil
• Exploration resources: 300-500 MMbbl
Our
Assets
Track
Record &
Value
• Discovered 80+ MMbbl light oil field (°36 API) with upside
potential of 211 MMbbl (gross)
• 2,700+ km of 2D seismic and 460 km2 3D seismic
• Regional pipeline runs through the block
• First oil expected in early 2020
• EIA1 completed and submitted for approval in July 2018
Pacific
Ocean
BRAZIL
COLOMBIA
ECUADOR
PERU
MARAÑON
BASIN
MORONA
SITUCHE CENTRAL FIELD
Discovery Wells:
Situche Central 2X and 3X
(Short term tests of 2,400 bbl/d
and 5,200 bbl/d of 35-36° API oil)
3P Area
SC 2X
SC 3X
SITUCHE COMPLEX – 3D SEISMIC AREA
Maximum Structural Upside (SITUCHE HORST): 211 MMbbl
1EIA: Environmental Impact Assessment
23
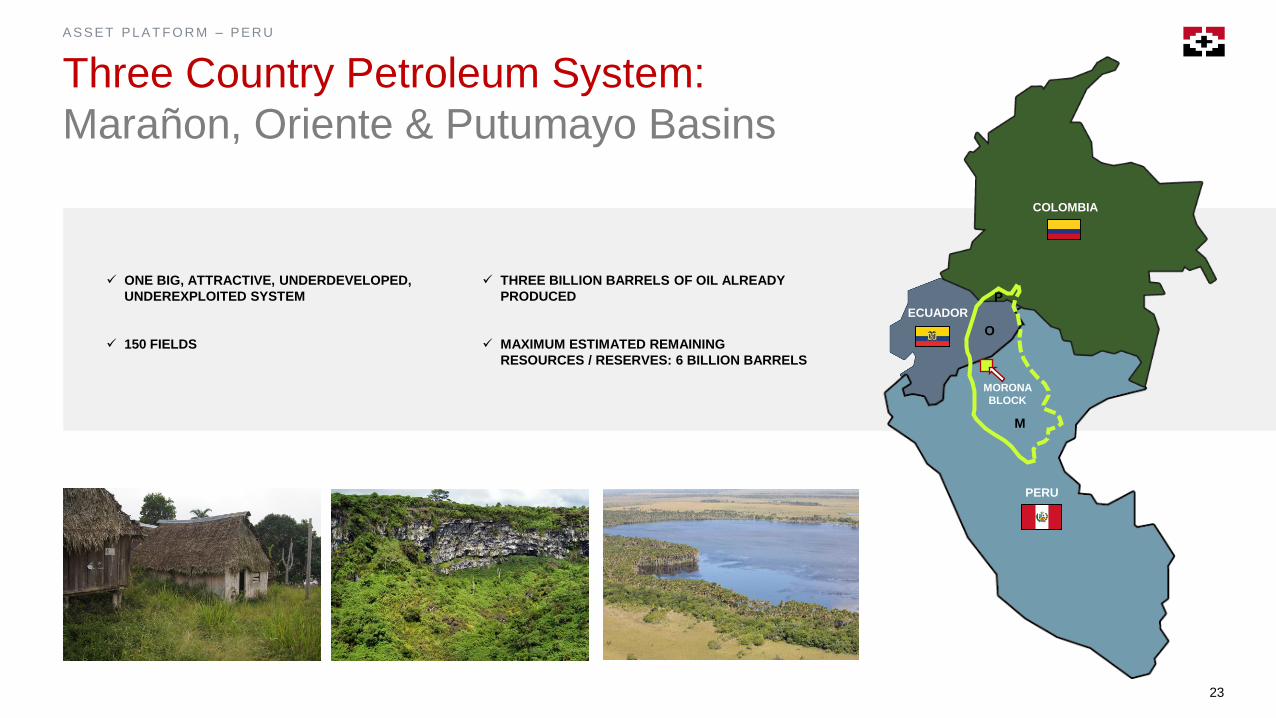
ASSET PL AT F O R M – PER U
Three Country Petroleum System:
Marañon, Oriente & Putumayo Basins
✓ ONE BIG, ATTRACTIVE, UNDERDEVELOPED,
UNDEREXPLOITED SYSTEM
✓ 150 FIELDS
✓ THREE BILLION BARRELS OF OIL ALREADY
PRODUCED
✓ MAXIMUM ESTIMATED REMAINING
RESOURCES / RESERVES: 6 BILLION BARRELS
M
O
PECUADOR
COLOMBIA
PERU
MORONA
BLOCK
24
ASSET PL AT F O R M – PER U
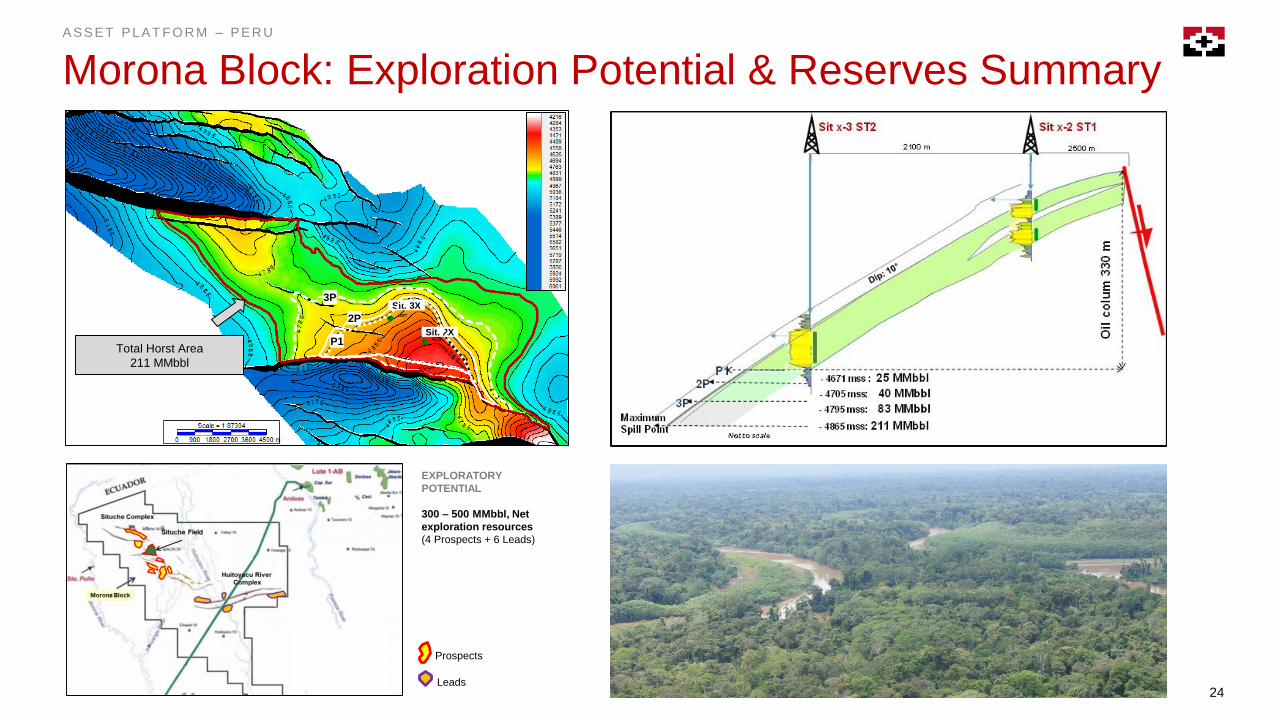
Morona Block: Exploration Potential & Reserves Summary
Prospects
Leads
EXPLORATORY
POTENTIAL
300 – 500 MMbbl, Net
exploration resources
(4 Prospects + 6 Leads)
Sit. 2X
Sit. 3X
2P
3P
Total Horst Area
211 MMbbl
P1
25
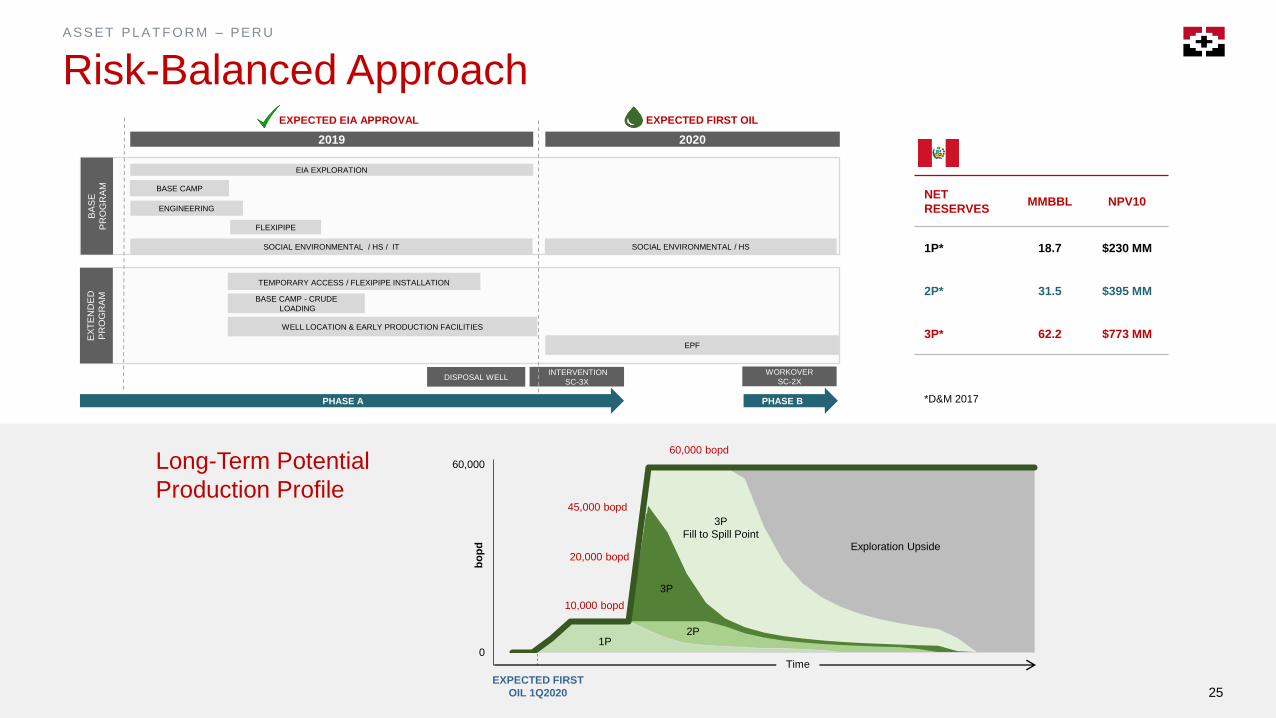
ASSET PL AT F O R M – PER U
Risk-Balanced Approach
NET
RESERVESMMBBL NPV10
1P* 18.7 $230 MM
2P* 31.5 $395 MM
3P* 62.2 $773 MM
2020
EIA EXPLORATION
BASE CAMP - CRUDE
LOADING
TEMPORARY ACCESS / FLEXIPIPE INSTALLATION
WELL LOCATION & EARLY PRODUCTION FACILITIES
INTERVENTION
SC-3X
EX
TE
ND
ED
PR
OG
RA
M
EXPECTED FIRST OIL
FLEXIPIPE
EXPECTED EIA APPROVAL
SOCIAL ENVIRONMENTAL / HS / IT
DISPOSAL WELL
EPF
ENGINEERING
WORKOVER
SC-2X
SOCIAL ENVIRONMENTAL / HS
2019
BASE CAMP
BA
SE
PR
OG
RA
M
PHASE BPHASE A
1P2P
3P
3P
Fill to Spill PointExploration Upside
EXPECTED FIRST
OIL 1Q2020
10,000 bopd
20,000 bopd
45,000 bopd
60,000 bopd
Long-Term Potential
Production Profile
25
Time
*D&M 2017
60,000
0
bo
pd
26
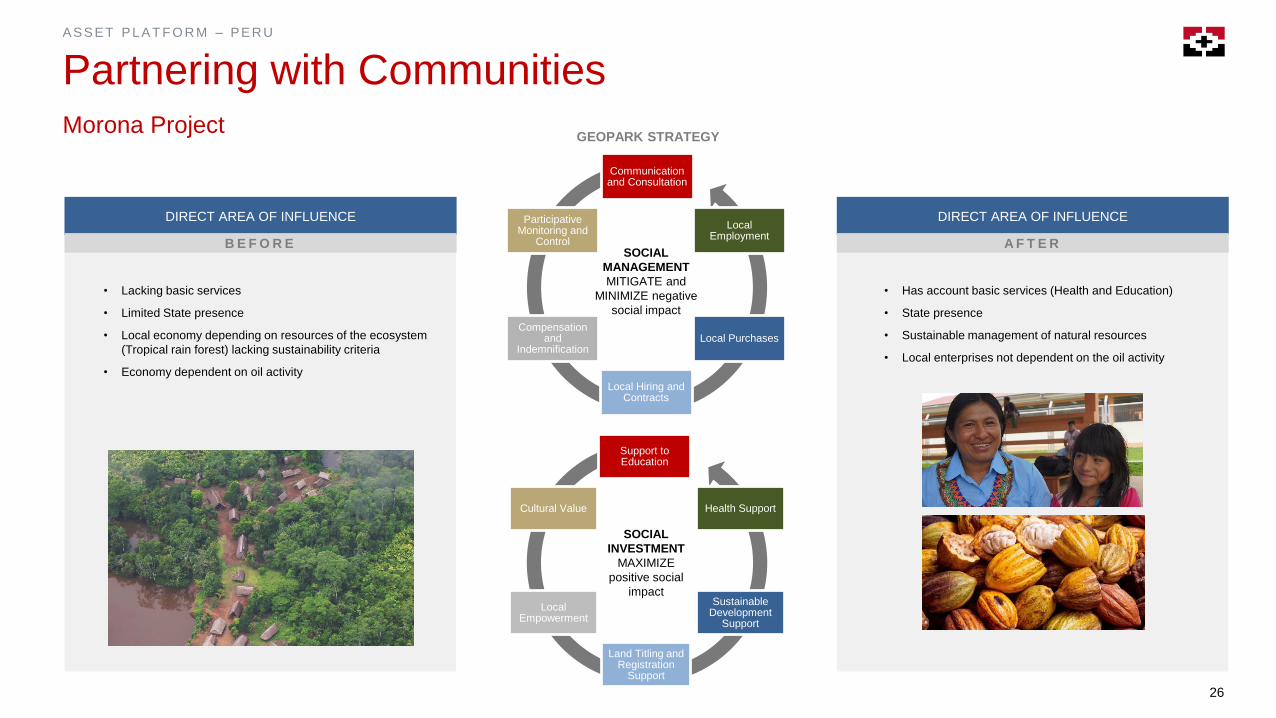
ASSET PL AT F O R M – PER U
Partnering with Communities
Support to Education
Health Support
Sustainable Development
Support
Land Titling and Registration
Support
Local Empowerment
Cultural Value
Communication and Consultation
Local Employment
Local Purchases
Local Hiring and Contracts
Compensation and
Indemnification
Participative Monitoring and
ControlSOCIAL
MANAGEMENT
MITIGATE and
MINIMIZE negative
social impact
SOCIAL
INVESTMENT
MAXIMIZE
positive social
impact
DIRECT AREA OF INFLUENCE
A F T E R
DIRECT AREA OF INFLUENCE
B E F O R E
GEOPARK STRATEGY
• Lacking basic services
• Limited State presence
• Local economy depending on resources of the ecosystem
(Tropical rain forest) lacking sustainability criteria
• Economy dependent on oil activity
• Has account basic services (Health and Education)
• State presence
• Sustainable management of natural resources
• Local enterprises not dependent on the oil activity
Morona Project
27
ARGENTINA, BRAZIL AND CHILE
28
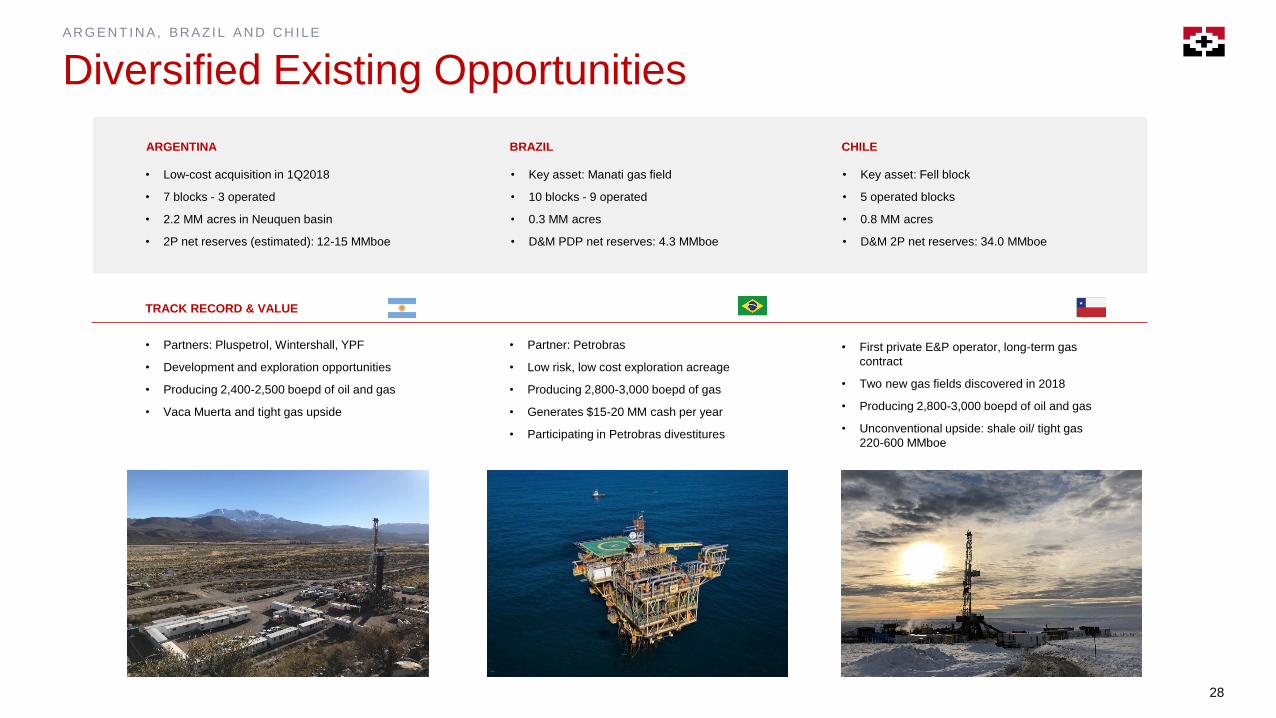
AR G EN T I N A , BR AZ I L AN D C H I L E
Diversified Existing Opportunities
ARGENTINA BRAZIL
• Low-cost acquisition in 1Q2018
• 7 blocks - 3 operated
• 2.2 MM acres in Neuquen basin
• 2P net reserves (estimated): 12-15 MMboe
CHILE
• Key asset: Fell block
• 5 operated blocks
• 0.8 MM acres
• D&M 2P net reserves: 34.0 MMboe
• Key asset: Manati gas field
• 10 blocks - 9 operated
• 0.3 MM acres
• D&M PDP net reserves: 4.3 MMboe
• Partners: Pluspetrol, Wintershall, YPF
• Development and exploration opportunities
• Producing 2,400-2,500 boepd of oil and gas
• Vaca Muerta and tight gas upside
• First private E&P operator, long-term gas
contract
• Two new gas fields discovered in 2018
• Producing 2,800-3,000 boepd of oil and gas
• Unconventional upside: shale oil/ tight gas
220-600 MMboe
• Partner: Petrobras
• Low risk, low cost exploration acreage
• Producing 2,800-3,000 boepd of gas
• Generates $15-20 MM cash per year
• Participating in Petrobras divestitures
TRACK RECORD & VALUE
29
G R O W I N G ASSET S
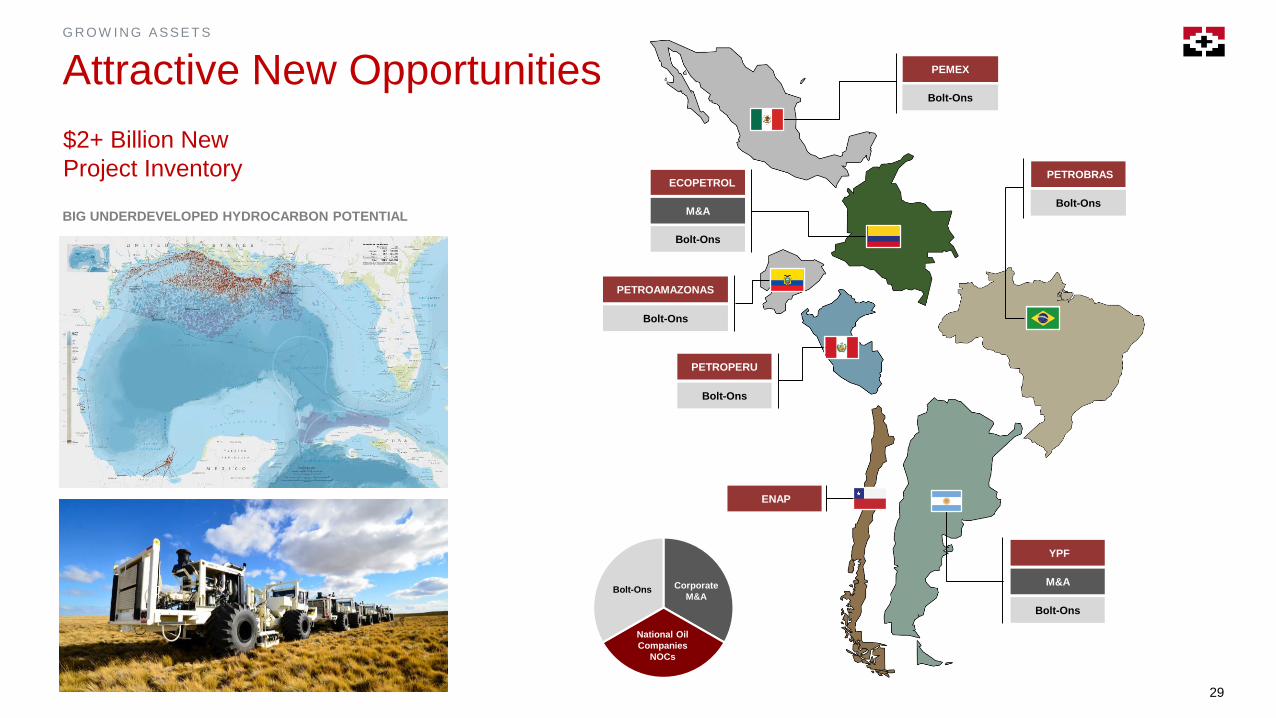
Attractive New Opportunities
BIG UNDERDEVELOPED HYDROCARBON POTENTIAL
PETROBRASECOPETROL
M&A
Bolt-Ons
Bolt-Ons
Bolt-Ons
PEMEX
Bolt-Ons
PETROPERU
PETROAMAZONAS
Bolt-Ons
ENAP
National Oil
Companies
NOCs
Bolt-Ons Corporate
M&A
M&A
YPF
Bolt-Ons
$2+ Billion New
Project Inventory
30
FINANCIAL PERFORMANCE
31
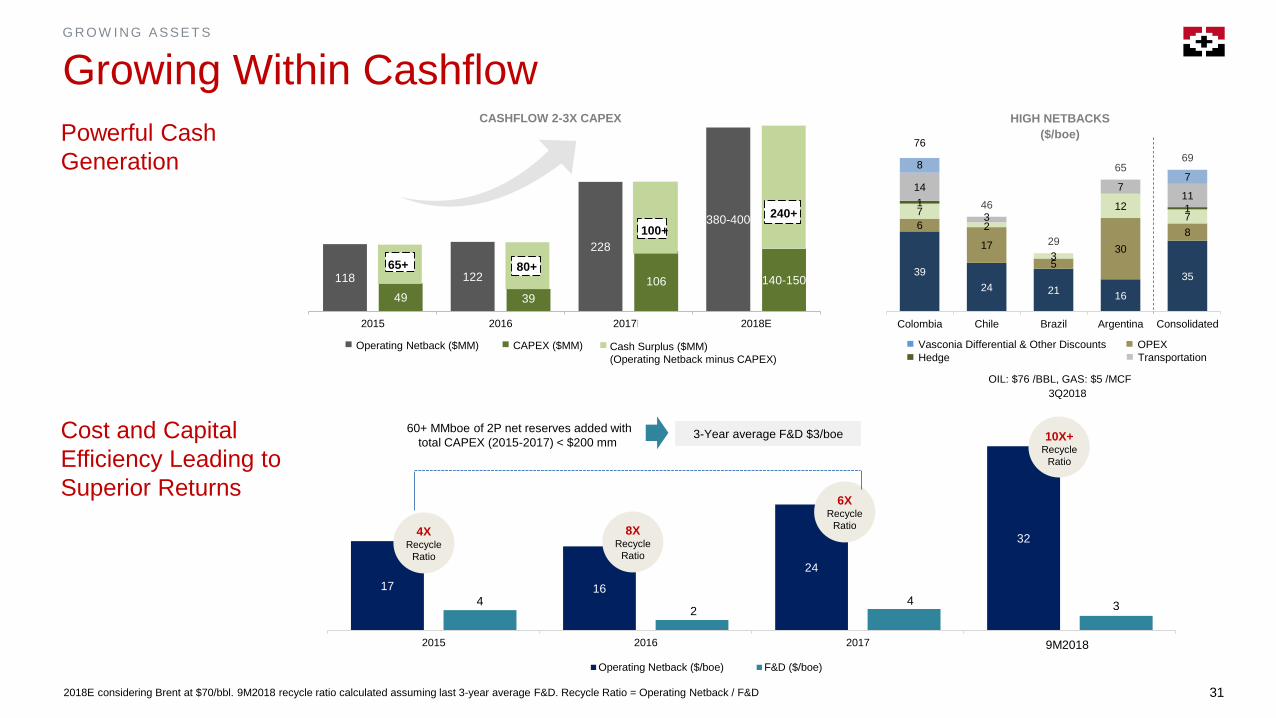
17 16
24
32
42
4 3
2015 2016 2017 2018E
Operating Netback ($/boe) F&D ($/boe)
G R O W I N G ASSET S
Growing Within Cashflow
2018E considering Brent at $70/bbl. 9M2018 recycle ratio calculated assuming last 3-year average F&D. Recycle Ratio = Operating Netback / F&D
118 122
228
380-400
49 39
106 140-150
2015 2016 2017E 2018E
Cost and Capital
Efficiency Leading to
Superior Returns
Powerful Cash
Generation
240+
100+
80+65+
CAPEX ($MM)Operating Netback ($MM) Cash Surplus ($MM)
(Operating Netback minus CAPEX)
60+ MMboe of 2P net reserves added with
total CAPEX (2015-2017) < $200 mm3-Year average F&D $3/boe
39
24 2116
35
6
17
5
30
8
7
2
3
127
11
14
3
711
87
46
29
6569
Colombia Chile Brazil Argentina Consolidated
HIGH NETBACKS
($/boe)
3Q2018
Vasconia Differential & Other Discounts
Hedge
OPEX
Transportation
OIL: $76 /BBL, GAS: $5 /MCF
76
4XRecycle
Ratio
8XRecycle
Ratio
6XRecycle
Ratio
10X+Recycle
Ratio
9M2018
CASHFLOW 2-3X CAPEX
32
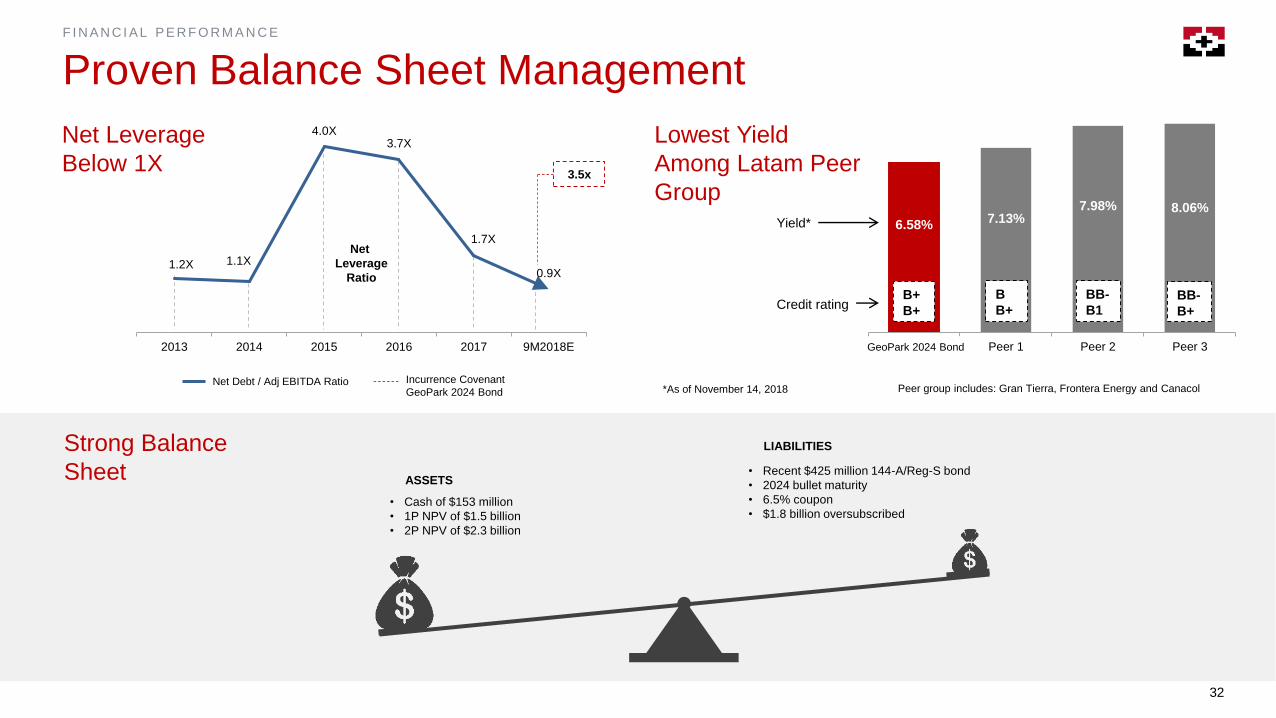
F I N AN C I AL PER F O R M A N C E
Proven Balance Sheet Management
• Cash of $153 million
• 1P NPV of $1.5 billion
• 2P NPV of $2.3 billion
ASSETS
LIABILITIES
• Recent $425 million 144-A/Reg-S bond
• 2024 bullet maturity
• 6.5% coupon
• $1.8 billion oversubscribed
Strong Balance
Sheet
Net Leverage
Below 1X
Lowest Yield
Among Latam Peer
Group
1.2X 1.1X
4.0X3.7X
1.7X
0.9X
2013 2014 2015 2016 2017 9M2018E
Net
Leverage
Ratio
*As of November 14, 2018
3.5x
Net Debt / Adj EBITDA Ratio Incurrence Covenant
GeoPark 2024 Bond
6.58%7.13%
7.98% 8.06%
GeoPark 6.509/21/2024
Peer 1 Peer 2 Peer 3
B+
B+
B
B+
BB-
B1BB-
B+
GeoPark 2024 Bond
Peer group includes: Gran Tierra, Frontera Energy and Canacol
Credit rating
Yield*
33
2019 WORK PROGRAM
34
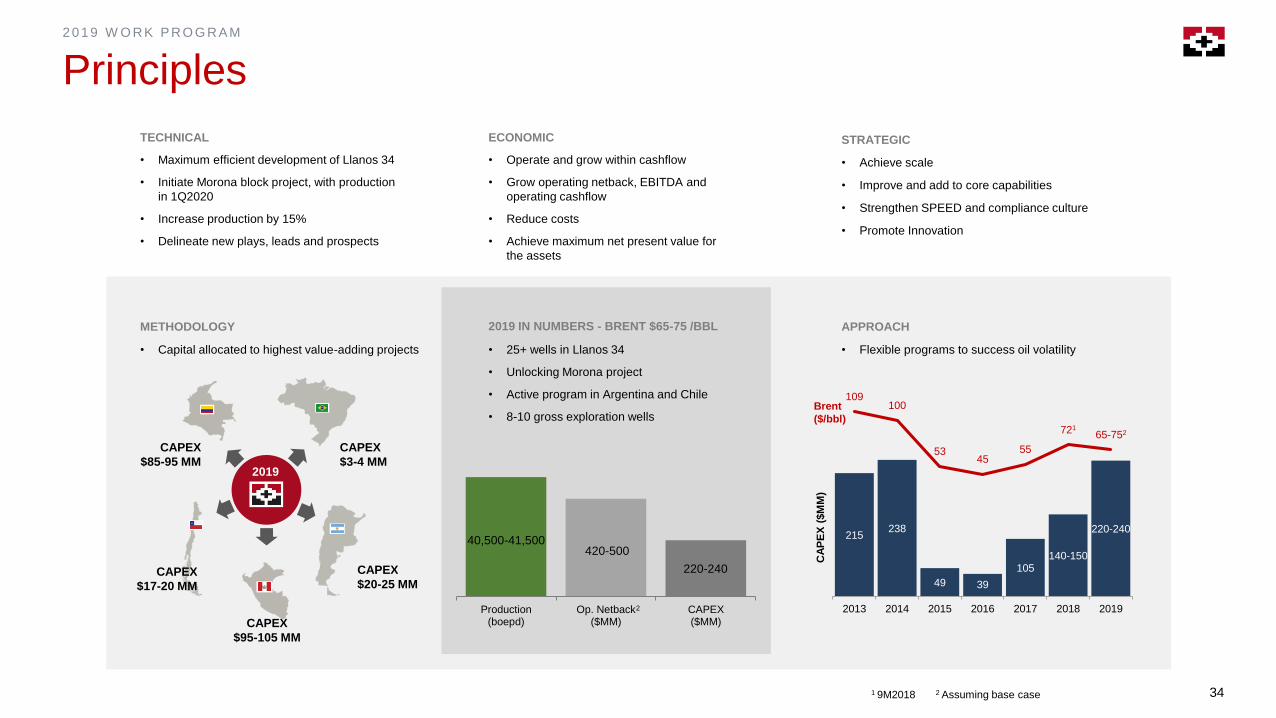
2 0 1 9 W O R K PR O G R AM
Principles
TECHNICAL
• Maximum efficient development of Llanos 34
• Initiate Morona block project, with production
in 1Q2020
• Increase production by 15%
• Delineate new plays, leads and prospects
ECONOMIC
• Operate and grow within cashflow
• Grow operating netback, EBITDA and
operating cashflow
• Reduce costs
• Achieve maximum net present value for
the assets
STRATEGIC
• Achieve scale
• Improve and add to core capabilities
• Strengthen SPEED and compliance culture
• Promote Innovation
METHODOLOGY APPROACH
215238
49 39
105140-150
220-240
109100
5345
55
72165-752
-80
-30
20
70
120
0
50
100
150
200
250
300
350
2013 2014 2015 2016 2017 2018 2019
Brent
($/bbl)
CA
PE
X (
$M
M)
• Flexible programs to success oil volatility
Production(boepd)
Op. Netback($MM)
CAPEX($MM)
2019 IN NUMBERS - BRENT $65-75 /BBL
40,500-41,500
220-240
• Capital allocated to highest value-adding projects • 25+ wells in Llanos 34
• Unlocking Morona project
• Active program in Argentina and Chile
• 8-10 gross exploration wells
CAPEX
$3-4 MM
CAPEX
$20-25 MM
CAPEX
$85-95 MM
CAPEX
$17-20 MM
CAPEX
$95-105 MM
2019
420-500
2 Assuming base case
2
1 9M2018
35
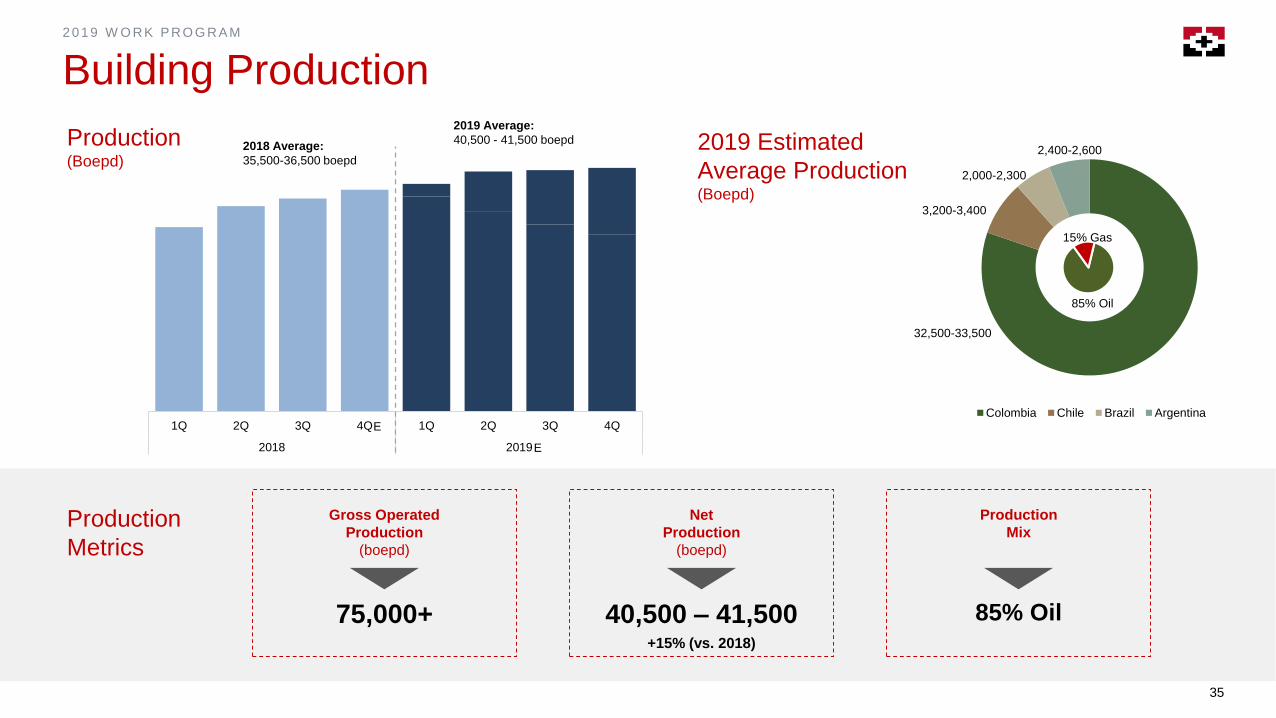
2 0 1 9 W O R K PR O G R AM
Building Production
1Q 2Q 3Q 4Q 1Q 2Q 3Q 4Q
2018 2019
Production (Boepd)
2019 Estimated
Average Production (Boepd)
Production
Metrics
2018 Average:
35,500-36,500 boepd
2019 Average:
40,500 - 41,500 boepd
2,542
Colombia Chile Brazil Argentina
85% Oil
15% Gas
32,500-33,500
2,400-2,600
2,000-2,300
3,200-3,400
E
E
75,000+
Gross Operated
Production
(boepd)
40,500 – 41,500+15% (vs. 2018)
Net
Production
(boepd)
85% Oil
Production
Mix
36
2 0 1 9 W O R K PR O G R AM
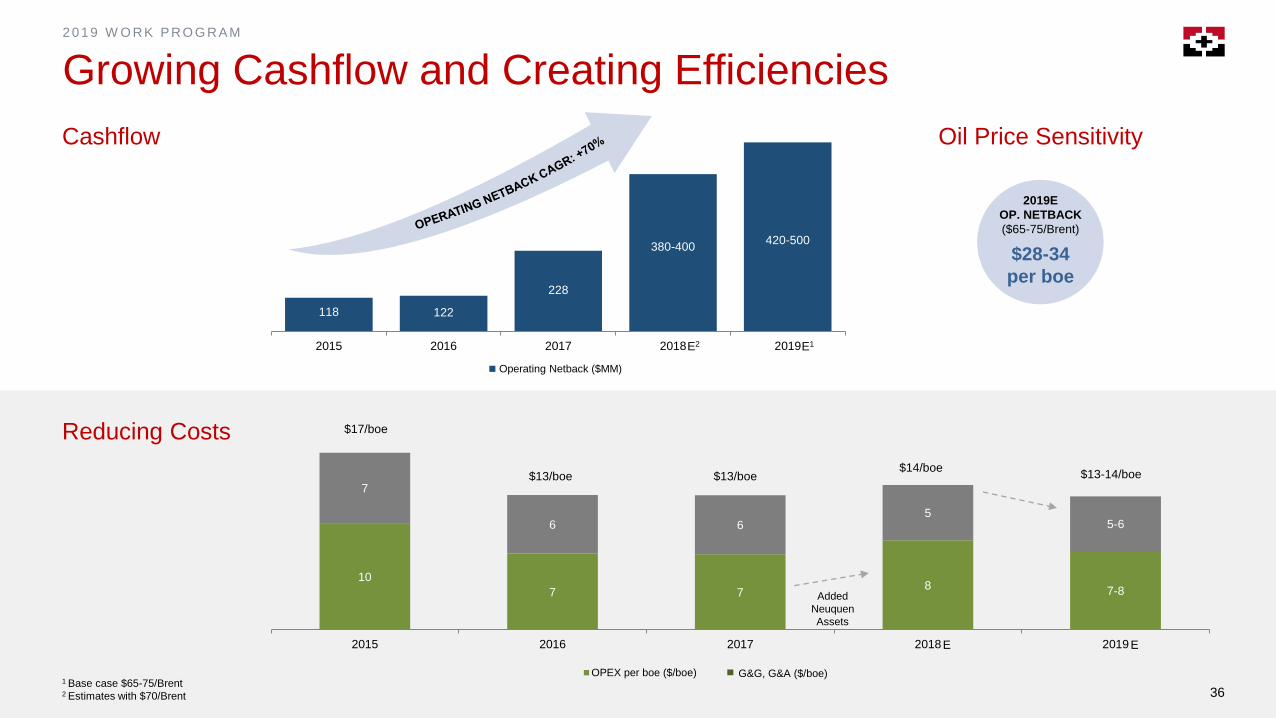
Growing Cashflow and Creating Efficiencies
10
7 78 7-8
7
6 65
5-6
2015 2016 2017 2018 2019
OPEX per boe ($/boe)
Cashflow
Reducing Costs $17/boe
$13/boe $13/boe$14/boe
$13-14/boe
Added
Neuquen
Assets
$28-34
per boe
2019E
OP. NETBACK
($65-75/Brent)
G&G, G&A ($/boe)
E E
118 122
228
380-400420-500
2015 2016 2017 2018 2019E2 E1
Operating Netback ($MM)
36
Oil Price Sensitivity
1 Base case $65-75/Brent2 Estimates with $70/Brent
37
2 0 1 9 W O R K PR O G R AM
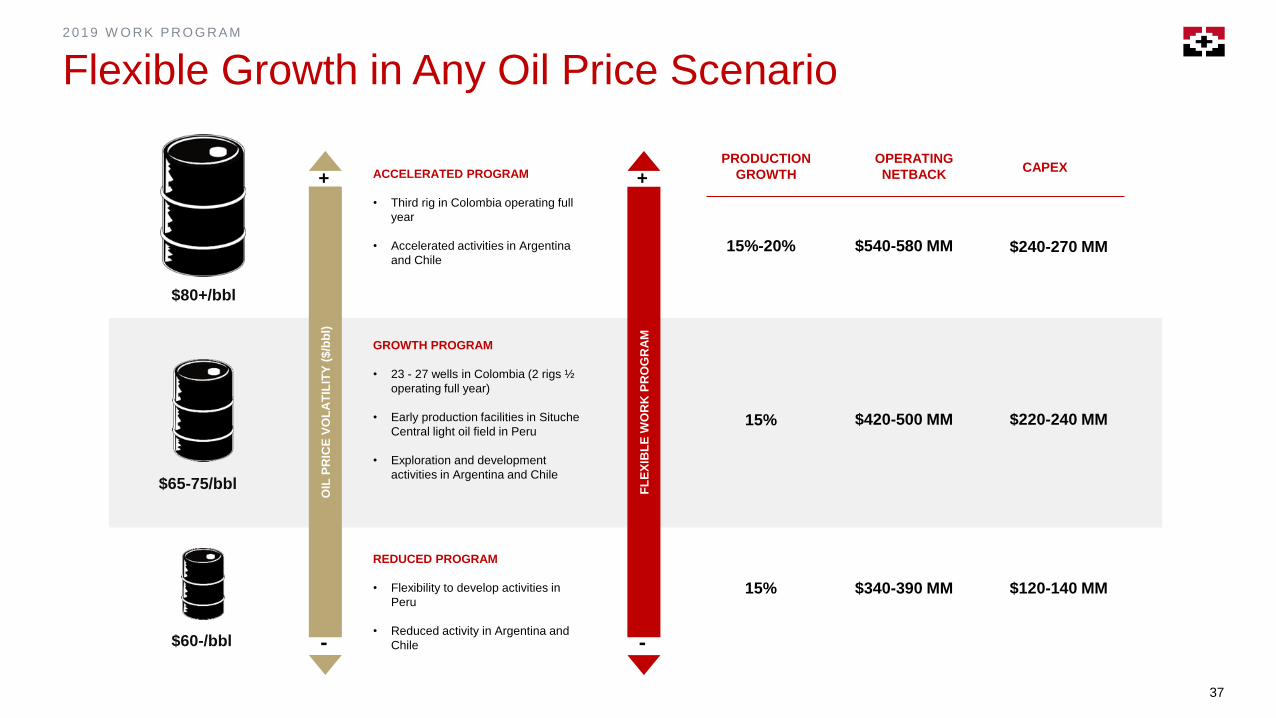
Flexible Growth in Any Oil Price Scenario
OIL
PR
ICE
VO
LA
TIL
ITY
($
/bb
l)
+
-F
LE
XIB
LE
WO
RK
PR
OG
RA
M
+
-
GROWTH PROGRAM
• 23 - 27 wells in Colombia (2 rigs ½
operating full year)
• Early production facilities in Situche
Central light oil field in Peru
• Exploration and development
activities in Argentina and Chile
ACCELERATED PROGRAM
• Third rig in Colombia operating full
year
• Accelerated activities in Argentina
and Chile
REDUCED PROGRAM
• Flexibility to develop activities in
Peru
• Reduced activity in Argentina and
Chile
$80+/bbl
PRODUCTION
GROWTH
$65-75/bbl
$60-/bbl
$540-580 MM15%-20%
OPERATING
NETBACKCAPEX
$240-270 MM
15% $420-500 MM $220-240 MM
$340-390 MM15% $120-140 MM
38
SHAREHOLDER VALUE CREATION
39
SH AR EH O L D E R VAL U E C R EAT I O N
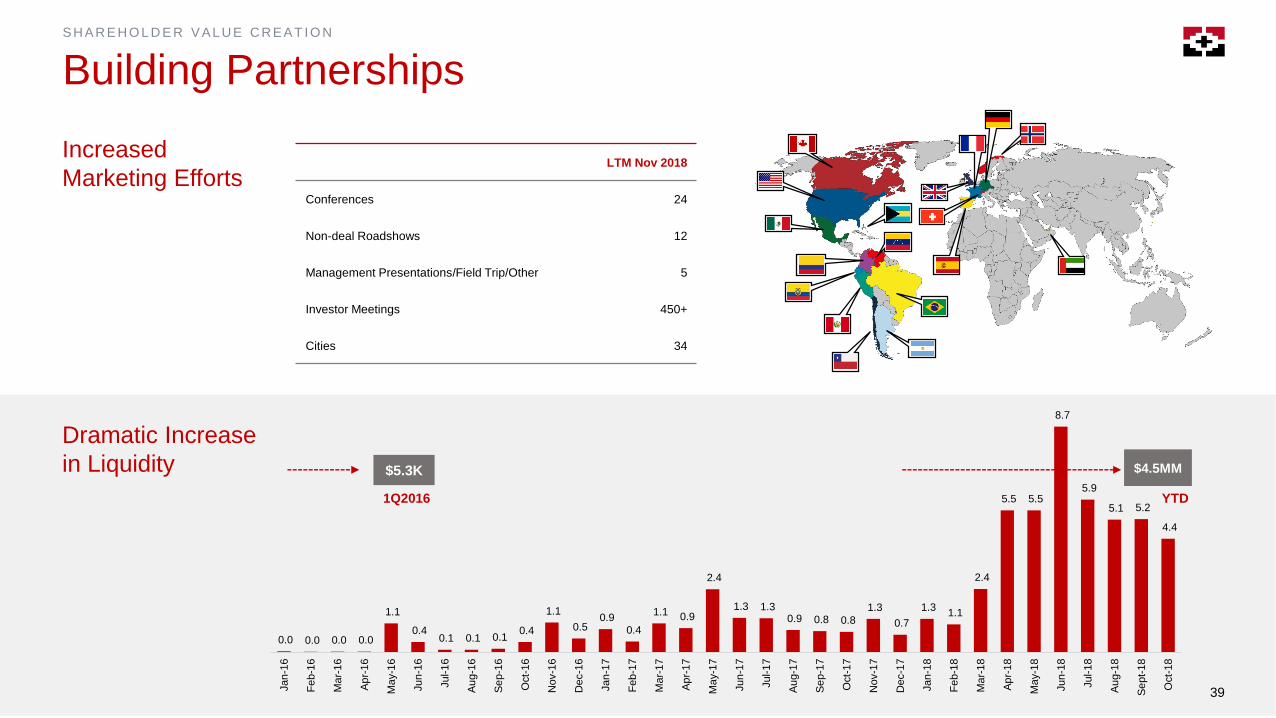
Building Partnerships
LTM Nov 2018
Conferences 24
Non-deal Roadshows 12
Management Presentations/Field Trip/Other 5
Investor Meetings 450+
Cities 34
Increased
Marketing Efforts
0.0 0.0 0.0 0.0
1.1
0.4 0.1 0.1 0.1
0.4
1.1
0.5 0.9
0.4
1.1 0.9
2.4
1.3 1.3 0.9 0.8 0.8
1.3
0.7
1.3 1.1
2.4
5.5 5.5
8.7
5.9
5.1 5.2
4.4
Jan
-16
Fe
b-1
6
Ma
r-16
Ap
r-16
Ma
y-1
6
Jun
-16
Jul-1
6
Au
g-1
6
Se
p-1
6
Oct-
16
Nov-1
6
Dec-1
6
Jan
-17
Feb-1
7
Ma
r-17
Ap
r-17
Ma
y-1
7
Jun
-17
Jul-1
7
Au
g-1
7
Se
p-1
7
Oct-
17
Nov-1
7
Dec-1
7
Jan
-18
Fe
b-1
8
Ma
r-18
Ap
r-18
Ma
y-1
8
Jun
-18
Jul-1
8
Au
g-1
8
Se
pt-
18
Oct-
18
$5.3K $4.5MM
1Q2016 YTD
Dramatic Increase
in Liquidity
39
40
SH AR EH O L D E R VAL U E C R EAT I O N
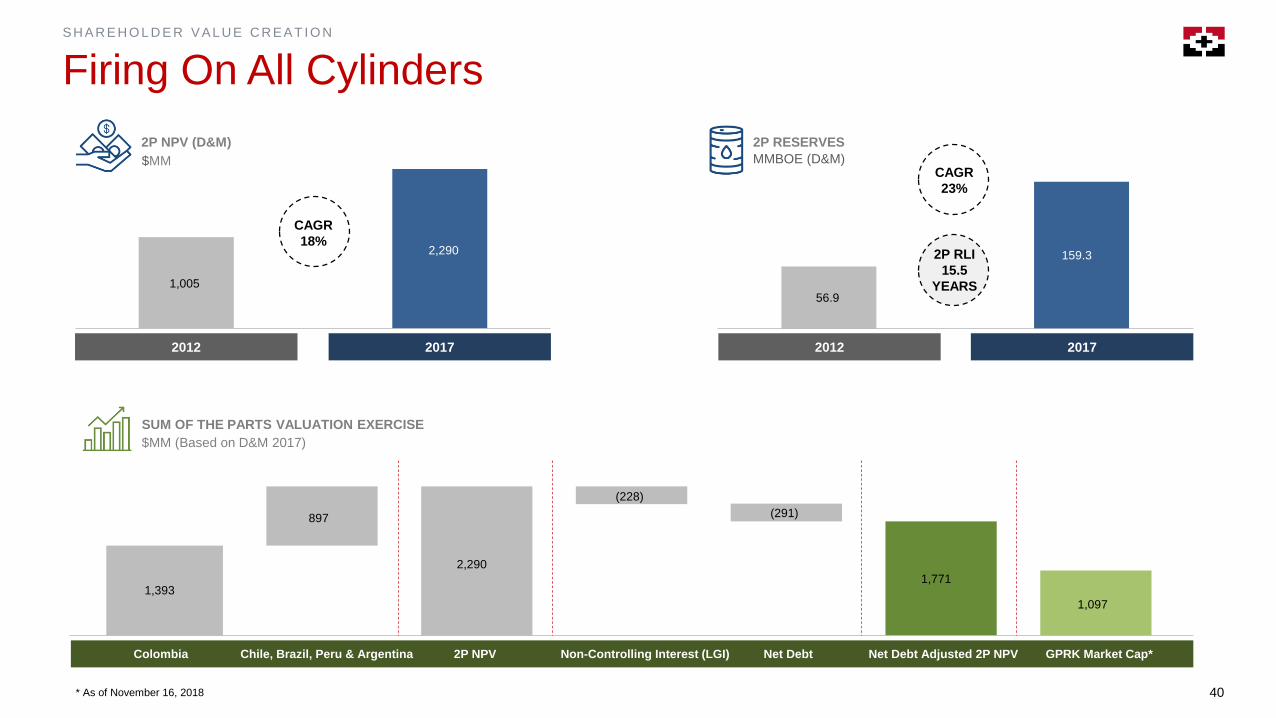
Firing On All Cylinders
* As of November 16, 2018
Colombia Chile, Brazil, Peru & Argentina 2P NPV Non-Controlling Interest (LGI) Net Debt Adjusted 2P NPV GPRK Market Cap*Net Debt
SUM OF THE PARTS VALUATION EXERCISE
$MM (Based on D&M 2017)
1,393
897
2,290
(228)
(291)
1,771
1,097
2P NPV (D&M) 2P RESERVES
20172012
1,005
2,290
20172012
MMBOE (D&M)
56.9
159.3
$MM
CAGR
18%
CAGR
23%
2P RLI
15.5
YEARS
42
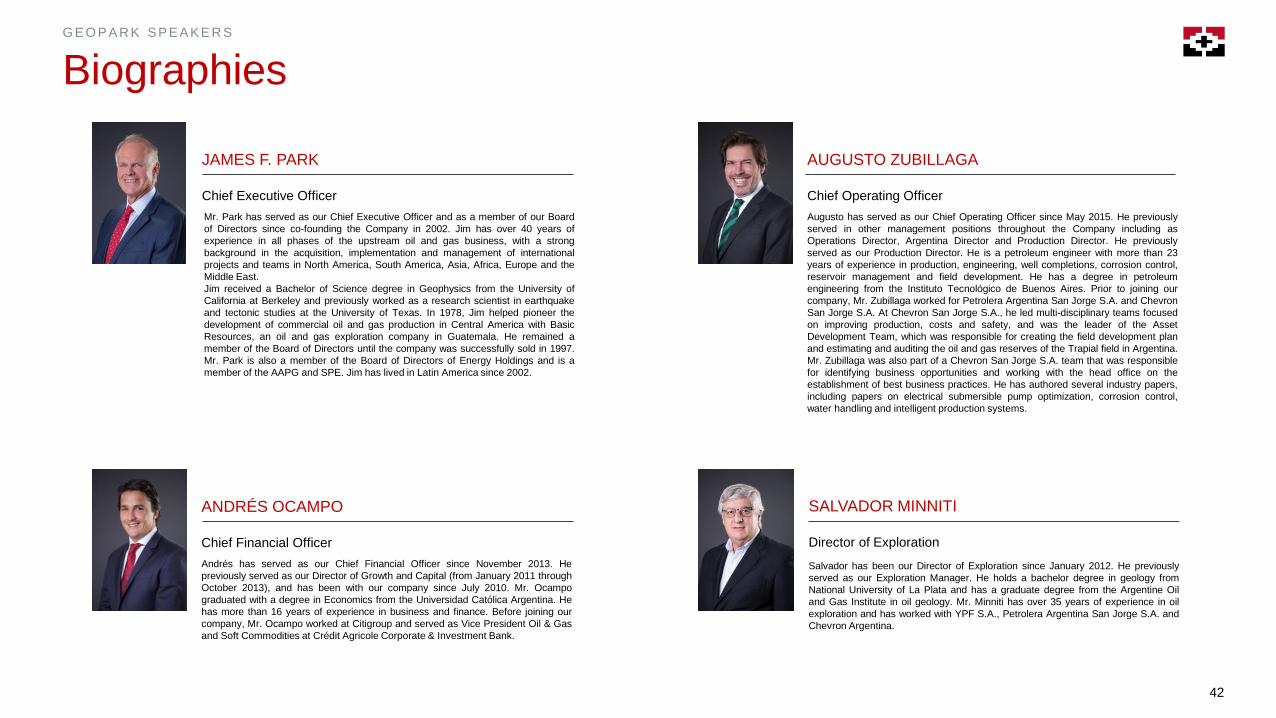
G EO PAR K SPEAKER S
Biographies
JAMES F. PARK AUGUSTO ZUBILLAGA
Chief Executive Officer Chief Operating Officer
Mr. Park has served as our Chief Executive Officer and as a member of our Board
of Directors since co-founding the Company in 2002. Jim has over 40 years of
experience in all phases of the upstream oil and gas business, with a strong
background in the acquisition, implementation and management of international
projects and teams in North America, South America, Asia, Africa, Europe and the
Middle East.
Jim received a Bachelor of Science degree in Geophysics from the University of
California at Berkeley and previously worked as a research scientist in earthquake
and tectonic studies at the University of Texas. In 1978, Jim helped pioneer the
development of commercial oil and gas production in Central America with Basic
Resources, an oil and gas exploration company in Guatemala. He remained a
member of the Board of Directors until the company was successfully sold in 1997.
Mr. Park is also a member of the Board of Directors of Energy Holdings and is a
member of the AAPG and SPE. Jim has lived in Latin America since 2002.
Augusto has served as our Chief Operating Officer since May 2015. He previously
served in other management positions throughout the Company including as
Operations Director, Argentina Director and Production Director. He previously
served as our Production Director. He is a petroleum engineer with more than 23
years of experience in production, engineering, well completions, corrosion control,
reservoir management and field development. He has a degree in petroleum
engineering from the Instituto Tecnológico de Buenos Aires. Prior to joining our
company, Mr. Zubillaga worked for Petrolera Argentina San Jorge S.A. and Chevron
San Jorge S.A. At Chevron San Jorge S.A., he led multi-disciplinary teams focused
on improving production, costs and safety, and was the leader of the Asset
Development Team, which was responsible for creating the field development plan
and estimating and auditing the oil and gas reserves of the Trapial field in Argentina.
Mr. Zubillaga was also part of a Chevron San Jorge S.A. team that was responsible
for identifying business opportunities and working with the head office on the
establishment of best business practices. He has authored several industry papers,
including papers on electrical submersible pump optimization, corrosion control,
water handling and intelligent production systems.
ANDRÉS OCAMPO
Chief Financial Officer
Andrés has served as our Chief Financial Officer since November 2013. He
previously served as our Director of Growth and Capital (from January 2011 through
October 2013), and has been with our company since July 2010. Mr. Ocampo
graduated with a degree in Economics from the Universidad Católica Argentina. He
has more than 16 years of experience in business and finance. Before joining our
company, Mr. Ocampo worked at Citigroup and served as Vice President Oil & Gas
and Soft Commodities at Crédit Agricole Corporate & Investment Bank.
SALVADOR MINNITI
Director of Exploration
Salvador has been our Director of Exploration since January 2012. He previously
served as our Exploration Manager. He holds a bachelor degree in geology from
National University of La Plata and has a graduate degree from the Argentine Oil
and Gas Institute in oil geology. Mr. Minniti has over 35 years of experience in oil
exploration and has worked with YPF S.A., Petrolera Argentina San Jorge S.A. and
Chevron Argentina.

43
G EO PAR K SPEAKER S
Biographies
BARBARA BRUCE
Director for Peru
Barbara has been our Director for Peru since June 2017. Ms. Bruce holds a degree
in Geology from the Universidad Nacional de Ingeniería, Lima, Peru, a Master’s
degree in Reservoirs from Colorado School of Mines, USA and an MBA from
Universidad Adolfo Ibañez, USA/Chile. Before joining GeoPark, she previously
worked with Occidental Petroleum in different international operations, including in
the Caño Limon field in Colombia and the Dhurnal and Bhangali gas fields in
Pakistan. Barbara Bruce later worked as deputy President of an offshore operation
by Petrotech Peruana, joined Hunt Oil and as General Manager of Peru LNG,
leading the construction and startup of operation of Peru’s first LNG plant and
managed the exploration venture of Hunt Oil in Madre de Dios, Peru.
VERÓNICA DÁVILA
Director of Commercial
Verónica joined GeoPark in December 2016 as our Commercial Director. Mrs.
Dávila has 14 years of experience in the commodities and financial sectors. Prior to
joining GeoPark, she worked at Goldman Sachs as Vice President for Commodities
in Latin America and served within Goldman Sachs mergers and acquisitions
coverage team for Latin America. Mrs. Dávila holds a BA in economics from
Pontificia Universidad Católica Argentina.
MARCELA VACA
Director for Colombia
Marcela has been our Director for Colombia since August 2012. Mrs. Vaca holds a
degree in law from Pontificia Universidad Javeriana in Bogotá, Colombia, a Master’s
Degree in commercial law from the same university and an LLM from Georgetown
University. She served in the legal department of a number of companies in the
mining and energy sector in Colombia. In 2000 Mrs Vaca joined GHK Company
Colombia leading the legal, social and environmental strategy for the development
of the Guaduas field and the construction of its pipeline. Prior to joining our
company in 2012, Mrs. Vaca served for nine years as the General Manager of
the Hupecol Group, led the development of the Caracara field, the construction of
the Jaguar – Santiago Pipeline, and was also involved in the structuring of the
company’s asset development, its financing and sales strategy.
STACY STEIMEL
Director of Shareholder Value
Stacy joined GeoPark in February 2017 as our Shareholder Value Director. Mrs.
Steimel has more than 20 years of experience in the financial sector as Fund
Manager and subsequently as regional CEO for PineBridge Investments, ex-AIG
Investments in Latin America. Before AIG, Mrs. Steimel held positions in the US
Treasury Department and at the InterAmerican Development Bank. She holds an
MBA from the Pontificia Universidad Católica de Chile, an MA in Latin American
Studies from the University of Texas at Austin and a BA from the College of William
and Mary.
CONTACTS
Santiago, Chile
Nuestra Señora de los Ángeles 179
Las Condes, Santiago, Chile
Phone: +(56 2) 2242 9600
Email: [email protected]
JAMES F. PARK
Chief Executive Officer
ANDRÉS OCAMPO
Chief Financial Officer
STACY STEIMEL
Shareholder Value Director