Embed Size (px)
Citation preview
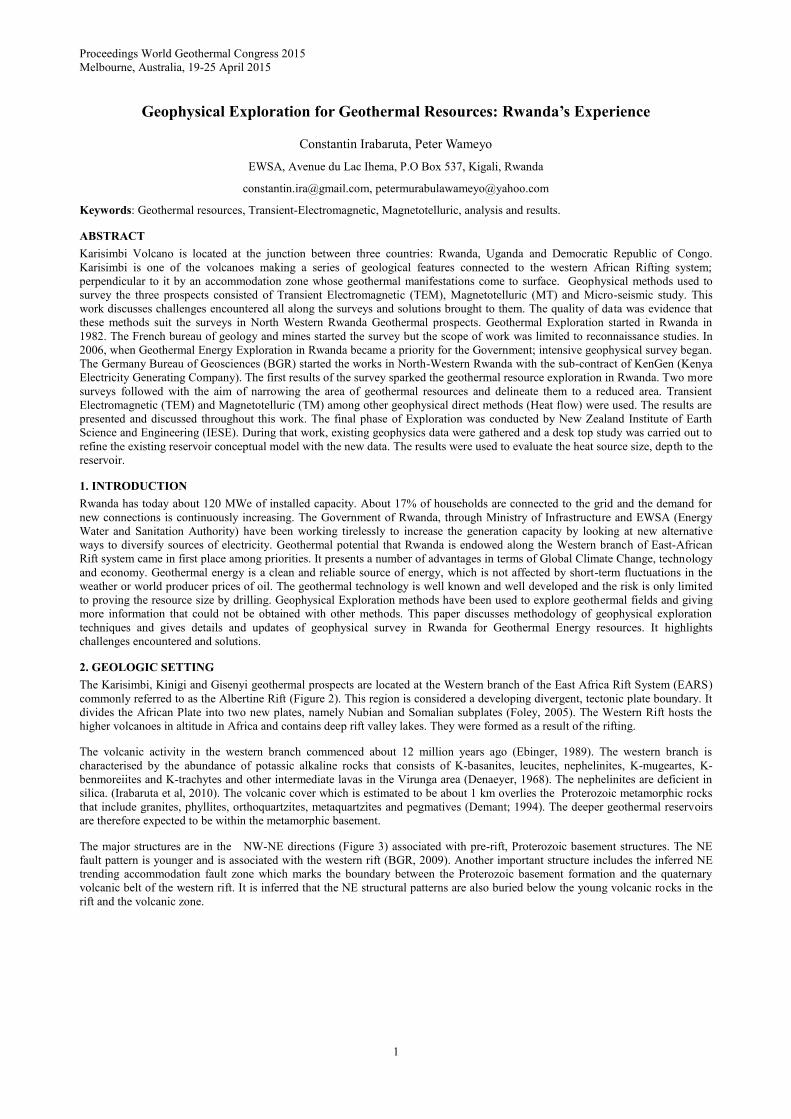
Proceedings World Geothermal Congress 2015
Melbourne, Australia, 19-25 April 2015
1
Geophysical Exploration for Geothermal Resources: Rwanda’s Experience
Constantin Irabaruta, Peter Wameyo
EWSA, Avenue du Lac Ihema, P.O Box 537, Kigali, Rwanda
[email protected], [email protected]
Keywords: Geothermal resources, Transient-Electromagnetic, Magnetotelluric, analysis and results.
ABSTRACT
Karisimbi Volcano is located at the junction between three countries: Rwanda, Uganda and Democratic Republic of Congo.
Karisimbi is one of the volcanoes making a series of geological features connected to the western African Rifting system;
perpendicular to it by an accommodation zone whose geothermal manifestations come to surface. Geophysical methods used to
survey the three prospects consisted of Transient Electromagnetic (TEM), Magnetotelluric (MT) and Micro-seismic study. This
work discusses challenges encountered all along the surveys and solutions brought to them. The quality of data was evidence that
these methods suit the surveys in North Western Rwanda Geothermal prospects. Geothermal Exploration started in Rwanda in
1982. The French bureau of geology and mines started the survey but the scope of work was limited to reconnaissance studies. In
2006, when Geothermal Energy Exploration in Rwanda became a priority for the Government; intensive geophysical survey began.
The Germany Bureau of Geosciences (BGR) started the works in North-Western Rwanda with the sub-contract of KenGen (Kenya
Electricity Generating Company). The first results of the survey sparked the geothermal resource exploration in Rwanda. Two more
surveys followed with the aim of narrowing the area of geothermal resources and delineate them to a reduced area. Transient
Electromagnetic (TEM) and Magnetotelluric (TM) among other geophysical direct methods (Heat flow) were used. The results are
presented and discussed throughout this work. The final phase of Exploration was conducted by New Zealand Institute of Earth
Science and Engineering (IESE). During that work, existing geophysics data were gathered and a desk top study was carried out to
refine the existing reservoir conceptual model with the new data. The results were used to evaluate the heat source size, depth to the
reservoir.
1. INTRODUCTION
Rwanda has today about 120 MWe of installed capacity. About 17% of households are connected to the grid and the demand for
new connections is continuously increasing. The Government of Rwanda, through Ministry of Infrastructure and EWSA (Energy
Water and Sanitation Authority) have been working tirelessly to increase the generation capacity by looking at new alternative
ways to diversify sources of electricity. Geothermal potential that Rwanda is endowed along the Western branch of East-African
Rift system came in first place among priorities. It presents a number of advantages in terms of Global Climate Change, technology
and economy. Geothermal energy is a clean and reliable source of energy, which is not affected by short-term fluctuations in the
weather or world producer prices of oil. The geothermal technology is well known and well developed and the risk is only limited
to proving the resource size by drilling. Geophysical Exploration methods have been used to explore geothermal fields and giving
more information that could not be obtained with other methods. This paper discusses methodology of geophysical exploration
techniques and gives details and updates of geophysical survey in Rwanda for Geothermal Energy resources. It highlights
challenges encountered and solutions.
2. GEOLOGIC SETTING
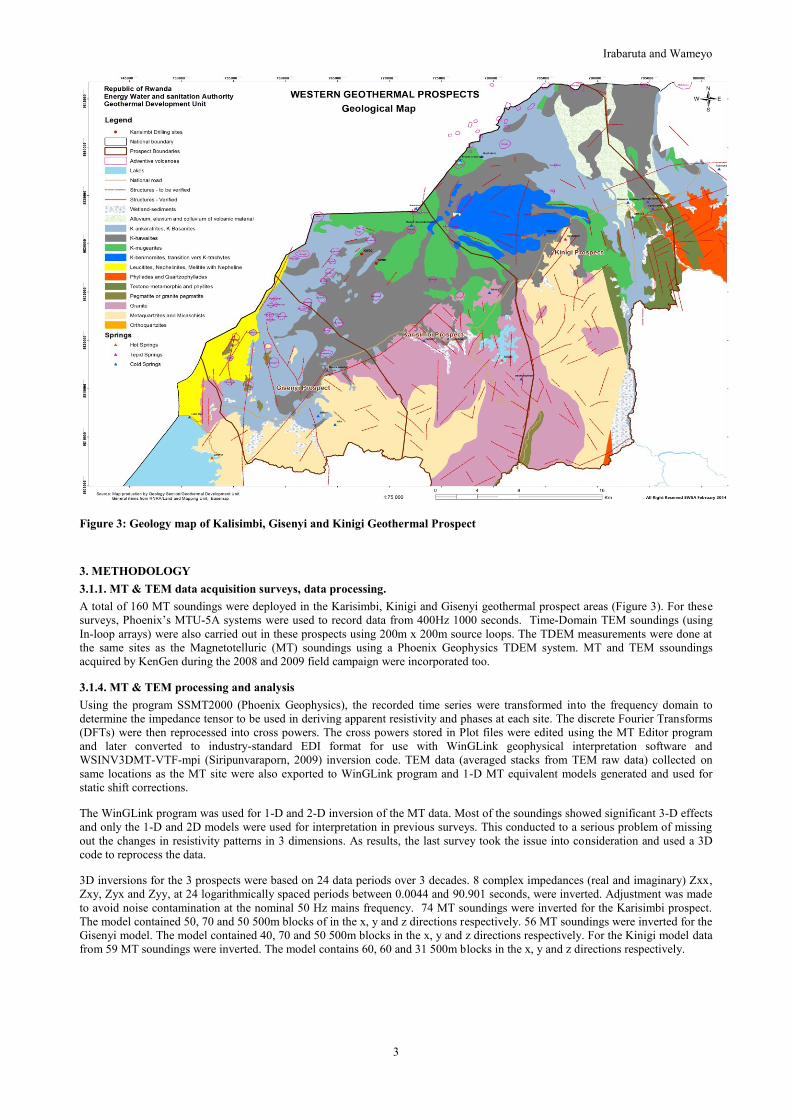
The Karisimbi, Kinigi and Gisenyi geothermal prospects are located at the Western branch of the East Africa Rift System (EARS)
commonly referred to as the Albertine Rift (Figure 2). This region is considered a developing divergent, tectonic plate boundary. It
divides the African Plate into two new plates, namely Nubian and Somalian subplates (Foley, 2005). The Western Rift hosts the
higher volcanoes in altitude in Africa and contains deep rift valley lakes. They were formed as a result of the rifting.
The volcanic activity in the western branch commenced about 12 million years ago (Ebinger, 1989). The western branch is
characterised by the abundance of potassic alkaline rocks that consists of K-basanites, leucites, nephelinites, K-mugeartes, K-
benmoreiites and K-trachytes and other intermediate lavas in the Virunga area (Denaeyer, 1968). The nephelinites are deficient in
silica. (Irabaruta et al, 2010). The volcanic cover which is estimated to be about 1 km overlies the Proterozoic metamorphic rocks
that include granites, phyllites, orthoquartzites, metaquartzites and pegmatives (Demant; 1994). The deeper geothermal reservoirs
are therefore expected to be within the metamorphic basement.
The major structures are in the NW-NE directions (Figure 3) associated with pre-rift, Proterozoic basement structures. The NE
fault pattern is younger and is associated with the western rift (BGR, 2009). Another important structure includes the inferred NE
trending accommodation fault zone which marks the boundary between the Proterozoic basement formation and the quaternary
volcanic belt of the western rift. It is inferred that the NE structural patterns are also buried below the young volcanic rocks in the
rift and the volcanic zone.
Irabaruta and Wameyo
2
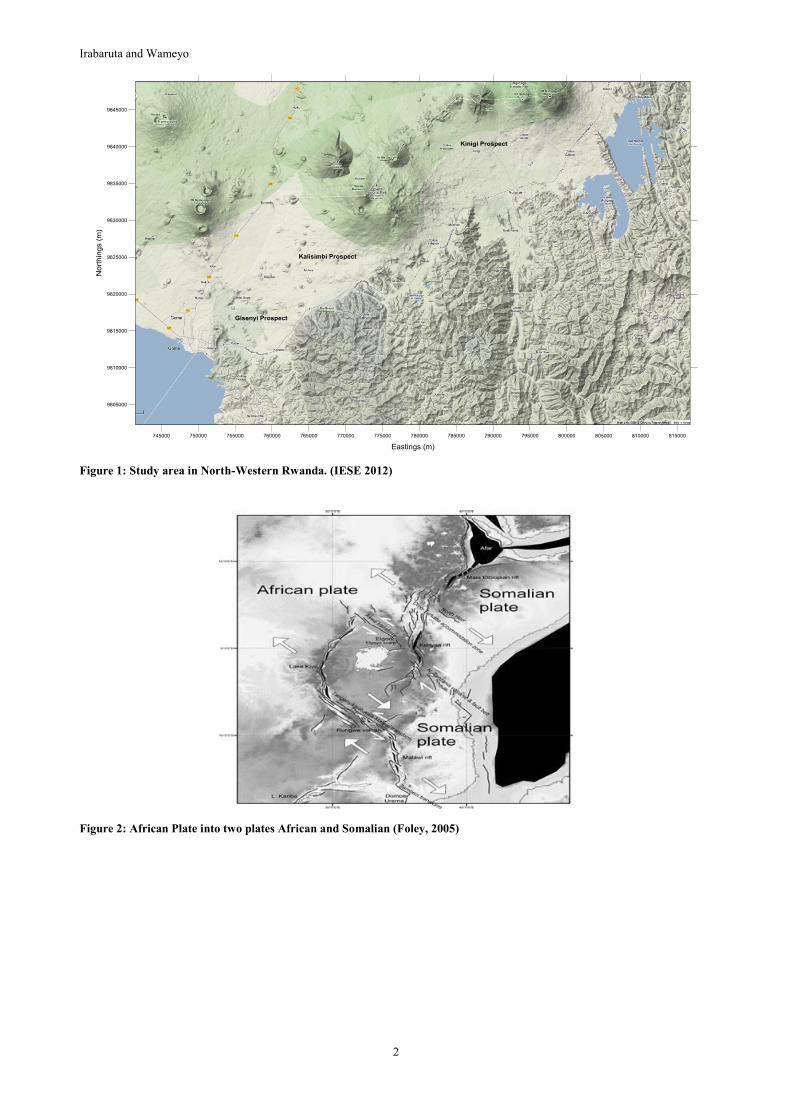
Figure 1: Study area in North-Western Rwanda. (IESE 2012)
Figure 2: African Plate into two plates African and Somalian (Foley, 2005)
Irabaruta and Wameyo
3
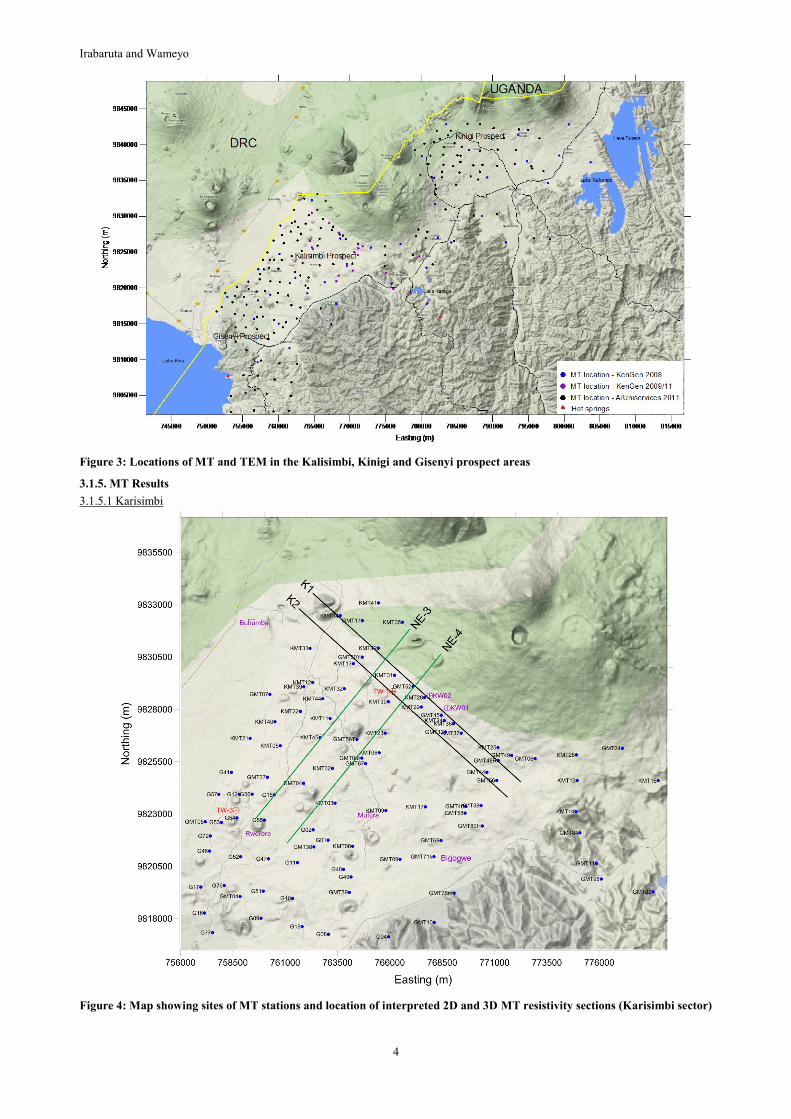
Figure 3: Geology map of Kalisimbi, Gisenyi and Kinigi Geothermal Prospect
3. METHODOLOGY
3.1.1. MT & TEM data acquisition surveys, data processing.
A total of 160 MT soundings were deployed in the Karisimbi, Kinigi and Gisenyi geothermal prospect areas (Figure 3). For these
surveys, Phoenix’s MTU-5A systems were used to record data from 400Hz 1000 seconds. Time-Domain TEM soundings (using
In-loop arrays) were also carried out in these prospects using 200m x 200m source loops. The TDEM measurements were done at
the same sites as the Magnetotelluric (MT) soundings using a Phoenix Geophysics TDEM system. MT and TEM ssoundings
acquired by KenGen during the 2008 and 2009 field campaign were incorporated too.
3.1.4. MT & TEM processing and analysis
Using the program SSMT2000 (Phoenix Geophysics), the recorded time series were transformed into the frequency domain to
determine the impedance tensor to be used in deriving apparent resistivity and phases at each site. The discrete Fourier Transforms
(DFTs) were then reprocessed into cross powers. The cross powers stored in Plot files were edited using the MT Editor program
and later converted to industry-standard EDI format for use with WinGLink geophysical interpretation software and
WSINV3DMT-VTF-mpi (Siripunvaraporn, 2009) inversion code. TEM data (averaged stacks from TEM raw data) collected on
same locations as the MT site were also exported to WinGLink program and 1-D MT equivalent models generated and used for
static shift corrections.
The WinGLink program was used for 1-D and 2-D inversion of the MT data. Most of the soundings showed significant 3-D effects
and only the 1-D and 2D models were used for interpretation in previous surveys. This conducted to a serious problem of missing
out the changes in resistivity patterns in 3 dimensions. As results, the last survey took the issue into consideration and used a 3D
code to reprocess the data.
3D inversions for the 3 prospects were based on 24 data periods over 3 decades. 8 complex impedances (real and imaginary) Zxx,
Zxy, Zyx and Zyy, at 24 logarithmically spaced periods between 0.0044 and 90.901 seconds, were inverted. Adjustment was made
to avoid noise contamination at the nominal 50 Hz mains frequency. 74 MT soundings were inverted for the Karisimbi prospect.
The model contained 50, 70 and 50 500m blocks of in the x, y and z directions respectively. 56 MT soundings were inverted for the
Gisenyi model. The model contained 40, 70 and 50 500m blocks in the x, y and z directions respectively. For the Kinigi model data
from 59 MT soundings were inverted. The model contains 60, 60 and 31 500m blocks in the x, y and z directions respectively.
Irabaruta and Wameyo
4
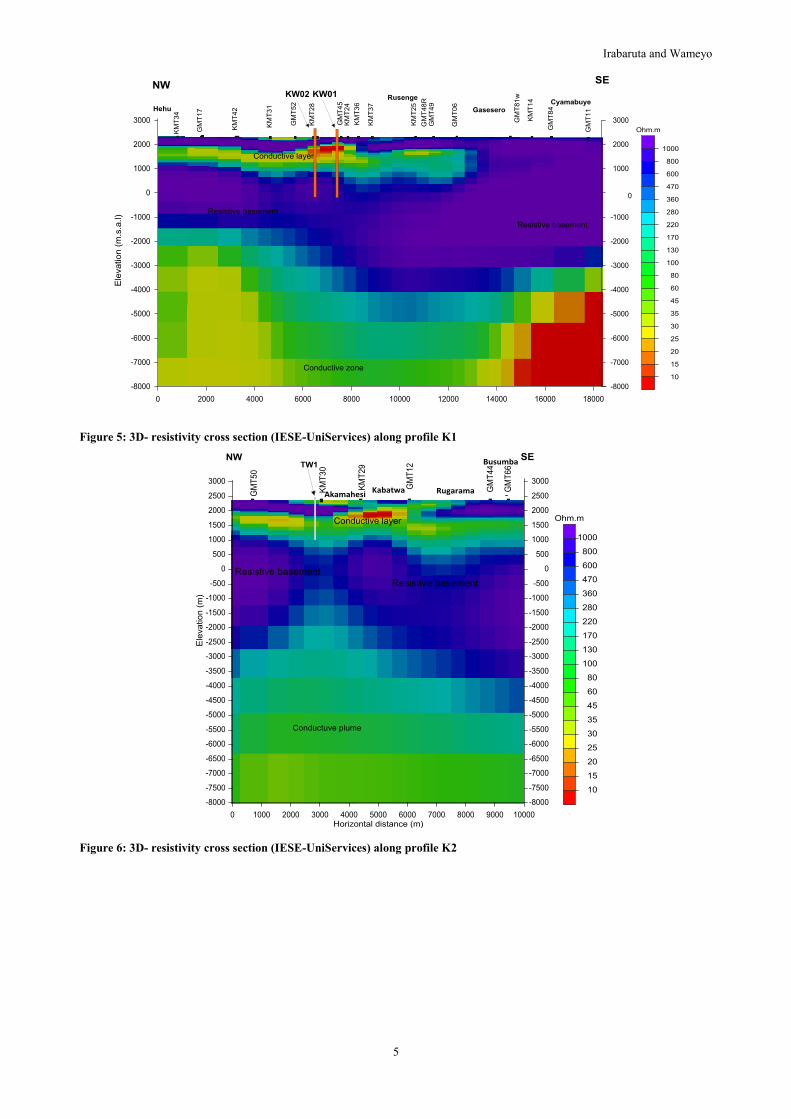
Figure 3: Locations of MT and TEM in the Kalisimbi, Kinigi and Gisenyi prospect areas
3.1.5. MT Results
3.1.5.1 Karisimbi
Figure 4: Map showing sites of MT stations and location of interpreted 2D and 3D MT resistivity sections (Karisimbi sector)
Irabaruta and Wameyo
5
Figure 5: 3D- resistivity cross section (IESE-UniServices) along profile K1
Figure 6: 3D- resistivity cross section (IESE-UniServices) along profile K2
Irabaruta and Wameyo
6
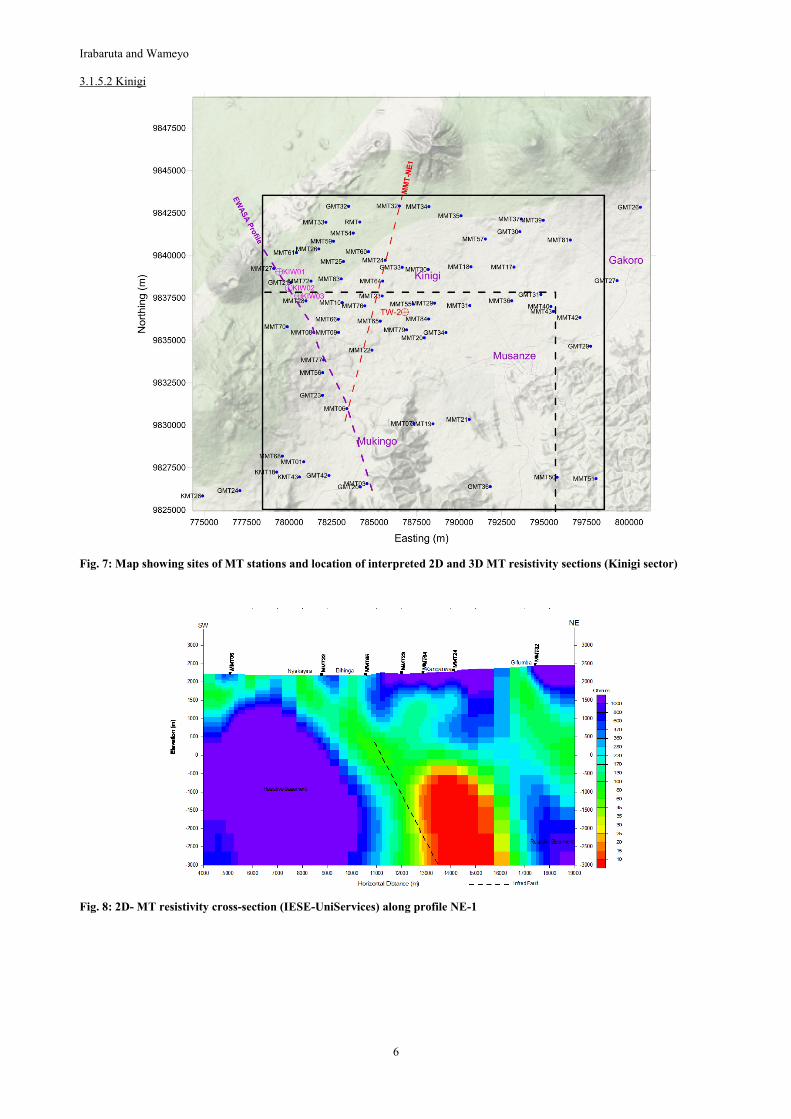
3.1.5.2 Kinigi
Fig. 7: Map showing sites of MT stations and location of interpreted 2D and 3D MT resistivity sections (Kinigi sector)
Fig. 8: 2D- MT resistivity cross-section (IESE-UniServices) along profile NE-1
Irabaruta and Wameyo
7
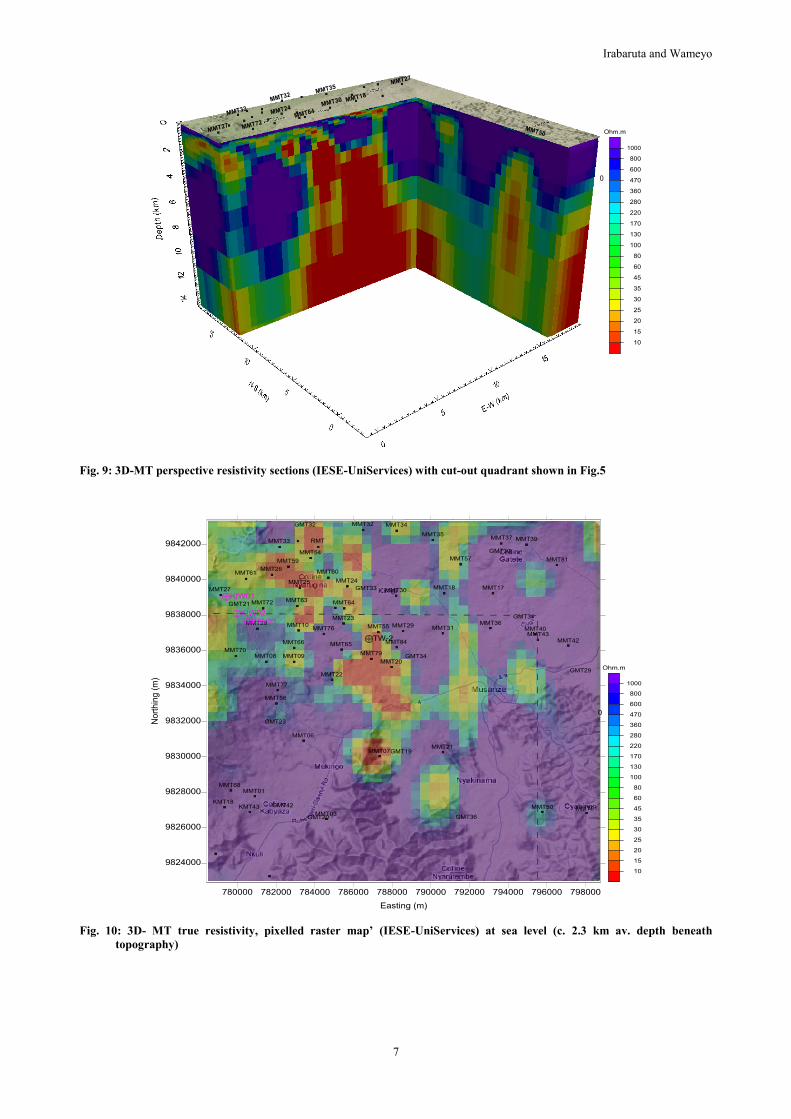
Fig. 9: 3D-MT perspective resistivity sections (IESE-UniServices) with cut-out quadrant shown in Fig.5
Fig. 10: 3D- MT true resistivity, pixelled raster map’ (IESE-UniServices) at sea level (c. 2.3 km av. depth beneath
topography)
Irabaruta and Wameyo
8
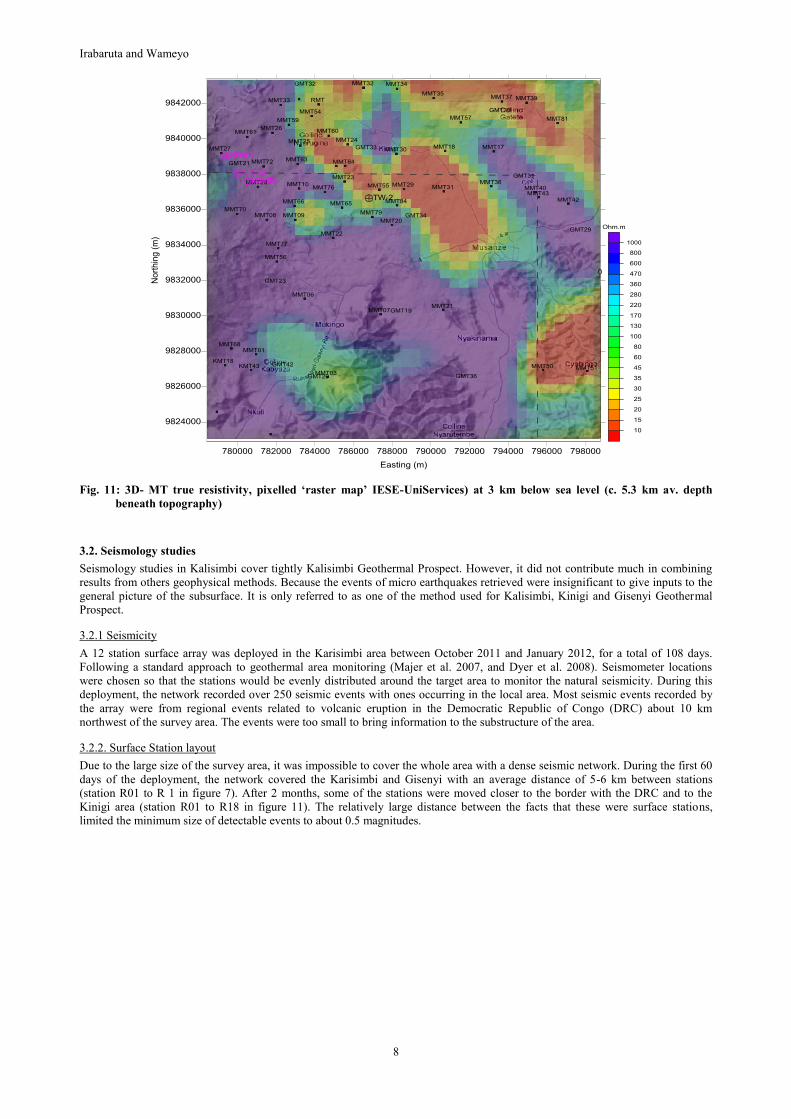
Fig. 11: 3D- MT true resistivity, pixelled ‘raster map’ IESE-UniServices) at 3 km below sea level (c. 5.3 km av. depth
beneath topography)
3.2. Seismology studies
Seismology studies in Kalisimbi cover tightly Kalisimbi Geothermal Prospect. However, it did not contribute much in combining
results from others geophysical methods. Because the events of micro earthquakes retrieved were insignificant to give inputs to the
general picture of the subsurface. It is only referred to as one of the method used for Kalisimbi, Kinigi and Gisenyi Geothermal
Prospect.
3.2.1 Seismicity
A 12 station surface array was deployed in the Karisimbi area between October 2011 and January 2012, for a total of 108 days.
Following a standard approach to geothermal area monitoring (Majer et al. 2007, and Dyer et al. 2008). Seismometer locations
were chosen so that the stations would be evenly distributed around the target area to monitor the natural seismicity. During this
deployment, the network recorded over 250 seismic events with ones occurring in the local area. Most seismic events recorded by
the array were from regional events related to volcanic eruption in the Democratic Republic of Congo (DRC) about 10 km
northwest of the survey area. The events were too small to bring information to the substructure of the area.
3.2.2. Surface Station layout
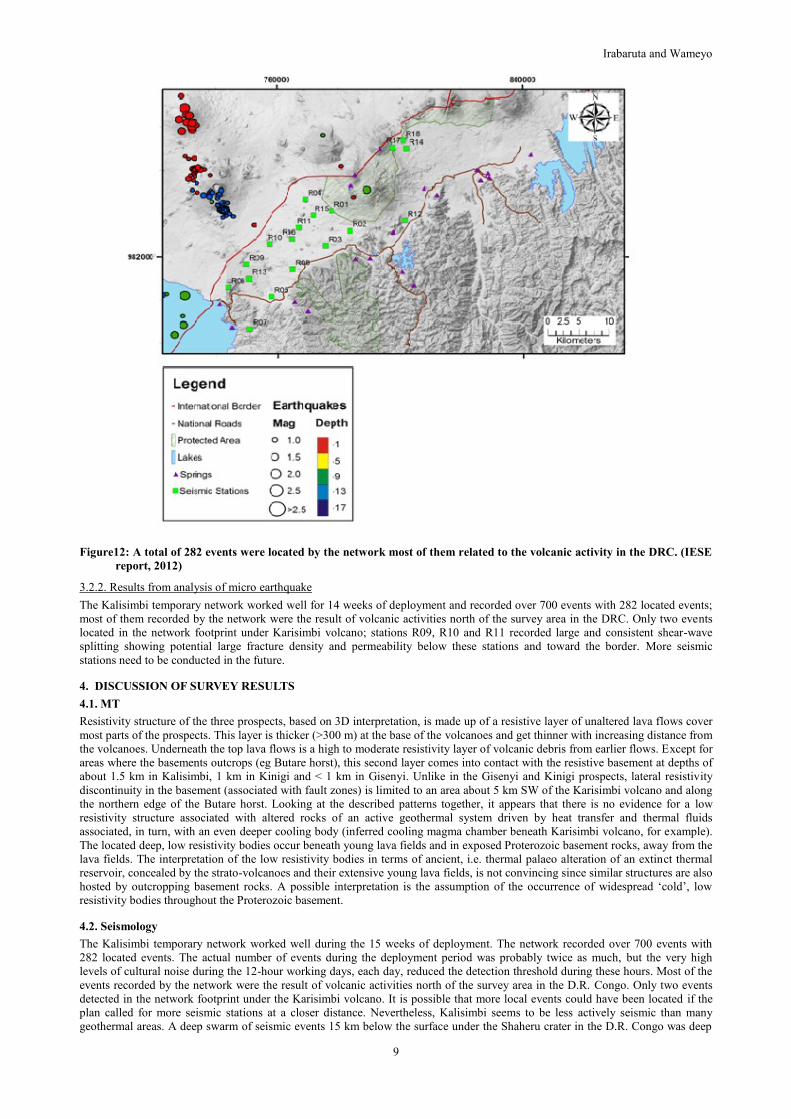
Due to the large size of the survey area, it was impossible to cover the whole area with a dense seismic network. During the first 60
days of the deployment, the network covered the Karisimbi and Gisenyi with an average distance of 5-6 km between stations
(station R01 to R 1 in figure 7). After 2 months, some of the stations were moved closer to the border with the DRC and to the
Kinigi area (station R01 to R18 in figure 11). The relatively large distance between the facts that these were surface stations,
limited the minimum size of detectable events to about 0.5 magnitudes.
Irabaruta and Wameyo
9
Figure12: A total of 282 events were located by the network most of them related to the volcanic activity in the DRC. (IESE
report, 2012)
3.2.2. Results from analysis of micro earthquake
The Kalisimbi temporary network worked well for 14 weeks of deployment and recorded over 700 events with 282 located events;
most of them recorded by the network were the result of volcanic activities north of the survey area in the DRC. Only two events
located in the network footprint under Karisimbi volcano; stations R09, R10 and R11 recorded large and consistent shear-wave
splitting showing potential large fracture density and permeability below these stations and toward the border. More seismic
stations need to be conducted in the future.
4. DISCUSSION OF SURVEY RESULTS
4.1. MT
Resistivity structure of the three prospects, based on 3D interpretation, is made up of a resistive layer of unaltered lava flows cover
most parts of the prospects. This layer is thicker (>300 m) at the base of the volcanoes and get thinner with increasing distance from
the volcanoes. Underneath the top lava flows is a high to moderate resistivity layer of volcanic debris from earlier flows. Except for
areas where the basements outcrops (eg Butare horst), this second layer comes into contact with the resistive basement at depths of
about 1.5 km in Kalisimbi, 1 km in Kinigi and < 1 km in Gisenyi. Unlike in the Gisenyi and Kinigi prospects, lateral resistivity
discontinuity in the basement (associated with fault zones) is limited to an area about 5 km SW of the Karisimbi volcano and along
the northern edge of the Butare horst. Looking at the described patterns together, it appears that there is no evidence for a low
resistivity structure associated with altered rocks of an active geothermal system driven by heat transfer and thermal fluids
associated, in turn, with an even deeper cooling body (inferred cooling magma chamber beneath Karisimbi volcano, for example).
The located deep, low resistivity bodies occur beneath young lava fields and in exposed Proterozoic basement rocks, away from the
lava fields. The interpretation of the low resistivity bodies in terms of ancient, i.e. thermal palaeo alteration of an extinct thermal
reservoir, concealed by the strato-volcanoes and their extensive young lava fields, is not convincing since similar structures are also
hosted by outcropping basement rocks. A possible interpretation is the assumption of the occurrence of widespread ‘cold’, low
resistivity bodies throughout the Proterozoic basement.
4.2. Seismology
The Kalisimbi temporary network worked well during the 15 weeks of deployment. The network recorded over 700 events with
282 located events. The actual number of events during the deployment period was probably twice as much, but the very high
levels of cultural noise during the 12-hour working days, each day, reduced the detection threshold during these hours. Most of the
events recorded by the network were the result of volcanic activities north of the survey area in the D.R. Congo. Only two events
detected in the network footprint under the Karisimbi volcano. It is possible that more local events could have been located if the
plan called for more seismic stations at a closer distance. Nevertheless, Kalisimbi seems to be less actively seismic than many
geothermal areas. A deep swarm of seismic events 15 km below the surface under the Shaheru crater in the D.R. Congo was deep
Irabaruta and Wameyo
10
enough and close enough that the stations closest to it were in the shear-wave window. Stations S09, S10 and S11 recorded large
and consistent shear-wave splitting. The most common cause for shear wave splitting (anisotropy) is aligned, near-vertical, fluid-
filled cracks and fractures. Therefore, these observations show potential large fracture density and permeability below these stations
and toward the Shaheru crater. The size of the delays and number of Summaries & Conceptual Model IESE - UniServices FINAL
REPORT for EWSA 21 observations were most noticeable in station R10 recording with an average of 12% anisotropy and
consistent fast shear-wave polarisation of 60 – 70 degrees azimuth.
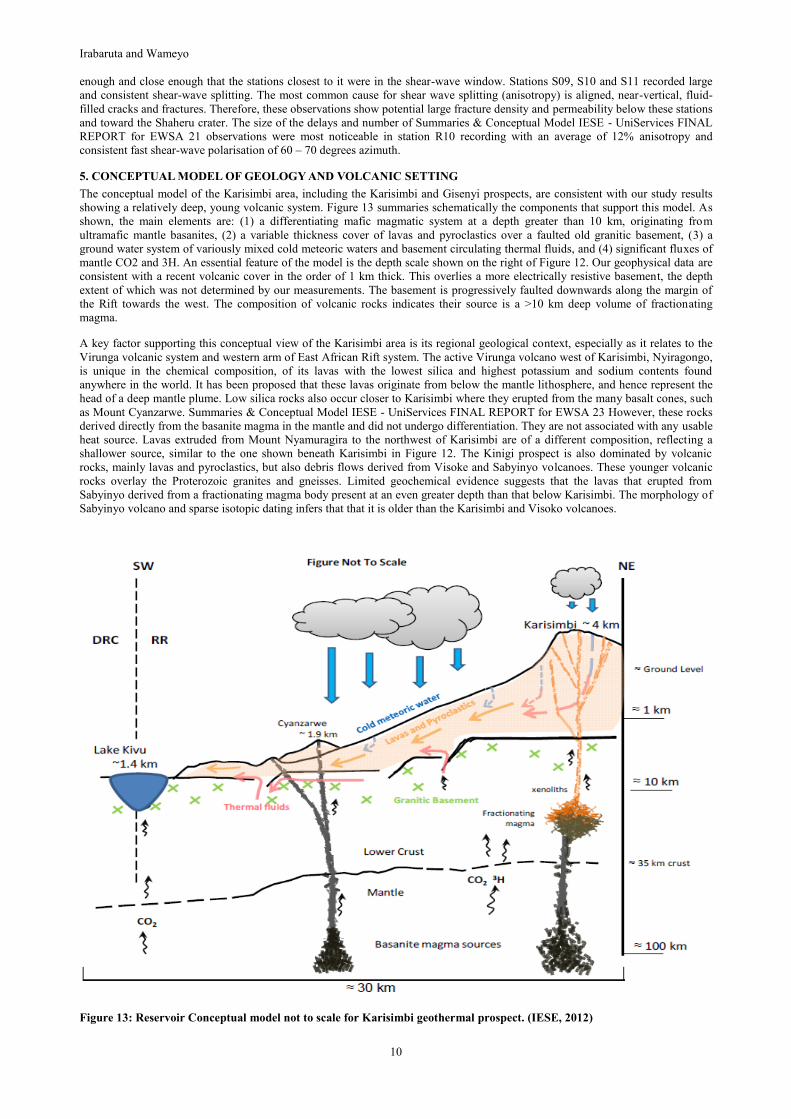
5. CONCEPTUAL MODEL OF GEOLOGY AND VOLCANIC SETTING
The conceptual model of the Karisimbi area, including the Karisimbi and Gisenyi prospects, are consistent with our study results
showing a relatively deep, young volcanic system. Figure 13 summaries schematically the components that support this model. As
shown, the main elements are: (1) a differentiating mafic magmatic system at a depth greater than 10 km, originating from
ultramafic mantle basanites, (2) a variable thickness cover of lavas and pyroclastics over a faulted old granitic basement, (3) a
ground water system of variously mixed cold meteoric waters and basement circulating thermal fluids, and (4) significant fluxes of
mantle CO2 and 3H. An essential feature of the model is the depth scale shown on the right of Figure 12. Our geophysical data are
consistent with a recent volcanic cover in the order of 1 km thick. This overlies a more electrically resistive basement, the depth
extent of which was not determined by our measurements. The basement is progressively faulted downwards along the margin of
the Rift towards the west. The composition of volcanic rocks indicates their source is a >10 km deep volume of fractionating
magma.
A key factor supporting this conceptual view of the Karisimbi area is its regional geological context, especially as it relates to the
Virunga volcanic system and western arm of East African Rift system. The active Virunga volcano west of Karisimbi, Nyiragongo,
is unique in the chemical composition, of its lavas with the lowest silica and highest potassium and sodium contents found
anywhere in the world. It has been proposed that these lavas originate from below the mantle lithosphere, and hence represent the
head of a deep mantle plume. Low silica rocks also occur closer to Karisimbi where they erupted from the many basalt cones, such
as Mount Cyanzarwe. Summaries & Conceptual Model IESE - UniServices FINAL REPORT for EWSA 23 However, these rocks
derived directly from the basanite magma in the mantle and did not undergo differentiation. They are not associated with any usable
heat source. Lavas extruded from Mount Nyamuragira to the northwest of Karisimbi are of a different composition, reflecting a
shallower source, similar to the one shown beneath Karisimbi in Figure 12. The Kinigi prospect is also dominated by volcanic
rocks, mainly lavas and pyroclastics, but also debris flows derived from Visoke and Sabyinyo volcanoes. These younger volcanic
rocks overlay the Proterozoic granites and gneisses. Limited geochemical evidence suggests that the lavas that erupted from
Sabyinyo derived from a fractionating magma body present at an even greater depth than that below Karisimbi. The morphology of
Sabyinyo volcano and sparse isotopic dating infers that that it is older than the Karisimbi and Visoko volcanoes.
Figure 13: Reservoir Conceptual model not to scale for Karisimbi geothermal prospect. (IESE, 2012)
Irabaruta and Wameyo
11
6. CONCLUSION
Most of the events recorded by the network were the result of volcanic activities north of the survey area in the D.R. Congo. Only
two events detected in the network footprint under Karisimbi volcano. It is possible that more local events could have been located
if the plan called for more seismic stations at a closer distance. Nevertheless, Kalisimbi seems to be less actively seismic than many
geothermal areas. A deep swarm of seismic events 15 km below the surface under the Shaheru crater in the DRC was deep enough
and close enough that the stations closest to it were in the shear-wave window. Stations S09, S10 and S11 recorded large and
consistent shear wave splitting. The most common cause for shear wave splitting (anisotropy) is aligned, near-vertical, fluid-filled
cracks and fractures. Therefore, these observations show potential large fracture density and permeability below these stations and
toward the Shaheru crater. The size of the delays and number of observations were most noticeable in station R10 recording with an
average of 12% anisotropy and consistent fast shear-wave polarisation of 60 – 70 degrees azimuth.
Pre-Paleozoic gneissic and granitic rocks cover the South half of the North Rwanda prospects; they also outcrop in the North
foothills of the Virunga Range volcanoes in Uganda and further north where they constitute part of the East shoulder of the West
rift. It can be assumed that Pre-Paleozoic rocks are continuous beneath the Virunga volcanoes and their lava fields. This implies
that all deep, low resistivity bodies detected and inferred by interpretations of MT soundings over the Virunga prospect are hosted
by Proterozoic rocks which exhibit rather ‘high’ resistivities of > 1,000 ohm m over stretches of gneissic and granitic outcrops in
the South half of the prospect area. Occurrence of deep low resistivity basement rocks reflects some palaeo alteration of extinct
thermal systems cannot be excluded. Other conductance mechanism can also explain the occurrence of low resistivity rocks in
metamorphic basement rocks. Thin graphite layers within a set of shear zones can produce steeply dipping, low resistivity
anomalies with apparent ‘plume’ structures as has been observed in the vicinity of a 9 km deep continental test hole in Germany.
Viable electric conductance mechanisms which could explain the deep seated low resistivity rocks in the Virunga prospect appear
to be conductive clays of inferred extinct geothermal system or linings of highly conductive graphite along metamorphic shear
zones. In both cases the resultant low resistivity structures would not be associated with an anomalous thermal structure.
ACKNOWLDGEMENT
It is with great privilege we would like to thank the Government of Rwanda for taking Geothermal Resource Exploration
Programme to another stage. To the World Geothermal Congress Organizers, we thank you for choosing this paper to appear in the
proceedings of this World event.
We would like to thank Mr. Peter Wameyo for the courage and commitment he carried to the present work. His advice throughout
is highly appreciated. Our Thanks go also to Mrs. Uwera Rutagarama; Head of Geothermal Project; for her tireless courage to make
geothermal exploration programme a success. To the geothermal team in Rwanda that participated along IESE experts in the latest
data collection, we thank you.
REFERENCES
BGR, 2009: Geothermal Potential Assessment in the Virunga Geothermal Prospect, Northern Rwanda.
Report - GEOTHERM I; Egbert Jolie, Richard Gloaguen, Peter Wameyo, Halldór Ármannsson, Pedro A. Hernández Pérez August
1, 2009.
Demant, A., Lestrade, P., Lubala, R.T., Kampunzu, A.B., Durieux, J., 1994. Volcanological
and petrological evolution of Nyiragongo volcano, Virunga volcanic field, Zaire.
Denaeyer, M.E., 1968. Nouvelles donnees lithologiques sur les volcans actifs des Virunga
(Afrique Centrale).
Foley, S., 2005. Volcanism in the East African Rift, International Conference, Palais des Academies, Bruxelles.
IESE Report : Electromagnetic Survey in NW Rwanda, 2012
Phoenix Geophysics, 2003. V5 System 2000 MTU/MTU-A User Guide.
Majer, E.L., and McEvilly, T.V., 1979: Seismological investigations at The Geysers geothermal field. Geophysics, 44, 246-269.
Search, J. 2011. Nyamuragira Volcano. Volcano Live. Retrieved from http://www.volcanolive.com/nyamuragira.html