Embed Size (px)
Citation preview
GEOPHYSICAL FACTORS AFFECTING PLANT PRODUCTIVITY
David M. GatesHyrum B. JohnsonConrad S. YocumPaul W. Lommen
Missouri Botanical GardenSt. Louis, ilissouri 63110
THis dr'xnmerit has beon cqapruwuIoiT p~ibh re&cwe cd sale; 1"11
(2truonis 'unIAntod
CLEARINGHOUSE
for Fýý I'- l I I,-n , & 'P'f T , .

Gates, D. 1t., 1H. B. Johnson, C. S. Yocum and P. W. Lommen.
Geophysical Factors Affecting Plant Productivity.
Proc. International Symposium "Productivity of
Photosynthetic Systems." Part II: Theoretical
foundations of optimization of the photosynthetic
productivity. dioscow, U. S. S. R. September 1969.
(In Press).
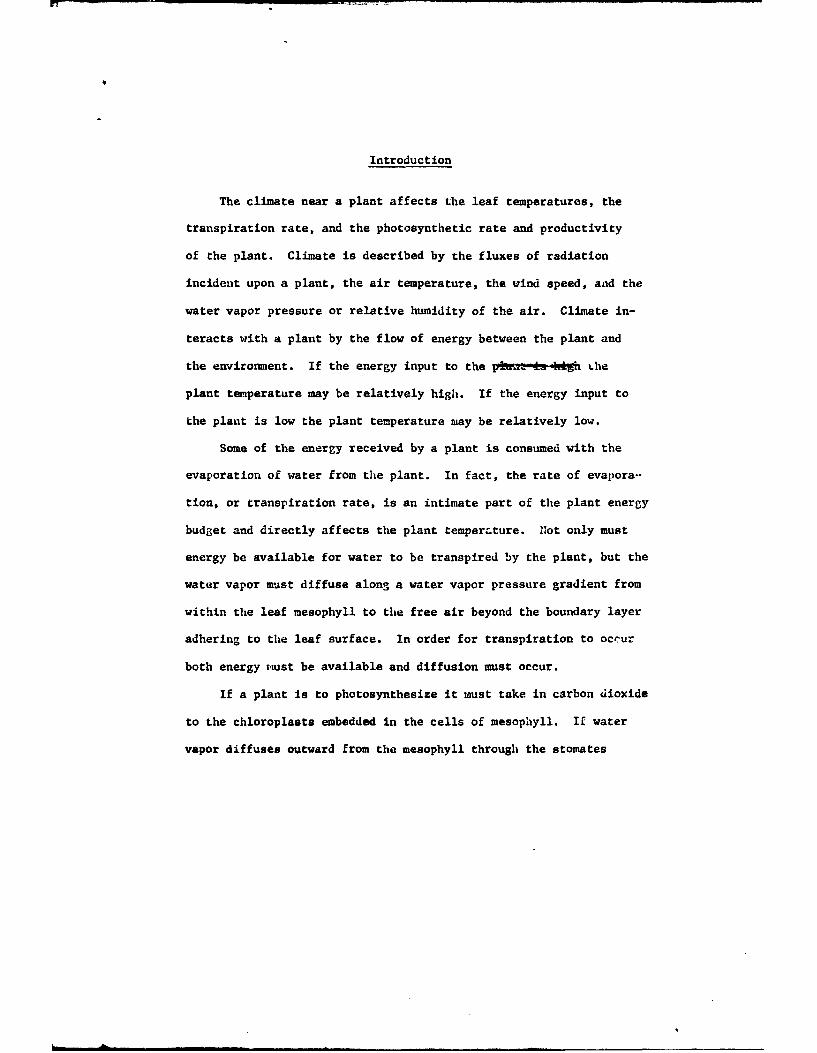
Introduction
The climate near a plant affects the leaf temperatures, the
transpiration rate, and the photosynthetic rate and productivity
of the plant. Climate is described by the fluxes of radiation
incident upon a plant, the air temperature, the wind speed, and the
water vapor pressure or relative humidity of the air. Climate in-
teracts with a plant by the flow of energy between the plant and
the environment. If the energy input to the P*Me-'4fh dhe
plant temperature may be relatively high. If the energy input to
the plant is low the plant temperature may be relatively low.
Some of the energy received by a plant is consumed with the
evaporation of water from the plant. In fact, the rate of evapora-
tion, or transpiration rate, is an intimate part of the plant energy
budget and directly affects the plant temperLture. Not only must
energy be available for water to be transpired by the plant, but the
water vapor must diffuse along a water vapor pressure gradient from
within the leaf mesophyll to the free air beyond the boundary layer
adhering to the leaf surface. In order for transpiration to occur
both energy nust be available and diffusion must occur.
If a plant is to photosynthesize it must take in carbon dioxide
to the chloroplasts embedded in the cells of mesophyll. If water
vapor diffuses outward from the mesophyll through the stomates
-2-
then carbon dioxide may diffuse inward through the stomates to the
mesophyll and the chloroplasts. The rate of diffusion of carbon
dioxide into the mesophyll depends upon the existence of a vapor pres-
sure gradient of carbon dioxide from the air to the chloroplasts with-
in the leaf. However, the concentration of carbon dioxide at the
chloroplasts depends upon the relative rates of photosynthesis and
respiration by the chloroplasts. The rate of respiration is a func-
tion of leaf temperature and somewhat a function of the amount of
light. The rate of photosynthesis is a function of leaf temperature
and of light quality and quantity at the chloroplasts.
Productivity, or the assimilation of carbon dioxide by the plant
which involves the fixation of carbon dioxide to glucose phosphate,
depends upon the leaf temperature, upon the amount of light, and upon
the diffusion of carbon dioxide into the leaf. hence, the energy
budget of the leaf and the gas diffusion of water vapor, carbon dioxide,
and oxygen must all occur in a self consistent manner such that one
process does not contradict another. It is the purpose here to de-
scribe the manner in which the environment or climate of a plant leaf
affects the productivity of the plant through the exchange of energy
and the diffusion of gases.
-3-
Energy Exchange
Energy is transferred to and from a plant leaf by radiation,
convection, and transpiration. The processes of energy exchange
for a plant leaf have been discussed in detail by Gates (1968).
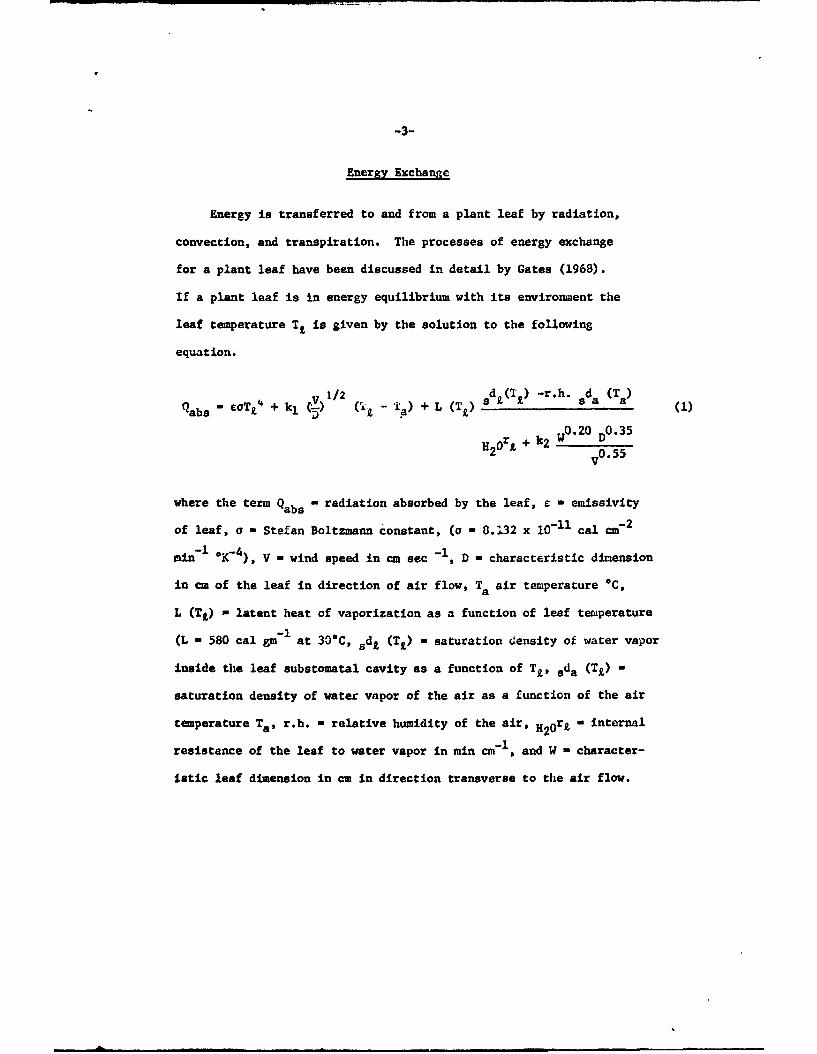
If a plant leaf is in energy equilibrium with its environment the
leaf temperature TZ is given by the solution to the following
equation.
(1/( Ta)+L (T) dkI) -r.h. sda (1)
SW0.20 D0.35H20ri +k2WVo0 . 5 5
where the term Qabs " radiation absorbed by the leaf, e - emissivity
of leaf, a - Stefan Boltzmann constant, (a - 8.132 x 10⁻¹¹ cal cm 2
min-l C4) V - wind speed in cm sec -1, D - characteristic dimension
in cm of the leaf in direction of air flow, Ta air temperature °C,
L (Td) - latent heat of vaporization as a function of leaf temperature
(L - 580 cal gm-1 at 30-C, sd, (Ti) - saturation density of water vapor
inside the leaf substomatal cavity as a function of Ti, sda (TI) -
saturation density of water vapor of the air as a function of the air
temperature Ta, r.h. - relative humidity of the air, H2Or, - internal
resistance of the leaf to water vapor in min cm- 1 , and W - character-
istic leaf dimension in cm in direction transverse to the air flow.
Each term in Eqn. (1) is expressed in cal cm-2 min-' and the coef-
ficients are all defined such that each term comes out in these units.
The followvig values were obtained for k and k2 from careful measure-
ments of leaves in a wind tunnel.
If W>D or W-D>5 cm or D>10 cm kI . lxlO- 3 k2 - 35x,0 3
if W<D<lcm or W=D<5 cm kI a 16.2x10³ k2 - 26x103
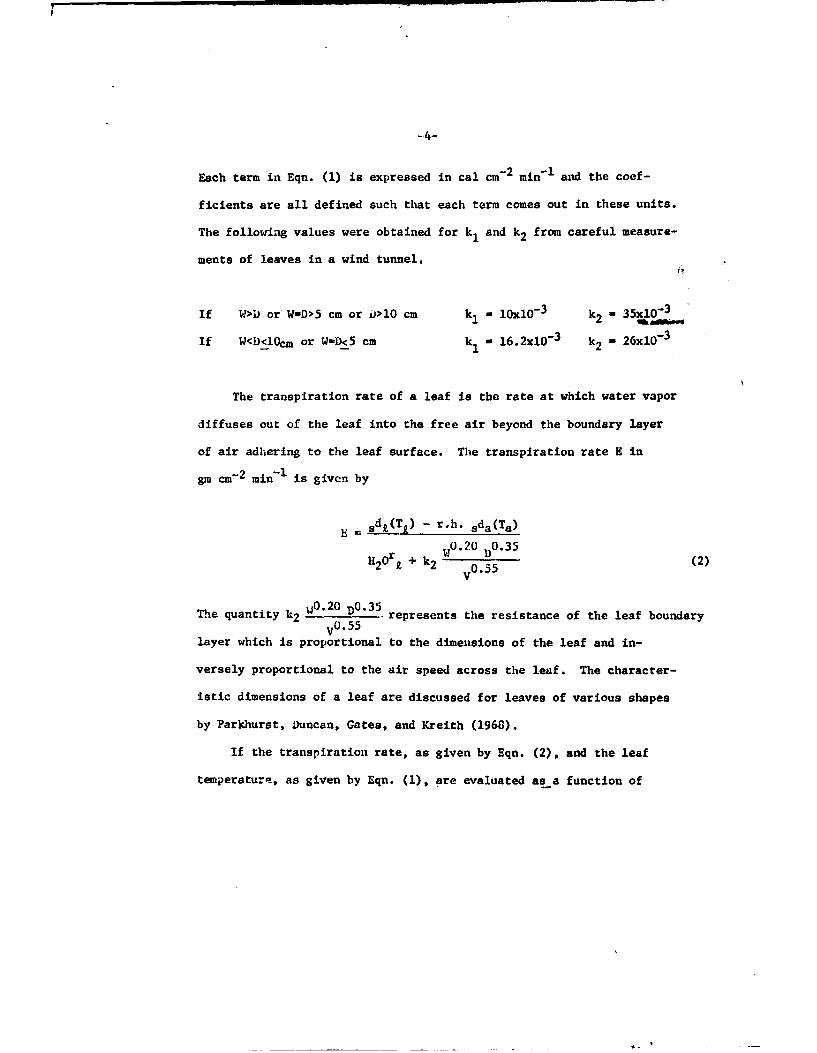
The transpiration rate of a leaf is the rate at which water vapor
diffuses out of the leaf into the free air beyond the boundary layer
of air adhering to the leaf surface. The transpiration rate E ingm cm- 2 min- is given by
sdX(Tk) - r.h. sda(Ta)
W0 . 2 0 D0. 3 5 (2)120 + 2 0.55
The quantity k2 W0.20 D0 .35 represents the resistance of the leaf boundaryV 0.55
layer which is proportional to the dimensions of the leaf and in-
versely proportional to the air speed across the leaf. The character-
istic dimensions of a leaf are discussed for leaves of various shapes
by Parkhurst, Duncan, Gates, and Kreith (1968).
If the transpiration rate, as given by Eqn. (2), and the leaf
temperature, as given by Eqn. (1), are evaluated asa function of
-5-
Qabs' Ta, r.h., V, and H2Ort one can express the results in various
graphical forms. One such form is to plot the dependent variables
of transpiration rate and leaf temperature as a function of air
temperature and leaf resistance as shown in Fig. 1 or as a function
of wind speed and leaf resistance as shown in Fig. 2. Other relations
could be shown and are discussed by Gates (1968).
Carbon Dioxide Diffusion
In order for a plant to photosynthesize carbon dioxide must
diffuse from the air into the leaf mesophyll through the stomates.
Lowever, in addition to the pathway for water vapor from the sub-
stomatal cavity through the stomate and boundary layer of adhering
air, carbon dioxide diffusing into the leaf to the chloroplasts
must diffuse through the cell walls and cellular cytoplasm. There-
fore there is additional resistance for the passage of carbon
dioxide into the leaf than there is to water vapor passing out of
the leaf. For the same pathway the ratio of resistance for carbon
dioxide to resistance for water vapor is approximately inversely
proportional to the ratio of the diffusion coefficients. The dif-
fusion coefficient for water vapor in air is approximately 0.24
cm-2 sec-1 and for carbon dioxide in air is approximately 0.14 ci-2
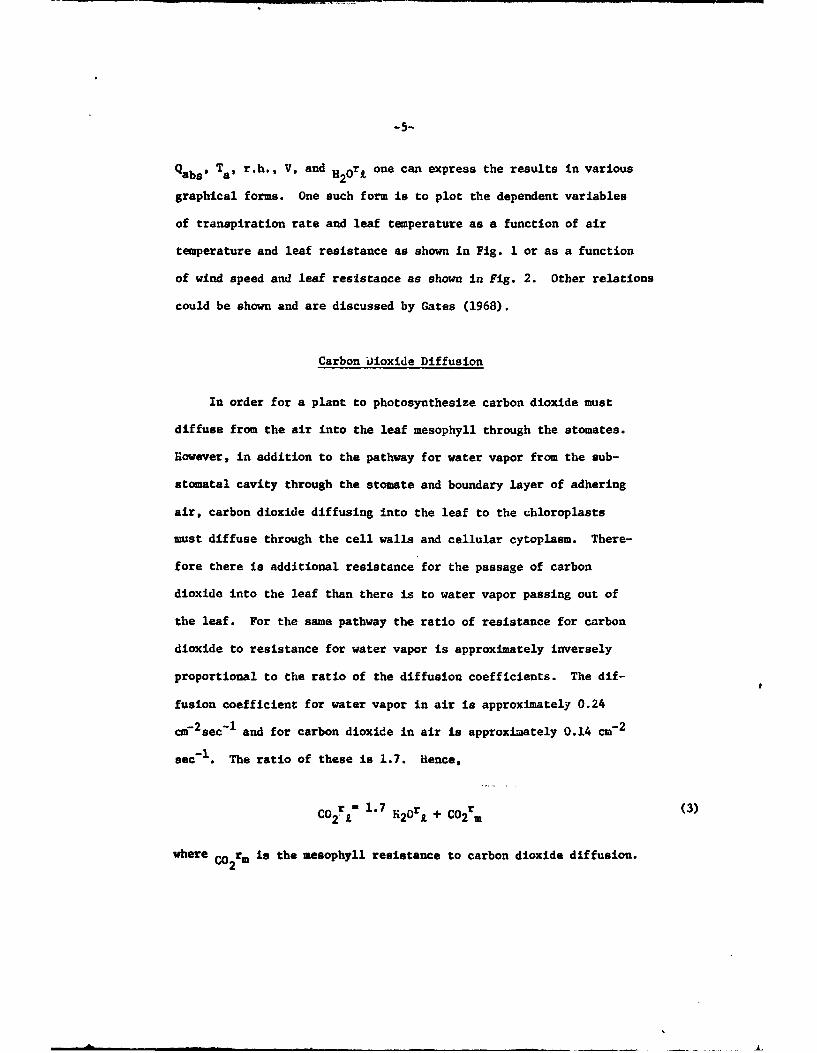
sec-1. The ratio of these is 1.7. Hence,
COr 1.7 o,+ r(3)
C02 r . K2 0rL + C02 rm
where C02rm is the mesophyll resistance to carbon dioxide diffusion.
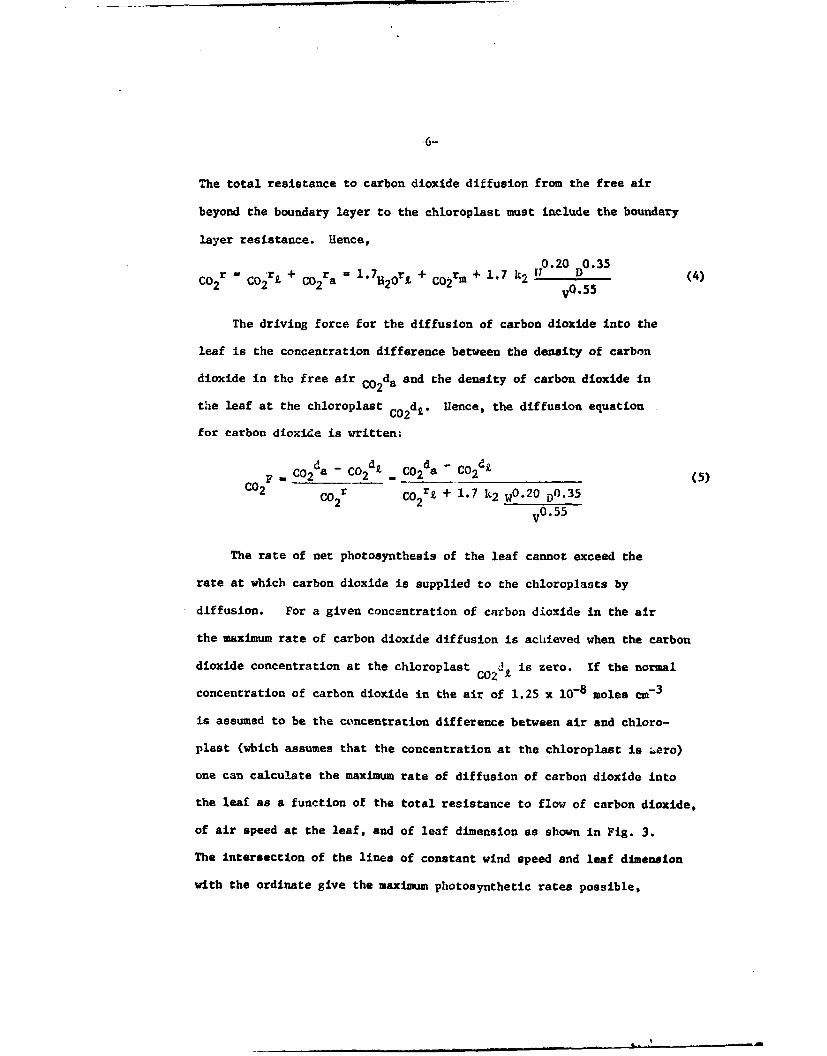
The total resistance to carbon dioxide diffusion from the free air
beyond the boundary layer to the chloroplast must include the boundary
layer resistance. Hence,
r+0.20 D 0.35C02r c0 2rt + C02 a H 1 20 rt + C0 2rm÷ 1.7 k2 Y V455
The driving force for the diffusion of carbon dioxide into the
leaf is the concentration difference between the density of carbon
dioxide in the free air Co 2 da and the density of carbon dioxide in
the leaf at the chloroplast c02 d,. Hence, the diffusion equation
for carbon dioxide is written;
F - C02 da - Co2d- CO2da - CO2 d£ (5)CO2 C0 2 r cork + 1.7 k2 WO. 2 0 0.35
V 0.55
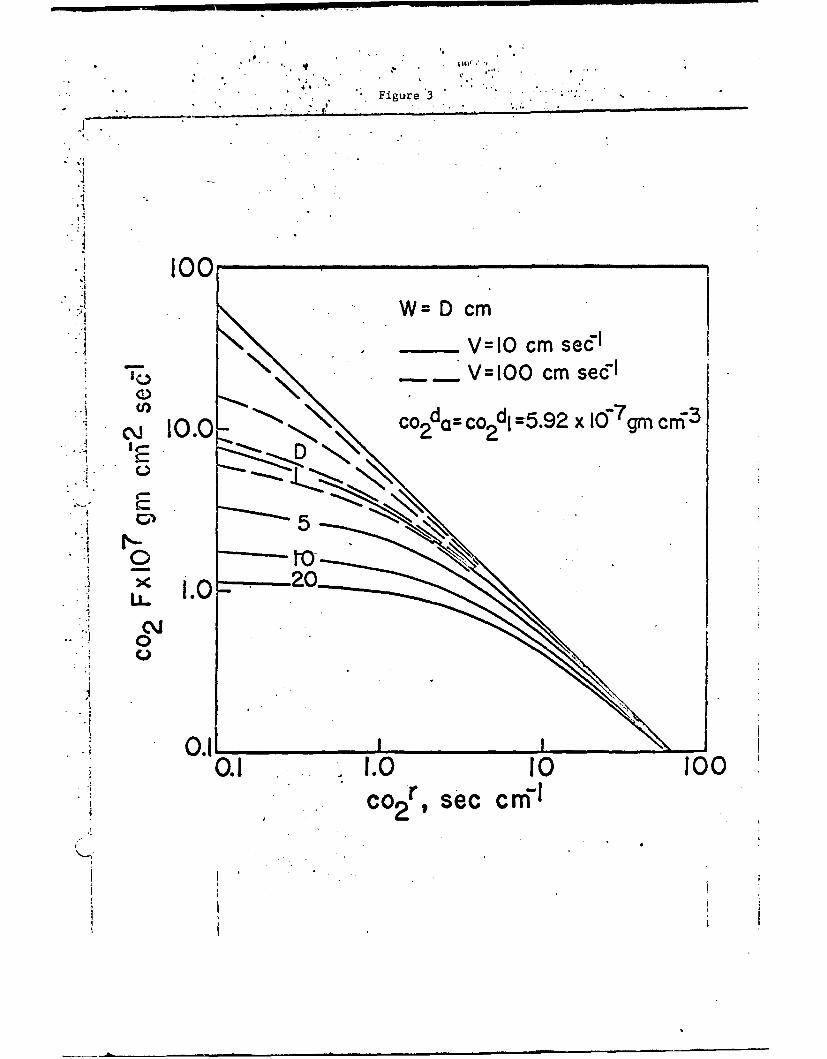
The rate of net photosynthesis of the leaf cannot exceed the
rate at which carbon dioxide is supplied to the chloroplasts by
diffusion. For a given concentration of carbon dioxide in the air
the maximum rate of carbon dioxide diffusion is achieved when the carbon
dioxide concentration at the chloroplast Cd is zero. If the normal
concentration of carbon dioxide in the air of 1.25 x 10⁻⁸ moles cm-3
is assumed to be the concentration difference between air and chloro-
plast (which assumes that the concentration at the chloroplast is •.ero)
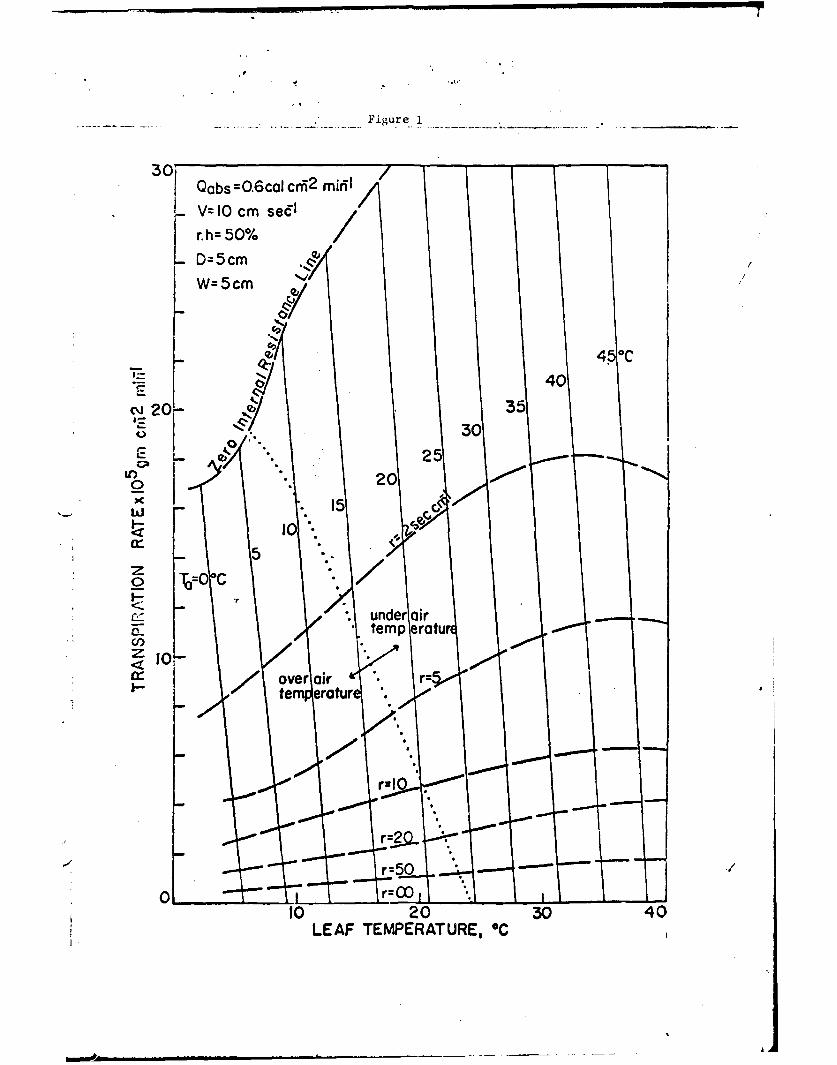
one can calculate the maximum rate of diffusion of carbon dioxide into
the leaf as a function of the total resistance to flow of carbon dioxide,
of air speed at the leaf, and of leaf dimension as shown in Fig. 3.
The intersection of the lines of constant wind speed and leaf dimension
with the ordinate give the maximum photosynthetic rates possible,
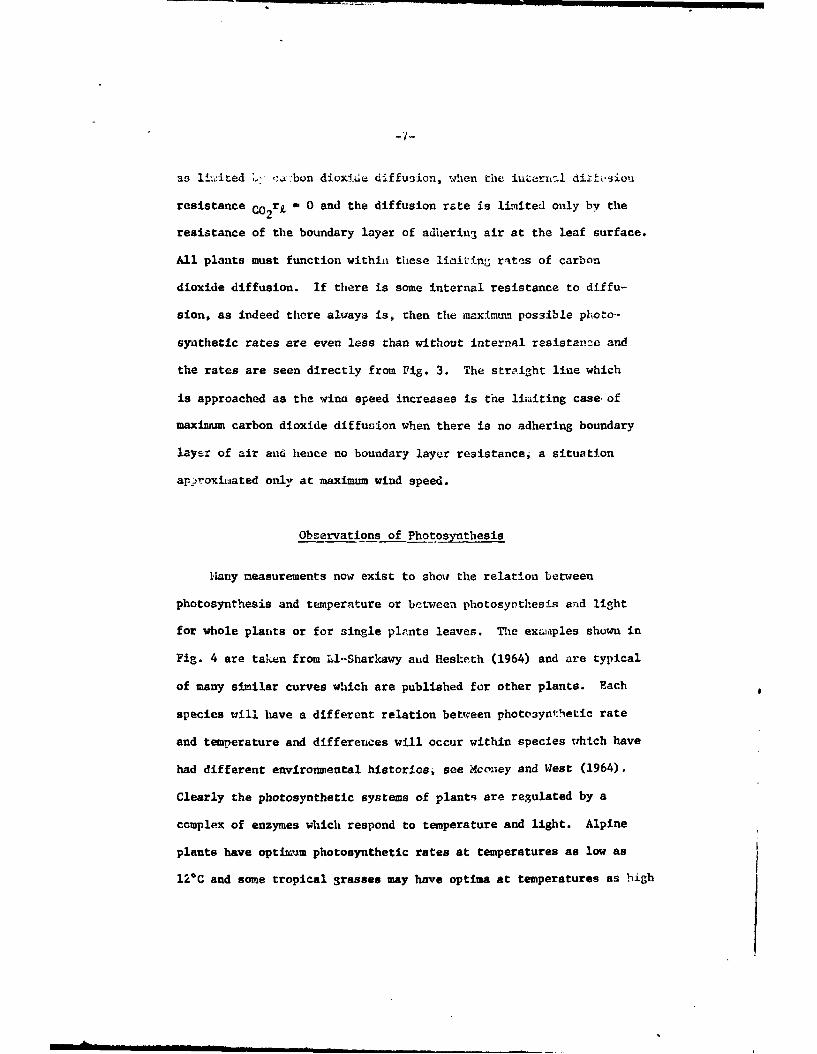
as liL]ted L-.x-.bon dioxi"-e diffusion, when the inierxi~l dizio,•iou
resistance C02r' - 0 and the diffusion rate is linited only by the
resistance of the boundary layer of adherin- air at the leaf surface.
All plants must function within these limiting rates of carbon
dioxide diffusion. If there is some internal resistance to diffu-
sion, as indeed there always is, then the maximum possible photo-
synthetic rates are even less than without internal resistance and
the rates are seen directly from Fig. 3. The straight line which
is approached as the wind speed increases is the limiting case of
maximum carbon dioxide diffusion when there is no adhering boundary
layer of air aud hence no boundary layer resistance, a situation
apiroxinated only at maximum wind speed.
Observations of Photosynthesis
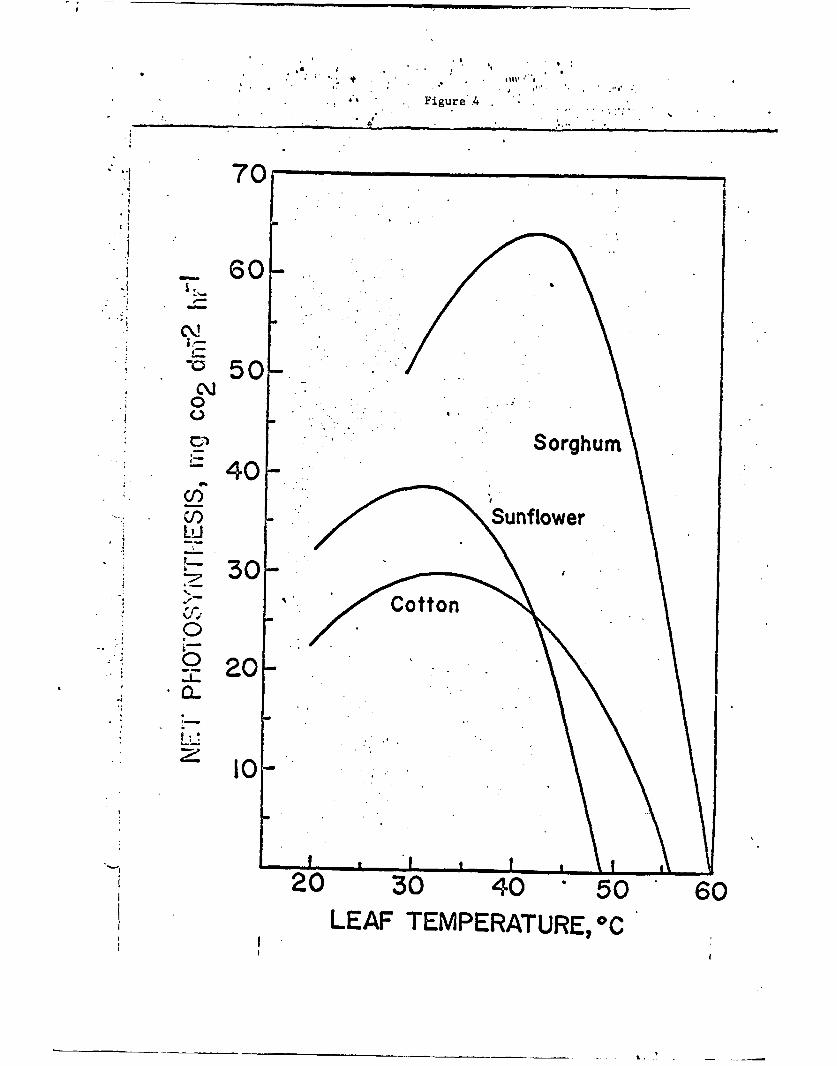
Hany measurements now exist to show the relation between
photosynthesis and temperature or between photosynthesis and light
for whole plants or for single plants leaves. The examples shown in
Fig. 4 are taken from Ul--Sharkawy aud Hesl-eth (1964) and are typical
of many similar curves which are published for other plants. Each
species will have a different relation between photosynthetic rate
and temperature and differences will occur within species which have
had different environmental historiesi see mcoey and West (1964).
Clearly the photosynthetic systems of plants are regulated by a
complex of enzymes which respond to temperature and light. Alpine
plants have optimum photosynthetic rates at temperatures as low as
12*C and some tropical grasses may have optima at temperatures as high
as 400C. Some higher plants will cease photosynthesis at temperatures
between 40 and 45*C while some will photosynthesize at temperatures up to
60*C. Brock (1967) indicates that there seems to be a definite upper
limit to photosynthetic life at a temperature of about 75*C for procaryotic
algae. Some bacteria continue to live at temperatures as high as 90*C,
see Bott and Brock (1969). It is suggested that organisms do not evolve
proteins which are much more stable than they need to be for the
environmental conditions encountered by the organism. .4 2.#s-t.
seems that aLl organism will have optimum photosynthesis at a tempera-
ture compatible for the upper limit for growth.
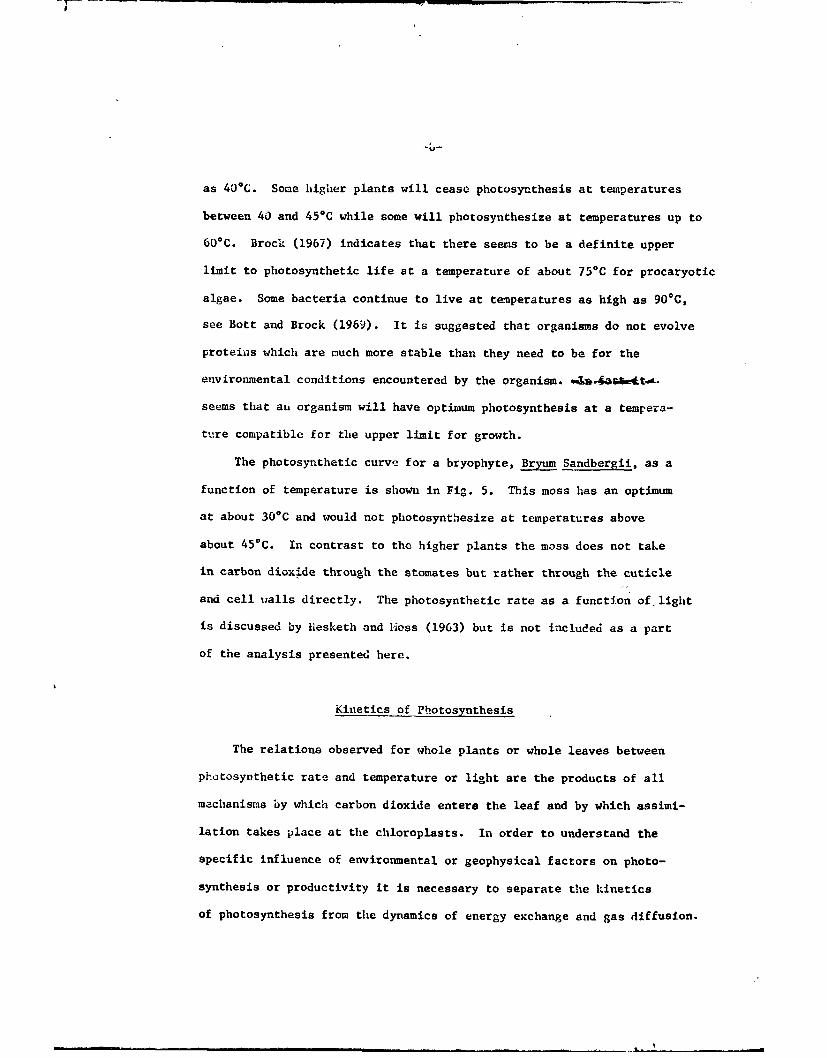
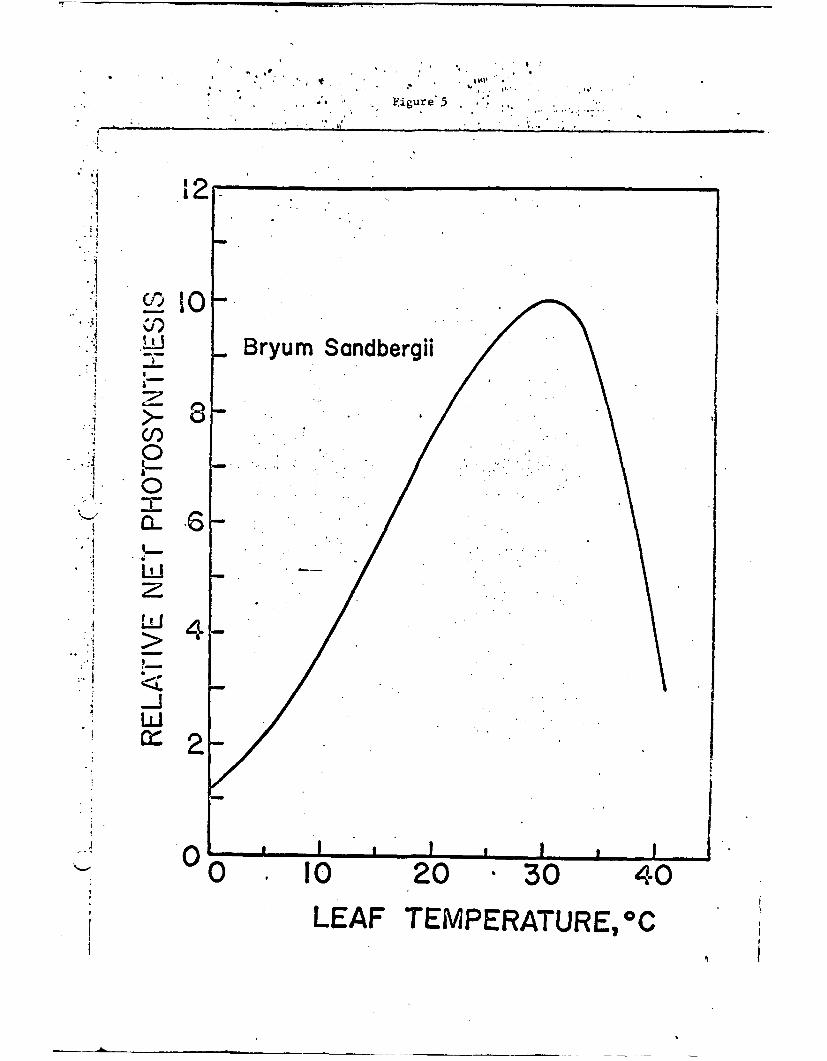
The photosynthetic curve for a bryophyte, Bryum Sandbergii, as a
function of temperature is shown in Fig. 5. This moss has an optimum
at about 30C and would not photosynthesize at temperatures above
about 45°C. In contrast to the higher plants the moss does not take
in carbon dioxide through the stomates but rather through the cuticle
and cell walls directly. The photosynthetic rate as a function of light
is discussed by liesketh and Ioss (1963) but is not included as a part
of the analysis presented here.
Kinetics of Photosynthesis
The relations observed for whole plants or whole leaves between
photosynthetic rate and temperature or light are the products of all
machanisms by which carbon dioxide enters the leaf and by which assimi-
lation takes place at the chloroplasts. In order to understand the
specific influence of environmental or geophysical factors on photo-
synthesis or productivity it is necessary to separate the kinetics
of photosynthesis from the dynamics of energy exchange and gas diffusion.

-9-
It is well known that many enzyme catalyzed chemical reac-
tions proceed according to the A-ichaelis-Menton Equation which
describes the rate of reaction as a function of substrate concentra-
tion. Hence, if P is the photosynthetic rate, Pm is the maximum
photosyntheti' rate possible, and c02dZ is the concentration of carbon
dioxide at tl.e chloroplastR, then:
p PL-1 (6)K
1+c02d Y
whPre K is the Michaelis constant for the rate of reaction.
If the gas diffusion equation is written:
C02da - C029.(
rC02
Hence,
r~u -d(8)
C02 r P C02da C02 d9.
ord - da - r P (9)
C02 L Z 02 a
Substituting this into Eqn. 6 one obtains
e- P'a (10)
O+ c02da - r P
This is now a quadratic in P with two roots.
-10-
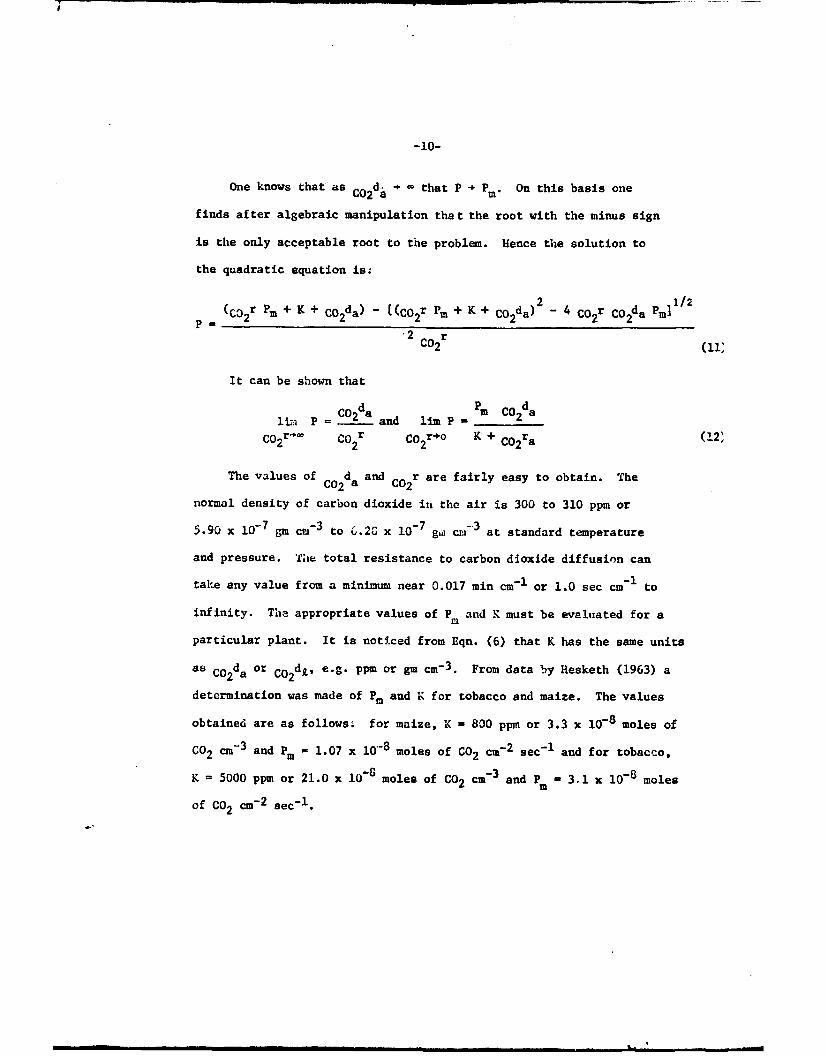
One knows that as c0 2 da O D that P - Pm. On this basis one
finds after algebraic manipulation that the root with the minus sign
is the only acceptable root to the problem. Hence the solution to
the quadratic equation is:
(CD2 r Pm + K + c02da) - [(C0 2r Pm + K + C02da) 2 - 4 Co2r CO2da Pm]l/2SC 2 r (11:
It can be shown that
SP =C02da and lim P - C
co~r)a C02r co2 r-o K + Co 2 ra (12"
The values of co2 da and C02r are fairly easy to obtain. Thenormal density of carbon dioxide in the air is 300 to 310 ppm or
5.90 x 10- 7 gm cm-3 to '.2G x 10-g cr 3 at standard temperature
and pressure. Thie total resistance to carbon dioxide diffusion can
take any value from a minimum near 0.017 min cm- 1 or 1.0 sec cm-I to
infinity. The appropriate values of PM and K must be evaluated for a
particular plant. It is noticed from Eqn. (6) that K has the same units
as co 2da or co2dt, e.g. ppm or gm cm- 3 . From data by Hesketh (1963) a
determination was made of Pm and K for tobacco and maize. The values
obtained are as follows: for maize, X - 800 ppm or 3.3 x 10⁻⁸ moles of
CO2 cm-3 and Pm - 1.07 x 10⁻⁸ moles of CO2 cm- 2 sec- 1 and for tobacco,
K = 5000 ppm or 21.0 x 10⁻⁸ moles of CO2 cm- 3 and Pm - 3.1 x 10⁻⁸ moles
of CO2 cm" 2 sec-1.
II -mom
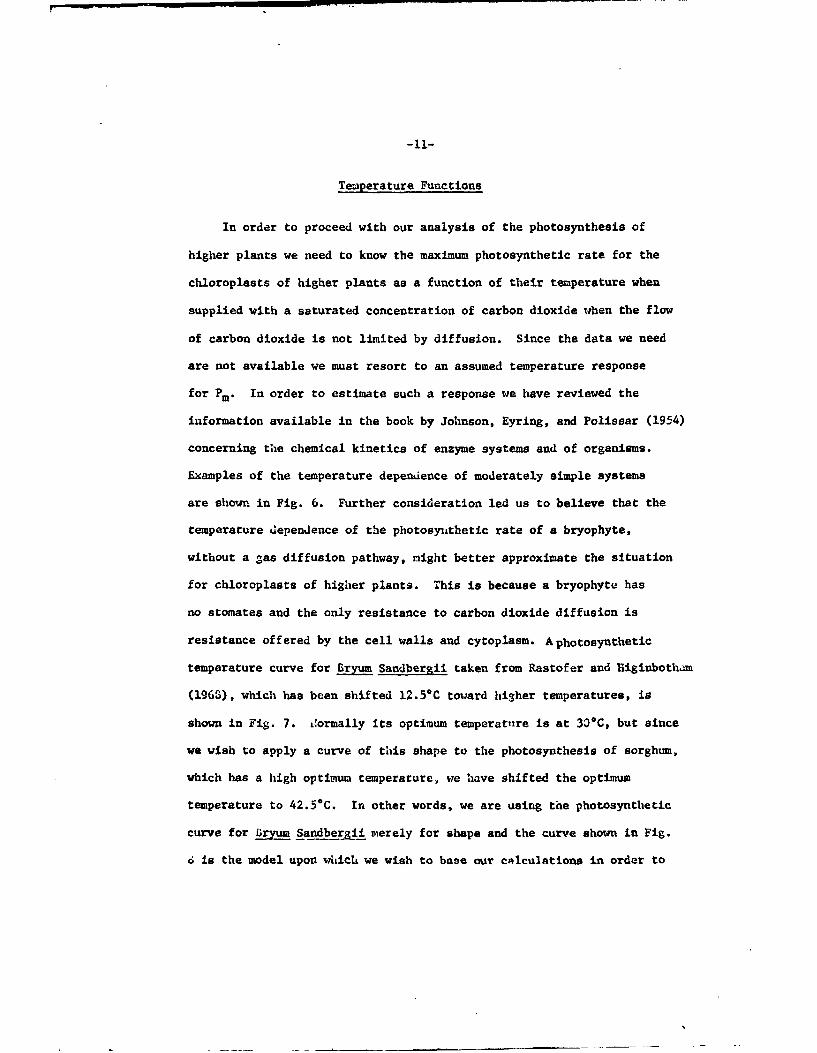
Temperature Functions
In order to proceed with our analysis of the photosynthesis of
higher plants we need to know the maximum photosynthetic rate for the
chloroplasts of higher plants as a function of their temperature when
supplied with a saturated concentration of carbon dioxide when the flow
of carbon dioxide is not limited by diffusion. Since the data we need
are not available we must resort to an assumed temperature response
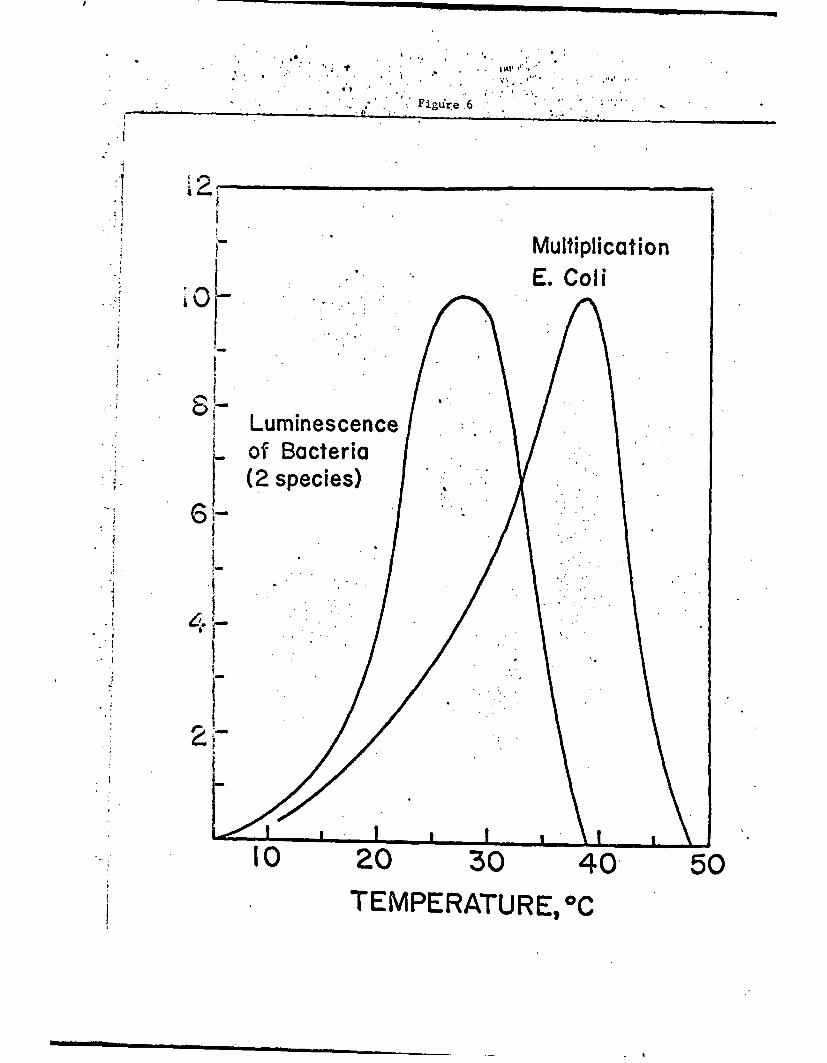
for Pm. In order to estimate such a response we have reviewed the
information available in the book by Johnson, Eyring, and Polissar (1954)
concerning the chemical kinetics of enzyme systems and of organisms.
Examples of the temperature dependence of moderately simple systems
are shown in Fig. 6. Further consideration led us to believe that the
temperature dependence of the photosynthetic rate of a bryophyte,
without a gas diffusion pathway, might better approximate the situation
for chloroplasts of higher plants. This is because a bryophyte has
no stomates and the only resistance to carbon dioxide diffusion is
resistance offered by the cell walls and cytoplasm. Aphotosynthetic
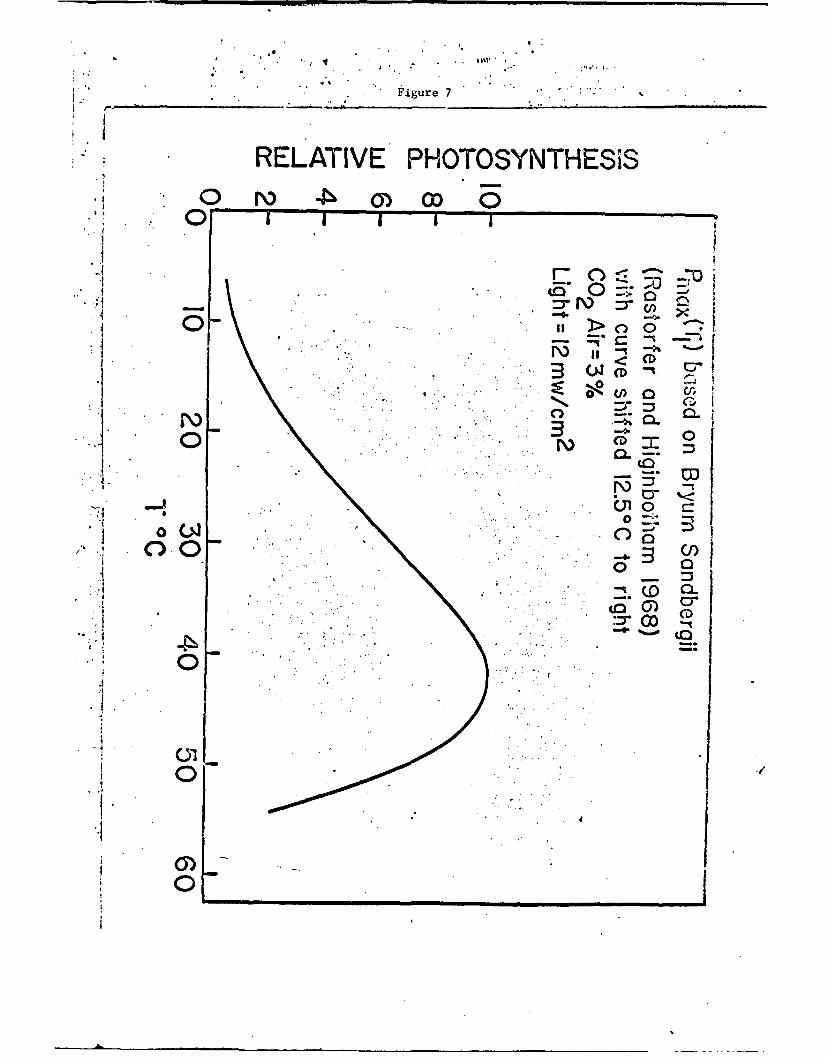
temperature curve for Bryum Sandbergii taken from Rastofer and Higinbotham
(196G), which has been shifted 12.5C toward hiSher temperatures, is
shown in Fig. 7. iaormally its optimum temperature is at 30*C, but since
we wish to apply a curve of this shape to the photosynthesis of sorghum,
which has a high optimum temperature, we have shifted the optimum
temperature to 42.5*C. In other words, we are using the photosynthetic
curve for bryum. Saggber&ii merely for shape and the curve shown in Fig.
o is the model upon which we wish to base our calculations in order to
-12-
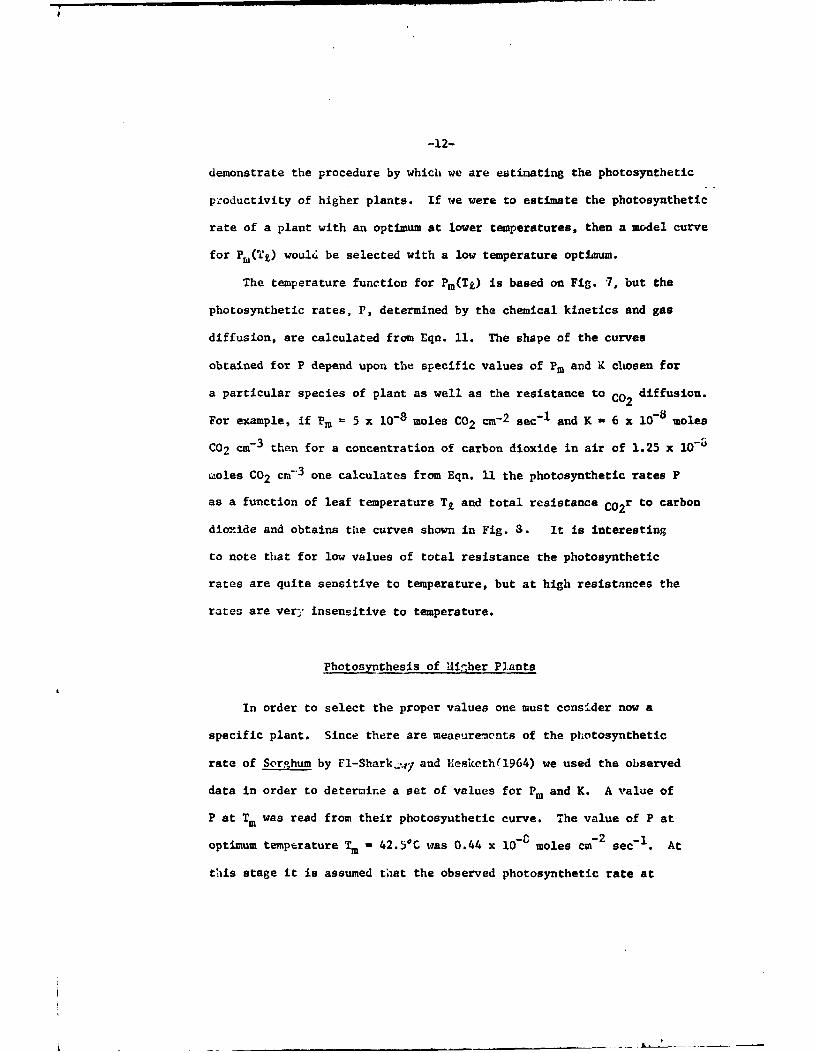
demonstrate the procedure by which we are estimating the photosynthetic
productivity of higher plants. If we were to estimate the photosynthetic
rate of a plant with an optimum at lower temperatures, then a model curve
for P (TO) would be selected with a low temperature optimum.
The temperature function for Pm(Tk) is based on Fig. 7, but the
photosynthetic rates, P, determined by the chemical kinetics and gas
diffusion, are calculated from Eqn. 11. The shape of the curves
obtained for P depend upon the specific values of Pm and K chosen for
a particular species of plant as well as the resistance to CO2 diffusion.
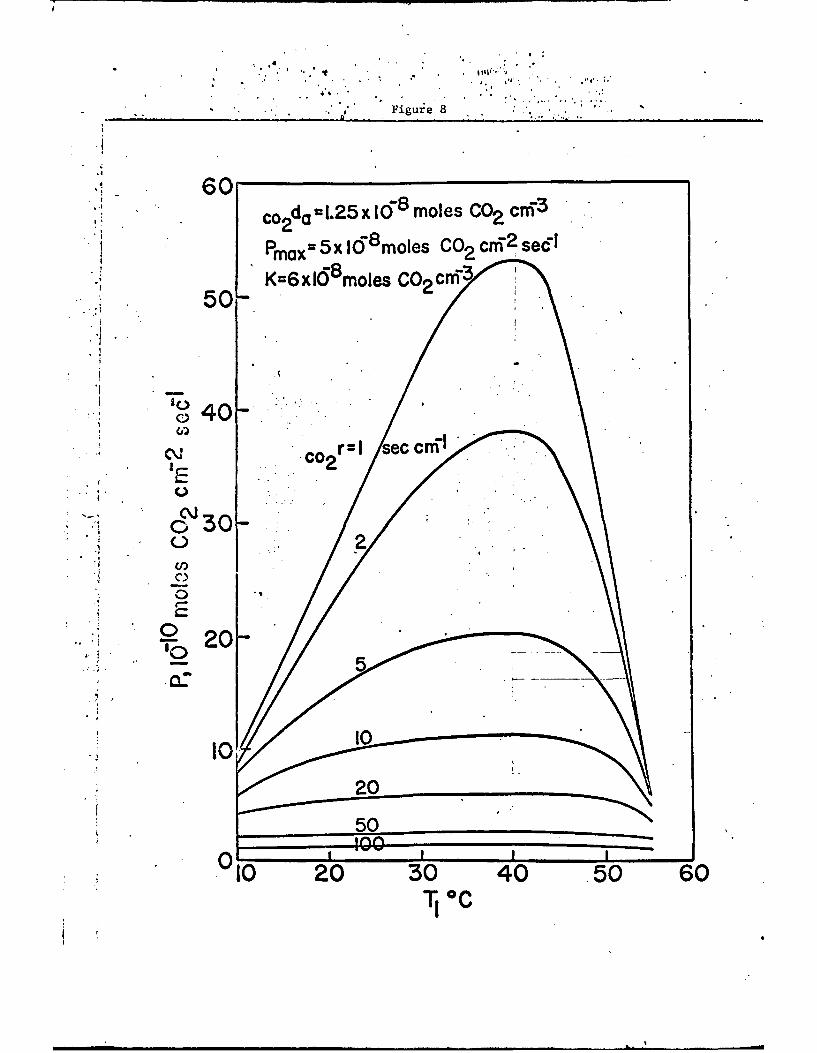
For example, if Pm = 5 x l0-8 moles CO2 cm- 2 sec-1 and K - 6 x 10⁻⁸ moles
C02 cm- 3 then for a concentration of carbon dioxide in air of 1.25 x 10⁻⁶
Loles CO2 cm 3 one calculates from Eqn. 11 the photosynthetic rates P
as a function of leaf temperature Ti and total resistance CO2 r to carbon
dioxide and obtains the curves shown in Fig. 3. It is interesting
to note that for low values of total resistance the photosynthetic
rates are quite sensitive to temperature, but at high resistances the
rates are vertY insensitive to temperature.
Photosynthesis of Hinher Plants
In order to select the proper values one must consi.der now a
specific plant. Since there are measurements of the photosynthetic
rate of Sorghum by FI-Shark_..r/ and Eesketh(1964) we used the observed
data in order to deterrine a set of values for P. and K. A value of
P at Tm was read from their photosyuthetic curve. The value of P at
optimum temperature Tm - 42.5C was 0.44 x 10-C moles cm- 2 sec-I. At
this stage it is assumed that the observed photosynthetic rate at
-13-
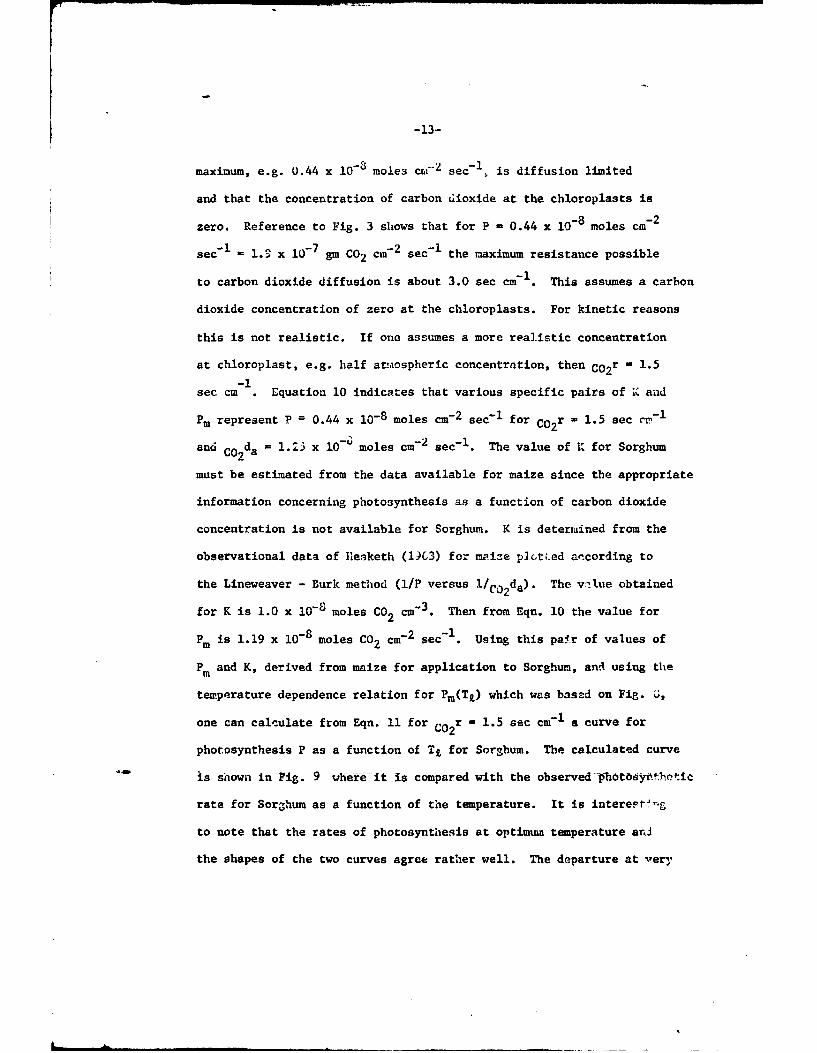
maximum, e.g. U.44 x 10-3 moles cm"-2 sec-l is diffusion limited
and that the concentration of carbon dioxide at the chloroplasts is
zero. Reference to Fig. 3 shows that for P = 0.44 x 10⁻⁸ moles cm-2
sec-I . 1.9 X 10⁻⁷ gm CO2 cm-2 sec-I the maximum resistance possible
to carbon dioxide diffusion is about 3.0 sec cm-. This assumes a carbon
dioxide concentration of zero at the chloroplasts. For kinetic reasons
this is not realistic. If one assumes a more realistic concentration
at chloroplast, e.g. half atmospheric concentration, then C02r - 1.5-1
sec cm . Equation 10 indicates that various specific pairs of K aud
Pm represent P = 0.44 x 10⁻⁸ moles cm- 2 sec- 1 for C0 2 r = 1.5 sec r-1-
and C0 2da = 1.23 x l0-; moles cm- 2 sec- 1 . The value of K for Sorghum
must be estimated from the data available for maize since the appropriate
information concerning photosynthesis as a function of carbon dioxide
concentration is not available for Sorghum. K is deterrained from the
observational data of Ilesketh (i)C3) f or maize pcvt Led according to
the Lineweaver - Burk method (1/P versus 1/C02 da). The value obtained
for K is 1.0 x 10-0 moles CO2 cm" 3 . Then from Eqn. 10 the value for
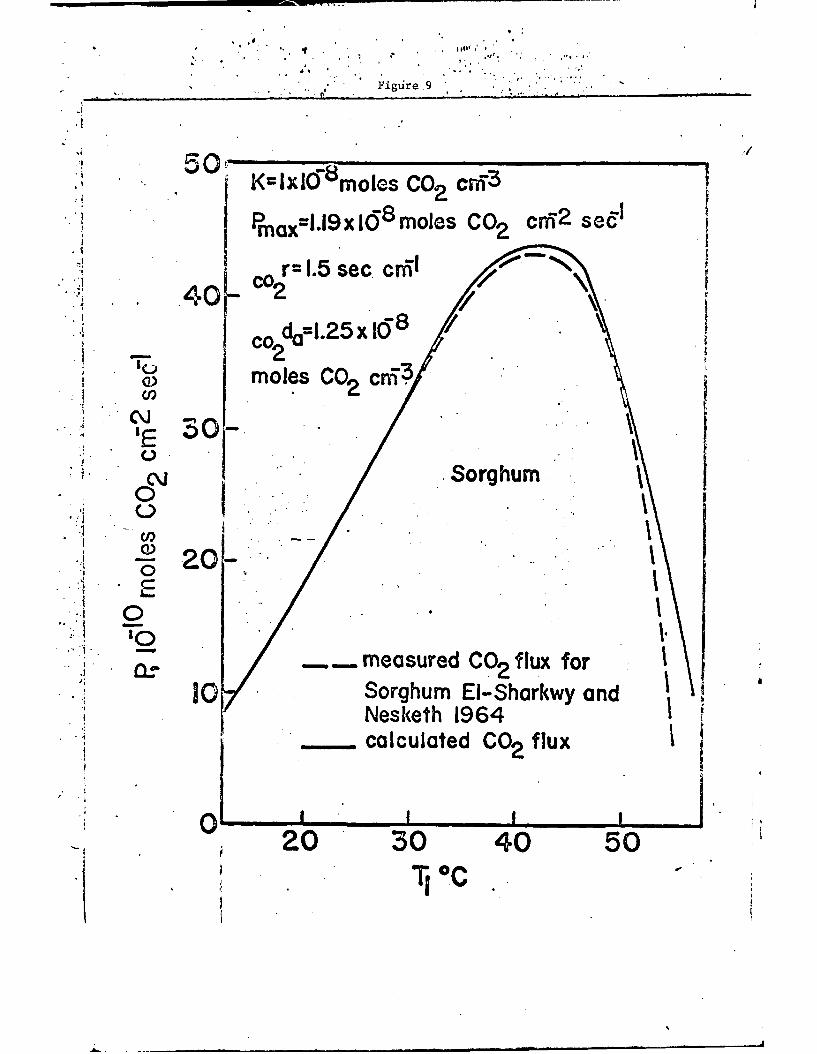
PM is 1.19 x 10⁻⁸ moles CO2 cm- 2 sec- 1 . Using this pair of values of
Pm and K, derived from maize for application to Sorghum, and using the
temperature dependence relation for Pm(Ti) which was based on Fig. •,
one can calculate from Eqn. 11 for C02r - 1.5 sec cm- 1 a curve for
photosynthesis P as a function of Tg for Sorghum. The calculated curve
is shown in Fig. 9 where it is compared with the observed photosYr-thtic
rate for Sorghum as a function of the temperature. It is interertf.g
to note that the rates of photosynthesis at optimum temperature anJ
the shapes of the two curves agree rather well. The departure at very
-14-
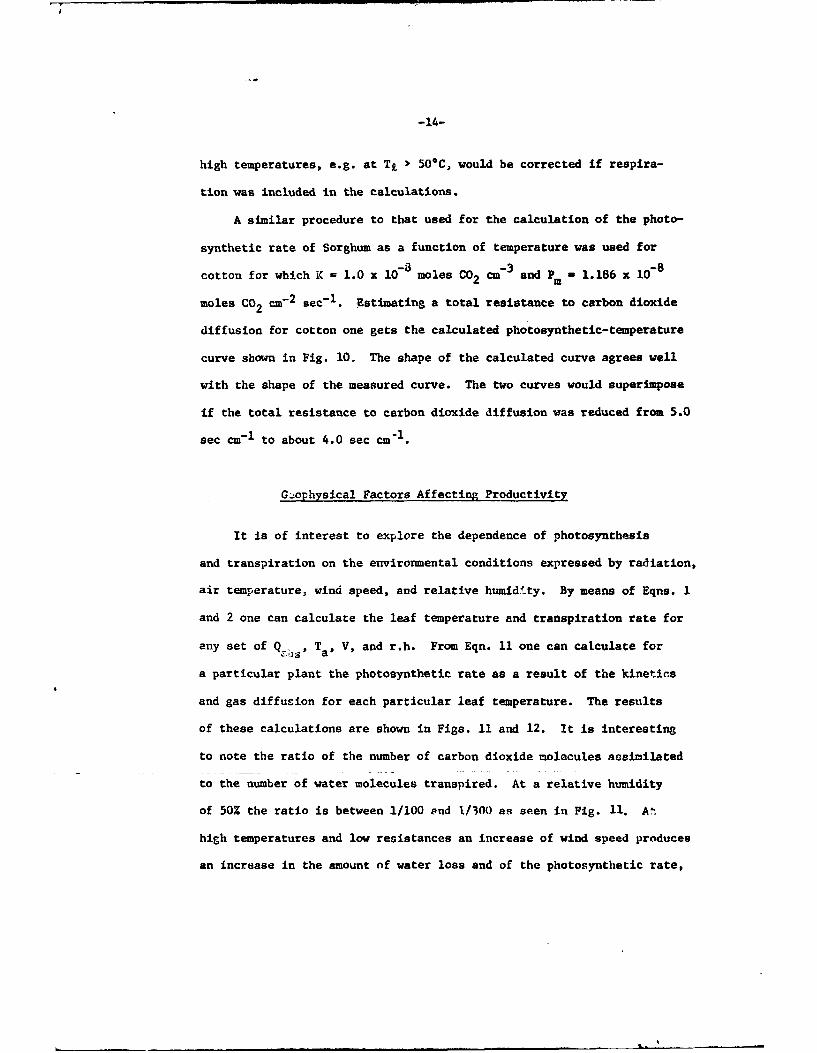
high temperatures, e.g. at Tj > 50*C, would be corrected if respira-
tion was included in the calculations.
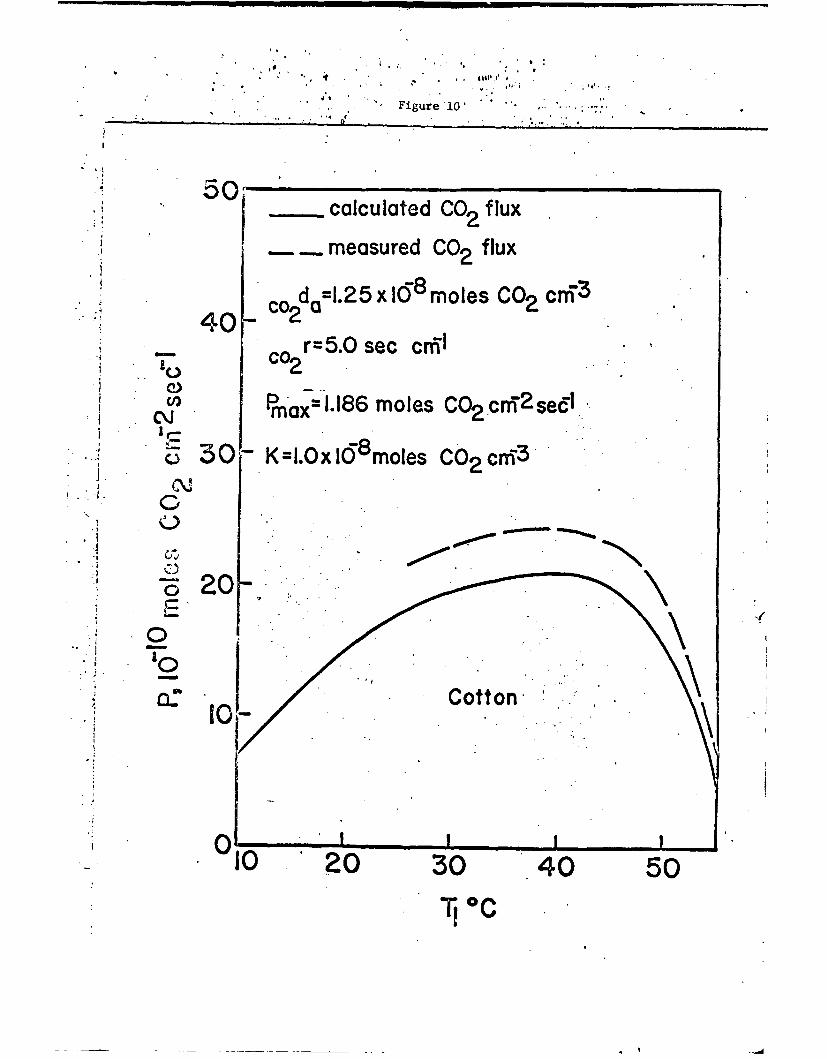
A similar procedure to that used for the calculation of the photo-
synthetic rate of Sorghum as a function of temperature was used for
cotton for which K = 1.0 x 10-a moles CO2 cm-3 and pm - 1.186 x 10⁻⁸
moles CO2 cz- 2 sec-1 . Estimating a total resistance to carbon dioxide
diffusion for cotton one gets the calculated photosynthetic-temperature
curve shown in Fig. 10. The shape of the calculated curve agrees well
with the shape of the measured curve. The two curves would superimpose
if the total resistance to carbon dioxide diffusion was reduced from 5.0
sec cm-I to about 4.0 sec cm-1.
Gýophysical Factors Affecting Productivity
It is of interest to explore the dependence of photosynthesis
and transpiration on the environmental conditions expressed by radiation,
air temperature, wind speed, and relative humidity. By means of Eqns. 1
and 2 one can calculate the leaf temperature and transpiration rate for
any set of Q.. Tas V, and r.h. From Eqn. 11 one can calculate for
a particular plant the photosynthetic rate as a result of the kinetics
and gas diffusion for each particular leaf temperature. The results
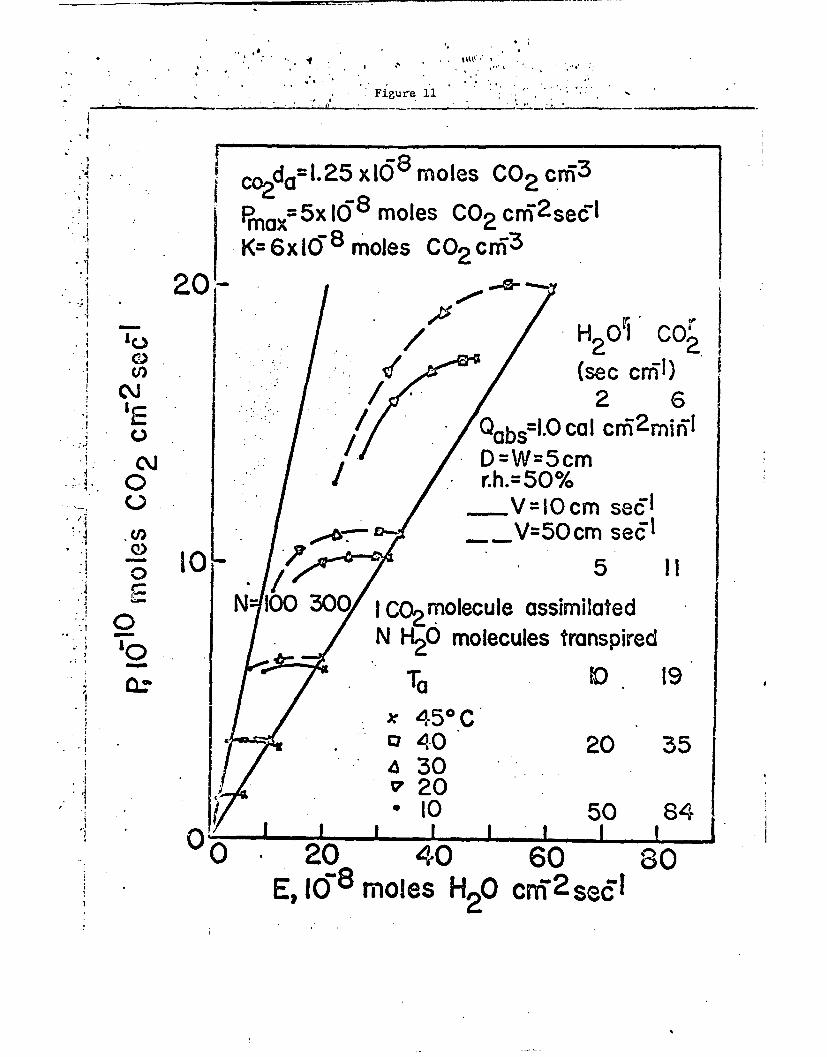
of these calculations are shown in Figs. 11 and 12. It is interesting
to note the ratio of the number of carbon dioxide molecules assimilated
to the number of water molecules transpired. At a relative humidity
of 50% the ratio is between 1/100 ond 1/300 as seen in Fig. 11. At
high temperatures and low resistances an increase of wind speed produces
an increase in the amount of water loss and of the photosynthetic rate,
-15-
but the ratio l/N decreases and the efficiency for productivity dinlnish'Žs.
Here N is the number of water molecules transpired for every carbon
dioxide molecule assimilated. At low air temperatures throughout an
increase of wind speed will reduce photosynthesis, reduce transpiration,
and increase the ratio li. At high air temperatures and high resistance
an increase of wind will increase photosynthesis, decrease transpiration,
and increase the ratio of 1/1).
In Fig. 12 one sees the influence of relative humidity on the
photosynthetic rate and transpiration rate. At any given temperature
a decrease of humidity increases the inefficiency of productivity, in
other words it decreases the ratio I/N. Also an increase of tempera-
ture always produces a reduction in the efficiency of productivity.
It is also of interest to note that under certain conditions of high
humidity, an increase of air temperature produces first an increase of
photosynthesis and then a decrease since the leaf temperature is
exceeding the optimum temperature. however, at low humidity an increase
of air temperature almost always produces an increase of photosynthetic
rate except at very high resistances. The number of water molecules
transpired to each carbon dioxide molecule assimilated may vary from
100 to 500 for plants of high resistance when going from very humid
to very dry air. At low temperatures an increase of resistance results
in a slight increase of photosynthetic efficiency, while at high teiupera-
tures an increase of resistance results in a decrease of photosynthet4.c
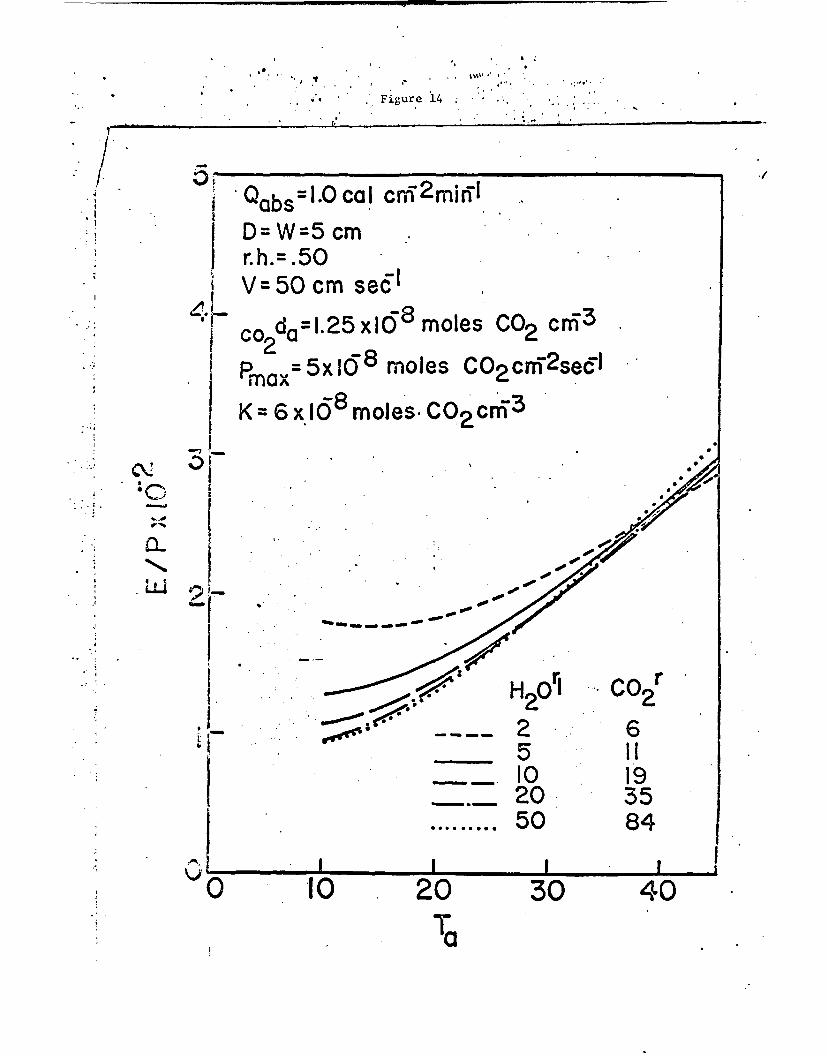
efficiency. The ratio of the number of water molecules transpired to
the number of carbon dioxide molecules assimilated is given as a function
of air temperature and leaf resistance in Figs. 13 and 14 for wind speeds
i -i
of 10 and 50 cm sec-1 respectively. At the nigher wind speeds the
photosynthetic efficiency increases with an increase of resistance for
most air temperatures normally encountered.
/
AC1MNOWLEDGEMENTS
The author wishes to thank Julie Gates for drafting the figures.
This research was supported by the U.S. Atomic Energy Commissiou
under Contract No. AT(11-1)1711 .nn th f nffirc of Naval Reseqreh under
Contrart No. NR I105-411.
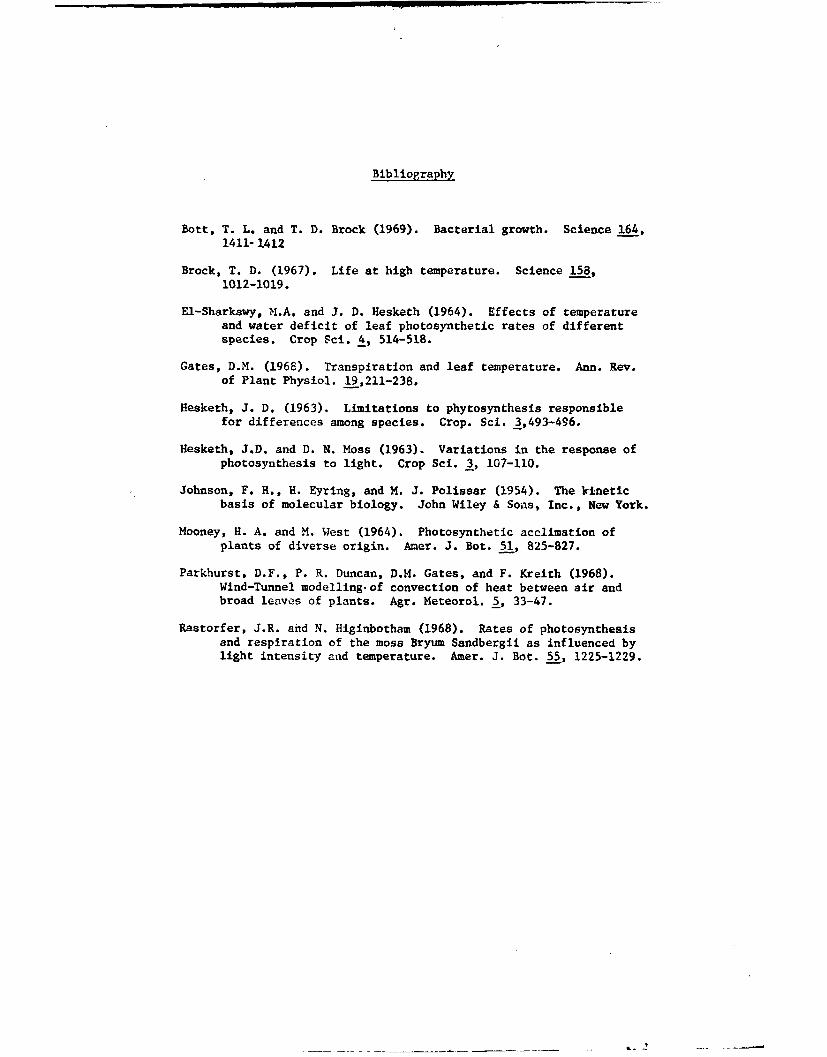
Bibliography
Bott, T. L. and T. D. Brock (1969). Bacterial growth. Science 164,1411-1412
Brock, T. D. (1967). Life at high temperature. Science 158,1012-1019.
El-Sharkawy, M.A. and J. D. Hesketh (1964). Effects of temperatureand water deficit of leaf photosynthetic rates of differentspecies. Crop Sci. 4, 514-518.
Gates, D.M. (1968). Transpiration and leaf temperature. Ann. Rev.of Plant Physiol. 19,211-238.
Hesketh, J. D. (1963). Limitations to phytosynthesis responsiblefor differences among species. Crop. Sci. 3,493-496.
Hesketh, J.D. and D. N. Moss (1963). Variations in the response ofphotosynthesis to light. Crop Sci. 3, 107-110.
Johnson, F. H., H. Eyring, and M. J. Polissar (1954). The kineticbasis of molecular biology. John Wiley & Sons, Inc., New York.
Mooney, H. A. and M. West (1964). Photosynthetic acclimation ofplants of diverse origin. Amer. J. Bot. 51, 825-827.
Parkhurst, D.F., P. R. Duncan, D.H. Gates, and F. Kreith (1968).Wind-Tunnel modelling-of convection of heat between air andbroad leaves of plants. Agr. Meteorol. 5, 33-47.
Rastorfer, J.R. and N. Higinbotham (1968). Rates of photosynthesisand respiration of the moss Bryum Sandbergii as influenced bylight intensity and temperature. Amer. J. Bot. 55, 1225-1229.
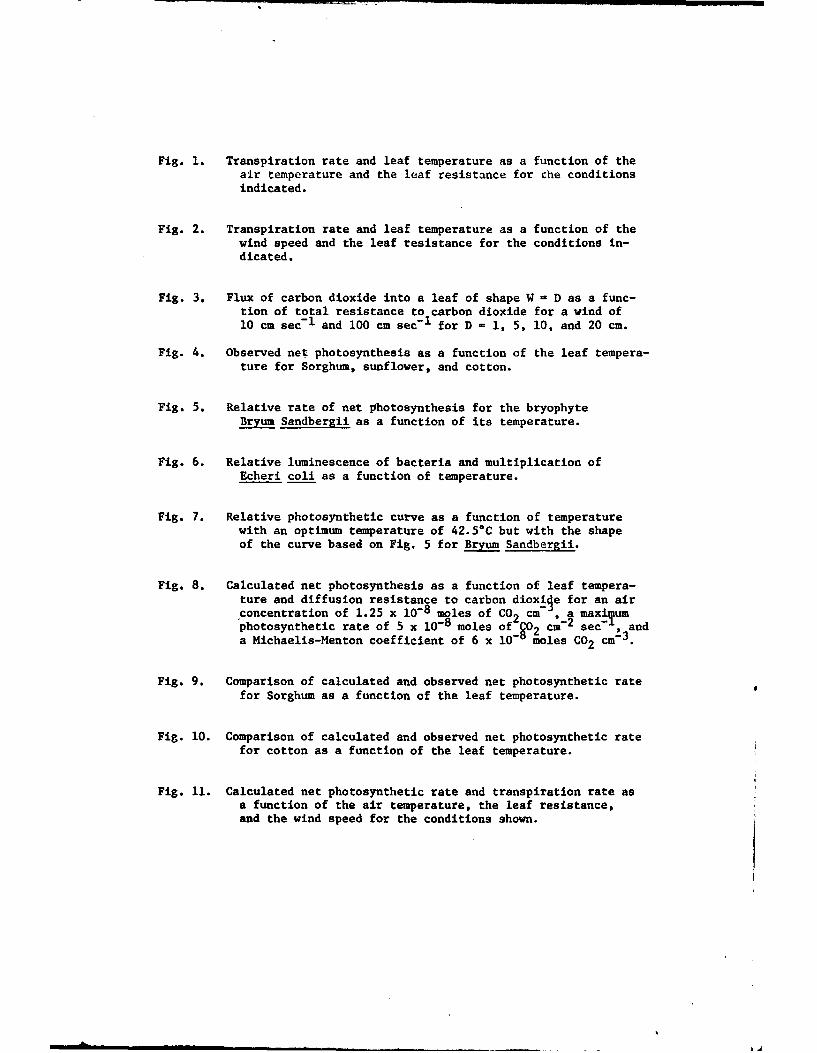
Fig. 1. Transpiration rate and leaf temperature as a function of theair temperature and the leaf resistance for the conditionsindicated.
Fig. 2. Transpiration rate and leaf temperature as a function of thewind speed and the leaf resistance for the conditions in-dicated.
Fig. 3. Flux of carbon dioxide into a leaf of shape W = D as a func-tion of total resistance to carbon dioxide for a wind of10 cm sec- 1 and 100 cm sec- 1 for D - 1, 5, 10, and 20 cm.
Fig. 4. Observed net photosynthesis as a function of the leaf tempera-ture for Sorghum, sunflower, and cotton.
Fig. 5. Relative rate of net photosynthesis for the bryophyteBryum Sandbergii as a function of its temperature.
Fig. 6. Relative luminescence of bacteria and multiplication ofEcheri coli as a function of temperature.
Fig. 7. Relative photosynthetic curve as a function of temperaturewith an optimum temperature of 42.5*C but with the shapeof the curve based on Fig. 5 for Bryum Sandbergii.
Fig. 8. Calculated net photosynthesis as a function of leaf tempera-ture and diffusion resistance to carbon dioxige for an airconcentration of 1.25 x 10⁻⁸ moles of CO2 m , a maxiyum"photosynthetic rate of 5 x 10⁻⁸ moles of ¢02 cm- 2 sec- , anda Michaelis-Menton coefficient of 6 x 10 moles CO2 cm 3 .
Fig. 9. Comparison of calculated and observed net photosynthetic ratefor Sorghum as a function of the leaf temperature.
Fig. 10. Comparison of calculated and observed net photosynthetic ratefor cotton as a function of the leaf temperature.
Fig. 11. Calculated net photosynthetic rate and transpiration rate asa function of the air temperature, the leaf resistance,and the wind speed for the conditions shown.
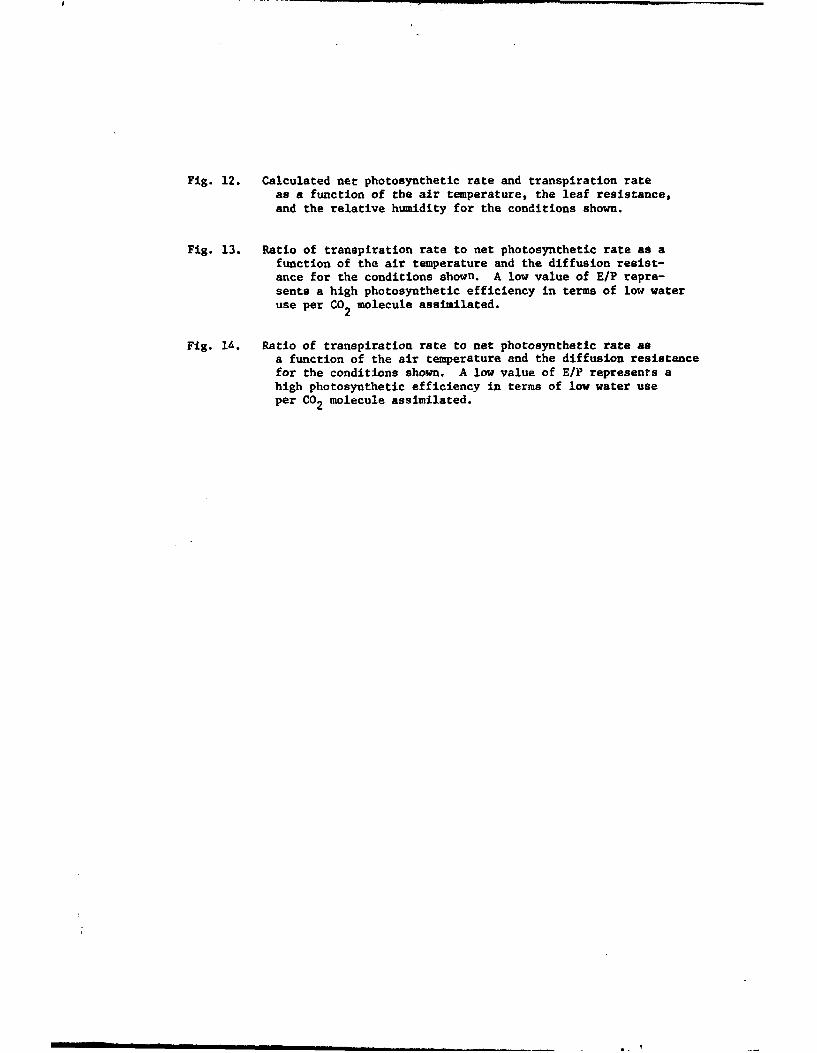
Fig. 12. Calculated net photosynthetic rate and transpiration rateas a function of the air temperature, the leaf resistance,and the relative humidity for the conditions shown.
Fig. 13. Ratio of transpiration rate to net photosynthetic rate as afunction of the air temperature and the diffusion resist-ance for the conditions shown. A low value of E/P repre-sents a high photosynthetic efficiency in terms of low wateruse per CO2 molecule assimilated.
Fig. 14. Ratio of transpiration rate to net photosynthetic rate asa function of the air temperature and the diffusion resistancefor the conditions shown. A low value of E/P represents ahigh photosynthetic efficiency in terms of low water useper CO2 molecule assimilated.
.... .. . .Figure.1
Qabs =0.6caI cni2 mirl
V=10 cm secl
r~h= 50%
D=5cm
W=5cm
I---~ 45 0C
40C'j 2035
30E 25
01 20
w F5z
I-/
0 To= -
*. under airtemp ratur
Coo
te eratur .
rc9
10 20 30 40
LEAF TEMPERATURE, OC
Figure 2
300LWeBubTmeaue.0obs=O8COl Cr6 2 mia', t,4C
280- r.h.*5O%, D=5cm, Wx5cm,
2611-
240-
E 220L1 , .K.
"aX V=500 -.. .. *.r
0 180 -*
i 60 -
z-0
~A40f-~ V200
C/ 120,
80F \sec cri V=50
60F. r=2scca
20[ =10
31 .33 35 37 39 41LEAF TEMPERATURE**C
, : il I I I I I I !. ... I I 1ii, ,
4 -Figure 3
,I
100
W= D cm
V=10 cm se-Iu =- V=00 cm sec-I
10.0- 2o \II 5
09
.!.0
oii0.1
0.1 1.0 10 100co0r, sec cf
4' * Figure .4 *
CIO
050-C\I
40
00
10-
20 30 40 50 60.LEAF TEMPERATURE, 00
Figu e5 .• .S• .qe .... . ... .', ".
.12
"-
'12 -
.0-_ " Bryum Sandberg~
:1•
02"
aL T
I
Iii LEAF TEMPERATURE, oc
Figtire.6
MultiplicationE. Coil
Luminescenceof Bacceeria,
(2 species)"6'
40 50TEMPERATURE? 0C
S. I . . Iv...
. . . . . . . . . . . . . .
"Figure 7
RELATIVE PHOTOSYNTHESIS|w o
S0 i I O)Qi 0* 0
II > o
I-D
0 C a(
II -r-
<n0 Ca
*. . .. %. , :_ j% C J0
-- ,*.0 0
0 CL
iC7
4
OKD
Uli
.. .. Figure 8.
*60
60~~ cord1.25K Id moles Co2 crii3
Pmax= 5X 1l5 8 moleS 002 crff2 seClK=6xl08 moles COpcf 3
50
~C0
C.)
0300
~~20
'50
I0
10 20 30 40 .50 60T OC
m ~ ~~ ~ lit,• l ...
.1.... . "•"_. "_ . ,Figure .9 .
.1
K=lxlO moles CO2 Cn3
jI0l19xld moles C0 2 cri 2 seel
i. co r= 1.5 sec 1S/ee.. cm.0 40-
".1 50
•n./. measured CO2 flux for
0 B •Sorghum EI-Sharkwy and
Nesketh 1964O__calculated CO2 flux
-i 00• I
•,• 20 30 40 50icc*1 T
li t - ,
* .. . .:; ,** Figur e 10. .*
*calculated CO2 f lux
~measured CO2. flux
* dQ =1.a25 x 10moles CO2 crriT3
r=. sec crff I
CO
20-~
0N
00
30 .4050T, OC
*, ;
'Figure. 11
Ac a=1 25x108 moles CO2 cri 3
R 5x 168 moles CO2 crfn2 sedlmax4K=6x16 moles 2 cri3
ji 20-
• H/ 2 co(sec crfil)
Ci J /2 6
= : • .bsl.O ca ccrfi2 mifil.- D=W=5cm
0 / r.h.=50%O.VlIOcm see,
*.......V=50cm sec 1
0o 10 /95
•N- 100 300 C02rmolecule assimilated.-! N N 20 molecules transpired
D0 19
x 450 C40 20 35
• 30v20
" i1 0 50 84
01180E0"0 , 2 m esH0 c0 60 80i ,10- moles H2 cnrf- seC
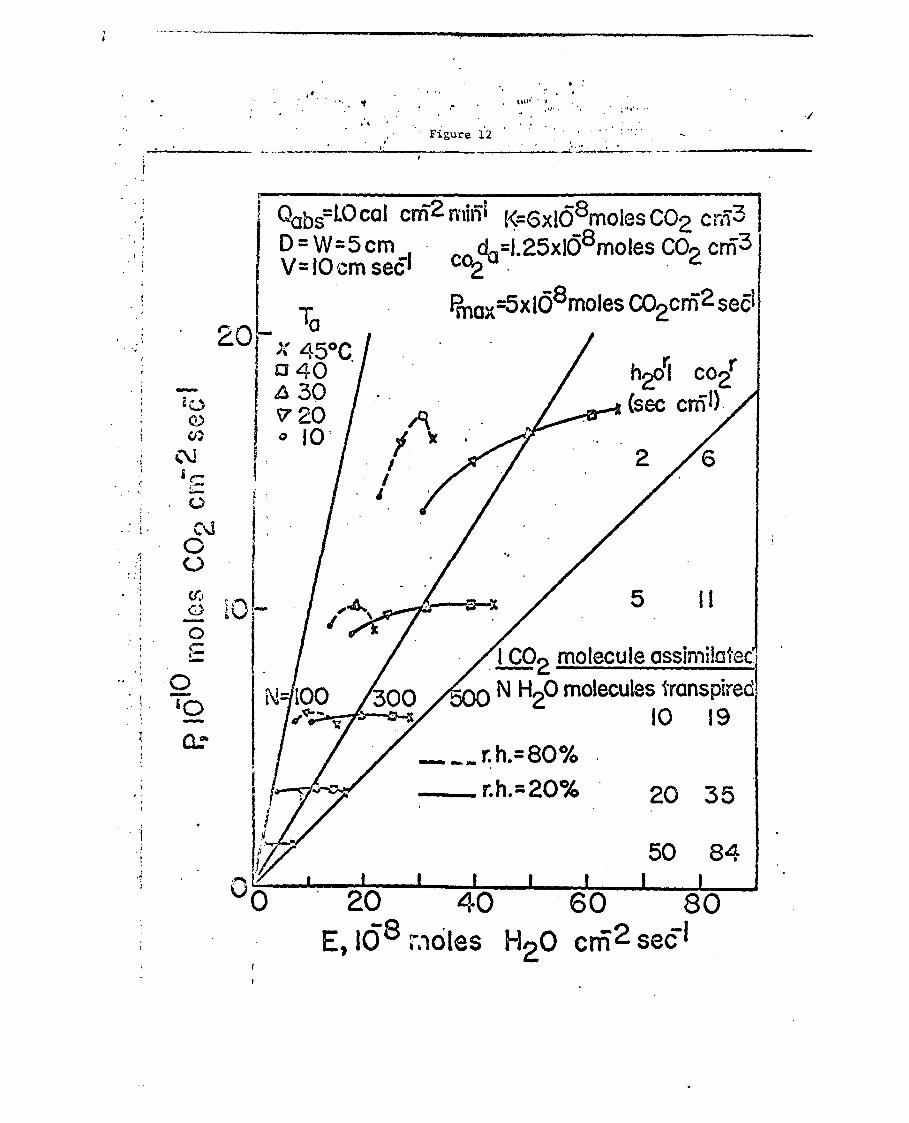
*Figure 12
j %be&1 cal cm 2 min'~ L=GXl58mo~eS C02 cr'-1i13-IDW=5cm -
V~l~cm e c1 Pi1.25xlO'Jmoles CO2 criT3
* ao - ~Pmo=xi5Xl 8moles co2cra2 sedl
0450 C h2p I co~~2O(sec criI)
fob2 6
10
_10 19
~r.h.=2O%* 20 35
50 84
002
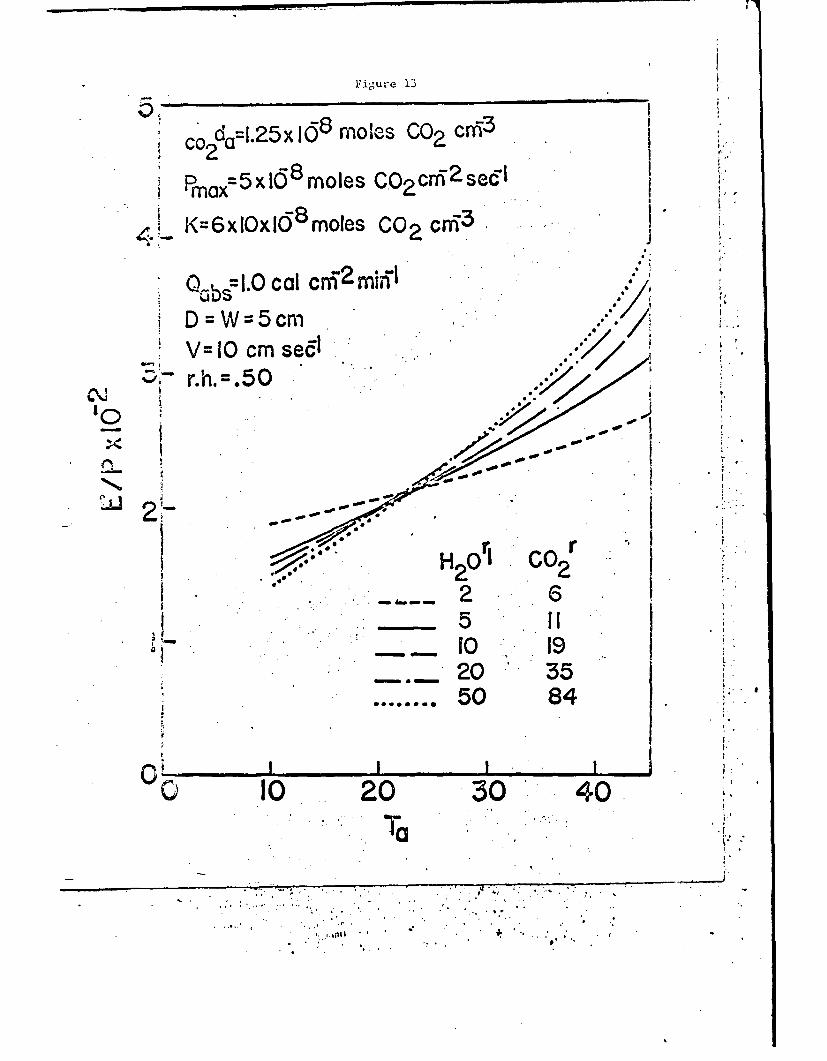
Figure 13
coda-1.2-55l 8 fleOIs COcrn32
PmaXýxl5Xi8 moles C,02crfi2 sed1
K( 6x~OxI58 moles 002 cni,3
o -l1.0Cal cni 2 mfi'-1
D=W:5crnV 10 cm sedl-
.dr.h.=.5O
1c)0
*~
re
5 1110 1920 3550 84
10 20 3040.To
* i
Figurei4 .14 . .
.I.._ _,._ _",.__ _. .__ _ ,,-._
Qabsl.O cal cni 2 mirrl
SD= W=5 cmS~ r.h.= .50
V=-50 cm se•I4k-dcod=1.25oxl 8 moles CO2 c2i 3
C2 -Pmax=5x1(58 moles C0 2 cni 2 seCl
JA
K K6 x1(5 8 moles. Co2crI 3
• . .* *---
2 -
"5 -1
0o 1920 3550 84
I I , I
0 10 20 30 40
Reproduction in whole or in part is permitted for any purpose of
the United States Government. These studies were aided by Contract
N00014-69-C-0048, NR 105-411, between the Office of Naval Research,
Department of the Navy, and the Missouri Botanical Garden.
f DOCUMENT CONTROL DATA - R & D(S"..,.r I I V 1 I(fll, hod. .1.,t -cfhs t~ a nod indexing~ annol toIton niu,, b e a,, fored when the o .veful rep-.t I. r In ill,~ d)
1. OR. GINA TING A C TIVr ITY 1Corpo.arv aoth..r) IZ. REPORT SCCUnITY CLAS51FCAyiON
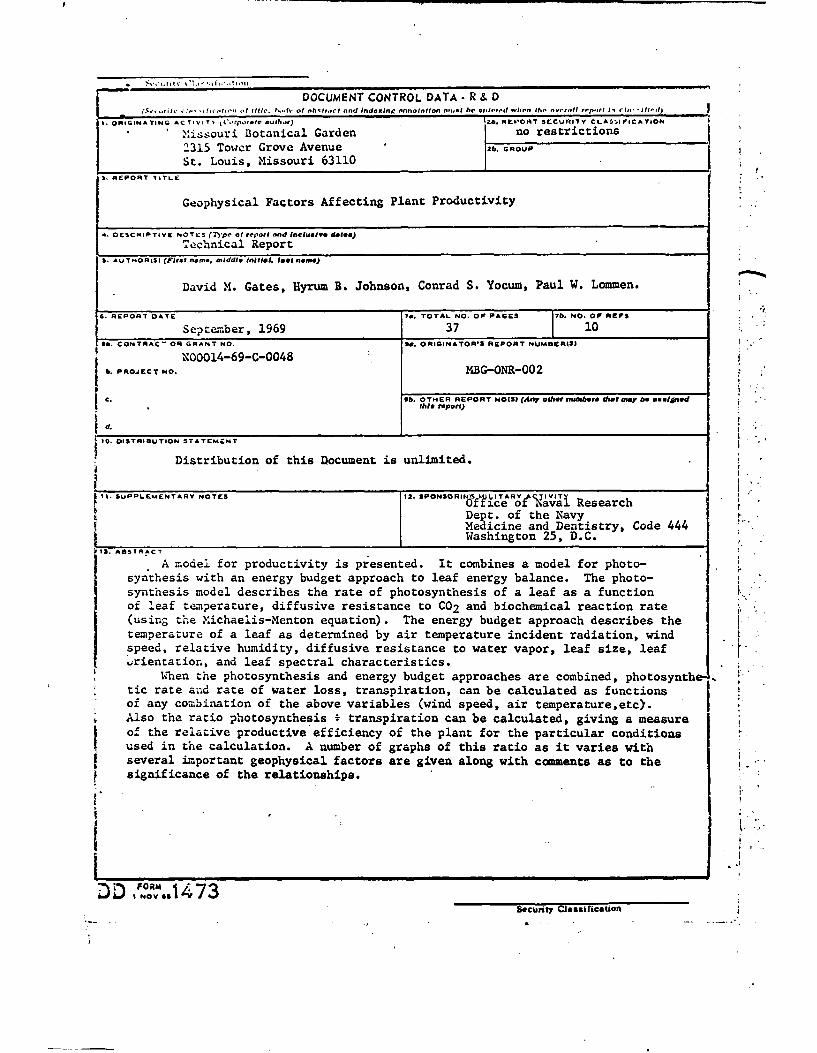
Missouri Botanical Garden no restrictions
2315 Tower Grove Avenue 26 GROUPj
SIt.L oiEisur 31
13,RrOR 1TLGeophysical Factors Affecting Plant Productivity
4. DESCRIPTIVE NOTES (Type af report and incluadve date@)Technical Report
S. AUTmORIS) (F~tleffaname middle InitiaJ. taat nsmo)
David M. Gates, Hyrum B. Johnson, Conrad S. Yocum, Paul W. Lommen.
6a. REP ORT DATE Its. TOTAL NO. OF PAEMb O. OF REFS '
September, 1969 37 10go. CON TRAC- OR GRANT NO. go. ORIGINATOR'S REPORT NUMBER(S)
X00014-69-C-00486. PROJECT NO. MBG-ONR-002
C. 9b. OTHER REPORT NO(S) (Any other numb.,. tholoti bay hassigned* thise report)
d.____________________________
10. DISTRIBUTION STATEMZNT
Distribution of this Document is unlimited.
1I. SUPPLEMENTARY NOTES 2.SPONSORINAIT
I Office o avalRsahI I Dept. of the NavyMedicine and Dentistry, Code 444I ________________________________tWashington 25, D.C.
13. ASSTRALCT
A model for productivity is presented. It combines a model for photo-synthesis with an energy budget approach to leaf energy balance. The photo-synthesis model describes the rate of photosynthesis of a leaf as a functionof leaf temperature, diffusive resistance to C02 and biochemical reaction rate(using the Michaelis-Menton equation). The energy budget approach describes thetemperature of a leaf as determined by air temperature incident radiation, wind.speed, relative humidity, diffusive resistance to water vapor, leaf size, leaf,x.ientation., and leaf spectral characteristics.
When the photosynthesis and energy budget approaches are combined, photosyntheltic rate ajad rate of water loss, transpiration, can be calculated as functionsof any combination of the above variables (wind speed, air temperature,etc>.Also the ratio photosynthesis ` transpiration can be calculated, giving a measureof the relative productive'efficiency of the plant for the particular conditionsused in the calculation. A number of graphs of this ratio as it varies withseveral important geophysical factors are given along with comments as to thesignificance of the relationships.
DDI NOV 051 7
security classification