Embed Size (px)
Citation preview

8/17/2019 Geophysical Investigation EPA
http://slidepdf.com/reader/full/geophysical-investigation-epa 1/164
United StatesEnvironmental Protection
Agency
Office of Solid Waste andEmergency Response(5102G)
EPA-542-R-00-003 August 2000www.epa.gov/tiocluin.org
Innovations in SiteCharacterization:
Geophysical Investigation atHazardous Waste Sites

8/17/2019 Geophysical Investigation EPA
http://slidepdf.com/reader/full/geophysical-investigation-epa 2/164
ii
Notice
This material has been funded wholly by the United States Environmental Protection Agencyunder Contract Number 68-W7-0051. Mention of trade names or commercial products does notconstitute endorsement or recommendation for use.
Copies of this report are available free of charge from the National Service Center for Environmental Publications (NSCEP), PO Box 42419, Cincinnati, Ohio 45242-2419; telephone(800) 490-9198 or (513) 489-8190 (voice) or (513) 489-8695 (facsimile). Refer to documentEPA-542-R-00-003, Innovations in Site Characterization: Geophysical Investigation at Hazardous Waste Sites. This document can also be obtained through EPA’s Clean UpInformation (CLUIN) System on the World Wide Web at http://cluin.org . For assistance, call(301) 589-8368.
Comments or questions about this report may be directed to the United States EnvironmentalProtection Agency, Technology Innovation Office (5102G), 401 M Street, SW, Washington,D.C. 20460; telephone (703) 603-9910.

8/17/2019 Geophysical Investigation EPA
http://slidepdf.com/reader/full/geophysical-investigation-epa 3/164

8/17/2019 Geophysical Investigation EPA
http://slidepdf.com/reader/full/geophysical-investigation-epa 4/164
iv
Acknowledgments
This document was prepared for the United States Environmental Protection Agency’s (EPA)Technology Innovation Office. Special acknowledgment is given to all of the PrincipalInvestigators for their thoughtful suggestions and support in preparing these case studies.

8/17/2019 Geophysical Investigation EPA
http://slidepdf.com/reader/full/geophysical-investigation-epa 5/164

8/17/2019 Geophysical Investigation EPA
http://slidepdf.com/reader/full/geophysical-investigation-epa 6/164
1
INTRODUCTION
Throughout the 1990s, the methods used to characterize hazardous waste sites havechanged considerably. Site managers have found that the collection of a limited number of high-quality, high-cost, analytical data points that dominated site characterization in theearly part of the decade resulted in a lack of broader understanding of site conditions. The
earlier characterization practices also often required long time horizons for the compilationof sufficient data to support remedial decisions. The high costs, long time frames, andlimited nature of the information associated with earlier practices have led to theemergence of a number of innovative techniques designed to speed the data collection process, increase the amount of information collected, and lower the overall cost of datacollection. The various agencies and departments of the Federal government withresponsibility for the characterization and cleanup of hazardous waste sites had all adoptedsome form of expedited site characterization process by the end of the decade. One set of technologies that has found a natural application in the context of expedited sitecharacterization has been geophysical characterization technologies.
Increasingly traditional geophysical technologies have found new and innovative uses athazardous waste sites. Geophysical technologies have been used for decades in other
industries, principally the petroleum and mining industries, for their ability to describegeological structures deep within the earth’s crust. This proven track record that has beeneasily transferred to the characterization of hazardous waste sites. In fact, geophysicaltechnologies, such as ground penetrating radar, electromagnetometry, and magnetometry,have been in wide use already at hazardous waste sites to locate buried drums andstructures that often constitute source areas. The use of geophysical technologies israpidly expanding to other applications in hazardous site characterization, including thedirect detection of aqueous and nonaqueous phase contamination. In several of theinvestigations discussed in this volume, geophysical technologies were able to detect the presence of either dense or light, nonaqueous phase liquids (D/LNAPLs).
One of the principal missions of the U.S. Environmental Protection Agency’s TechnologyInnovation Office (EPA/TIO) is to disseminate information on the cost and performance
of innovative technologies and approaches applicable to the characterization andremediation of hazardous waste sites. The dissemination of this information can stimulatethe adoption and use of innovative technologies and approaches on an ever wideningscale. This report contains case studies of the innovative application of differentgeophysical technologies and methods at 11 hazardous waste sites. The technologiesdescribed in these case studies do not represent the entire range of geophysicaltechnologies, but do represent innovative applications of the better-known technologies.
1.0 Methodology for Site Selection
In order to prepare a set of 11 case studies that explored the use of geophysical methodsat hazardous waste sites, EPA decided that case studies would be prepared for sites onlywhen:
C the investigation took place within the previous five years, to ensure thatknowledgeable information sources could still be readily identified;
C the investigation sought to identify site contamination;

8/17/2019 Geophysical Investigation EPA
http://slidepdf.com/reader/full/geophysical-investigation-epa 7/164
2
C site contamination problems were similar to those encountered under the ResourceConservation and Recovery Act (RCRA), Superfund, and Underground StorageTank programs; and
C the technology was used in a full-scale application.
EPA initially set out to identify as many geophysical investigations that met the abovecriteria as possible. Through contacts in EPA’s Office of Research and Developmentresearch laboratories, requests for information posted in relevant Internet discussionforums, and requests to members of EPA’s Groundwater Forum, a group of technicalexperts distributed across the ten EPA Regional Offices, EPA identified more than 40individuals with relevant experience. EPA contacted most of these individuals to collectsome basic information and compare it to the above criteria.
Over the same period, EPA performed a review of the technical literature published withinthe previous three years to identify applications that might be used. The literature reviewwas confined to the following sources:
• Proceedings from the Symposium of Applications of Geophysics to Engineering
and Environmental Problems (SAGEEP);• Groundwater ;
C Soil and Groundwater Cleanup; and
C Environmental Science and Technology.
From the individuals contacted and the articles identified, EPA identified 27 applicationsof geophysical technologies that were recent and relevant to the goals of the project. Toreduce this number to 11, EPA applied the following criteria to each geophysicalinvestigation:
• Geophysical investigations demonstrated the technology’s capability to directly
detect, or facilitate the detection of, contamination;
C Adequate documentation was available for the site and the performance of thetechnology. Also, EPA could ensure reasonable access to the principalinvestigator, or another person with knowledge of the application; and
C The site was a Superfund site.
Sixteen of the 27 applications were eliminated using this criteria. In some cases,geophysical investigations were selected that did not meet all of these criteria. Thegeophysical investigation at the Marshalltown Former Gas Manufacturing Plant (FMGP)and the Crystal Refinery sites were conducted as demonstrations, not as a full-scaleapplications. The investigation at the Trail Road Landfill did not evaluate a hazardous
waste site, but a municipal landfill. In each of these cases, the investigations representedtechniques for which full-scale applications could not be identified, yet whose results provided relevant and useful information.

8/17/2019 Geophysical Investigation EPA
http://slidepdf.com/reader/full/geophysical-investigation-epa 8/164
1/ Ground penetrating radar is a technique that belongs in the larger set of electromagnetometry, but istreated here as a separate technology due to its widespread use.
3
2.0 Overview of Case Studies
The case studies describe a number of geophysical technologies and methods that wereused at sites with significantly different geological settings and a wide range of types of subsurface contamination. Table ES-1 presents a summary of the geology, contaminants,and geophysical methods used at the 11 case study sites.
The geological settings in which these technologies have been used ranged from simplegeological settings with relatively homogeneous stratigraphy, such as those found atWurtzsmith Air Force Base to the highly heterogeneous mix of sand and clay layers foundat the New Mexico Highway Safety and Transportation Department (NMHSTD) site.Overall, simpler geological settings provided fewer challenges to the collection of highquality geophysical data.
The types of contamination that were being characterized fell primarily into three broadgroups, chlorinated solvents, petroleum-related compounds, and polyaromatichydrocarbons. Inorganic contaminants were investigated at two of the sites. At seven of the sites, contaminants were found in a nonaqueous phase liquid (NAPL), either as a dense(DNAPL) or light (LNAPL) compound.
The types of geophysical technologies represented in the eleven case studies include:
C Ground Penetrating Radar 1/ (GPR);
C Electromagnetometry (EM);
C Electrical Conductivity or Resistivity;
C Seismic Reflection or Refraction;
C Magnetometry; and
C Natural Gamma Logging.
The purposes for which geophysical investigations were undertaken varied from the moretraditional characterization of site stratigraphy to directly monitoring contaminants in themedia. Some geophysical technologies, such as electrical conductivity,electromagnetometry, and to a lesser extent, ground penetrating radar, were able todirectly detect the presence of contaminants by measuring the change in soil conductivitiescaused by the chemical compounds. Other technologies, such as seismic reflection andrefraction, magnetometry, and gamma logging, cannot directly detect the presence of contaminants but are powerful tools in identifying subsurface lithologies that provide preferential pathways for the migration of contaminants.
3.0 Geophysical Technology Descriptions
Ground Penetrating Radar
Ground penetrating radar (GPR) uses high-frequency radio waves to determine the presence of subsurface objects and structures. A GPR system radiates short pulses of

8/17/2019 Geophysical Investigation EPA
http://slidepdf.com/reader/full/geophysical-investigation-epa 9/164
4
high-frequency electromagnetic energy into the ground from a transmitting antenna. Thiswave propagates into the ground at a velocity that is related to the electrical properties of subsurface materials. When this wave encounters the interface of two materials havingdifferent dielectric properties, a portion of the energy is reflected back to the surface,where it is detected by a receiver antenna and transmitted to a control unit for processingand display.
Electromagnetometry
The EM method is based on measuring the response of an electromagnetic field inducedinto the earth. A small coil transmits low frequency signals, one to ten kilohertz. The lowfrequency, very long wavelength electromagnetic fields produced by the transmitter,induce current flow in electrically-conductive media in the earth. This induced currentflow produces secondary electromagnetic fields that radiate back to the surface. Areceiving coil detects the secondary field and measures its strength and phase relative tothe transmitted signal. The data are presented as the relative amplitude of the secondarysignal, in parts per million (ppm).
The depth of penetration of the transmitted field is a function of the frequency of
operation. Lower frequencies penetrate deeper, while higher frequencies are attenuatedmore rapidly. This frequency dependent penetration depth provides the opportunity tointerpret multifrequency EM data to evaluate the depth and size of targets.
Seismic Refl ection/Refraction
Seismic methods use an artificial seismic source to create direct compressional waves thattravel into the ground where they are reflected back to the surface when the wavesencounter boundaries between soil layers with different electrical properties. Some wavesare refracted along the interface of such layers by traveling along the contact betweengeologic boundaries. The signals continue until they reach the surface. Subsurfacestratigraphy is mapped by measuring the travel time necessary for a wave to pass throughone layer to another, refract along the interface, and return to the geophones at the
surface.
Reflection energy is received by the geophone and recorded as a trace. Each tracerepresents a station and each subsurface reflector or event should be visually identifiableon the trace, and connected to other traces within the survey. The ability to visuallyconnect traces with an identifiable reflector, such as the bedrock surface, across ,manysuch traces can be an indicator of the seismic survey accuracy within localized areas.
Electrical Conductivity/Resistivity
Electrical conductivity is an inherent property of a material to conduct an electrical currentand the electrical properties of soils can be measured using conductivity probes. Currentis injected into the earth through a pair of electrodes, and the potential difference ismeasured between the pair of potential electrodes. The current and potential electrodesare usually arranged in a linear array. Common arrays include the dipole-dipole array, pole-pole array, Schlumberger array, and the Wenner array.
Variations in shallow soil conductivity (resistivity is the inverse of conductivity) are caused by changes in soil moisture content, conductivity of groundwater, and properties that can

8/17/2019 Geophysical Investigation EPA
http://slidepdf.com/reader/full/geophysical-investigation-epa 10/164
2/ Investigation costs were estimated based on information supplied by the geophysical investigator.
5
be related to lithology. Soil conductivity is a function of grain size, with finer grains producing higher values and coarser grains resulting in lower values.
Natural Gamma
Natural gamma logging is the continuous physical measurement of the release of natural
gamma radiation from the soil and rocks surrounding the length of the borehole. Naturalgamma measurement begins by lowering the detector to the bottom of a hole, allowing itto equilibrate to the different subsurface temperature, then reeling the detector up the holeat a steady rate of between five and 10 feet per minute. The gamma log measures the totalgamma radiation emitted by a particular stratum in counts per second as the detector israised in the well column. Interpretation of the gamma log depends as much on theabsolute value of the gamma counts as it does on the rate of change in gamma counts asthe detector passes from one material to the next. Statistical variations in gammaemissions, significant at low counting rates, are smoothed out by integration over a shorttime interval. If the hole is logged too quickly, however, the smoothing effect leads toerroneous results by shifting the peaks in the direction of logging.
Magnetometry
Magnetometers measure variations in the magnetic field of the earth, and local disruptionsto the earth’s field, including the presence of naturally occurring ore bodies and man-madeiron or steel objects. Whether on the surface or in the subsurface, iron objects or mineralscause local distortions or anomalies in this field. When used together, the use of both totalfield magnetic and magnetic susceptibility logs allows for the detection of ferromagneticminerals. A magnetometer ’s response is proportional to the mass of iron in the target.The effectiveness of magnetometry results can be reduced or inhibited by interference(noise) from time-variable changes in the earth’s field and spatial variations caused bymagnetic minerals in the soil, or iron debris, pipes, fences, buildings, and vehicles.
4.0 Summary of Performance
In each investigation, the geophysical technologies performed as expected and the resultswere used by site managers to support a variety of site decisions. Those decisions rangedfrom remedy selection and design to optimizing the performance of existing remedies.Table ES-2 provides a summary of the results obtained in the 11 geophysicalinvestigations. In five, the geophysical technology was able to directly detectcontaminants, greatly aiding the delineation of contamination at those sites. In theremaining investigations, the results described critical geological structures that influencedthe migration of contaminants. This information aided site managers in identifyingappropriate sampling locations for better delineation of contamination.
Table ES-3 provides a summary of the amount of data that was collected during thegeophysical investigation, the approximate cost2/, and the difficulties encountered. The
information in this Table helps to underscore one of the greatest advantages thatgeophysical technologies offer: their cost-effectiveness. For all but two of theinvestigations, the approximate cost was less than $10 thousand. In one of the other twocases, the higher costs represented an investigation with a substantially larger scope, whilethe cost for the remaining investigation could not be separated from the overall cost

8/17/2019 Geophysical Investigation EPA
http://slidepdf.com/reader/full/geophysical-investigation-epa 11/164
6
of the soil sampling investigation.
Although no difficulties were reported for five of the investigations, those reported in theother investigations reflect the limitations of some of the technologies used. Ground penetrating radar surveys found that dense clays and silts limited the depth to whichmeasurements could be taken. Standing water and cultural noises, such as airports and
railroads, posed difficulties for the collection of seismic data, in some cases. The electricalconductivity probe used at one site often broke when large cobbles or boulders wereencountered.
Several of the technologies discussed in this report have been used successfully ininvestigations of nonaqueous phase liquids (NAPLs). Electromagnetics, including GroundPenetrating Radar (GPR), were used at two creosote site and were able to detectdiscernable differences in the electrical conductivity of NAPL-saturated soils. At another site, a seismic reflection survey was able to identify deep paleochannels in the bedrock facein which DNAPLs had pooled and through which DNAPLs were migrating.
5.0 Summary of Lessons Learned
Overall, these technologies performed well and provided valuable information. Some of the lessons learned during their application were related to improving data collection,while others were related to the value of the technology, itself. Some of the principallessons learned included:
C Electromagnetometry can be useful in detecting certain types of contamination in both soils and groundwater. The presence of organic compounds in soil andinorganic compounds in groundwater change the electrical conductivity of themedium from background levels.
C The performance of ground penetrating radar surveys can be improved with theuse of different antenna configurations. The typical co-pole configuration, whilesensitive to subsurface geometries that are flat and oriented parallel to the ground
surface, is less sensitive to angular features in the subsurface. At the Baker Woodssite, buried pits and vaults were more clearly identified with a cross-poleconfiguration, while they were less visible in GPR data collected with a co-poleconfiguration.
C Electrical conductivity probes are able to detect the presence of NAPLs directly. NAPLs change the electrical properties of the soils in which they reside, and the probes were able to measure these changes. When they occur in soils that shouldnot otherwise be providing such readings, it may be an indication of the presenceof a NAPL.
C Geophysical technologies can be used in concert with each other to producecomplementary results that increase both perspective and confidence. At the TrailRoad site, several different borehole methods were used to gain a comprehensiveunderstanding of the stratigraphy and to identify zones of groundwater contamination. Some of the methods were sensitive to dense, impermeable layerswhile others were sensitive to coarser, sandy materials. Electrical conductivity andwater temperature were used in concert to detect the presence of contaminants inthe groundwater.

8/17/2019 Geophysical Investigation EPA
http://slidepdf.com/reader/full/geophysical-investigation-epa 12/164
7
C Mature petroleum-related LNAPL plumes can be detected as electrically-conductive soils located at the capillary fringe. Natural biodegradation of thecompounds works to mobilize inorganic materials in the soils whose presenceincreases the soil conductivity. This approach was successfully pursued at two of the sites: Crystal Refinery and Wurtzsmith Air Force Base.
C
Seismic data collection can be sensitive to cultural sources of noise which caninterfere with reflected acoustical energy from bedrock structures. Severalstatistical procedures were employed during the Tinker Air Force Baseinvestigation to improve the quality of data collected.

8/17/2019 Geophysical Investigation EPA
http://slidepdf.com/reader/full/geophysical-investigation-epa 13/164
8
Table ES-1: Geophysical Investigation Sites and Technologies
Site Name and Location Geology Contaminants Geophysical Method Used
Baker Wood Creosoting CompanyMarion, OH
Sil ty loam over clay Polyaromatic hydrocarbonsGround Penetrating Radar Electomagnetometry
Ciba-Geigy Hamblet & Hayes SiteLewiston, ME
Sandy fill over clay Chlorinated solvents;Petroleum hydrocarbons
Ground Penetrating Radar
Crystal RefineryCarson City, MI
Sandy loam, sand, clayover limestone Petroleum hydrocarbons
Ground Penetrating Radar Electrical Resistivity
Kelly Air Force BaseSan Antonio, TX
Sand, gravel, clay mixover limestone
Chlorinated solvents Seismic Reflection
Kansas USTSalina, KS
Clay over sand Petroleum hydrocarbons Electrical Conductivity
Marshalltown FMGPMarshalltown, IA
Glacial till over limestone
Polyaromatic hydrocarbons Electrical Conductivity
New Hampshire Plating CompanyMerrimack, NH Silty clay over granite Chromium
Seismic ReflectionGround Penetrating Radar Natural GammaElectomagnetometry
NMHSTD USTDeming, NM
Sandy clay with claylayers over shale
Chlorinated solventsMagnetometry (R)Electomagnetometry (R)Natural Gamma
Tinker Air Force Base
Tinker, OK
Mix of clay, sand layers
over sandstone
Chromium
Chlorinated solvents
Seismic Reflection
Electomagnetometry
Trail Road LandfillNepean, Ontario, Canada
Sand, gravel over clayand limestone
Dissolved inorganic andorganic compounds
Natural GammaMagnetometryElectrical ConductivityTemperature
Wurtsmith Air Force BaseOscoda, MI
Sand, gravel over clayand sandstone
Petroleum hydrocarbonsGround Penetrating Radar Electomagnetometry (R)Magnetometry (R)
Note: (R) indicates that the method was used in a reconnaissance survey for buried materials that might interfere with primarytechnology.

8/17/2019 Geophysical Investigation EPA
http://slidepdf.com/reader/full/geophysical-investigation-epa 14/164
9
Table ES-2: Summary of Geophysical Investigations
Site Name and LocationGeophysical Method
Used Purpose Results
Baker Wood Creosoting CompanyMarion, OH
Ground Penetrating Radar Electomagnetometry
Delineate source areasand soil contamination
GPR identified buried structuresthat later investigation found to becontaminated. EM delineatednear-surface soil contamination
Ciba-Geigy Hamblet & Hayes SiteLewiston, ME
Ground Penetrating Radar Characterize stratigraphyFound topographic low wherelater sampling found pooledDNAPL
Crystal RefineryCarson City, MI
Ground Penetrating Radar Electrical Resistivity
Monitor groundwater contamination
Identified LNAPL mass located atwater table
Kelly Air Force BaseSan Antonio, TX Seismic Reflection Map bedrock topology
Identified channels in bedrockwhere later sampling foundpooled DNAPL
Kansas USTSalina, KS
Electrical Conductivity Characterize stratigraphy
Found saddle-like formation inconfining layer that acted aspreferential migration pathway for LNAPL
Marshalltown FMGPMarshalltown, IA
Electrical Conductivity Characterize stratigraphy
Clearly identified lithology,including layers not yet identified;probe able to directly detect
DNAPLs
New Hampshire Plating CompanyMerrimack, NH
Seismic ReflectionGround Penetrating Radar Natural gammaElectomagnetometry
Characterize stratigraphyMonitor groundwater contamination
Delineated stratigraphy; identifiedzones of groundwater contamination
NMHSTD USTDeming, NM
Magnetometry (R)Electromagnetometry (R)Natural gamma
Characterize stratigraphyfor sampling point location
Gamma logs identified clay layersthat influenced vapor migration invadose zone; logs were used toposition in situ soil gas samplers

8/17/2019 Geophysical Investigation EPA
http://slidepdf.com/reader/full/geophysical-investigation-epa 15/164
Table ES-2: Summary of Geophysical Investigations
Site Name and LocationGeophysical Method
Used Purpose Results
10
Tinker Air Force BaseTinker, OK
Seismic ReflectionElectromagnetometry
Characterize stratigraphyfor new well installation
Characterized stratigraphy;identified permeable layers
Trail Road LandfillNepean, Ontario, Canada
Natural Gamma
MagnetometryElectrical ConductivityDensityTemperature
Monitor groundwater contamination
Developed continuous lithologiclogs; conductivity andtemperature logs identified zonesof groundwater contamination
Wurtsmith Air Force BaseOscoda, MI
Ground Penetrating Radar Electromagnetometry (R)Magnetometry (R)
Monitor groundwater contamination
Identified unknown LNAPL plume
Note: (R) indicates that the method was used in a reconnaissance survey for buried materials that might interfere with primarytechnology.

8/17/2019 Geophysical Investigation EPA
http://slidepdf.com/reader/full/geophysical-investigation-epa 16/164
3/ Price includes cost of soil gas survey
11
Table ES-3: Performance of Geophysical Technologies
Site Name and LocationGeophysicalMethod Used Benefits/Difficulties
Baker Wood Creosoting CompanyMarion, OH
Ground PenetratingRadar Electromagnetometry
Benefits: 100 traverses over 0.7 acresDifficulties: GPR depth was limited by shallow dense clay soils;EM depth was limited by nearby structures
Ciba-Geigy Hamblet & Hayes SiteLewiston, ME
Ground PenetratingRadar
Benefits: 85 traverses over 0.1 acres in two days for $4 thousandDifficulties: Dense clay limited depth of penetration; swampyareas limited access
Crystal RefineryCarson City, MI
Ground PenetratingRadar Electrical Resistivity
Benefits: 2 traverses over 2.3 acres for $5.8 thousandDifficulties: No significant problems reported
Kelly Air Force BaseSan Antonio, TX
Seismic Reflection Benefits: 317 station measurements for $15.9 thousand
Difficulties: Railroad noise interfered with data collection
Kansas USTSalina, KS
Electrical Conductivity Benefits: 10 logs over 3.7 acres for $3.6 thousandDifficulties: No significant problems reported
Marshalltown FMGPMarshalltown, IA
Electrical ConductivityBenefits: 27 logs in 5 days for $7.9 thousandDifficulties: Probes broke when encountered cobbles andboulders; weathered bedrock was not distinguishable in logs
New Hampshire Plating CompanyMerrimack, NH
Seismic ReflectionGround PenetratingRadar Natural gammaElectromagnetometry
Benefits: 33 station measurements/7 logs/5,800 ft. of profiles over
13.1 acres for $43.1 thousandDifficulties: Dense clay and sediments limited depth of penetration for GPR and seismic signals
NMHSTD USTDeming, NM
Magnetometry (R)Electromagnetometry (R)Natural Gamma
Benefits: 33 profiles over 15 acres for less than $70 thousand3/
Difficulties: No significant problems reported

8/17/2019 Geophysical Investigation EPA
http://slidepdf.com/reader/full/geophysical-investigation-epa 17/164
Table ES-3: Performance of Geophysical Technologies
Site Name and LocationGeophysicalMethod Used Benefits/Difficulties
12
Tinker Air Force BaseTinker, OK
Seismic ReflectionElectromagnetometry
Benefits: 17,510 feet of profiles over 100 acresDifficulties: Muddy surface conditions interfered with datacollection
Trail Road LandfillNepean, Ontario, Canada
Natural GammaMagnetometryElectrical ConductivityDensityTemperature
Benefits: 5 measurements in 8 logs for $4.2 thousandDifficulties: No significant problems reported
Wurtsmith Air Force BaseOscoda, MI
Ground PenetratingRadar Electromagnetometry (R)Magnetometry (R)
Benefits: 2,700 feet of profiles for $7.7 thousandDifficulties: No significant problems reported
Note: (R) indicates that the method was used in a reconnaissance survey for buried materials that might interfere with primarytechnology.

8/17/2019 Geophysical Investigation EPA
http://slidepdf.com/reader/full/geophysical-investigation-epa 18/164
13
TECHNICAL REFERENCE BIBLIOGRAPHY
Abbey, D.G., Mwenifumbo, C.J., and Killeen, P.G. The Application of BoreholeGeophysics to the Delineation of Leachate Contamination at the Trail Road Landfill Site: Nepean, Ontario. Symposium on the Application of Geophysics to Environmental &Engineering Problems (SAGEEP) (1997). Pg. 163-171.
Adams, Mary-Linda, Herridge, Brian, Sinclair, Nate, Fox, Tad, and Perry, Chris. 3-DSeismic Reflection Surveys for Direct Detection of DNAPL. 1st International Conferenceon Remediation of Chlorinated & Recalcitrant Compounds (1998).
Ahrens, T. J., ed. A Handbook of Physical Constants. Am. Geophys. Union. (1995)
Allen, P. A. Earth Surface Processes. Blackwell, Oxford. (1997)
Annan, A.P., et al. Geophysical Monitoring of DNAPL Migration in a Sandy Aquifer .Society of Exploration Geophysicists Technical Program, 62nd Annual InternationalMeeting and Exposition, 25-29 October 1992.
ASTM (American Society for Testing & Materials). Special Procedures for Testing Soil and Rock for Engineering Purposes. ASTM. (1970)
ASTM. Sampling, Standards and Homogeneity. ASTM, Spec. Tech. Publ. 540. (1973)Bachrach, R., Nur, A., and Rickett, J. Seismic Detection of Viscous Contaminant Using Shallow Seismic Reflection. Symposium on the Application of Geophysics toEnvironmental & Engineering Problems (SAGEEP) (1998). Pg. 685-694.
Bainer, Robert W., Milligan, Paul A., Rector, James W., Carr, Bradley, and Doll, William. Preliminary Report on the Use of Geophysical Vertical Seismic Profiling Techniques for Site Characterization of Subsurface Structures at the Oak Ridge National Laboratory,Oak Ridge, Tennessee. Lawrence Livermore National Laboratory (1998).
Balanis, C.A. Antenna Theory: Analysis and Design. Wiley Press, NY. (1996)
Bauman, P.D., Lockhard, M., Sharma, A., and Kellett, R. Case Studies of 2D ResistivitySurveying for Soils, Waste Management, Geotechnical, and Groundwater Contaminant
Investigations. Symposium on the Application of Geophysics to Environmental &Engineering Problems (SAGEEP) (1997). Pg. 261-269.
Borns D.J., Newman G., Stolarczyk L.S., and Mondt W. Cross Borehole Electromagnetic Imaging of Chemical and Mixed Waste Landfills. Symposium on theApplication of Geophysics to Environmental & Engineering Problems (SAGEEP) (1993).Pg. 91-105.
Berryman, J. G. Mixture Theories for Rock Properties, in Rock Physics & Phase Relations. American Geophysists Union. (1995)
Brewster, M. L., Annan, A. P., Greenhouse, J. P., Kueper, B. H., Olhoeft, G. R., Redman,J. D., and Sander, K. A. Observed Migration of a Controlled DNAPL Release byGeophysical Methods. Ground Water, volume 33 #5 pg. 977-987, (1995).
Buderi, R. The Invention That Changed the World . Simon & Schuster. (1996)
Butler, D.K., et al . Comprehensive Geophysics Investigation of an Existing Dam Foundation - Engineering Geophysics Research and Development . The Leading Edge, v.9, no. 9. (1990)
Carr, M. H. Water on Mars. Oxford University Press, NY. (1996)

8/17/2019 Geophysical Investigation EPA
http://slidepdf.com/reader/full/geophysical-investigation-epa 19/164

8/17/2019 Geophysical Investigation EPA
http://slidepdf.com/reader/full/geophysical-investigation-epa 20/164
15
Hunt, C. P., et al . Magnetic Properties of Rocks and Minerals. in Rock Physics and Phase Relations. American Geophysists Union, Washington DC. (1995)
Kalma, J. D. and Sivapalan, M., eds. Scale Issues in Hydrological Modeling . Wiley, NY.(1995)
Kaufmann, R.D., Yuhr, L.B., and Wonder, J.D. ESC Phase 1: Locating and Mapping
Drilling Mud Pits at the Central Nevada Test Site. Symposium on the Application of Geophysics to Environmental & Engineering Problems (SAGEEP) (1998). Pg. 541-550.
Keithley, J. F. The Story of Electrical and Magnetic Measurements: From Early Days tothe Beginnings of the 20th Century, 50 B.c. to about 1920 A.D. IEEE Press, NY. (1998)
Kirkendall, B. A Rapid Limited 3-dimensional Near-field Modeling Program for Ground Penetrating Radar . Dept of Geophysics, Colorado School of Mines, Golden, CO, MScthesis. (1998)
Kraus, J. D. Electromagnetics, 4th Ed. McGraw-Hill, NY. (1991)
Larson, T.H., Krapac, I.G., Dey, W.S., and Suchomski, C.J. Electromagnetic TerrainConductivity Surveys Used to Screen Swine Confinement Facilities for Groundwater Contamination. Symposium on the Application of Geophysics to Environmental &
Engineering Problems (SAGEEP) (1997). Pg. 271-279.Lemke, Seth R., and Young, Charles T. Leachate Plume Investigation Using Mise-A-La- Masse Resistivity. Symposium on the Application of Geophysics to Environmental &Engineering Problems (SAGEEP) (1998). Pg. 839-847.
Lindsley, D. H., ed. Oxide Minerals. Their Petrologic and Magnetic Significance.Mineral. Soc. Am., Washington, DC. (1991)
Liu, L., and Quan, Y. GPR Attenuation Tomography for Detecting DNAPLS.Symposium on the Application of Geophysics to Environmental & Engineering Problems(SAGEEP) (1997). Pg. 241-259.
Liu, Zhi-Ming, and Doll, William E. Seismic Reflection Processing for Characterizationof a Hazardous Waste Site. Symposium on the Application of Geophysics to
Environmental & Engineering Problems (SAGEEP) (1997). Pg. 291-299.
Lucius, J.E., Olhoeft, G.R., and Duke, S.K., eds. Third International Conference onGround Penetrating Radar, Abstracts of the Technical Meeting . U.S. Geological SurveyOpen-File Report 90-414. (1990)
Lucius, J.E., et al . Properties and Hazards of 108 Selected Substances - 1992 Edition.U.S. Geological Survey Open-File Report 92-527. (1992)
Lucius, J.E., and Olhoeft, G.R. Statistical Analysis of Field-scale Subsurface Heterogeneity at the Princeton, Minn., Management Systems Evaluation Area Using Ground Penetrating Radar , in Agricultural Research to Protect Water QualityConference Proceedings, Feb. 21-24, 1993
Lucius, J.E., and Olhoeft, G.R. Geophysical Investigations of Heterogeneity and Scale at Princeton, Minnesota, Management Systems Evaluation Area. in Proceedings of U. S.Geological Survey Toxic Substances Hydrology Program Review. USGS WRI Report 94-4015. (1996)
Martin, D. H. Magnetism in Solids. Iliffe Books, London .(1967)
Mitchell, J. K. Fundamentals of Soil Behavior, 2nd ed. Wiley, NY, 437p. (1993)

8/17/2019 Geophysical Investigation EPA
http://slidepdf.com/reader/full/geophysical-investigation-epa 21/164
16
Morey, R.M. Ground Penetrating Radar for Evaluating Subsurface Conditions for Transportation Facilities. NAS/NRC/TRB NCHRP Synthesis Report 255. (1998)
Moskowitz, B. M. Fundamental Physical Constants and Conversion Factors. in Global Earth Physics, AGU Reference Shelf Vol. 1. Am. Geophysical Union, Washington, DC.(1995)
Murray, Craig, and Keiswetter, Dean. Application of Magnetic and Multi-frequency EM Techniques for Landfill Investigations: Case Histories. Symposium on the Application of Geophysics to Environmental & Engineering Problems (SAGEEP) (1998). Pg. 445-452.
Nobes, D.C. How Important is the Orientation of a Horizontal Loop EM System? Examples From a Leachate Plume and a Fault Zone. Symposium on the Application of Geophysics to Environmental & Engineering Problems (SAGEEP) (1998). Pg. 453-458.
Olhoeft, G.R. Quantitative Statistical Description of Subsurface Heterogeneities withGround Penetrating Radar at Bemidji, Minnesota in Proceedings of U.S. Geological Survey Toxic Substance Hydrology Program Technical Meeting . USGS WRI 91-4034.(1991)
Olhoeft, G.R. Spatial Variability, in Proceedings of NSF/EPRI Workshop on DynamicSoil Properties and Site Characterization, v. 1. Palo Alto, Electric Power ResearchInstitute Report NP-7337. (1991)
Olhoeft, Gary R. Geophysics Advisor Expert System Version 2.0. U.S. GeologicalSurvey Open-File Report 92-526 (1992).
Olhoeft, G.R. Site Characterization Tools, in Proceedings of Third Int'l. Conf. on Ground Water Quality Research, June 21-24, 1992
Olhoeft, G.R. Geophysical Detection of Hydrocarbon and Organic Chemical Contamination in Bell, R.S., ed, Proceedings on Application of Geophysics to Engineering, and Environmental Problems. Society of Engineering and MiningExploration Geophysics. (1992)
Olhoeft, G.R. Velocity, Attenuation, Dispersion and Diffraction Hole-to-hole Radar
Processing , in Proceedings of the Fourth Tunnel Detection Symposium on Subsurface Exploration Technology, Colorado School of Mines, Golden, CO, 26-29 April 1993.
Olhoeft, G.R., and Capron , D.e. Laboratory Measurements of the Radiofrequency Electrical and Magnetic Properties of Soils from near Yuma, Arizona. U.S. GeologicalSurvey Open-File Report 93-701. (1993)
Olhoeft, G. R. Geophysical Observations of Geological, Hydrological and Geochemical Heterogeneity, in Symposium on the Application of Geophysics to Engineering and Environmental Problems., Mar 27-31, 1994
Olhoeft, G. R. Modeling Out-of-plane Scattering Effects, in Proceedings of the Fifth Int'l.Conf. on Ground Penetrating Radar , Kitchener, Ontario, 12-16 June 1994.
Olhoeft, G. R. and Capron, D. E. Petrophysical Causes of Electromagnetic Dispersion. in
Proceedings of the Fifth Int'l. Conf. on Ground Penetrating Radar , Kitchener, Ontario,12-16 June 1994.
Olhoeft, G. R., Lucius, J. E., and Phillips, S. J. Geophysical Tracking of the Injection of Trench Stabilization Material at U. S. Doe Hanford Site, Richland, Washington . USGSOpen File Report 94-146. (1994)
Olhoeft, G. R., et al. Buried Object Detection with Ground Penetrating Radar , in

8/17/2019 Geophysical Investigation EPA
http://slidepdf.com/reader/full/geophysical-investigation-epa 22/164
17
Proceedings of Unexploded Ordnance (UXO) Detection and Range RemediationConference, Golden, CO. May 17-19, 1994
Olhoeft, G. R. Electrical, Magnetic and Geometric Properties That Determine Ground Penetrating Radar Performance, in Proceedings of 7th Int’l. Conf. On Ground Penetrating Radar . May 27-30, 1998
Opdyke, N. D. and Channell, J. E. T. Magnetic Stratigraphy. Academic Press, NY.(1996)
Peck, Timothy J., Lige, Joy E., MacFarlane, Ian D., and Barranco, Frank T.Characterizing In Situ DNAPL Distribution, Mobility State, and Dissolution. Non-Aqueous Phase Liquids (NAPLs) in Subsurface Environment: Assessment andRemediation Proceedings (1996).
Pellerin, L., Alumbaugh, D.L., and Pfeifer, M.C. The Electromagnetic Integrated Demonstration at the Idaho National Engineering Laboratory Cold Test Pit. Symposiumon the Application of Geophysics to Environmental & Engineering Problems (SAGEEP)(1997). Pg. 725-734.
Powers, M.H., et al . Gprmodel: One-dimensional Full Waveform Forward Modeling of Ground Penetrating Radar Data. U.S. Geological Survey Open-File Report 92-532.(1992)
Powers, M.H. and Olhoeft, G. R. Modeling Dispersive Ground Penetrating Radar Data,in Proceedings of the Fifth Int'l. Conf. on Ground Penetrating Radar . Kitchener, Ontario,12-16 June 1994.
Powers, M.H. and Olhoeft, G. R. GPRMODV2: One-dimensional Full Waveform Forward Modeling of Dispersive Ground Penetrating Radar Data, Version 2.0. U.S.Geological Survey Open File Report 95-58 (1995)
Powers, M.H. and Olhoeft, G. R. Modeling the Gpr Response of Leaking, Buried Pipes,in Proceedings of SAGEEP. Keystone, Colorado. (1996)
Powers, M.H. and Olhoeft, G. R. Computer Modeling to Transfer GPR UXO
Detectability Knowledge Between Sites. in UXO Forum Conference Proceedings. March26-29, 1996.
Sandberg, S.K., Rogers, N.T., Karp, K.E., Goodknight, C.S., and Spencer, L.F. IP and TEM for Discrimination and Resolution in Mapping Groundwater Contamination at Monument Valley. Symposium on the Application of Geophysics to Environmental &Engineering Problems (SAGEEP) (1998). Pg. 795-804.
Sander, K.A., Olhoeft, G.R., and Lucius, J.E. Surface and Borehole Radar Monitoring of a Dnapl Spill in 3d Versus Frequency, Look Angle and Time, in Bell, R.S., ed, Proceedings of the Symposium on the Application of Geophysics to Engineering and Environmental Problems. Society of Engineering and Mineral Exploration Geophysics.(1992)
Schmidbauer,E. and Mirwald, P. W. Electric Conductivity of Cordierite, in Mineralogy Petrology, v. 48. (1993)
Schon, J. H. Physical Properties of Rocks. Fundamentals and Principles of Petrophysics.2nd. ed. Pergamon Press. (1998,)
Smith, G. S. an Introduction to Classical Electromagnetic Radiation. Cambridge Univ.Press. (1997)

8/17/2019 Geophysical Investigation EPA
http://slidepdf.com/reader/full/geophysical-investigation-epa 23/164
18
Stumm, W. Chemistry of the Solid-water Interface -- Processes at the Mineral-water and Particle-water Interface in Natural Systems. Wiley-Interscience. (1992)
Tarling, D. H. and Hrouda, F. The Magnetic Anisotropy of Rocks. Chapman & Hall,London. (1993)
Tiab, D. and Donaldson, E. C. Petrophysics. Theory and Practice of Measuring Reservoir
Rock and Fluid Transport Properties. Gulf Publishing Co. (1996)Torquato, S. Random Heterogeneous Media. Microstructure and Improved Bounds on Effective Properties. Appl. Mech. Rev., v. 44. (1991)
Tyburczy, J. A. and Fisler, D. K. Electrical Properties of Minerals and Melts, in Mineral Physics and Crystallography. AGU, Wash.DC. (1995)
Wright, D.L., Olhoeft, G.R., and Grover, T.P. Velocity, Attenuation and Dispersion Electromagnetic Tomography in Fractured Rock . USGS WRI Report 94-4015. (1996)
Wright, D.L., et al. High-speed Digital Radar Systems and Applications to Subsurface Exploration, in Proceedings of the Fourth Tunnel Detection Symposium on Subsurface Exploration Technology. Colorado School of Mines, Golden, CO, 26-29 April 1993.
Wright, D.L., et al. Electromagnetic and Seismic Tomography Compared to Borehole Acoustic Televiewer and Flowmeter Logs for Subsurface Fracture in Mapping at the Mirror Lake Site, New Hampshire. USGS WRI Report 94-4015. (1996)
Wyatt, D.E. and Temples, T.J. Ground-penetrating Radar Detection of Small-scaleChannels, Joints and Faults in the Unconsolidated Sediments of the Atlantic Coastal Plain. Environmental Geology - Abstract Volume 27 Issue 3 (1996)

8/17/2019 Geophysical Investigation EPA
http://slidepdf.com/reader/full/geophysical-investigation-epa 24/164
6.0 CASE STUDIES

8/17/2019 Geophysical Investigation EPA
http://slidepdf.com/reader/full/geophysical-investigation-epa 25/164
Baker Wood Creosoting Company
19
Case Study Abstract
Baker Wood Creosoting Company
Marion, Ohio
Site Name and Location:
Baker Wood Creosoting Company
Marion, Ohio
Geophysical Technologies:
Ground penetrating radar
Electromagnetic induction
Date of Investigation:
January and February, 1999
Period of Site Operation:
1890's to 1960's
Operable Unit: N/A
Current Site Activities:
Assessment of sediments in the Little
Scioto River is being performed. Future
plans include installing five or six
shallow water wells to determine if the
groundwater is contaminated.
Points of Contact:
Mark Durno
U.S. EPA25089 Center Ridge Road
Westlake, OH 44145
216-522-7260
Mr. Mark Vendl
Mail Code SRT-4J
USEPA Region 5
77 West Jackson Boulevard
Chicago, IL 60604-3507
Geological Setting:
Two to three feet of silt loam
underlain by a firm calcareous clay
Technology Demonstrator:
U.S. EPA and
Ohio State University
Purpose of Investigation: To locate possible buried waste pits or other contaminant-filled structures and to delineate the
extent of contamination within the surficial soils.
Number of Images/Profiles Generated During Investigation: 100 GPR traverses
Results: Lateral extent of contamination determined in the shallow subsurface by EM and GPR. GPR was operated in a
cross- and co-pole antenna configuration which clearly identified a series of buried vaults containing highly contaminated
material.

8/17/2019 Geophysical Investigation EPA
http://slidepdf.com/reader/full/geophysical-investigation-epa 26/164
Baker Wood Creosoting Company
20
EXECUTIVE SUMMARY
The former Baker Wood Creosoting Company is located on 60 acres in Marion. The site is located
approximately one-half mile northwest of downtown Marion. The Little Scioto River is located one mile to
the west of the site. The property was used from the 1890s to the 1960s as a wood treating facility, and the
preservatives used were most likely creosote, petroleum, and other solvents. All buildings have been
removed from the site, but the concrete pads that supported the creosote storage tanks and a former pump
house remain. The geophysical study was conducted within the area that encompasses the former tank area
and pump house.
The surficial soils consist of a two- to three-foot surface layer of silt loam, underlain by a firm calcerous
clay. Glacial till containing occasional thin interbedded sand layers extends from beneath the surface soil
to Silurian limestone/dolomite bedrock, which is present at depths of approximately 13 to 25 feet below
ground surface in the area. The limestone/dolomite bedrock appears to contain a shallow and deep aquifer.
Regional groundwater flow direction of the deep aquifer is believed to be influenced by the quarry located
northeast of the Baker Wood site and by the municipal well field situated west of the site. Typically, the
generalized groundwater flow is westward towards the Little Scioto River.
A geophysical investigation was conducted in 1999 to delineate the extent of contamination prior to
conducting a time critical removal action. The information in this report was derived from the interpretive
report for the geophysical investigation. Two geophysical methods were used during this investigation. A
ground penetrating radar (GPR) survey was conducted first, followed by a frequency domain
electromagnetic induction (EM) survey. The GPR was used to locate subsurface structures that might
contain contamination while EM was used to detect anomalous soil conductivities that might indicate the
presence of contamination in the surface and near-surface soils.
The GPR survey identified nine areas with significant subsurface anomalies in the study area. Five of the
areas included vaults buried underneath each of four tank pads, a creosote-filled pit, and a trench. The EM
survey found areas of low conductivity soils that indicate the potential location of contaminated soil. Areas
of low conductivity were less prominent in the lower frequency data than in the higher frequency data
indicating that contamination was predominantly present in the near surface. Subsequent exploratory
trenching and screening analysis of soils was conducted in the nine areas identified in the geophysical
investigation, and significant contamination was found in five of them.
Although soil sampling from 1996 showed contamination in the same area as the GPR survey showed, the
lateral extent of contamination was unknown prior to the GPR survey. The GPR survey provided
information on lateral extent. Based on the GPR survey, it was estimated that 1800 cubic yards of
contamination existed at the Baker Woods site. Because contamination was found to a depth of five and
six feet in some locations, and the GPR was only able to see to four feet, an additional 400 cubic yards of
contamination was found and removed.

8/17/2019 Geophysical Investigation EPA
http://slidepdf.com/reader/full/geophysical-investigation-epa 27/164
Baker Wood Creosoting Company
21
Figure 1: Site Location
SITE INFORMATION
Identifying Information
Baker Wood Creosoting CompanyHolland Road and Kenton Street
Marion, Ohio
Background [1, 2, 3, 4, 5, 7]
Physical Description: The former Baker Wood Creosoting Company is located on 60 acres in
Marion, Ohio, in the north-central part of the state, as shown in Figure 1. The Baker Wood
Creosoting Company is located at the northwest corner of Holland Road and Kenton Street (State
Route 309), and is approximately one-half mile northwest of downtown Marion. The Little Scioto
River is located one mile to the west of the site. The topography of the site is flat with a shallow
westward gradient.
All buildings have been removed from the site, but
the concrete pads that supported the creosote
storage tanks and a former pump house remain.
The pads and former pump house are located within
an area of approximately 130 by 50 feet, just south
of a gravel access road. The geophysical study was
conducted on a 300- by 100-foot area that
encompasses the former tank area and pump house.
This part of the site is located in the southeast
section of the 60 acres (See Figure 2).
Site Use: The property was used from the 1890s to
the 1960s as a wood treating facility, and was owned by the Baker Wood Creosoting Company.
Historical information indicates that the process used pressure vessels to treat railroad ties and
other wood products. The preservatives used were most likely creosote, petroleum, and other
solvents. It is currently owned by Baker Wood Limited Partnership and is an inactive site.
It was believed that chemical wastes were discharged to the combined sanitary/storm sewer that is
located adjacent to the site, along the southern border. The sewer flows west and discharges
directly into North Rockswale Ditch. Drawings indicate that the old sewer tie-ins from the facility
may still be in use. This combined sanitary/storm sewer is thought to be a direct link to the surface
water contaminant migration pathway leading to the North Rockswale Ditch.

8/17/2019 Geophysical Investigation EPA
http://slidepdf.com/reader/full/geophysical-investigation-epa 28/164
SITE INFORMATIONBaker Wood Creosoting Company
22
Figure 2: Baker Wood Site Map [1]
Release/Investigation History:
Numerous sampling events have been conducted in and around the Baker Wood site since the
1940s. In 1988 and 1991, the Ohio Environmental Protection Agency (EPA) collected sediment
samples from the Little Scioto and Scioto Rivers. Analysis of the samples showed high
concentrations of polycyclic aromatic hydrocarbons (PAHs). Investigators observed on both
occasions that the banks and bottom sediments of the Little Scioto River were heavily saturated
with a black material with a creosote odor. When disturbed, the bottom sediments released an
substance that left an oily sheen on the water’s surface. The U.S. EPA and Ohio EPA collectedsoil samples in 1996 around the former creosote storage tanks and pump house. Analytical results
from the soil samples revealed some of the highest concentrations of PAHs ever recorded in the
published literature.

8/17/2019 Geophysical Investigation EPA
http://slidepdf.com/reader/full/geophysical-investigation-epa 29/164
SITE INFORMATIONBaker Wood Creosoting Company
23
Regulatory Context:
The U.S. EPA and Ohio EPA have conducted response actions at the Baker Woods Creosoting
Company site under a time critical removal authority provided under the Comprehensive
Environmental Response, Compensation, and Liability Act (CERCLA), as amended by the
Superfund Amendments Reform Act (SARA).
Site Logistics/Contacts
State Lead Agency: Ohio EPA
Federal Oversight Agency: U.S. EPA
Remedial Project Manager:
Mark Durno
U.S. EPA25089 Center Ridge Road
Westlake, OH 44145
216-522-7260
Site Contact:
Mr. Mark Vendl
Mail Code SRT-4J
USEPA Region 5
77 West Jackson Boulevard
Chicago, IL 60604-3507312-886-0405
Geophysical Subcontractors:
Dr. Jeffery Daniels
Department of Geological Sciences
Ohio State University
125 South Oval Mall
Columbus, OH 43210-1398
614-292-4295

8/17/2019 Geophysical Investigation EPA
http://slidepdf.com/reader/full/geophysical-investigation-epa 30/164
Baker Wood Creosoting Company
24
MEDIA AND CONTAMINANTS
Matrix Identification [3]
Type of Matrix Sampled and Analyzed:Subsurface soil consisting of silt loam.
Site Geology/Stratigraphy [3, 5]
The surficial soil profile at the Baker Wood site consists of a two- to three-foot surface layer of silt
loam, underlain by a firm calcerous clay. Glacial till containing occasional thin interbedded sand
layers extends from beneath the surface soil to Silurian limestone/dolomite bedrock, which is
present at depths of approximately 13 to 25 feet below ground surface (bgs) in the area. The
limestone/dolomite bedrock appears to contain a shallow and deep aquifer. The shallow aquifer is
encountered at approximately 40 feet bgs, and the deep aquifer is encountered at about 250 feet
bgs.
Regional groundwater flow direction of the deep aquifer is believed to be influenced by the quarry
located northeast of the Baker Wood site and by the municipal well field situated west of the site.
Typically, the generalized groundwater flow is westward towards the Little Scioto River.
Contaminant Characterization [1]
Primary Contaminant Groups: The primary contaminants of concern at this site are volatile
organic compounds (VOCs) and PAHs.
Matrix Characteristics Affecting Characterization Cost or Performance [1]
Clays in the soils and high soil moisture content posed a significant challenge for GPR data
collection during the investigation by limiting the depth to which measurements could be taken.
Both caused excessive signal attenuation resulting in late signal arrival times. Investigators tried to
correct for this interference by using a 300 MegaHertz (MHZ) antenna, but the radio tower,
located on the adjacent property, caused interfering noise at that frequency. As a result, a 500
MHZ antenna was used for the investigation, but at this frequency, the investigation depth was
limited to three to four feet bgs. The investigation team believed this to be a sufficient depth based
on prior knowledge of site conditions.
Standing water, which ranged in depth from 10 to 15 inches, on the site resulted in late signal
arrival times, but the standing water was mapped so that the data interpretation would not be
affected. The late arrival times were due to the water having a relatively lower velocity than thesurrounding areas that did not have water present.

8/17/2019 Geophysical Investigation EPA
http://slidepdf.com/reader/full/geophysical-investigation-epa 31/164
Baker Wood Creosoting Company
25
GEOPHYSICAL INVESTIGATION PROCESS
Investigation Goals [1]
The goals for this project were to locate possible buried waste pits or other contaminant-filledstructures, and to delineate the extent of contamination within the surficial soils.
Geophysical Methods [1, 6]
Two geophysical methods were used for this investigation. A ground penetrating radar (GPR)
survey was conducted first, followed by a frequency domain electromagnetic induction (EM)
survey. The GPR was used to locate subsurface structures that might contain contamination while
EM was used to detect anomalous soil conductivities that might indicate the presence of
contamination in the surface and near-surface soils.
GPR employs an extremely short electromagnetic pulse that penetrates into the earth. A portion of
the energy is reflected back to the surface, where it is detected by the receiving antenna. Theamplitude of the reflected pulse depends primarily on the soil’s dielectric constant, or the measure
of electrical conductivity of soils. GPR anomalies result when there is a contrast in the bulk
dielectric property between materials, marking a boundary between geologic structures. The time
lapse between transmission and receipt of the EM signal it is measured in nanoseconds (ns) and is
transmitted to a control unit for processing and display.
The GPR study design for the Baker Wood Site called for the collection of two complementary sets
of data. The data were collected using the GPR in a co-pole and then in a cross-pole antenna
configuration (See Figure 3). The collection and comparison of the two types of data added an
analytical dimension to the GPR data that improved the GPR data, thus improving the
interpretation of the results. Each antenna configuration is sensitive to different types of objects inthe subsurface.
The polarization of reflected electromagnetic energy depends on the geometry of the reflecting
surface. Relatively flat subsurface targets or ones with small curvature reflect relatively large
currents of linearly polarized signals. Targets that are not planar, or have irregular surfaces,
scatter or depolarize the EM waves. A co-pole antenna configuration is primarily sensitive to
linearly polarized reflections. The cross-pole configuration is most sensitive to depolarized
reflections, while being less sensitive to energy that is scattered parallel to the transmit antenna.
Thus, the use of both antenna configurations allowed investigators to identify anomalies
representing a wider variety of subsurface geometries.

8/17/2019 Geophysical Investigation EPA
http://slidepdf.com/reader/full/geophysical-investigation-epa 32/164
GEOPHYSICAL INVESTIGATION PROCESSBaker Wood Creosoting Company
26
Figure 3: Antenna Configurations for Co-Pole and Cross-Pole GPR
Measurements

8/17/2019 Geophysical Investigation EPA
http://slidepdf.com/reader/full/geophysical-investigation-epa 33/164
GEOPHYSICAL INVESTIGATION PROCESSBaker Wood Creosoting Company
27
Figure 4: Geophysical Survey Area Showing North-South Traverse Lines [1]
Geophysical surveys were conducted on a 100- by 300-foot grid with a 3-foot spacing between the
north-south traverse lines. This area included the foundations of the creosote storage tanks and the
former pump house (see Figure 4). Two separate surveys were conducted during January and
February 1999. The data from the two surveys was compared to identify variations in the results
due to changes in soil moisture. No significant variation was detected in the results of the two
surveys.
The GPR survey was conducted using a Geophysical Survey Systems, Inc. (GSSI) 500 MHZ
multi-component antenna with a Subsurface Interface Radar (SIR)-10 recording system with a
fixed number of traces recorded per distance traveled. The GPR system was towed using a survey
wheel to accurately position the data spatially.
The EM survey was conducted to identify the spatial extent of soil contamination, identified b y the
survey as areas of anomalous low conductivity resulting from creosote contamination within
surficial soils. It has been postulated that when organic contamination interacts with and displaces
soil moisture in the vadose zone, a decrease in conductivity can result. In the areas where the
highest levels of creosote contamination were found, the EM survey showed the lowest conductivityvalues in the entire area.
The EM method is based on measuring the response of an electromagnetic field induced into the
earth. Low frequency signals, one to ten kilohertz, are transmitted by a small coil. The low
frequency, very long wavelength, electromagnetic fields produced by the transmitter induce current
flow in electrically conductive media in the earth. This induced current flow produces secondary

8/17/2019 Geophysical Investigation EPA
http://slidepdf.com/reader/full/geophysical-investigation-epa 34/164
GEOPHYSICAL INVESTIGATION PROCESSBaker Wood Creosoting Company
28
electromagnetic fields which will radiate back to the surface. A receiving coil detects the
secondary field and measures the strength and phase relative to the transmitted signal.
This EM survey was conducted using a GSSI GEM-300. For the GEM-300 system, the secondary
field that is measured is split into in-phase and quadrature components that are expressed in parts
per million (ppm) against the primary induced field strength. The in-phase response is sensitive to
metal conducting targets and is referred to as the metal detector mode, while the quadrature phase
response is sensitive to non-metallic conductors and is referred to as the terrain conductivity mode.
EM measurements were taken every two feet along the same traverse lines on the 100- by 300-foot
survey grid used in the GPR survey. Measurements were taken at three different frequencies: 2010
Hz (2kHz), 4410 Hz (4 kHz), and 9810 Hz (9kHz), with the long axis of the instrument oriented
parallel to the survey lines and the dipole axis oriented vertical to the plane of the ground. The
variation in frequencies provided investigations to different depths. The depth of penetration of the
transmitted field is a function of the frequency of operation or frequency of the EM signal. Lower frequencies penetrate deeper, while higher frequencies are attenuated more rapidly.
GEOPHYSICAL FINDINGS
Technology Calibration
No independent calibration information was required for the GPR and EM instruments used in this
investigation.
Investigation Results [1]
The GPR survey identified nine areas with significant subsurface anomalies in the study area.
Subsequent exploratory trenching and screening analysis of soils at the nine areas found significant
contamination in five of them. The five areas included vaults underneath each of four tank pads, a
creosote-filled pit, and a trench. The GPR findings discussed in this case study are limited to those
that focus on the creosote-filled pit and one of the tank pad vaults as they are representative of the
data collected around the other significant anomalies.
Figure 5 shows both two-dimensional (2-D) and three-dimensional (3-D) displays of the cross-pole
data collected southeast of the former pump house. Three-dimensional displays were generated by
stacking multiple 2-D profiles and provide an enhanced visualization of the GPR anomaly. The
anomaly in this profile was determined to be a creosote-filled pit during subsequent sampling andanalysis of the soils in the area. Co-pole data collected along the same set of traverses contained
more clutter, making identification of the anomaly difficult.
Figure 6 presents 2-D and 3-D views of both co- and cross-pole data collected near the two
easternmost storage tank pads. A backfilled-trench, which later was discovered to contain

8/17/2019 Geophysical Investigation EPA
http://slidepdf.com/reader/full/geophysical-investigation-epa 35/164
GEOPHYSICAL FINDINGSBaker Wood Creosoting Company
29
creosote-contaminated drainage tile, can be seen in the profiles, located between the two storage
pads. A comparison of the views generated using co- and cross-pole data shows that the cross-pole
data contains less clutter and has better resolution. The clutter present in the co-pole data nearly
obscures the trenched area between the two pads.
The EM survey in-phase data showed anomalous regions of relative high conductivity in the
vicinity of the tank and pump house foundations as a result of rebar within these structures. These
regions of relatively high conductivity were also evident in the quadrature responses at the 4 kHz
and 9 kHz frequencies measured. Areas of low conductivity, shown as light areas in Figure 7,
indicate the potential location of contaminated soil. Research has shown that as the soil moisture
becomes contaminated with organic compounds, including those found at this site, the electrical
conductivity of those soils decreases. Areas of low conductivity were less prominent in the 4 kHz
data than in the 9 kHz data indicating that contamination is predominantly present in the near
surface. The 4 kHz data showed areas of low conductivity in the vicinity of the tank foundations,
which correlated with soil contamination that was found at greater depths.
Figures 8 shows where the geophysical survey found anomalies and where trenching was to be
conducted based on the anomalies. Figure 9 shows where the creosote-filled pits and vaults were
located. Comparing the two figures it is apparent that the accuracy with which the GPR survey
identified the location of the vaults and pit was within a few feet.
Although soil sampling from 1996 showed contamination in the same area as the GPR survey, the
lateral extent of contamination was unknown prior to the GPR survey. Based on the GPR survey,
it was estimated that 1,800 cubic yards of contamination existed at the Baker Woods site. During
excavation, contamination in some locations was found to a depth of 5 or 6 feet, but primarily, the
contamination was excavated from the same depths as those indicated by the EM survey. By the
end of the cleanup project, the total soil removed was 2,200 cubic yards. Thus, estimations theresults of the geophysical surveys were within 20 percent of the volume of contaminated material
excavated at the site.

8/17/2019 Geophysical Investigation EPA
http://slidepdf.com/reader/full/geophysical-investigation-epa 36/164
GEOPHYSICAL FINDINGSBaker Wood Creosoting Company
30
Figure 5: Cross-Pole Data Collected Near Pump House Foundation [1]

8/17/2019 Geophysical Investigation EPA
http://slidepdf.com/reader/full/geophysical-investigation-epa 37/164
GEOPHYSICAL FINDINGSBaker Wood Creosoting Company
31
F i g u r e 6 : G P R D a t a C o l l e c t e d N e a r E a s t e r n S t o r a g e P a d s [ 1 ] [ P o o r Q u a l i t y O r i g i n a l ]

8/17/2019 Geophysical Investigation EPA
http://slidepdf.com/reader/full/geophysical-investigation-epa 38/164
GEOPHYSICAL FINDINGSBaker Wood Creosoting Company
32
Figure 7: Electromagnetic Conductivity of Soils in Study Area [1]

8/17/2019 Geophysical Investigation EPA
http://slidepdf.com/reader/full/geophysical-investigation-epa 39/164
GEOPHYSICAL FINDINGSBaker Wood Creosoting Company
33
Figure 8: Locations Selected For Screening by Geophysical Surveys [1]
Figure 9: Locations of Significant Soil Contamination [1]

8/17/2019 Geophysical Investigation EPA
http://slidepdf.com/reader/full/geophysical-investigation-epa 40/164
GEOPHYSICAL FINDINGSBaker Wood Creosoting Company
34
Results Validation [1, 7]
Using the GPR and EM results together, investigators were able to identify nine areas for further,
invasive investigation. Exploratory trenches were excavated in each of the nine areas and soil
samples were taken from the trenches. The soil samples were analyzed in the field using a field
portable flame ionization detector. Based on these analytical results, significant contamination was
found in five of the nine areas.
LESSONS LEARNED
Some of the lessons learned from this investigation include the following:
C The effectiveness of this GPR survey was improved with the collection and analyses of
both co-pole and cross pole data.
C Standing surface water and layered clay soils attenuated the GPR signal in certain portions
of the study area, interfering with the interpretation. These areas were mapped. It is
anticipated that results would have been clearer in the absence of standing water.
C The GPR survey was successful in identifying subsurface structures that held
contaminated material, including a vault hidden beneath a pit. The EM survey was
successful in identifying areas of suspected soil contamination. Information from both
surveys were used to identify nine areas for investigation. Trenches were excavated and
the soils analyzed in each area. Significant contamination was found in five of the areas.
C
Although soil sampling from 1996 showed contamination in the same area as the GPR survey showed, the lateral extent of contamination was unknown prior to the GPR survey.
Based on the GPR survey, it was estimated that 1800 cubic yards of contamination existed
at the Baker Woods site. Because contamination was found to a depth of 5 and 6 feet in
some locations, and the GPR was only able to see to 4 feet bgs, an additional 400 cubic
yards of contamination was found and removed.
C The low conductivity areas identified in the EM survey correlated with areas of high
concentrations of creosote contamination and were verified through soil sample analysis
and exploratory trenching.

8/17/2019 Geophysical Investigation EPA
http://slidepdf.com/reader/full/geophysical-investigation-epa 41/164
Baker Wood Creosoting Company
35
REFERENCES
1. Guy, E.; Daniels, J.; Holt, J.; Radzevicius, S. Geophysical Investigations at the Former
Baker Wood Site, Marion, Ohio. Ohio State University. August 1999.
2. U.S. Environmental Protection Agency. Environmental News Release No. 99-OPA117.
April 26, 1999.
3. Ohio Environmental Protection Agency. Bottom Sediment Evaluation of Little Scioto
River, Marion, Ohio. 1992.
4. U.S. Environmental Protection Agency. Fact Sheet: U.S. EPA Continues Cleanup At
Baker Wood Creosoting Site. July 1999.
5. Ohio Environmental Protection Agency. Integrated Assessment (IA) Report: Baker Wood
Creosoting Site, Marion, Marion County. 1998.
6. Personal Communication with Mark Vendl of U.S. EPA. September 30, 1999.
7. Personal Communication with Mark Durno of U.S. EPA. September 30, 1999.

8/17/2019 Geophysical Investigation EPA
http://slidepdf.com/reader/full/geophysical-investigation-epa 42/164

8/17/2019 Geophysical Investigation EPA
http://slidepdf.com/reader/full/geophysical-investigation-epa 43/164
Ciba-Geigy H&H
37
Case Study Abstract
Ciba-Geigy Hamblet & Hayes (H&H) Site
Lewiston, ME
Site Name and Location:
Ciba-Geigy Hamblet & Hayes SiteGeophysical Technologies:
Ground Penetrating Radar (GPR)CERCLIS #
Not applicable
Period of Site Operation:
1963 to 1995 solvent
repackaging/chemical redistribution
Operable Unit:
Not applicable
Current Site Activities:
A groundwater pump and treat system
and an air sparging/soil vapor extraction
system were installed at the site in 1996,
and have been operating since early 1997.
Additional investigation work on areas
where dense nonaqueous phase liquids
(DNAPLs) have been found are also
ongoing.
Point of Contact:Stephen Walbridge
Harding Lawson Associates
511 Congress Street
P.O. Box 7050
Portland, ME 04112-7050
(207) 828-3482
Geological Setting:The surficial unit is the Presumpscot
Formation, a marine deposit consisting
of varying amounts of clay, silt, and
fine sand. Overlying this formation is
a unit primarily composed of sandy
fill. Below the Presumpscot
Formation is a sand and gravel unit.
Technology Vendor:Geophysical Survey Systems, Inc.
13 Klein Dr.
North Salem, NH 03073-0097
(603) 893-1109
Fax (603) 889-3984
Purpose of Investigation:
The purpose of the GPR survey was to provide information on the continuity and topographic relief of clay layers in near-
surface soils beneath the site. Identifying these high and low points of the clay layer would help identify where DNAPL
might accumulate.
Number of Images/Profiles Generated During Investigation: 85 traverses
Results:
The GPR survey successfully identified continuous reflectors that represent silty clay layers in the shallow subsurface soils
beneath the site. There was an observed parallel relationship of the various sand, silt, or clay layers that are present in the
shallow subsurface soils that suggest the topography of the interpretive layer mimics the topography of the massive silty clay
known to exist 19 to 22 feet below the ground surface (bgs) in the area of the GPR survey. This would provide a downward
sloping pathway for DNAPL to move along until accumulating in topographically low areas identified, such as beneath the
southwest corner of the leachfield.

8/17/2019 Geophysical Investigation EPA
http://slidepdf.com/reader/full/geophysical-investigation-epa 44/164
Ciba-Geigy H&H
38
EXECUTIVE SUMMARY
The Ciba-Geigy Corporation (Ciba-Geigy) Hamblet and Hayes (H&H) site is a complex of buildings
located off of Crowley Road in Lewiston, Maine. The facility was primarily known for its solvent
repackaging activities. Suspected site contamination was associated partly with an incident which occurredin 1983 when a valve was inadvertently left open and approximately 1,000 gallons of xylenes were spilled
onto the ground. An environmental assessment was conducted and revealed that a contaminated
groundwater plume and contaminated soil, primarily consisting of chlorinated solvents and xylenes, existed
at the site.
The surficial geologic unit is the Presumpscot Formation, a marine deposit consisting of varying amounts
of clay, silt, and fine sand. Overlying the Presumpscot Formation at the site is a unit that is composed of
sandy fill to an approximate depth of 7 feet below ground surface (bgs). Underneath the Presumpscot
Formation is a sand and gravel unit that extends to depths of 45 feet bgs.
As part of the third Phase of the site investigation process, a ground penetrating radar (GPR) survey was
conducted to map the top of the clay surface. The information presented in this report was derived from theinterpretive report of the geophysical investigation. At least four reflectors were identified. The four
reflectors were interpreted to represent the top of the silty clay layers that comprise the upper portion of the
marine clay formation found at the site. The uppermost reflector was interpreted to be a silty clay layer
and was chosen for further interpretation. The silty clay layer was present on most profiles and determined
to be continuous throughout the study area. A topographic low for potential dense non-aqueous phase
liquid (DNAPL) pooling was identified near the western corner of the site.
The GPR data were accurate to site conditions and the confidence level of the decisionmakers in the results
was high. Their confidence in the level of accuracy of the GPR data was validated through later
investigations and comparisons to soil boring data. Overall the GPR survey was an effective tool for
identifying continuous reflectors that represented silty clay layers in the shallow subsurface soils beneath
the site.
As a result of the GPR survey, the topographic low point of the upper surface of the underlying aquitard
was determined. This low point was chosen as a location to install an extraction well, since this would be a
potential area where DNAPL might pool. DNAPL was encountered during the installation of the
extraction well, confirming the results of the GPR survey. Later comparisons to soil boring data also
verified the accuracy of the GPR data.

8/17/2019 Geophysical Investigation EPA
http://slidepdf.com/reader/full/geophysical-investigation-epa 45/164
Ciba-Geigy H&H
39
SITE INFORMATION
Identifying Information
Ciba-Geigy Hamblet & Hayes (H&H) SiteLewiston, ME 55952
Resource Conservation and Recovery Act (RCRA) Site
Background [1]
Physical Description: The H&H site is a complex of buildings located to the southeastern side of
Crowley Road in Lewiston, Maine (Figure 1) which occupies an area approximately 450 feet (ft)
wide by 600 ft long on a 5.5 acre parcel of land at approximately 190 ft above mean sea level. The
site slopes gently from northeast to southwest, toward No Name Brook. Surface drainage from
around the buildings collects and flows into a drainage ditch that encompasses the site. Overall,
surface drainage primarily flows southwest from the site into No Name Brook. Swampy
conditions exist in the area of monitoring wells MW-205A and MW-205B, which is primarily tothe south of the study area (Figure 2). A mounded leachfield was built in 1979 to replace the
former leachfield and was used for treating sanitary wastes at the site. The previous leachfield was
located beneath what is currently the northeastern portion of the truck loading warehouse/office
building.
The study area for the Ground Penetrating Radar (GPR) survey was between Crowley Road and
the truck loading warehouse/office building (350 ft by 400 ft in area) and in the immediate area
along the southeast side of the building (100 ft by 250 ft in area). This covered an area from the
former underground storage tanks (USTs), which is the source area, to the railroad tracks (Figure
2).
Site Use: The facility began operations as a solvent repackaging facility in 1963 as the Polar
Chemical Division of Hamblet & Hayes Co. (H&H), which was then was purchased by Ciba-
Geigy in 1978. The facility ceased solvent repackaging operations in 1985 and changed to a
chemical redistribution facility. While operating as a repackaging facility, bulk chemicals were
received by tank truck and railroad freight car and then stored in the warehouse and in a series of
eight USTs and two aboveground storage tanks. The USTs were located on the northwestern side
of the flammable materials storage building, which is located in the north end of the site. One of
the aboveground storage tanks was located adjacent to the flammable materials storage building
and the other on the southeastern side of the truck loading warehouse/office building. Chlorinated
and non-chlorinated solvents were stored in the storage tank areas. Solvents were
pumped from the tanks and repackaged into drums and other containers for distribution. The
containers were then loaded onto trucks and shipped for delivery. In 1989, the site was
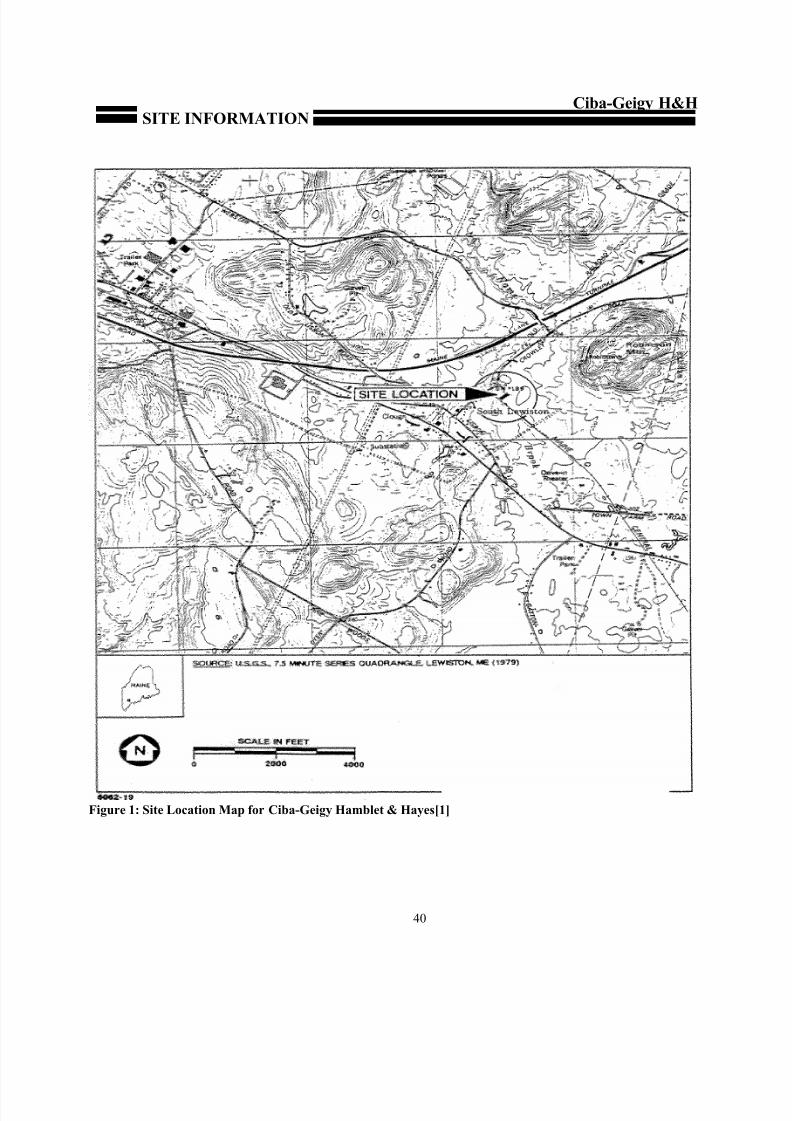
8/17/2019 Geophysical Investigation EPA
http://slidepdf.com/reader/full/geophysical-investigation-epa 46/164
SITE INFORMATIONCiba-Geigy H&H
40
Figure 1: Site Location Map for Ciba-Geigy Hamblet & Hayes[1]

8/17/2019 Geophysical Investigation EPA
http://slidepdf.com/reader/full/geophysical-investigation-epa 47/164
SITE INFORMATIONCiba-Geigy H&H
41
F i g u r e 2 : L o c a t i o n o f G P R T r a v e r s e s [ 1 ]

8/17/2019 Geophysical Investigation EPA
http://slidepdf.com/reader/full/geophysical-investigation-epa 48/164
SITE INFORMATIONCiba-Geigy H&H
42
purchased by Van Waters & Rogers, Inc., and operations ceased in 1995. In 1997 Ciba-Geigy
reacquired the property. Currently, limited truck parking and trailer transferring are the only
activities at the site.
A groundwater pump and treat system and an air sparging/soil vapor extraction (SVE) system
were installed at the site in 1996, and have been operating since early 1997. The pump and
treatment system includes four extraction wells screened in the shallow silty sand aquifer, including
EW-401 at the location of dense nonaqueous phase liquids (DNAPLs), and one extraction well
(EW-501) screened in the underlying sand and gravel aquifer. The sparging/SVE system is located
in the former UST area where light nonaqueous phase liquids (LNAPLs) and very high volatile
organic compound (VOC) concentrations have been found in both the saturated and unsaturated
zones.
Release/Investigation History: Suspected site contamination occurred in 1983 when a tank valve
was inadvertently left open and approximately 1,000 gallons of xylenes were spilled onto theground. H&H employees reported that xylenes ran along the asphalt driveway surface and ponded
in a low area off the asphalt directly across from the front of the truck loading warehouse/office
building. The spill was promptly reported to the Maine Department of Environmental Protection
(MEDEP) and emergency response crews responded to the spill by excavating the ponded, free
product xylenes and contaminated soils. A recovery sump was installed at the corner of the
flammable materials storage building in order to recover the portion of xylenes that infiltrated the
ground and was floating on top of the groundwater. H&H employees reported that xylenes were
skimmed from this sump for approximately four years after the incident. The pumping was
discontinued in 1987 due to low or nonexistent levels of recoverable product.
In 1985, the USTs were removed under the supervision of MEDEP personnel. The excavation was
backfilled with soils excavated from around the tanks, along with clean, off-site backfill material.The tanks appeared to be in excellent condition, but a solvent odor was noticeable. No soil or
water samples were collected as a part of the tank removal process.
The investigation that documented the suspected contamination at the site was a result of the 1989
property transfer Phase I investigation program. ABB Environmental Services, Inc. was
contracted by Ciba-Geigy Corporation (Ciba-Geigy) to conduct an environmental assessment and
develop a plan for any necessary cleanup of suspected soil and groundwater contamination at the
H&H site. This assessment generated enough data to determine that a contaminated groundwater
plume, primarily consisting of chlorinated solvents and xylenes, existed at the site. Soil
contamination was also identified as being present in the vicinity of the former UST area.
Contamination has also been identified in the sediments and surface water of No Name Brook.Recent investigations have been conducted in areas where some DNAPL was identified during the
installation of extraction well EW-401. The presence of DNAPL was first confirmed in EW-401
in November of 1994. EW-401 is located adjacent to piezometer PZ-4 (Figure 2).

8/17/2019 Geophysical Investigation EPA
http://slidepdf.com/reader/full/geophysical-investigation-epa 49/164
SITE INFORMATIONCiba-Geigy H&H
43
Regulatory Context: This is a RCRA site where the MEDEP is providing oversight on all aspects
of work done at the site, including work plan reviews and approval and field site visits. On March
27, 1997 the MEDEP entered into a compliance order by consent with Ciba-Geigy. This order detailed the requirements and remedial objectives of the groundwater pump and treatment system
that was installed in 1996 and has been operational since early 1997 [5].
Site Logistics/Contacts
Federal Lead Agency: None
State Oversight Agency:
Maine Department of Environmental
Protection
Project Manager:Peter Blanchard
Maine Department of Environmental
Protection
17 State House Station
Augusta, ME 04333-0017
207-287-7880
Geophysical Subcontractor:
ABB Environmental Services Inc. (Now
Harding Lawson Associates)
511 Congress Street
P.O. Box 7050
Portland, ME 04112-7050
(207) 828-3482
Ciba-Geigy (Now Ciba Specialty
Chemicals) Manager:
Tom Smith
Ciba Specialty Chemicals Company
Remediation Services
P.O. Box 71
Oak Ridge Parkway
Toms River, NJ 08754
(732) 914-2867
MEDIA AND CONTAMINANTS
Matrix Identification
Type of Matrix Sampled and Analyzed: Subsurface soil and clay
Site Geology/Stratigraphy [1]
Native subsurface soils consist of a stratified sequence of outwash sands, peat, marine clay, and
sand and gravel layers. The upper layer encountered is a sandy fill layer, which consists of both
natural and man-made fill materials that overlay natural organic materials (peat). Debris such as
bricks, cinders, and spent coal can also be found in this layer. Beneath the sandy fill layer is a silty
sand layer, which consists primarily of fine sands and silts that varies in thickness from 1 foot to
19.5 ft. The silty sand is underlain by a marine clay layer known as the Presumpscot Formation,
which was deposited during the recession of the late Wisconsinan glacier. The marine clay
primarily consists of a blue-gray silty clay with a trace of fine sand, and with various thickness of
fine gray sand lenses with a weathered brown silty clay layer typically overlying the blue-gray

8/17/2019 Geophysical Investigation EPA
http://slidepdf.com/reader/full/geophysical-investigation-epa 50/164
MEDIA AND CONTAMINANTS
Ciba-Geigy H&H
44
material. On average the clay was encountered at 10 ft below the ground surface (bgs) and ranged
in thickness from 14 to 61 ft. The layer encountered beneath the clay is the sand and gravel
stratum, which consists of a wide range of soils types and gradations, ranging from clean poorlygraded sands to well-graded till with cobbles and boulders throughout. This layer was encountered
at depths ranging from 15 ft bgs to 73.5 ft bgs. Depth of bedrock was first determined by borings
and a seismic refraction survey conducted in 1993. This investigation indicated that depth to
bedrock is believed to be at an average of 55 ft bgs [2]. The silty clay, if present in layers or as a
massive deposit, is characterized by very low hydraulic conductivities.
Groundwater was encountered in all the soil borings taken during the site investigation, at depths
ranging from the ground surface to 6 ft bgs. Direction of groundwater flow is generally southwest
across the site toward No Name Brook and into the surface drainage ditches. This holds true for
both normal conditions and after heavy precipitation events have occurred. Hydraulic conductivity
values for the various subsurface strata are as follows: silty sand layer has a mean conductivity
value of 3.7x10⁻⁴ centimeters per second (cm/sec); silty sand and marine clay interface zone has avalue of 1.1x10⁻⁴ cm/sec; the marine clay has a value of 4.2x10⁻⁸ cm/sec; and the sand and gravel
stratum has a value of 2.0x10⁻³ cm/sec.
Contaminant Characterization [1]
Primary Contaminant Groups: Primary contaminants of concern found at the H&H site include:
chlorinated solvents (1,1,1-trichloroethane, tetrachloroethene (PCE), trans-1,2-dichloroethene, and
methylene chloride), aromatic hydrocarbons (benzene, ethylbenzene, toluene and xylenes),
naphthalene, and ketones. Floating free product organic solvents exist at the former UST area.
PCE has been found as a DNAPL at the site.
Matrix Characteristics Affecting Characterization Cost or Performance [1]
Parameters affecting performance of the GPR include a shallow water table and the nature of the
soils encountered at the site. To the south side of the truck loading warehouse/office building
penetration of GPR was limited by the dense fill that lies above the massive silty clay near the
ground surface. Swampy conditions existed in the area of MW-205A and MW-205B to the west
of the GPR study area (Figure 2), which limited the use of the GPR system and the extent of the
GPR survey, due to limited access to this area. No other factors were reported to impede the
effectiveness of the GPR survey or results.
The average depth to be surveyed was between 0 and 15 ft bgs. This is the area where the clay
layer is almost always encountered, since the average depth to clay is 10 ft bgs. This was an idealdepth for the GPR survey to be effective in detecting the clay layer and whether or not it was
continuous across the study area.
A waterline, which was installed by the City of Lewiston, exists approximately 8 to 10 ft bgs on
the southeastern side of Crowley Road (Figure 2). The H&H facility’s water line connection

8/17/2019 Geophysical Investigation EPA
http://slidepdf.com/reader/full/geophysical-investigation-epa 51/164
GEOPHYSICAL INVESTIGATION PROCESS
Ciba-Geigy H&H
45
between the City of Lewiston water line and the truck loading warehouse/office building parallels
the northeastern side of the mounded leachfield and is at a depth of 11 ft bgs. These water lines
were not reported to interfere with the effectiveness or the results of the GPR survey.
Investigation Goals [1]
The goal of the geophysical investigation was to provide information on the continuity and
topographic relief of the clay layer beneath the site. This would help identify low areas in the clay
layer where DNAPL could potentially accumulate.
Geophysical Methods [1]
The GPR technique uses high-frequency radio waves to determine the presence of subsurface
objects and structures. A GPR system radiates short pulses of high-frequency electromagnetic
(EM) energy into the ground from a transmitting antenna. This EM wave meanders into theground at a velocity that is related to the electrical properties of subsurface materials (specifically,
the relative dielectric permitivity of the materials). When this wave encounters the interface of two
materials having different dielectric properties (i.e., soil and water), a portion of the energy is
reflected back to the surface, where it is detected by a receiver antenna and transmitted to a control
unit for processing and display. The major principles involved for GPR are similar to reflection
seismology, except that electromagnetic energy is used instead of acoustic energy.
For this investigation a Geophysical Survey Systems, Inc. (GSSI) Subsurface Interface Radar
(SIR) System-3 GPR system equipped with 100 and 500 MHz antennae were used. Two-way
travel times of 50 to 75 nanoseconds were used. The GPR system was towed by hand across the
study area at a speed of 0.25 miles per hour (mph).
As part of the site investigation process, a GPR survey was conducted to map the top of the clay
surface. However, before the GPR study was conducted at the H&H site, a pilot study was
conducted by ABB Environmental Services, Inc. on July 2, 1991. This study indicated that GPR
would be effective in profiling the shallow subsurface strata. This led to the more comprehensive
survey that was conducted on October 23 and 24, 1991. The survey area was between Crowley
Road and the truck loading warehouse/office building and in the immediate area along the
southeast side of the building. This covered an area from the former USTs (the source area) to the
railroad tracks (Figure 2). An 18-inch steel culvert approximately 50 ft south of the main GPR
study area was also examined as part of this investigation. This steel culvert was used for depth of
penetration calibration.
The survey consisted of two separate grid areas (Figure 2). One grid area was established in the
front yard of the H&H site as a 50 foot by 50 foot grid oriented N30 EW (magnetic). For this grid
the GPR traverses were conducted in northeasterly and southeasterly directions with 50 foot and 10
foot spacing, respectively. The second grid area was located to the rear of the facility and had
GPR traverses spaced 20 ft apart with perpendicular orientation to the southeast wall of the truck

8/17/2019 Geophysical Investigation EPA
http://slidepdf.com/reader/full/geophysical-investigation-epa 52/164
GEOPHYSICAL INVESTIGATION PROCESS
Ciba-Geigy H&H
46
loading warehouse/office building. For the 18-inch steel culvert, two short traverses were oriented
perpendicular to the culvert.
Technology Justification
The objective of the geophysical investigation was to determine the topographic relief of the clay
layer and whether it was continuous across the site. GPR was considered to be an ideal method for
being effective in detecting the clay since the average depth to be surveyed was between 0 and 15 ft
bgs.
GEOPHYSICAL FINDINGS
Technology Calibration [1]
Boring log information and an onsite steel culvert were used for depth of penetration calibration.
Investigation Results [1]
Close examination of the 85 GPR profiles revealed a minimum of four reflectors that could be
identified on most of the traverse profiles that were generated. These four reflectors were
interpreted to represent the top of the silty clay layer surfaces within the transitional zone of the
upper portion of the Presumpscot Formation.
The uppermost reflector was found at about 6 ft bgs at the location of MW-106. This was
identified on most of the data profiles performed at the site. This uppermost reflector is interpreted
to be a silty clay layer within the upper part of the Presumpscot Formation. The surface of thisuppermost silty clay reflector generally slopes westward below the survey area at a rate of 5.5 ft
per 100 ft. A local topographic low near the western corner of the leachfield exists at
approximately 19 ft bgs. This topographic low exists approximately 10 ft below the elevation of
the clay surface at the eastern edge of the survey area. Interpretation of data suggested that the
topographic low could be part of a trough that trends in a southerly direction. Unfortunately the
survey did not extend far enough westward to define the shape of the clay surface in the vicinity of
monitoring wells MW-205A, and MW-205B. This was due to the swampy conditions in this area
that would not allow access with the GPR equipment.
The depths to the top of the uppermost reflector were tabulated in nanoseconds of two-way travel
time. Travel times were then converted to depth using a conversion factor of 5.75 nanoseconds per
foot of depth. Depth in feet was then converted to elevation and an interpretive map of elevationcontours of the uppermost reflector was created (Figure 3).
Examination of the data collected from the two traverses above the steel culvert indicated that the
culvert is not surrounded by transmissive sands and gravels that would act as pathway for
groundwater migration. It is thought that the culvert is most likely surrounded by compacted fill.

8/17/2019 Geophysical Investigation EPA
http://slidepdf.com/reader/full/geophysical-investigation-epa 53/164
GEOPHYSICAL FINDINGS Ciba-Geigy H&H
47
The general conclusion after examining the GPR results was that there was an observed parallel
relationship of the various layers of sand, silt, or clay that are present within the shallow
subsurface soils of the Presumpscot Formation. This suggested that the topography of the
interpreted layer mimics the topography of the top surface of the massive silty clay found at
approximately 19 to 22 ft bgs in the area of the GPR survey. Based on this survey and
subsurface explorations, the marine clay formation appears to be continuous across the study area.
If present, DNAPL could move downslope along the top surface of the silty clay layers and
accumulate in the topographical low areas, such as the low area identified near the southwest
corner of the leachfield.
Results Validation
Confidence in the level of accuracy of the GPR data was verified through later investigations and
comparisons to soil boring data. A digital model created from the soil boring data would producethe same shape when compared with the GPR data [6]. This confirms the results of the GPR
survey that the clay formation appears to be continuous across the study area.
An extraction well (EW-401) was installed in November, 1994 at a location previously determined
from the GPR survey to be a topographic low point on the upper surface of the clay formation [4].
PCE was found as a DNAPL along with other VOCs at this well; this confirmed that the location
identified by the GPR survey was a topographic low point where DNAPL might accumulate.

8/17/2019 Geophysical Investigation EPA
http://slidepdf.com/reader/full/geophysical-investigation-epa 54/164
GEOPHYSICAL FINDINGS Ciba-Geigy H&H
F i g u r e 3 : I n t e r p r e t e d E l e v a t i o n C o n t o u r s o f t h e T o p o f P r e s u m p s c o t F o r m a t i o n ( S i l t y C l a y
R e f l e c t o r R 4 ) [ 1 ]

8/17/2019 Geophysical Investigation EPA
http://slidepdf.com/reader/full/geophysical-investigation-epa 55/164
Ciba-Geigy H&H
49
LESSONS LEARNED
Some of the lessons learned during this investigation include:
• Overall, the GPR survey was an effective tool for identifying continuous reflectors thatrepresented silty clay layers in the shallow subsurface soils beneath the site [6]. The
confidence level of the decisionmakers in the results was high. Confidence in the level of
accuracy of the GPR data was verified through later investigations and comparisons to soil
boring data.
• Penetration of the GPR survey was limited on the southeast side of the truck loading
warehouse/office building, since it did not identify subsurface reflectors. This is
interpreted as a result of the presence of dense fill that lies above the massive silty clay
near the ground surface [1].
• As a result of the GPR survey, the surface of the clay layer underneath the site was
mapped, and the topographic low point of the upper surface was determined. This low point was chosen as a location to install an extraction well, since this would be a potential
area where DNAPL might pool. DNAPL was encountered during the installation of the
extraction well, as suspected [4].

8/17/2019 Geophysical Investigation EPA
http://slidepdf.com/reader/full/geophysical-investigation-epa 56/164
Ciba-Geigy H&H
50
REFERENCES
• ABB Environmental Services, Inc. Site Investigation Report. Prepared for Ciba-Geigy
Corporation, Hamblet & Hayes Site, Lewiston, Maine. February 1992.
• ABB Environmental Services, Inc. Site Investigation Report Addendum. Prepared for
Ciba-Geigy Corporation, Hamblet & Hayes Site, Lewiston, Maine. March 1993.
• ABB Environmental Services, Inc. Work Plan: Well Installation and Decommissioning.
Prepared for Ciba-Geigy Corporation, Hamblet & Hayes Site, Lewiston, Maine. August
1994.
• ABB Environmental Services, Inc. Work Plan: Well MW-408A Investigation and Dense
Non-Aqueous Phase Liquid Assessment. Prepared for Ciba-Geigy Corporation, Hamblet
& Hayes Site, Lewiston, Maine. February 1995.
• Personnel Communication with Mr. Peter J. Blanchard of the Maine Department of
Environmental Protection. September 3, 1998.
• Personnel Communication with Mr. Tom Smith of Ciba-Geigy. September 3, 1998.
• Personnel Communication with Mr. Stephen Walbridge of Harding Lawson Associates.
September 18, 1998.

8/17/2019 Geophysical Investigation EPA
http://slidepdf.com/reader/full/geophysical-investigation-epa 57/164
Crystal Refinery
51
Case Study Abstract
Crystal Refinery
Carson City, MI
Site Name and Location:
Crystal Refinery
Carson City, MI
Geophysical Technologies:
Ground Penetrating Radar (GPR)
Electrical resistivity
CERCLIS #
Not Applicable
Period of Site Operation:
1935 to early 1990s
Operable Unit:
Not Applicable
Current Site Activities:
Groundwater pump and treatment system
via French drains/capture trenches
Point of Contact:
David Monet, Geologist
Environmental Response Division
MI DEQ245 Colrain, SW
Wyoming, MI 49548-1013
(616) 246-1739
Geological Setting:
Alluvial sand and loam soils overlay a
shallow, fine to coarse sand aquifer
separated from deeper aquifers by aclay aquitard. Bedrock occurs at 350
ft bgs and is composed of sandstone,
shale, limestone, siltstone, and clay.
Technology Demonstrator:
William A. Sauck, PhD
Department of Geosciences
Western Michigan UniversityKalamazoo, MI 49008
(616) 387-4991
Purpose of Investigation:
Investigation of the hypothesis that electrical properties of the zone impacted by a hydrocarbon plume in a natural
environment change over time from electrically resistive to electrically conductive due to biodegradation, and that this shift
in conductivity can be measured using geophysical methods.
Number of Images/Profiles Generated During Investigation:
1 GPR profile, 1 dipole-dipole resistivity profile, 1 vertical resistivity probe profile and associated soil boring
Results:
The investigation confirmed the hypothesis that an older light non-aqueous phase liquid hydrocarbon plume in the natural
environment will shift the bulk resistivity of the impacted zone from high resistivity to low resistivity over time.
Project Cost:
Estimated total cost for the investigation of this type was approximately $5,795.

8/17/2019 Geophysical Investigation EPA
http://slidepdf.com/reader/full/geophysical-investigation-epa 58/164

8/17/2019 Geophysical Investigation EPA
http://slidepdf.com/reader/full/geophysical-investigation-epa 59/164
Crystal Refinery
53
SITE INFORMATION
Identifying Information
Crystal RefineryCarson City, MI 48811
Background [2]
Physical Description: Crystal Refinery is located on North Williams Street in northwest Carson
City in central Michigan. Carson City is a small rural town and the site is located in a residential
and commercial area. The Carson City Park is located on the southern border of the site, and Fish
Creek forms the western border. To the north and northwest there is a pine forest, and to the east
and southeast, there are agricultural lands, residences, and commercial businesses (Figure 1). The
center of Carson City is located approximately 3,000 feet to the southeast of the site. The site is
approximately 32.5 acres and consists of two separate parcels. The larger southern parcel contains
the petroleum refinery, storage tanks, lagoons, loading docks, and several buildings. The northern
parcel contains storage tanks, a valve station, and a disposal area. Both parcels are partially
fenced and gated. Site topography is characterized by rolling hills and uniformly western sloping
plains. Between the two parcels is a cemetery. South of the southern parcel is a city park.
Site Use: Crystal Refinery began processing crude oil in 1935 and operated until the early 1990s.
The site received crude oil from both an underground pipeline and railroad cars. The average
production of the refinery was approximately 84,000 gallons of oil per day. Total tank storage
capacity, including above-ground storage tanks (ASTs) and underground storage tanks (USTs),
was an estimated 10,000,000 gallons. Between 1957 and 1962, two additional ASTs were
constructed on the northern parcel, adding 2,000,000 gallons to the total tank storage capacity.
Eight cooling lagoons on the southern parcel received waste sludges from site operations. These
sludges, copper chloride, Fuller’s Earth, and styrene materials were transferred to and disposed of
on the northern parcel until the mid-1970s. In 1970, four french drains were installed. Recovered
oil and water from these drains was pumped to an oil/water separator. Remaining liquids were
then pumped to a second separator and discharged into one of the lagoons. The site is currently
inactive.
Release/Investigation History: Shortly after site operations began, an oil seep was discovered in
the north recovery area. The Michigan Department of Natural Resources (MDNR) investigated
this seep in 1945, however there is no information regarding the results of this investigation. In
1968, MDNR performed an evaluation of Crystal Refinery to determine the extent of oil
contamination in groundwater. Twenty-two wells were installed, both on- and off-site, to establish
the lateral extent of contamination and groundwater flow direction. A heavy oil slick was noted on
the backwaters of Fish Creek at this time.

8/17/2019 Geophysical Investigation EPA
http://slidepdf.com/reader/full/geophysical-investigation-epa 60/164
SITE INFORMATIONCrystal Refinery
54
Figure 1: Crystal Refinery Site Map [2]

8/17/2019 Geophysical Investigation EPA
http://slidepdf.com/reader/full/geophysical-investigation-epa 61/164
SITE INFORMATIONCrystal Refinery
55
A large release of crude oil occurred in January, 1973 when a fractured check valve on a receiving
line burst. Eighty-eight thousand gallons of crude oil flowed over frozen ground toward Fish
Creek. Although some was intercepted on site, oil did enter Fish Creek. The ensuing cleanup was
performed by Crystal Refinery.
In 1982, Crystal Refinery conducted a hydrogeological investigation required by MDNR. More
wells were installed to evaluate both the lateral and vertical extent of contamination. This
investigation estimated that as much as 4,000,000 gallons of oil in might be present in the
groundwater, 117,000 cubic yards of soil might be seriously impacted by oil contamination, and
86,000 cubic yards of soil may have been marginally impacted. In 1983, Crystal Refinery installed
purge wells in an attempt to address the groundwater contamination. Water pumped from the wells
was skimmed, sent to a separator, and then to one of the lagoons.
A 1989 EPA visit to the site documented degradation of containment measures, such as erosion
around the lagoons and degradation of insulation in storage tanks. EPA instructed CrystalRefinery to address these conditions, and in 1992, MDNR required the development of a remedial
action plan (RAP) addressing both groundwater and soil contamination. A RAP was completed in
1992 addressing only groundwater issues. MDNR accepted the RAP as an interim response, but
stated it was inadequate until soil concerns were addressed. Since 1993, Crystal Refinery has
continued to address groundwater, but has not performed any remedial measures addressing soil
contamination. The EPA razed (removed) all above-ground facilities in Fall, 1998.
Regulatory Context: MDNR has been the lead agency in overseeing and approving the Crystal
Refinery activities and decisions. However, in April 1997, MDEQ (formerly MDNR) referred the
site to the US EPA Region 5 Emergency Response Branch.
Site Logistics/Contacts
Federal Lead Agency:
US EPA Region 5 Emergency Response
Branch
Project Manager:
David Monet, Geologist
Environmental Response Division
MI DEQ
245 Colrain, SW
Wyoming, MI 49548-1013(616) 246-1739
State Lead Agency:
Michigan Department of Environmental
Quality
Geophysical Subcontractor:
William A. Sauck, PhD
Department of Geosciences
Western Michigan University
Kalamazoo, MI 49008
(616) [email protected]

8/17/2019 Geophysical Investigation EPA
http://slidepdf.com/reader/full/geophysical-investigation-epa 62/164
Crystal Refinery
56
MEDIA AND CONTAMINANTS
Matrix Identification
Type of Matrix Sampled and Analyzed: Subsurface soils and groundwater
Site Geology/Stratigraphy
The geology at this site was created by two types of moraines created during the Wisconsin Glacial
Period; a ground moraine and two end morainic ridges. The soil in the ridges is composed of clay,
while soils deposited by glacial outwash in the ground moraine are sands and loams. The alluvial
soils overlay a shallow aquifer composed of fine to coarse sand. The shallow aquifer is separated
from deeper aquifers by a clay aquitard. The thickness of the shallow aquifer ranges from 15 feet
in the western portion of the site to 30 feet in the eastern portion. Bedrock occurs at 350 feet
below ground surface and is formed by the Jurassic and Saginaw Formations. The bedrock is
composed of primarily sandstone, shale, limestone, clay, and siltstone.
Contaminant Characterization
Primary Contaminant Groups: The contaminants of concern are residual oil and hydrocarbons
both as dissolved phase and free product. Hydrocarbons are present as light, non-aqueous phase
liquids (LNAPLs). Both crude oil (north) and refined products (south).
Matrix Characteristics Affecting Characterization Cost or Performance [2]
Some fading of the ground penetrating radar (GPR) reflections occurred and may have been related
to enhanced soil conductivities which limit the effective depth of penetration of the radio waves.
Some of the problems affecting the performance of the electrical resistivity data interpretationswere related to equivalence and suppression. Lower resistivities at the fringes of survey lines may
have been the result of a shallower water table to the west, and, to the east, lower resistivities may
have been caused by the presence of road salt. Other factors such as the surface conditions, and
subsurface distribution of conductive zones may also play an important role in controlling the
electrical signature of surface geophysical measurements at hydrocarbon impacted sites.

8/17/2019 Geophysical Investigation EPA
http://slidepdf.com/reader/full/geophysical-investigation-epa 63/164
Crystal Refinery
57
GEOPHYSICAL INVESTIGATION PROCESS
Investigation Goals
The geophysical investigation was undertaken in November 1997 as part of academic research for Western Michigan University’s Department of Geology. The purpose of the investigation was to
test the proposition that the electrical properties of the soil moisture intermingled with a
hydrocarbon plume change over time from electrically resistive to electrically conductive. The
conventional model, based on controlled spill and lab experiments, is that groundwater and soils
contaminated with hydrocarbons exhibit lower electrical conductivity and lower relative
permittivity than the surrounding uncontaminated media. The hypothesis tested in this study is that
hydrocarbon spills in the natural environment will change the bulk properties of the impacted zone
from electrically resistive to electrically conductive over time due to biodegradation of the
hydrocarbons. Conductivity is enhanced by the leaching of inorganics from the soil and aquifer
materials by organic acids produced by microbial activity during degradation of the hydrocarbons
[1].
Geophysical Methods [2]
For this geophysical investigation two methods were used. The first was GPR, which uses high-
frequency radio waves to determine the presence of subsurface objects and structures. A GPR
system radiates short pulses of high-frequency electromagnetic (EM) energy into the ground from a
transmitting antenna. This EM wave propagates into the ground at a velocity that is related to the
electrical properties of subsurface materials (specifically, the relative dielectric permittivity of the
materials). When this wave encounters the interface of two materials having different dielectric
properties (i.e., soil and water), a portion of the energy is reflected back to the surface, where it is
detected by a receiver antenna and transmitted to a control unit for processing and display. The
major principles involved for GPR are similar to reflection seismology, except that EM energy isused instead of acoustic energy and the propagation times are much shorter.
The GPR survey was conducted using the Geophysical Survey Systems Inc. (GSSI) Subsurface
Interface Radar-10A+ (SIR-10A+) with 300 MHZ bistatic antennae. The modulation frequency
was set at 300 MHZ with a recording time of 160 nanoseconds (ns). The survey used a constant
gain setting and a 3-scan moving average horizontal filter. The GPR system was towed for 230
meters along two lines 20 meters apart at 15 and 35 meters south of the refinery boundary (Figure
1).
The second geophysical method used was electrical resistivity. During resistivity surveys, current
is injected into the earth through a pair of current electrodes, and the potential difference is
measured between a pair of potential electrodes. The current and potential electrodes are generally
arranged in a linear array. Common arrays include the dipole-dipole array, pole-pole array,Schlumberger array, and the Wenner array. The apparent resistivity is the bulk average resistivity
of all pore fluids, soils and rock influencing the flow of current. Resistivity is the inverse of
conductivity. It is calculated by dividing the measured potential difference by the input current,
and multiplying by a geometric factor (specific to the array being used and electrode spacing).

8/17/2019 Geophysical Investigation EPA
http://slidepdf.com/reader/full/geophysical-investigation-epa 64/164
GEOPHYSICAL INVESTIGATION PROCESSCrystal Refinery
58
Models of the variation of resistivity with depth can be obtained using model curves or forward and
inverse modeling computer programs.
Electrical resistivity was measured with the Iris Syscal R2 Deep Resistivity-IP System using the
axial dipole-dipole array configuration with dipole separations between 1 and 5 and the Wenner
array configuration with a 2-inch electrode spacing for vertical resistivity measurements in the
vertical probes. Both the dipole-dipole and vertical profiling (not along a line, but a single point)
were conducted along a line 20 meters south of the refinery. The Iris Syscal R2 Deep Resistivity-
IP System is menu-driven and has internal storage memory and weighs approximately 6 kilograms.
GEOPHYSICAL FINDINGS
Technology Calibration
No calibration was reported as being necessary for this investigation. However, for the resistivitysystem calibration is usually done digitally by the microprocessor based on correction values stored
in memory. The correction values are found in final production testing and are also established
during later periodical recommended yearly checks at authorized service centers. Vertical probes
have been calibrated in a water tank to determine the correction factor for the body of the probe (2"
OD PVC cylinder-perfect insulator).
Investigation Results [2, 3]
The GPR profile revealed a strong and continuous reflector occurring at 40 ns near the west end
and 70 ns further east along the profiles (Figure 2). This reflector is interpreted as the water table
and a depth of 3.5 to 5.5 m was computed. This is in agreement with known water tablemeasurements. Another, parallel, reflector is visible in the profile just above the water table from
the west to approximately 100 meters. At 100 meters, this reflector dips to the east and then
merges with the W.T. reflector at 140 meters. After 160 meters, this reflector is visible as a
separate event again and rises to 50 ns. Depths to this reflector are computed as 2.7 m in the west
down to 5.5 m at its lowest point at 140 meters east. Soil boring data indicate that this reflector is
coincident with the top of the layer containing residual product and exhibiting oil staining and a
strong gasoline odor. The appearance of this reflector on the GPR profile may be due to viscous
residual product in the vadose zone blocking sediment pore space and altering the permeability.
The dipole-dipole resistivity profile demonstrates high resistivity in the vadose zone and a
downward gradient to low resistivity (shown as lighter shades in Figure 3). The areas of low
resistivity are interpreted as the saturated zone and the clay aquitard beneath it. The fact that noanomalous features attributable to the free product plume were observed is possibly due to
problems of equivalence and suppression associated with resistivity interpretations.
The vertical resistivity probe is located in a known area of free product. The vertical resistivity
probe revealed high resistivity in the vadose zone (staying around 1000 Ohm-meters on a log

8/17/2019 Geophysical Investigation EPA
http://slidepdf.com/reader/full/geophysical-investigation-epa 65/164
GEOPHYSICAL FINDINGSCrystal Refinery
59
scale), in correlation with the dipole-dipole profile. However, at approximately 3.8 m bgs,
electrical resistivity suddenly decreases to 15 Ohm-meters. This is lower than background water
resistivities of 30 Ohm-meters. According to soil boring data, this zone of low resistivity begins
just above the water table and is coincident with the layer containing free product observed
between the upper reflector and the W.T. reflector in the GPR survey. This is interpreted to
confirm that a natural environment zone which has been saturated with hydrocarbon for a period of
time (in this case, 50 years) exhibits an increased conductivity (decreased resistivity), contrary to
the conventional model that it will display conductivities less than the uncontaminated areas.
Results Validation [2]
Geochemical data, including dissolved oxygen, pH, and specific conductance was collected from
five on-site wells (Table 1). The locations of these wells can be seen in Figure 1. The high
measurements of dissolved oxygen and low conductivity in OW-10 and OW-21 indicate minimal
impact by hydrocarbon contamination. Similar measurements in OW-43 showed low dissolvedoxygen and the highest conductivity. This well is located at the margin of the dissolved phase
plume, as is OW-44. Measurements in OW-31 revealed the lowest dissolved oxygen and a
corresponding high conductivity. The variations in measurements are attributed to varying rates of
biodegradation. Waters from below the impacted zone were 3-5 times more conductive than
background. The low dissolved oxygen rates correlate with high conductivities and indicate
microbial activity is breaking down the hydrocarbons. The use of ambient dissolved oxygen
ultimately results in (involves bacterial process, then chemical leaching process) elevated
conductivities.

8/17/2019 Geophysical Investigation EPA
http://slidepdf.com/reader/full/geophysical-investigation-epa 66/164
GEOPHYSICAL FINDINGSCrystal Refinery
60
Figure 2: Ground Penetrating Radar Profiles of Line 15 and Line 35 [2]
Figure 3: Resistivity Pseudosections [2].

8/17/2019 Geophysical Investigation EPA
http://slidepdf.com/reader/full/geophysical-investigation-epa 67/164
GEOPHYSICAL FINDINGSCrystal Refinery
61
Figure 4: Vertical resistivity probe located at 0.0 mE, 20 mS, 2" Wenner Array,
semi-log scale [2].

8/17/2019 Geophysical Investigation EPA
http://slidepdf.com/reader/full/geophysical-investigation-epa 68/164
GEOPHYSICAL FINDINGSCrystal Refinery
62
Table 1: Geochemical Data Used in Results Validation
Well ID DissolvedOxygen (mg/L)
pH SpecificConductance
(mS/m)
OW-10 7.2 6.4 32
OW-21 7.2 7.1 30
OW-31 0.3 6.37 93
OW-42 0.7 7 90
OW-43 0.6 6.76 158
OW-44 1.2 6.5 101
LESSONS LEARNED
The lessons learned during this investigation are the following:
• Biodegradation of mature LNAPL plumes can produce geochemical changes in the
materials at the capillary fringe or zone of mixing that mobilize inorganic compounds from
the subsurface materials. The change in pH and ion charge of the materials increases the
conductivity of the subsurface materials. This increase in conductivity can be detected
using electromagnetic methods, such as ground penetrating radar. This phenomenon will
be limited to “mature” plumes, and depending on the specific chemical nature of the plumeand the viability of the indigenous microbial population, may not be observed at all sites
[2].
• Ground penetrating radar was able to clearly identify the water table and the top of the
impacted zone [2].
• No anomalous regions which can be attributed to the free product plume could be observed
along the horizontal resistivity profile. This was likely due to the problems of equivalence
and suppression, which often plague resistivity interpretations [2]. However, electrical
resistivity data from fixed vertical resistivity probes showed resistivity minima which
coincide with GPR shadow zones with relation to the depth of the water table.
• Light hydrocarbon free-product and associated dissolved plumes are dynamic systems.
Therefore the application of geophysical techniques to investigations such as this should be
conducted in conjunction with geochemical investigations [2]. This will result in a better
understanding of site conditions.

8/17/2019 Geophysical Investigation EPA
http://slidepdf.com/reader/full/geophysical-investigation-epa 69/164
Crystal Refinery
63
REFERENCES
• Baedecker, M.J., Cozzarelli, I.M., Eganhouse, R.P., Siegel, D.I, and Bennett, P.C. Crude
Oil in a Shallow Sand and Gravel Aquifer - III . Biogeochemical Reactions and Mass
Balance Modeling in Anoxic Groundwater; Applied Geochemistry, vol. 8, pp. 569-586.1993.
• Atekwana, E., W.A. Sauck, and D.D. Werkema, Jr. Characterization of a
Complex Refinery Groundwater Contamination Plume Using Multiple Geoelectric
Methods. Proceedings of the Symposium on the Application of Geophysics to Engineering
and Environmental Problems (SAGEEP 1998), pp. 427-436.
• Sauck, William A. A Conceptual Model for the Geoelectrical Response of LNAPL
Plumes in Granular Sediments. Proceedings of the Symposium on the Application of
Geophysics to Engineering and Environmental Problems (SAGEEP 1998) pp. 805-817.
• Personal communication with Phil Sirles of Microgeophysics. Wheat Ridge, CO.
December 10, 1998.

8/17/2019 Geophysical Investigation EPA
http://slidepdf.com/reader/full/geophysical-investigation-epa 70/164
64
THIS PAGE LEFT BLANK INTENTIONALLY

8/17/2019 Geophysical Investigation EPA
http://slidepdf.com/reader/full/geophysical-investigation-epa 71/164
Kansas Underground Storage Tank (UST) Site
65
Case Study Abstract
Kansas Underground Storage Tank (UST) Site
Salina, KS
Site Name and Location:
Kansas UST Site
Salina, KS
Geophysical Technologies:
Electrical conductivityCERCLIS #
Not applicable
Period of Site Operation:
Unknown
Operable Unit:
Not applicable
Current Site Activities:
Long-term Monitoring
Point of Contact:
Wesley McCall, 913-825-1842Geological Setting:
Low conductivity clays overlying
sandy water-bearing units
Technology Demonstrator:
Geoprobe Systems
Salina, KS
Purpose of Investigation:
Characterize the subsurface stratigraphy and identify structures that could influence groundwater flow patterns
Number of Images/Profiles Generated During Investigation: 10 conductivity logs to depths ranging from 50 to 60 feet
below ground surface
Results: The survey identified a continuous confining clay layer overlying and upper and lower aquifer. A contour of the
contact surface between the upper aquifer and the confining clay layer was generated and a topographic high was identified
that might create a migration pathway for LNAPLs to the northwest, a direction that is opposite from the generalized
groundwater flow to the east.

8/17/2019 Geophysical Investigation EPA
http://slidepdf.com/reader/full/geophysical-investigation-epa 72/164
Kansas Underground Storage Tank (UST) Site
66
EXECUTIVE SUMMARY
The Kansas Underground Storage Tank (KS UST) site is located within the city limits of Salinas, KS
adjacent to an exit off Interstate 70. The site is situated in a light commercial area, with service stations,
motels and restaurants on the adjacent lots. The study area was 160,000 square feet in size and is situated behind a former service station where the KS Department of Environment and Health suspected than an
unidentified source of groundwater contamination existed.
Groundwater contamination was discovered at the site during a Phase II investigation, conducted in support
of a real estate transaction on a nearby property. Groundwater monitoring in the area established a plume
of petroleum hydrocarbons moving toward the east. However, contamination was detected in several wells
to the north of the suspected source area, as well. The geophysical investigation was conducted in 1995 as
a cost-effective method for characterizing the subsurface stratigraphy.
The site geology consists of a surficial layer of low hydraulic conductivity clays and sands to a depth of
approximately 46 feet below ground surface (bgs). Below the clay and sand layer, subsurface materials
grade into alluvial sands and gravels. Below the alluvial sands lies another clay layer that separates theupper sand layer from another, deeper, sand layer. The Wellington formation forms the bedrock at the site
and consists of gray and green shales. Groundwater is encountered at approximately 20 to 40 feet bgs.
The geophysical investigation was carried out using the Geoprobeâ Direct Imageâ Soil Conductivity System.
This direct push technology does not require a pre-existing borehole to perform the logging process as the
conductivity probe is driven directly into virgin unconsolidated formations. Additionally, no drill cuttings
are generated during the logging process, which significantly reduces waste generation and potential
exposure hazards. Electrical conductivity logs were calibrated by comparing them with lithologic logs
from continuous core samples taken in two locations. Conductivity logs were taken from 10 borings across
the study area to depths of 40 to 60 feet below ground surface. The logs indicated the consistent presence
of the surficial clay layer to a depth of approximately eight to 10 feet bgs. Furthermore, a comparison of the logs indicated that the surficial clay layer had a saddle-like structure with a ridge trending northward.
The investigation concluded that the surficial clay layer acted as a confining layer, and that petroleum
contamination floating on the water table was being forced northward beneath this ridge by artesian
pressure.
The Soil Conductivity System was found to be a cost-effective approach for characterizing the subsurface
stratigraphy. Conductivity logging can provide consistent information on stratigraphy and when accurate
surface elevations are obtained from each boring, a contour map can be developed for any of the lithologic
units that are identified in the survey. This information can be used to identify subsurface structures that
might provide migration pathways for non-aqueous phase liquids, either light or dense.

8/17/2019 Geophysical Investigation EPA
http://slidepdf.com/reader/full/geophysical-investigation-epa 73/164
Kansas Underground Storage Tank (UST) Site
67
SITE INFORMATION
Identifying Information
Kansas Underground Storage Tank (UST) SiteSalina, Kansas
Investigation Date: August 1995
Background [1, 2]
Physical Description: The Kansas Underground Storage Tank (KS UST) site is located in a
commercial area within the city limits of Salinas, Kansas. Located on a small parcel of land
adjacent to the I-70 exit ramp, the site is surrounded by service stations, motels, and a fast food
restaurant (see Figure 1). The 160,000 square foot study area for the geophysical investigation
was located to the north of Diamond Drive where the Kansas Department of Health and
Environment (KDHE) suspected that an unidentified source of groundwater contamination was
located. The study area lies in flat terrain with little topographical relief. The Saline River lies tothe north at a distance of one mile.
Site Use: The site is the location of a former Amoco service station where past spills of petroleum
products had contaminated the soils and the groundwater. There are other potential sources,
however, located to the north of the site, such as a former truck stop and several ditches that may
have been used to dispose of petroleum products. A motel is presently located on the site.
Release/Investigation History: Groundwater contamination was discovered during a Phase II
investigation conducted to support the real estate transaction that led to the construction of a motel
on the site of the former service station. The geophysical investigation was conducted in 1995.
Regulatory Context: The KS UST site is managed under the Kansas Underground Storage Tank
Fund, and all compliance requirements are set by that program.

8/17/2019 Geophysical Investigation EPA
http://slidepdf.com/reader/full/geophysical-investigation-epa 74/164
SITE INFORMATIONKansas Underground Storage Tank (UST) Site
68
Figure 1: KS UST Study Area with Potentiometric Surface [1]
Site Logistics/Contacts
State Lead Agency: Kansas Department of Health and Environment (KDHE)
Federal Oversight Agency: None
KDEH Project Manager:
Scott Lang
Kansas Department of Health and
Environment
2501 Market Place, Suite D
Salina, KS 67401-7699
785-827-9639
Geophysical Subcontractor:
Wesley McCall
Geoprobe Systems, Inc.
601 N. Broadway
Salina, Kansas 67401
913-825-1842

8/17/2019 Geophysical Investigation EPA
http://slidepdf.com/reader/full/geophysical-investigation-epa 75/164
Kansas Underground Storage Tank (UST) Site
69
MEDIA AND CONTAMINANTS
Matrix Identification [1]
Type of Matrix Sampled and Analyzed: Subsurface clays, sands, and gravels
Site Geology/Stratigraphy [1, 2]
Surface and near-surface soils in the study area consist primarily of low hydraulic conductivity
clays and sands to a depth of 46 feet below ground surface (bgs). Below this level the clays grade
into alluvial sands and gravels overlying another clay layer. This clay layer is continuous
throughout the study area and separates the upper sand layer from another sand layer. Bedrock is
present beneath the lowest sand layer as the Wellington Formation, consisting of grey and green
shales.
The formation from a depth of about 20 to 40 feet bgs grades from clayey-silts to fine sandy silts
to medium-grained sands with depth. There is evidence that this upper aquifer exists under
confined conditions. When wells are screened at depths of 22 to 24 feet bgs, they do not yield
water, yet when screened at, or below, 28 feet bgs the static groundwater level rises to 18 feet bgs.
Generalized groundwater flow is to the east and toward the Saline River at an average rate of less
than one-half foot per day. A second aquifer exists in the deepest sandy layer overlying the
Wellington Formation and is separated from the upper aquifer by a clay-silt layer over five feet
thick.
Contaminant Characterization [2]
Primary Contaminant Groups: The principal contaminants of concern include benzene, toluene,
ethylbenzene, and xylenes (BTEX). Free product contamination found in some wells indicated thatthe contaminants were present as light, non-aqueous phase liquids (LNAPLs).
Matrix Characteristics Affecting Characterization Cost or Performance [1,3]
The ground surface in the study area included grass- and gravel-covered areas which posed no
problems for the probe. In two areas, however, the surface was concrete and holes were bored
through the concrete before beginning the push in these areas.
Consistency in site lithology facilitated the conductivity survey. The site has several geologically
distinct layers whose conductivity values are markedly different. Furthermore, the layers are
relatively continuous throughout the study area.
Excessive soil moisture that might have interfered with conductivity readings was not a problem at
any location in the study area.

8/17/2019 Geophysical Investigation EPA
http://slidepdf.com/reader/full/geophysical-investigation-epa 76/164
Kansas Underground Storage Tank (UST) Site
70
Figure 2: SC200 Electrical
Conductivity Probe
GEOPHYSICAL INVESTIGATION PROCESS
Investigation Goals [3, 4]
The goal of the investigation was to identify any subsurface structures that might influencegroundwater flow directions. The initial investigation found BTEX contamination on the southern
side of Diamond Drive, and generalized groundwater flow to the east. When contamination was
found in monitoring wells to the northwest of the suspected source area, the question was raised:
were there other undiscovered source areas to the northwest,
or were there groundwater flow dynamics that could result in
the northerly migration of contaminants?
Geophysical Methods [1, 3, 5]
The geophysical survey was carried out using the Geoprobe®
Direct Image® Soil Conductivity System, operated in a
Wenner array configuration. In this configuration, an
electrical current is passed through the soil and the soil
conductivity is measured by four electrical contacts. The
conductivity value is a function of grain size, with finer grains
producing higher values and coarser grains resulting in lower
values. The units of measurement for conductivity are
milliSeimens per meter (mS/m). The Seimen is the inverse of
the Ohm, the standard measure for electrical resistivity.
The Direct Image® system consists of a steel probe running
through four stainless steel rings, as is shown in Figure 2.
The SC200 probe is eight inches long and varies in diameter from one inch at the tip to 1.125 inches at the base. An
electrical grade plastic insulates the rings from the steel shaft.
A shielded data transmission cable is attached to the probe by
a waterproof seal.
The probe is advanced using a percussion probing machine
which weighs 1,680 pounds and is mounted on the back of a
truck. The percussion machine delivers as much as 18,000
pounds of downward force to the drive end of the probe. The
depth and rate of advancement are measured using a string
pot system. When the probe is retracted, the percussion
machine can exert as much as 25,000 pounds of retraction
force.

8/17/2019 Geophysical Investigation EPA
http://slidepdf.com/reader/full/geophysical-investigation-epa 77/164
GEOPHYSICAL INVESTIGATION PROCESSKansas Underground Storage Tank (UST) Site
71
The Direct Image® software, running on a PC laptop connected to the instrumentation box,
provides a “real-time” display of the conductivity signal, probe depth, and rate of advancement.
Individual logs can be printed in the field. Data from the logs can be easily output to a spreadsheet
software, or a modeling software, such as SURFER. The Direct Image® software also includes a
calibration routine for the probe that should be run before each push to ensure that the probe is
operating correctly.
Technology Justification
The presence of the surficial clay layer overlying the surficial aquifer indicated the need for a
geophysical technology that would not be impeded by this layer. It was necessary to penetrate this
near surface clay layer and delineate the stratigraphy below the clay. The effectiveness of ground
penetrating radar would have been limited by this layer and it was too close to the surface for a
seismic method to be effective. Therefore, Geoprobe’s® Direct Image® Soil Conductivity System
was a more effective and less expensive option to identify any subsurface structures that mightinfluence groundwater flow directions.
GEOPHYSICAL FINDINGS
Technology Calibration [1]
A lithology log was developed from a continuous core sample taken to a depth of 40 feet below
ground surface (bgs) at the northwest corner of the study area. Discrete interval samples were
collected in a boring located at the northeast corner of the study area at depths of 46 to 48 feet bgs
and 54 to 56 feet bgs. The deeper samples provided information on the distinct lithologic units
found at those depths. Conductivity logs were taken in the same two locations. The conductivityvalues were correlated with the visual identification of discrete lithologic units in the core samples.
The results of the correlation are shown in Table 1.
There is a unique range of conductivity values for each of the lithologic units with the exception of
the units encountered between two and 32 feet bgs. In this interval, there is a silty clay layer that is
somewhat coarser than the clay layers above and below it. The electrical conductivity of the silty-
sandy clay layer, 70 to 140 mS/m, overlaps that of the over- and underlying clay layers which
ranges from 125 to 240 mS/m. Thus, conductivity measures falling between 125 and 140 mS/m
are indicative of transition intervals between the low permeability clay layers and the more
permeable silty-sandy clay layer.
Below the second clay layer is a sandy layer, known as the upper aquifer whose upper surface wasencountered at depths ranging from 36 to 46 feet bgs. The upper aquifer ranges in thickness from
5 to 15 feet. Conductivity values within the upper aquifer ranged from 20 to 40 mS/m. At the
base of the upper aquifer is a clay layer that acts as an aquitard between the upper and lower
aquifers. The aquitard was found at depths ranging from 46 to 52 feet bgs, and was found to be

8/17/2019 Geophysical Investigation EPA
http://slidepdf.com/reader/full/geophysical-investigation-epa 78/164
GEOPHYSICAL FINDINGSKansas Underground Storage Tank (UST) Site
72
approximately 5 to 8 feet thick. Conductivity values in the aquitard range from 80 to 100 mS/m,
making these materials similar in composition to those encountered between 13 and 32 feet bgs.
Table 1: Correlation of Conductivity Values With Discrete Lithologic Units
Conductivity
Range
(mS/m)
Depth Range
(feet bgs)
Location of
SamplesGeneralized Lithologic Description
0 to 75 0 to 2 CND02 Organic rich topsoil and gravel fill
125 to >240 2 to 13 CND02 Clays, brown with some caliche development
70 to 140 13 to 32 CND02 Silty to fine sandy brown clays
125 to > 240 CND02 Clays, brown with some caliche development
20 to 40 36 to 46 CND02 Medium to coarse grained granitic sands withsparse fine gravels, water-saturated
80 to 100 46 to 52 CND10 Gray clay-silt
20 to 40 52 to 60 CND10 Medium to coarse grained granitic sands with
sparse fine gravels, water-saturated
Source: [1]
Investigation Results
Conductivity logs were collected from 10 borings across the study area to depths ranging from 40
to 60 feet bgs. The locations of the borings can be seen shown in Figure 1, and the logs themselvesare shown in Figures 3a and 3b. The uppermost clay layer is visible in each of the 10 logs as a rise
in conductivity to values at or greater then 200 mS/m. The densest portion of this clay layer, and
consequently the highest electrical conductivity value, was found consistently at a depth of
approximately eight to 10 feet bgs. The consistency with which this unit is found in the logs
suggests that it is continuous throughout the study area and has a low surface gradient.
The decline in conductivity values that can be seen in each of the 10 logs between 13 and 32 feet
bgs can be interpreted as the gradual grading of subsurface materials from the upper clay layer into
a coarser silty clay layer. At the base of this silty clay layer, the subsurface materials seem to
grade once again into a tighter clay formation. This graduation can be seen in most of the logs as
conductivity values rise again due to the finer grain size within the clay layer. In the logs CND01
and CND06, the clay layer is either missing, or its composition is less dense than in other portionsof the study area. In the logs for CND08 and CND09, the clay layer appears to be present at
shallower depths of approximately 20 to 25 feet bgs. The consistency with which this clay layer
seems to be present suggests that it may act as a confining layer to the upper aquifer. This
conclusion seems to be supported by the fact that when wells are screened at a depth of 22 to 24

8/17/2019 Geophysical Investigation EPA
http://slidepdf.com/reader/full/geophysical-investigation-epa 79/164
GEOPHYSICAL FINDINGSKansas Underground Storage Tank (UST) Site
73
Figure 3a: Electrical Conductivity Log for CND1 - CND05 [1]
feet bgs, they yield no water, but when screened at or below 28 feet, the static groundwater level in
the casing rises to 18 feet bgs.
The sandy gravel layer that constitutes the more transmissive zone of the upper aquifer can be seen
clearly in each of the 10 logs at depths ranging from 36 to 46 feet bgs. As the probe passed
through these materials, there was a marked decrease in conductivity values. At the base of the
upper aquifer, there is a dense layer of clay materials which can be seen in the logs as a sharp
increase in conductivity values at depths ranging from 45 to 55 feet bgs. Most logs were
terminated at this depth to prevent penetration of the aquitard in highly contaminated zones. The
rise in conductivity values as the probe entered this layer is clearly visible, even in the shallower
logs. The consistency with which this unit was encountered in the logs suggests that is laterally
continuous and may act as an aquitard separating the upper and lower aquifers. The sandy gravel
layer that constitutes the lower aquifer can be seen in the logs for CND01, CND02, and CND10.
These borings were the only three pushed to the full 60-foot depth because they were outside of contaminated areas and approximately bound three corners of the site. Because only three borings
were advanced to this depth, the continuity of the lower aquifer cannot be determined.

8/17/2019 Geophysical Investigation EPA
http://slidepdf.com/reader/full/geophysical-investigation-epa 80/164
GEOPHYSICAL FINDINGSKansas Underground Storage Tank (UST) Site
74
Figure 3b: Electrical Conductivity Logs for CND06 - CND10 [1]
A contour map was generated of the contact surface between the sandy layer of the upper aquifer
and the overlying clay layer, and is shown in Figure 4. Surface elevations were taken at each
boring location and the distance from the surface to the top of the sandy layer was calculated.
Where the transition from the clay to the sand layer was more gradual and less defined, as in the
logs for CND02 and CND05, the depth at which the conductivity value reached 75 mS/m was
taken as the top of the sandy layer. The calculated depths to the top of the sandy layer were plotted
on a site map and the elevations were contoured by hand. In Figure 4, the resulting contours show
that the upper contact surface of the sandy layer has a complex saddle-like structure, with a
topographic high running to the northwest through CND04 and CND06 and branching northeast
toward CND03. Monitoring wells 5, 10, and 11 were highly contaminated and sporadically
contained free product. Combining the information provided by this map and the finding that the
overlying clay layer is continuous throughout the study area, the investigator concluded thatLNAPLs within the groundwater flowing under confined conditions could migrate along the
topographic high in a northwesterly direction. This would make the direction of the LNAPL
migration contrary to the generalized groundwater flow to the east. The topographic low in this
surface at CND09 east of the source also prevented contaminants from moving east with
groundwater flow to well MW08, in which no contamination had been detected.

8/17/2019 Geophysical Investigation EPA
http://slidepdf.com/reader/full/geophysical-investigation-epa 81/164
GEOPHYSICAL FINDINGSKansas Underground Storage Tank (UST) Site
75
Figure 4: Contour Map of Upper Sand Layer [1]
Results Validation [4]
No further efforts were undertaken to validate the findings of the geophysical investigation.
LESSONS LEARNED
Some of the lessons learned during this investigation include:
C Electrical conductivity logging is a cost-effective approach for characterizing subsurface
stratigraphy in unconsolidated materials. Alternative approaches to gathering the same
information would use traditional well drilling methods, such as a hollow stem auger. The
daily cost of an auger can be as high as $5,000.
C Conductivity logging can provide consistent information on stratigraphy. A review of the
10 logs produced at this site shows that the same lithologic units were identified at
consistent depths across the study area. In part, the consistency was due to the similarity of
the materials in the various units across the study area.
C When accurate surface elevations are obtained for each boring, a contour map can bedeveloped for any of the lithologic units that were identified in the survey. This
information can be used to identify subsurface structure that might provide migration
pathways for non-aqueous phase liquids, either light or dense.

8/17/2019 Geophysical Investigation EPA
http://slidepdf.com/reader/full/geophysical-investigation-epa 82/164
GEOPHYSICAL FINDINGSKansas Underground Storage Tank (UST) Site
76
C Two soil boring logs typically are sufficient to produce an unambiguous correlation
between the conductivity results and the observed lithologies. In very heterogeneous
formations, additional location/depth targeted samples may be needed.

8/17/2019 Geophysical Investigation EPA
http://slidepdf.com/reader/full/geophysical-investigation-epa 83/164
Kansas Underground Storage Tank (UST) Site
77
REFERENCES
1. McCall, Wesley. Electrical Conductivity Logging to Determine Control of Hydrocarbon
Flow Paths in Alluvial Sediments. Geoprobe Systems. December 1995.
2. Geocore Services, Inc. Quarterly Monitoring Report for KDHE UST Trust Fund Site.
March 11, 1998.
3. Personal Communications with Scott Lange, KDHE. August 18, 1998.
4. Personal Communications with Wesley McCall, Geoprobe Systems. September 15, 1998.
5. Fax Communication with Geoprobe Systems. September 15, 1998.

8/17/2019 Geophysical Investigation EPA
http://slidepdf.com/reader/full/geophysical-investigation-epa 84/164
8/17/2019 Geophysical Investigation EPA
http://slidepdf.com/reader/full/geophysical-investigation-epa 85/164

8/17/2019 Geophysical Investigation EPA
http://slidepdf.com/reader/full/geophysical-investigation-epa 86/164
Kelly Air Force Base
80
EXECUTIVE SUMMARY
Kelly Air Force Base is situated in metropolitan San Antonio within the encircling route 410 freeway. The
site is located in the eastern portion of Kelly AFB, north of the Tinker Drive and Berman Road intersection.
Surrounded by offices, industrial buildings, and an adjacent Union Pacific Rail yard, the site is
approximately 90,000 square feet and consists of two former buildings (258 and 259) and an adjacent
container storage area. Surface topography can be described as flat with maximum changes in elevation of
4.17 feet northward across the site.
From the 1940s to the 1980s, Building 258 and 259 housed metal plating and mechanical degreasing
operations. Both buildings were leveled in 1981 and only their foundations remain. Solvents leaked from
the degreasers, especially in the propeller line, which ran the width of Building 258. In December 1997,
during an initial phase of well monitoring, a dense nonaqueous phase liquid (DNAPL) was discovered
beneath former Building 258. Based on this discovery, a second phase of field activity began in April
1998, which included a seismic reflection survey, soil sampling, installation of a recovery well and
monitoring wells, and the removal of approximately 1,000 gallons of DNAPL.
The Kelly AFB study area is underlain by a thin layer of fill material averaging several feet in thickness.
Fill material may be absent in some surface locations, exposing the lower strata. Beneath the fill material
are Quaternary alluvial deposits ranging in thickness from 30 to 45 feet, and consist of clay, gravel, and
sand.
A seismic reflection survey was conducted in 1998 as part of a larger site investigation. The information
presented in this report was derived from the interpretive report of the geophysical investigation. The
Vertical Reflection Profile (VRP) (seismic) method was used to determine the structural highs and lows of
the confining layer of the shallow aquifer that could provide migration pathways for dense non-aqueous
phase liquids (DNAPLs). The seismic survey included the acquisition of 16 seismic reflection lines which
radiated in a general northwest to northeast pattern across the site. An estimation of each seismic reflection
peak associated with the top of the bedrock was made and the bedrock surface was identified and mapped.
Multiple depressions were identified in cross sections produced with the seismic reflection data. The
DNAPL was located in one of the depressions.
The “near offset” method of acquisition results in a series of discrete vertical reflection data points.
However, obstacles such as buried building foundations act as reflective surfaces and can hinder reflection
interpretation associated with the bedrock. Strong acoustical vibrations, such as rail yard activity, act as
an additional seismic source and can also interfere with reflections. The bedrock surface was mapped and
larger depressions were identified. However, the survey was unable to find small or narrow channels that
could also facilitate DNAPL transport. Seismic surveying should be utilized in conjunction with other
geophysical methods in understanding the subsurface and possibly contributing to the discovery of
DNAPLs.

8/17/2019 Geophysical Investigation EPA
http://slidepdf.com/reader/full/geophysical-investigation-epa 87/164
Kelly Air Force Base
81
Figure 1: Site Location
SITE INFORMATION
Identifying Information
Kelly Air Force Base (AFB), Site MPSan Antonio, Texas 78241-5842
Building 258 SWMU
CERCLIS #: Not applicable
Investigation Date: 16 April to 19 April, 1998
Background [1, 2]
Physical Description: Kelly Air Force Base (AFB) is located in central Bexar County, Texas
(Figure 1). The base is situated in metropolitan San Antonio within the encircling Route 410
freeway. The site is located in the eastern portion of Kelly AFB, north of the Tinker Drive and
Berman Road intersection, shown in Figure 2. The site is surrounded by offices, industrial
buildings, and an adjacent Union Pacific Rail yard, to the southeast. The site is approximately90,000 square feet of the approximately 371 acres of Zone 3 and consists of two former buildings
(258 and 259) and an adjacent container storage area. Surface topography can be described as flat
with maximum changes in elevation of 4.17 feet northward across the site.
Site Use: Aircraft operations and maintenance were performed at Kelly AFB from the 1940s to the
1980s. During this period, Building 258 and 259 housed metal plating and mechanical degreasing
operations. Both buildings were leveled in 1981 and only their foundations remain. The entire
area was then converted to an asphalt parking lot. Currently Kelly AFB is host to several tenant
organizations representing Air Force, Army, and other government organizations. Kelly AFB is in
transition from an Air Force Base to an industrial park. Transfer of ownership to the city is
scheduled for completion July 13, 2001.
Release/Investigation History: Former Buildings 258 and
259 were used for aircraft maintenance and metal plating.
Solvents leaked from the degreasers, especially in the
propeller line, which ran the width of Building 258. In
December 1997, during an initial phase of well monitoring,
a dense nonaqueous phase liquid (DNAPL) was discovered
beneath former Building 258. Based on this discovery, a
second phase of field activity began in April 1998, which
included a seismic reflection survey, soil sampling,
installation of a recovery well and monitoring wells, and
the removal of approximately 1,000 gallons of DNAPL.The asphalt parking surface was removed from the
foundations of former buildings 258 and 259 for
inspection, sampling, and, cleaning. At the conclusion of
the investigation, the area was paved again.

8/17/2019 Geophysical Investigation EPA
http://slidepdf.com/reader/full/geophysical-investigation-epa 88/164
SITE INFORMATIONKelly Air Force Base
82
Figure 2: Site Map [1]
Regulatory Context: RCRA and Texas National Resource Conservation (TNRCC) regulations.
Site Logistics/Contacts
Federal Lead Agency: U.S. Air Force
Federal Oversight Agency: EPA
Remedial Project Manager:
Rhonda Hampton
Zone 3 Groundwater Project Manager
SA-ALC/EMRI
307 Tinker Drive
Kelly Air Force Base, Texas 78241
(210) 925-3100 Extension 226
Geophysical Subcontractor:
SeisPulse Development Corporation
93 Northridge Terrace #27
Medford, Oregon 97501
541-535-4641
Site Contact:
Dr. Yuequn Jin Ph.D.
Senior Hydrogeologist
SAIC
4242 Woodcock Drive
Suite 150
San Antonio, Texas 78228
(210) 731-2200
8/17/2019 Geophysical Investigation EPA
http://slidepdf.com/reader/full/geophysical-investigation-epa 89/164
Kelly Air Force Base
83
MEDIA AND CONTAMINANTS
Matrix Identification
Type of Geology Investigated: Bedrock surface
Site Geology/Stratigraphy [1]
The Kelly AFB study area is underlain by a thin layer of fill material averaging several feet in
thickness. Fill material may be absent in some surface locations, exposing the lower strata.
Beneath the fill material are Quaternary alluvial deposits ranging in thickness from 30 to 45 feet,
consisting of clay, gravel, and sand (see Figures 3 and 4). The upper sequence of the alluvial
deposits are composed of a black to brown clay ranging in thickness from 15 feet to 28 feet. The
lower sequence of the alluvial deposits are composed of a permeable clayey gravel unit ranging in
thickness from eight to 25 feet. Interbedded within the clayey gravel unit are sand and silt layers of
various thicknesses which tend to laterally grade into gravelly clay and gravel with little clay.
A shallow groundwater aquifer lies within this permeable zone of clayey gravel at approximately
20 to 25 feet below ground surface (bgs). Groundwater generally flows eastward, off base, at 0.07
to 3.2 feet/day with a hydraulic gradient of approximately 0.001. Flow is influenced by
compositional variation within the alluvium and channel-like features of interbedded gravel and
clayey gravel formed on the bedrock surface. Beneath the alluvium lies several hundred feet of
Cretaceous limestones, shales, and clays that compose the Navarro Formation, which acts as a
bedrock aquitard. The bedrock separates the near-surface soil from the Edwards Aquifer, which is
San Antonio’s sole drinking water source.
Contaminant Characterization [1]
Primary Contaminant Groups: The primary groundwater contaminants at the site are
halogenated aliphatics. Groundwater maximum contaminant levels (MCL) were exceeded for
chlorinated solvent concentrations including tetrachloroethene (PCE), trichloroethene (TCE), cis-
1,2-dichloroethene (cis-1,2-DCE), and vinyl chloride (VC). Inorganic contaminants, including
chromium, nickel, manganese, and arsenic were detected below their MCLs.
Matrix Characteristics Affecting Characterization Cost or Performance [1]
The seismic survey was affected by rail yard seismic noise originating northeast of the site. The
passing trains of the active rail yard caused earth-penetrating acoustical vibrations that acted as
reflective sources, obscuring the actual bedrock reflections. Seismic energy reflects from any
change in density, which can be the bedrock surface or a buried foundation. In addition to the rail
yard seismic noise, buried structures affected the seismic survey by acting as another reflective
boundary. The shallow depth of bedrock did not hinder the survey. The overall homogeneity of
the alluvium and lack of topographical relief facilitated the seismic survey.

8/17/2019 Geophysical Investigation EPA
http://slidepdf.com/reader/full/geophysical-investigation-epa 90/164

8/17/2019 Geophysical Investigation EPA
http://slidepdf.com/reader/full/geophysical-investigation-epa 91/164
GEOPHYSICAL INVESTIGATION PROCESSKelly Air Force Base
85
Technology Justification
The choice of seismic reflection for investigating the bedrock topography at the Kelly AFB was
based on the need for a cost-effective method for mapping depressions in the bedrock which may
represent migration pathways for contaminants. The depth to bedrock was well within the effective
range for seismic reflection, yet not so shallow that the return wave would conflict with the ground
roll wave.
GEOPHYSICAL FINDINGS
Technology Calibration [2]
A “walk-away” noise test was conducted to assure that data acquired is a reflection and not
another source of wave energy such as source signatures or ground roll. The test involves placing
a single geophone (receiver), at a one-foot distance from the source, igniting the source, andrecording one trace. The geophone is moved in one-foot increments away from the stationary
source and the test is repeated. After a typical distance of nine to 11 feet, the returning signals are
studied to determine the reflector from the noise background. Ground roll energy will move at a
constant velocity whereas reflector energy does not; this velocity difference is used to identify the
reflector data from background noise. The ground roll or direct surface wave was identified from
the reflector reflection data. The time necessary to complete a walk-away noise test using the
SeisPulse system is approximately 30 minutes. Two walk-away tests were conducted at the site.
A geologic description from fifteen borings provided the depth to bedrock data, allowing proper
identification and timing of reflection events. Two of the borings were used to complete down-hole
velocity check shot surveys. The velocity surveys were initiated by suspending a two-inchdiameter down hole geophone tool by means of a cable to the deepest accessible depth. A hammer
and plate source were used near the boring and the time required for energy to travel to the
geophone was recorded. The geophone was raised three feet and the procedure was repeated. The
result was a set of one-way travel times, from the surface to various depth, which were used to
determine the interval and average velocity of the overlying alluvium to make a general time-depth
calculation required for the upcoming seismic survey.
The ability to visually connect or “time tie” line intersections with an identifiable reflector such as
the bedrock surface throughout the survey can be an indicator of the seismic survey accuracy
within localized areas. Reflection energy is received by the geophone and recorded as a trace. Each
trace represents a station and each subsurface reflector or event should be visually identifiable on
the trace, and connected to other traces within the survey. Since the bedrock is a continuoussurface, each trace should have a event that marks its boundary and that event can be time tied to
the next trace reflection event. This connection of events makes up the seismic profile. The
bedrock surface reflectors were “time tied” at all line intersections.
8/17/2019 Geophysical Investigation EPA
http://slidepdf.com/reader/full/geophysical-investigation-epa 92/164
GEOPHYSICAL FINDINGSKelly Air Force Base
86
Investigation Results [1]
The purpose of this investigation was to map the bedrock surface and determine the locations of
structural highs and lows in which DNAPLs could collect. The seismic survey included the
acquisition of 16 seismic reflection lines which radiated in a general northwest to northeast pattern
across the site. An estimation of each seismic reflection peak associated with the top of the
bedrock was made and the bedrock surface was identified and mapped.
Figure 3 shows a geologic cross-section of the typical stratigraphy from northwest to southeast.
The bedrock surface is shown at approximately 35 feet bgs and relatively horizontal. In the
northwest section, the depression which collected DNAPL was shown. The approximate
dimension of the DNAPL pool is approximately 100 feet by 50 feet with a maximum thickness of
seven feet.
Figure 4 shows a southwest to northeast cross-section of the bedrock surface approximately 40 to45 feet bgs. The bedrock surface varies in nature and areas of highs and lows are evident. Two
depressions are shown separated by a relatively high area. The southwest depression is
approximately 20 feet long and five feet deep. The northeast depression is approximately 30 feet
long and five feet deep. DNAPLs were not discovered in either of the low areas.
Results Validation [1]
On May 30, 1998, three hollow-stem auger soil borings were taken to verify the seismic survey
data used to map the bedrock surface. Two borings reached the bedrock surface at depths which
closely matched the seismic survey reported depths. The third boring encountered a DNAPL pool
at approximately 37 feet bgs and was terminated for health and safety reasons. This boring
verified the existence of depressions in the clay surface as indicated by the seismic survey.
Comparison of lithologic units encountered at 15 wells or soil borings depths to calculated seismic
depths indicate the seismic findings are consistent with actual depths to bedrock. The seismic
depth errors ranged between -2.5 to +2.4 feet, and resulted from the use of a constant wave
velocity. Interval velocities may have varied from station to station due to near-surface differences
within the alluvium. The wells and soil boring locations were chosen based on their close
proximity to the seismic lines.

8/17/2019 Geophysical Investigation EPA
http://slidepdf.com/reader/full/geophysical-investigation-epa 93/164
GEOPHYSICAL FINDINGSKelly Air Force Base
87
Figure 3: Northwest to Southeast Cross-Section, in Feet Above Mean Sea Level [1]
Figure 4: Southwest to Northeast Cross-Section, in Feet Above Mean Sea Level [1]

8/17/2019 Geophysical Investigation EPA
http://slidepdf.com/reader/full/geophysical-investigation-epa 94/164

8/17/2019 Geophysical Investigation EPA
http://slidepdf.com/reader/full/geophysical-investigation-epa 95/164
Kelly Air Force Base
89
REFERENCES
• San Antonio Air Logistics Center, Environmental Management Restoration Operations.
Current Conditions Report for the Building 258 Solid Waste Management Unit , Kelly
AFB, Texas. Science Applications International Corporation. July 1998.
• Science Applications International Corporation. Seismic Reflection Geophysical Survey
Report , Kelly AFB, Texas. SeisPulse Development Corporation. May, 1998.
• Personal communication with Mike King, President of SeisPulse Development
Corporation, Vancouver, Washington. September 4, 1998.
• Personal communication with Rhonda Hampton. Zone 3 Groundwater Project Manager.
Kelly AFB, Texas. September 17, 1998.

8/17/2019 Geophysical Investigation EPA
http://slidepdf.com/reader/full/geophysical-investigation-epa 96/164
90
PAGE LEFT INTENTIONALLY BLANK

8/17/2019 Geophysical Investigation EPA
http://slidepdf.com/reader/full/geophysical-investigation-epa 97/164
Marshalltown FMGP
91
Case Study Abstract
Marshalltown Former Manufactured Gas Plant (FMGP) Site
Marshalltown, IA
Site Name and Location:
Marshalltown FMGPGeophysical Technologies:
Electrical conductivityCERCLIS #
Not Applicable
Period of Site Operation:
1870's to 1946–gas manufacturing
and electric generation
Operable Unit:
Not Applicable
Current Site Activities:
Currently 100 employees still work on-
site. Groundwater monitoring is being
performed.
Point of Contact:
Albert Bevolo Ph.D.
Ames Laboratory
Iowa State University125 Spedding Hall
Ames, IA 50011
(515) 294-5414
Geological Setting:
Pleistocene glacial till,
glaciolacustrine deposits, fluvial
deposits, and loess lie unconformablyover discontinuous layers of limestone
and dolomite.
Technology Demonstrator:
Geoprobe Systems
Corporate Headquarters
601 N. BroadwaySalina, KS 67401
1-800-GEOPROBE
Purpose of Investigation:
The geophysical investigation was undertaken as part of a demonstration under the Department of Energy’s Expedited Site
Characterization program. The goal of the demonstration was to compare the capability of electrical conductivity surveys
with more traditional methods for characterizing subsurface stratigraphy, such as borehole geophysical logging and cone
penetrometer testing (CPT).
Goals related to the soil conductivity probe (SCP) were to confirm and further refine the site geologic and contamination
conceptual models as defined through Phase I activities. Another goal was to define the topography of the lower cohesive
unit (LCU) in order to find low-points where dense non-aqueous phase liquids (DNAPLs) might collect.
Number of Images/Profiles Generated During Investigation:
27 conductivity profiles produced from 700 feet of log in 27 holes
Results:
SCP provided high vertical resolution data from which transitions between high conductivity clay and low conductivity
sands could be readily identified. Calibration with soil borings and CPT showed that the main stratigraphic units were
readily distinguishable. The SCPs provided clear information on stratigraphic transition depths which were readily
integrated with data from CPT and boring logs.
A secondary and unexpected result was the apparent response of the SCPs to DNAPL-saturated soils by distinct decreases in
conductivities.

8/17/2019 Geophysical Investigation EPA
http://slidepdf.com/reader/full/geophysical-investigation-epa 98/164
Marshalltown FMGP
92
EXECUTIVE SUMMARY
The Marshalltown Former Manufactured Gas Plant (FMGP) site is located in an old industrial area in
Marshalltown, Iowa. Gasification by-products of the manufacturing process, including coal tar, coke, and
other materials, were stored on-site in unlined pits. A site investigation found polycyclic aromatic
hydrocarbons (PAHs) in soil samples at levels substantially above background levels. Another
investigation, conducted during an underground storage tank (UST) removal, showed the presence of
petroleum hydrocarbons in excess of applicable action levels in soil and groundwater.
The site is situated on the edge of the flood plain of Linn Creek where the ground surface is flat to gently
sloping. Near surface soils consist of a wide range of fill materials of low plasticity and varying in
thickness from 0.5 to 14 feet. This is underlain by fine-grained cohesive soils consisting of low plasticity
silty clay with interbedded sandy and gravelly clays, ranging in thickness from 6 to 14 feet. Limestone
bedrock is approximately 50 feet below the ground surface. A steep ridge in the bedrock surface, with
about 25 feet of relief, trends northwest-southeast across the site.
The Marshalltown site was used a demonstration site for the comparison of various technologies used inthe site characterization process. The focus of this case study is an assessment of the performance of a soil
conductivity probe (SCP) used to delineate soil stratigraphy and its utility in the Expedited Site
Characterization Process. The information in this report was derived from the interpretive report of the
geophysical investigation. A site-specific goal for the SCP was to define the topography of the lower
cohesive unit (LCU) to identify low-points where dense non-aqueous phase liquids (DNAPLs) might
accumulate. The probe determines soil conductivity by measuring the electric potential across electrodes in
direct contact with the soil.
Results of the investigation revealed that the SCP provided very useful and reliable stratigraphic data. The
upper cohesive unit (UCU) and the LCU contact was inferred by a distinct rise in the conductivity values.
Both of these contacts could easily be identified on most of the soil conductivity logs. A secondary and
unexpected result was the apparent response of the SCP to DNAPL-saturated soils, measured by decreases
in conductivities.
Since this was a demonstration of the SCP when the product was first developed, no direct costs were
associated with this investigation. However, based on current models of equipment and prices associated
with them an estimated cost of $7,875 can be associated with an investigation of this type.
The capabilities of the SCP were proven. The probe was very versatile in that it could maneuver into small
spaces and could penetrate most soil subsurface materials. The SCP was not able to clearly identify
weathered bedrock and probes would break when unexpected bedrock or larger sized gravel and cobbles
were encountered. The probe was also operationally efficient and could be operated by a single person if
necessary. The information collected by the probe can also be used to enhance the site contaminationmodel. The probe has the ability to provide much more detailed stratigraphic information than
conventional auger borings. This is very important when considering the fate and transport of
contaminants. The SCP detected DNAPL-saturated soil as a distinct decrease in conductivity.

8/17/2019 Geophysical Investigation EPA
http://slidepdf.com/reader/full/geophysical-investigation-epa 99/164
Marshalltown FMGP
93
Figure 1: Site Location
SITE INFORMATION
Identifying Information
Marshalltown FMGP SiteMarshalltown, Iowa 50158
Operable Unit: --N/A
CERCLIS #: --N/A
Background [1]
Physical Description: The Marshalltown Former Manufactured Gas Plant (FMGP) is located in
in an old industrial area of Marshalltown, Iowa (Figure 1). The site contains several buildings
from the FMGP and former electric plant and is approximately 2.5 acres in size (Figure 2). The
nearest residential properties are located several hundred feet to the north. The site is located on
the edge of the floodplain of Linn Creek which flows west to east approximately 800 feet south of
the site and discharges into the Iowa River roughly 2.5 miles northeast of the site. Site topographyis flat to gently sloping, with approximately 10 feet of relief across the site.
Site Use: A manufactured gas plant operated at the site from the 1870's until 1946. When the site
first opened in the 1870's, under the name of Marshalltown Gas Light Company, gas
manufacturing was accomplished by coal carbonization. Electrical generation began at the site
between 1888 and 1892. In 1892 the Marshalltown Gas Company, the Marshalltown Electric
Company, and the Marshalltown Street Railway Company consolidated and became the
Marshalltown Light, Power, and Railway Company, which brought the electrical and gas
operations under common ownership. Between 1910 and 1921, the gas manufacturing process was
converted from coal carbonization to carbureted water gas and the ownership was transferred to
the Iowa Railway and Light Corporation. Plant operations continued until 1946.
The FMGP site is currently used as the service and materials distribution center for Alliant Utilities
gas and electric operations. The site is currently owned by IES Utilities who merged with other
mid-western power generation/distribution companies
and is now known as Alliant Utilities. There are 100
employees that work on-site, and the plant is scheduled
to close within the next two years so remediation can
begin [2].
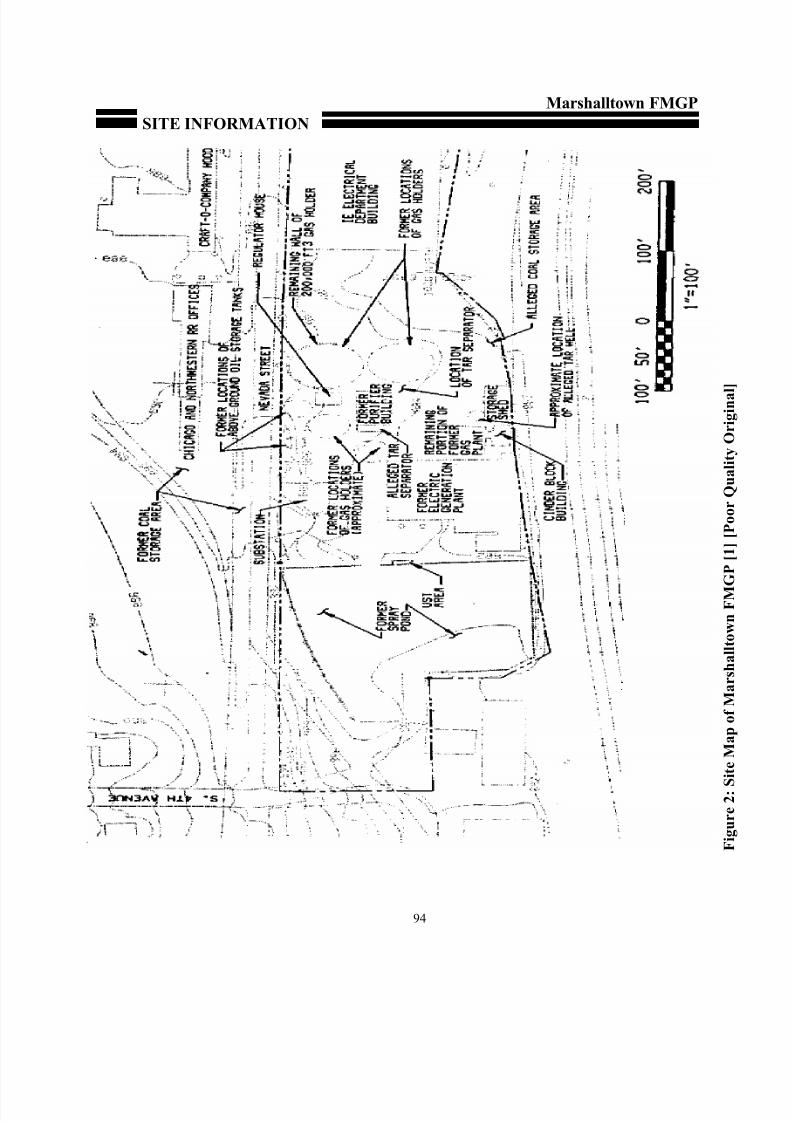
8/17/2019 Geophysical Investigation EPA
http://slidepdf.com/reader/full/geophysical-investigation-epa 100/164
SITE INFORMATION
Marshalltown FMGP
94
F i g u r e 2 : S
i t e M a p o f M a r s h a l l t o w n F M G P [ 1 ] [ P o o r Q u a l i t y O r i g i n a l ]
8/17/2019 Geophysical Investigation EPA
http://slidepdf.com/reader/full/geophysical-investigation-epa 101/164

8/17/2019 Geophysical Investigation EPA
http://slidepdf.com/reader/full/geophysical-investigation-epa 102/164
Marshalltown FMGP
96
MEDIA AND CONTAMINANTS
Matrix Identification [1]
Type of Matrix Sampled and Analyzed: Subsurface soil and occasional weathered rock
Site Geology/Stratigraphy [1]
The overall stratigraphy of the glacial drift in the area of the site consists of loess over Kansan till,
which overlies Mississippian-age limestone and Pennsylvanian shale bedrock. Near-surface soils
include a wide range of fill materials (clay, gravel, sand, cinder, and other debris) of low plasticity
ranging in thickness from 0.5 to 14 feet. This is underlain by fine-grained cohesive soils consisting
of low plasticity silty clay with interbedded sandy and gravelly clays, ranging in thickness from 6
to 14 feet. This layer is also known as the upper cohesive unit (UCU). This is followed by a
granular unit comprised mostly of various types of sand. A layer of low plasticity clayey
lacustrine soil and low to high plasticity glacial till separates the granular unit from bedrock in
most areas of the site. This layer is commonly referred to as the lower cohesive unit (LCU).
Depth to bedrock ranges from 20 feet below the ground surface (bgs) in the northern part of the
site to 40 feet bgs in the southwestern portion. According to drilling information, a steep ridge in
the bedrock surface with about 25 feet of relief trends northwest-southeast across the site.
Depth to groundwater at the site averages between 18 to 20 feet bgs. Hydraulic conductivity
measurements indicate values that range from 0.0029 to 0.00076 cm/sec for the granular soils.
Groundwater in the alluvial sediments tends to flow in a southern direction toward Linn Creek.
Bedrock groundwater flow characteristics are not well established and appear to be strongly
influenced by the activity of production wells in the area that tap the Mississippian aquifer. The
limestone bedrock is part of the Mississippian Burlington and Gilmore City Formations and are
part of the regional Mississippian aquifer.
Contaminant Characterization [1]
Primary Contaminant Groups: The primary contaminants of concern at the site include the
following: benzene, toluene, ethylbenzene, xylene, phenols, and PAHs, such as naphthalene and
phenanthrene. Some contaminants are known to be present as dense non-aqueous phase liquids
(DNAPLs).
Matrix Characteristics Affecting Characterization Cost or Performance [1, 4]
Due to surface obstructions encountered on-site, such as buildings, sheds, etc., explorations could
not be conducted at some locations. Unexpected cobbles, larger sized rocks, boulders, or bedrock
were encountered and posed a problem for the probes. Several probes were broken when these
units were encountered.
Factors such as non-uniform infiltration of highly saline solutions from winter road salting
operations, poor ground-to-probe contacts at shallow depths, and the diverse nature of the surficial
fill contributed to the erratic conductivity data gathered within the top six feet from the surface.

8/17/2019 Geophysical Investigation EPA
http://slidepdf.com/reader/full/geophysical-investigation-epa 103/164
MEDIA AND CONTAMINANTSMarshalltown FMGP
97
Figure 3:
Conductivity
Probe [3]
Irregularity in the conductivity trace can also be attributed to thinly interbedded seams of silts,
sands, clays, and gravels up to depths of approximately 15 feet bgs. Weathered rock did not havea distinct conductivity signature, and could not be distinguished from soils on the basis of its
conductivity.
GEOPHYSICAL INVESTIGATION PROCESS
Investigation Goals [1, 4]
The geophysical investigation was undertaken as part of a demonstration under the Department of
Energy’s Expedited Site Characterization program. The goal of the demonstration was to compare
the capability of electrical conductivity surveys with more traditional methods for characterizing
subsurface stratigraphy, such as borehole geophysical logging and cone penetrometer testing
(CPT).
Goals related to the soil conductivity probe (SCP) were to confirm and further refine the site
geologic and contamination conceptual models as defined through Phase I activities. Another
goal was to define the topography of the LCU in order to find low points where DNAPLs might
collect.
Geophysical Methods [1, 5, 6]
The focus of this case study is an assessment of the performance of the Geoprobe® SC100
conductivity probe (SCP) in delineating soil stratigraphy. The determines soil conductivity by
measuring the electric potential across electrodes, which are in direct contact with the soil.Electrical conductivity varies with soil type, with clays exhibiting higher
conductivities than silts, and sands and gravels having the lowest
conductivity. The probe has a vertical resolution of 0.05 feet with a data
rate of 20 samples per second, and a maximum depth range of 80 feet bgs.
The SCP system is small and very maneuverable.
The conductivity probe, shown in Figure 3, consists of a steel shaft running
through the center of four stainless steel contact rings. An engineering
grade plastic electrically isolates the rings and the shaft from each other.
The probe was operated in the Wenner array configuration which reacts
linearly to variations in formation conductivity and yields good vertical
resolution by using all four electrodes. The probe is approximately eightinches long and has a diameter that tapers from 1-1/8 inch at the top to 1
inch at the point. The taper assures a firm ground-to-probe contact. The
probe assembly threads directly to standard Geoprobe® probe rods. A
signal cable is threaded through the inside of the rod string and into a
PC-based data acquisition system housed in a ruggedized case. Depth

8/17/2019 Geophysical Investigation EPA
http://slidepdf.com/reader/full/geophysical-investigation-epa 104/164
GEOPHYSICAL INVESTIGATION PROCESSMarshalltown FMGP
98
measurements are obtained by a stringpot system configured to measure the distance from the
driving mechanism to the ground surface. The stringpot signal is used both to determine probedepth and speed at which the probe is
advancing.
Technology Justification
The reasons that soil conductivity was selected for the investigation at the Marshalltown site were
not site-specific, but were related to the investigation as a demonstration for the expedited site
characterization process. However, due to the many cultural interferences at the site such as chain-
link fences, stacks of steel piping, steel storage sheds, and vehicle traffic, other geophysical
methods such as ground penetrating radar and electromagnetic offset logging could not provide
useful results [4].
GEOPHYSICAL FINDINGS
Technology Calibration [1]
In order to calibrate the SCP with local soils at the site, 123 sample soil cores (which resulted in
127 soil samples) were collected from 27 geoprobe locations at specific depths for standard core
logging and visual soil classification (Figure 4). These core samples were two feet long and were
collected from six subsurface zones at specified depths using another Geoprobe® system. The
units of measurement for conductivity are milliSeimens per meter (mS/m). The Seimen is the
inverse of the Ohm, the standard measure for electrical resistivity. Direct calibration of the SCP
with soils collected from the site revealed the following comparisons in conductivity values:Clayey soils: 60 - 140 mS/m; sandy soils: 30 - 40 mS/m; gravels: 20 - 35 mS/m (Table 1 and
Table 2).
The SCP was advanced adjacent to two existing borings for calibration: MW-3A and B-8.
Distances between the borings and probes were 16 and 13 feet respectively. The SCP was also
calibrated against CPTs. CPT is a reliable direct-push geotechnical method of characterizing soils
on the basis of its physical resistance to penetration. The conductivity profiles were compared
directly to the stratigraphic logs for these borings and with the CPT results.

8/17/2019 Geophysical Investigation EPA
http://slidepdf.com/reader/full/geophysical-investigation-epa 105/164

8/17/2019 Geophysical Investigation EPA
http://slidepdf.com/reader/full/geophysical-investigation-epa 106/164
GEOPHYSICAL FINDINGS
Marshalltown FMGP
100
most conductivity logs, readings from three to five feet bgs exhibited erratic conductivity values.
Explanations offered for this phenomenon included infiltration of extremely saline solutionsresulting from salting of roads during winter weather and poor ground-to-probe contact at shallow
depths. The UCU interface and the LCU interface were easily identified in most locations of the
site. The UCU contact with the granular unit could be inferred by the distinct drop in soil
conductivity between 14 and 17 feet bgs. The LCU contact with the granular unit above it was
identified by an increase in soil conductivity between 30 and 32 feet bgs. Figure 5 shows cross
section A-A` showing SCP conductivity profiles and stratigraphic zones as determined by soil
boring logs and CPT data. The conductivities of the units and conductivity changes across the
transitions in ML-28 and ML-45 are shown in Table 1 and Table 2.
A secondary and unexpected result was the apparent response of the SCP to DNAPL-saturated
soils by decreases in conductivities. At the base of the granular unit above the LCU in ML-45, soil
conductivity shows a 20 mS/m drop from about 50 mS/m to about 30 mS/m. When depths areadjusted for small stratigraphic variations between sites, the depth of conductivity decrease
corresponds closely to a known zone of DNAPL, as seen in the boring logs for B-8.

8/17/2019 Geophysical Investigation EPA
http://slidepdf.com/reader/full/geophysical-investigation-epa 107/164
GEOPHYSICAL FINDINGS
Marshalltown FMGP
101
F i g u r e 5 : S t r a t i g r a p h i c C r o s s S e c t i o
n A A ` [ 1 ]

8/17/2019 Geophysical Investigation EPA
http://slidepdf.com/reader/full/geophysical-investigation-epa 108/164

8/17/2019 Geophysical Investigation EPA
http://slidepdf.com/reader/full/geophysical-investigation-epa 109/164
GEOPHYSICAL FINDINGS
Marshalltown FMGP
103
Table 1: Comparison of Soil Stratigraphy Results for ML-28 SCP and CPT, and MW-3A
Stratigraphy Conductivity
mS/m
ML-28 SCP
Depth
(Feet bgs)
ML-28 CPT
Depth
(Feet bgs)
MW-3A Log
Depth
(Feet bgs)
UCU 130-190
Transition depth for UCU 140->70 16-17 17 17
Granular Unit 20-80
Transition depth for
Granular Unit
50->90 30 29-30 32
Source: [1]
Table 2: Comparison of Soil Stratigraphy Results for ML-45, ML-60, and B-8
Stratigraphy Conductivity
mS/m
ML-45 SCP
Depth
(Feet bgs)
ML-60 CPT
Depth
(Feet bgs)
B-8 Log
Depth
(Feet bgs)
UCU 90-140
Transition depth for UCU 90->30 17-18 nd 19Granular Unit 20-80
Transition depth for
Granular Unit
25->85 35-36 34 36
LCU 70-90
nd=no data
Source: [1]

8/17/2019 Geophysical Investigation EPA
http://slidepdf.com/reader/full/geophysical-investigation-epa 110/164
Marshalltown FMGP
104
LESSONS LEARNED
Lessons learned for the Marshalltown site include the following:
• Geophysical survey techniques are an important part of the expedited site characterization process, however not all techniques are appropriate for all sites. Marshalltown had
complex stratigraphic conditions that led to significant error and uncertainty in the some of
the geophysical survey results. Therefore, potential limitations of each geophysical
method must be carefully considered on a site specific basis.
• The stratigraphic correlations between the push technologies (SCP and CPT) and the
borehole log data demonstrated that the contacts between soil units can generally be
interpreted from the CPT and soil conductivity logs with confidence. Correlations were
generally within one to two feet, but this variance was attributed to the distance between
SCP locations and the soil boring locations.
• The SCP was more maneuverable and more versatile than the CPT and could penetratemost soil subsurface materials. The probe was also operationally much more efficient than
the CPT and could be operated by a single person if necessary. SCP provides reliable
high-resolution demarcation between high conductivity clays and silts and low conductivity
sands and gravels. With proper calibration from soil borings, the SCP can provide reliable
infill information between boring logs and can be used to enhance the site conceptual
model. The probe provides more detailed stratigraphic information than conventional
auger borings.
• The SCP appears to respond to DNAPL-saturated soil by exhibiting a distinct conductivity
dip. Since other factors, most notably sand or gravel lenses, can cause conductivity dips,
the SCP cannot by itself detect DNAPLs. However, dips in conductivity in generally lowconductivity (sandy permeable) layers immediately above high-conductivity (clayey low-
permeability) zones would certainly be a target to investigate pooling of DNAPLs. This
would be especially true if the stratigraphic transition occurred at lower elevations
compared to surrounding logs. Close inspection of SCP results can provide a good
screening tool for the location of accumulated DNAPLs.
• Twenty-seven SCP penetrations were combined with data from soil borings, Geoprobe®
core samples, and CPT penetrations. Locations of the various penetrations are shown in
Figure 4. The SCP provided high vertical resolution data from which transitions between
high conductivity clay and low conductivity sands could be readily identified. Comparison
with soil borings and CPT logs showed that the main stratigraphic units were readily
distinguishable and that the transition depths agreed among the three methods.
• The SCP was not able to clearly identify weathered bedrock. The probes would break
when unexpected bedrock or large gravel/cobbles were encountered. This could be

8/17/2019 Geophysical Investigation EPA
http://slidepdf.com/reader/full/geophysical-investigation-epa 111/164
LESSONS LEARNEDMarshalltown FMGP
105
remedied by using more indestructible equipment at developed sites where heterogeneous
fill layers would be expected or are already known to exist.

8/17/2019 Geophysical Investigation EPA
http://slidepdf.com/reader/full/geophysical-investigation-epa 112/164
Marshalltown FMGP
106
REFERENCES
1. Ames Laboratory, Ames Expedited Site Characterization Demonstration at the Former
Manufactured Gas Plant Site, Marshalltown, Iowa. Ames Laboratory, Ames Iowa.
1996.
2. Personal Communications with Dean Hargens, Alliant Utilities. September 10, 1998.
3. Personal Communications with Johanshir Golchin, Iowa Department of Environmental
Resources. September 17, 1998.
4. Bevolo, A., Kjartanson, B., Stenback, G., and Wonder, J., Site Characterization,
Expedited. Ames Laboratory, Ames Iowa. 1997
5. Christy, C., Christy, T., and Wittig, V. A Percussion Probing Tool for the Direct
Sensing of Soil Conductivity, Technical Paper . Geoprobe Systems, Salina Kansas. March
1994.
6. Personal Communications with Albert Bevolo, Ames Laboratory. August 24, 1998.
7. Fax Communication with Geoprobe Systems. September 15, 1998.
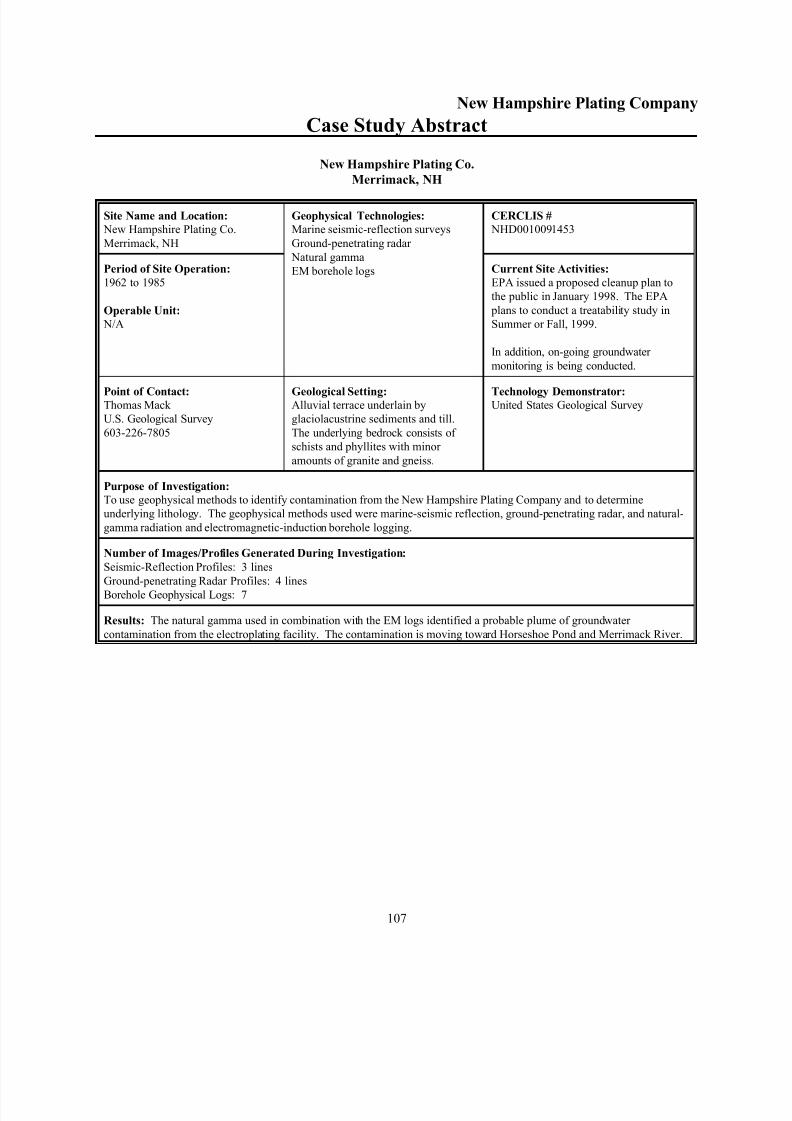
8/17/2019 Geophysical Investigation EPA
http://slidepdf.com/reader/full/geophysical-investigation-epa 113/164
New Hampshire Plating Company
107
Case Study Abstract
New Hampshire Plating Co.
Merrimack, NH
Site Name and Location:
New Hampshire Plating Co.
Merrimack, NH
Geophysical Technologies:
Marine seismic-reflection surveys
Ground-penetrating radar
Natural gamma
EM borehole logs
CERCLIS #
NHD0010091453
Period of Site Operation:
1962 to 1985
Operable Unit:
N/A
Current Site Activities:
EPA issued a proposed cleanup plan to
the public in January 1998. The EPA
plans to conduct a treatability study in
Summer or Fall, 1999.
In addition, on-going groundwater
monitoring is being conducted.
Point of Contact:Thomas Mack
U.S. Geological Survey
603-226-7805
Geological Setting:Alluvial terrace underlain by
glaciolacustrine sediments and till.
The underlying bedrock consists of
schists and phyllites with minor
amounts of granite and gneiss.
Technology Demonstrator:United States Geological Survey
Purpose of Investigation:
To use geophysical methods to identify contamination from the New Hampshire Plating Company and to determine
underlying lithology. The geophysical methods used were marine-seismic reflection, ground-penetrating radar, and natural-
gamma radiation and electromagnetic-induction borehole logging.
Number of Images/Profiles Generated During Investigation:
Seismic-Reflection Profiles: 3 lines
Ground-penetrating Radar Profiles: 4 lines
Borehole Geophysical Logs: 7
Results: The natural gamma used in combination with the EM logs identified a probable plume of groundwater
contamination from the electroplating facility. The contamination is moving toward Horseshoe Pond and Merrimack River.

8/17/2019 Geophysical Investigation EPA
http://slidepdf.com/reader/full/geophysical-investigation-epa 114/164
New Hampshire Plating Company
108
EXECUTIVE SUMMARY
The New Hampshire Plating Company Site is located on 13.1 acres in Merrimack, New Hampshire. On
the property are a former plating facility, a large pond, and four lagoons. The Merrimack River is located
about 600 feet (ft) east of the plating facility and the northern end of Horseshoe Pond is located about 500
ft south of the plating facility. From 1962 until 1965 the property was used for electroplating activities.
The contamination was a result of the facility discharging 35,000 to 60,000 gallons per day of
electroplating wastes into the four unlined lagoons. The wastes consisted of cyanide plating baths and
sludges, acids and chlorinated solvents.
The site geology is comprised of an alluvial terrace consisting of sand, silt and some gravel. Under the
alluvial terrace is glaciolacustrine sediments and till which consists primarily of sand, silt, clay and some
gravel. Under the glaciolacustrine sediments and till is bedrock consisting of schist and phyllites with
minor amounts of granite and gneiss. The water table is encountered at depths ranging from five to 20 ft in
the study area.
A geophysical investigation was conducted at the site as part of a larger effort to delineate site conditionsand the scope of contamination. The information presented in this report was derived from the interpretive
report of the geophysical investigation. The geophysical investigation used four different technologies.
Continuous seismic reflection and ground penetrating radar surveys were performed to characterize the site
geology and locate bedrock structures. The seismic surveys were conducted near the shore of Horseshoe
Pond and along the eastern side and the middle of the Merrimack River. The profiles conducted in
Horseshoe Pond indicated that the bedrock ranged from the water surface to less than 20 ft below (the
survey could only identify to that depth at this location–this may not be true elsewhere). The profiles
conducted in the Merrimack River indicated that bedrock ranged from 10 to 50 ft below the water surface.
The ground penetrating radar (GPR) method was used to produce geophysical profiles of the land area
around the facility and the lagoons. The GPR profiles successfully determined soil types to a depth of 30-
35 ft.
Natural gamma logs were used to delineate the stratigraphy of sub-surface materials in eight monitoring
wells, and electromagnetic induction (EM) logs were used to identify zones of conductive groundwater that
would indicate the presence of contaminated groundwater. The gamma logs correlated well with existing
lithologic logs for the wells. The EM logs showed significant spikes, indicating possible zones of
contamination. The depths at which the spikes occurred correlated well with measures of specific
conductance of groundwater taken as part of the on-going monitoring program in those wells.
The seismic and radar surveys were moderately successful, but some difficulties were encountered due to
the presence of fine-grained sediments in the bottom of the pond and in the soils around the facility. Fine-
grained sediments limited the penetration of the radar signals, resulting in blank areas on the profiles. The
GPR profiles conducted on water bodies were inconclusive because the signal was attenuated by the water column and was unable to penetrate beneath the bottom sediments. The gamma and EM logs were very
successful in characterizing the stratigraphy and identifying zones of highly conductive groundwater that
may indicate contaminated groundwater.

8/17/2019 Geophysical Investigation EPA
http://slidepdf.com/reader/full/geophysical-investigation-epa 115/164
New Hampshire Plating Company
109
SITE INFORMATION
Identifying Information
New Hampshire Plating CompanyWright Avenue
Merrimack, New Hampshire
Background [1]
Physical Description: The New Hampshire Plating Company is located on Wright Avenue in
Merrimack, Hillsborough County, New Hampshire. The surrounding area is primarily used for
light industrial and commercial purposes, with some residential areas nearby. The site covers 13.1
acres of leased property and includes the former plating facility and four lagoons (see Figure 1).
The plating facility is located approximately 600 ft west of the Merrimack River. The study area
consisted of the land around the former facility and the lagoons, and extended east to the
Merrimack River and south to Horseshoe Pond, to determine if the contamination was moving inthose directions. The site lies in the 100-year floodplain of the Merrimack River, and the
topography of the site has little relief.
Site Use: The property was used from 1962 until 1985 for electroplating activities. The four
lagoons on site were used for disposal of wastes and wastewaters resulting from the electroplating
operations. These lagoons were unlined and had no leachate detection or collection.
Release/Investigation History: From 1962 to 1985, the facility discharged on-site 35,000 to
60,000 gallons per day (gpd) of electroplating wastes into a series of four unlined lagoons. The
wastes included cyanide plating baths and sludges, acids, and chlorinated solvents. Discharge of
degreasing solvents into lagoon was discontinued in the late 1970s. In 1980, the New HampshirePlating Company (NHPC) notified the EPA that it was a hazardous waste disposal facility under
Subtitle C of the Resource Conservation and Recovery Act (RCRA). An inspection by the New
Hampshire Department of Environmental Services (NHDES) and the Environmental Protection
Agency (EPA) in April 1982 noted several RCRA violations. As a result, the New Hampshire
Division of Public Health Services issued a Notice of Violations and Order of Abatement to
NHPC. In February 1983, the State of New Hampshire filed a civil suit against NHPC. NHPC
halted operations in 1985 because it lacked the financial resources necessary to meet compliance
standards and continue hydrogeologic investigations at the property.
In June 1987, a contractor for New Hampshire Division of Environmental Services treated the
lagoon system with lime and a sodium hypochlorite solution, removed debris, drums, and plating
tank liquids to a regulated disposal facility, and conducted a superficial cleaning of themanufacturing building. In 1990, EPA used emergency funds to solidify the contaminated sludge
and soil at the property.
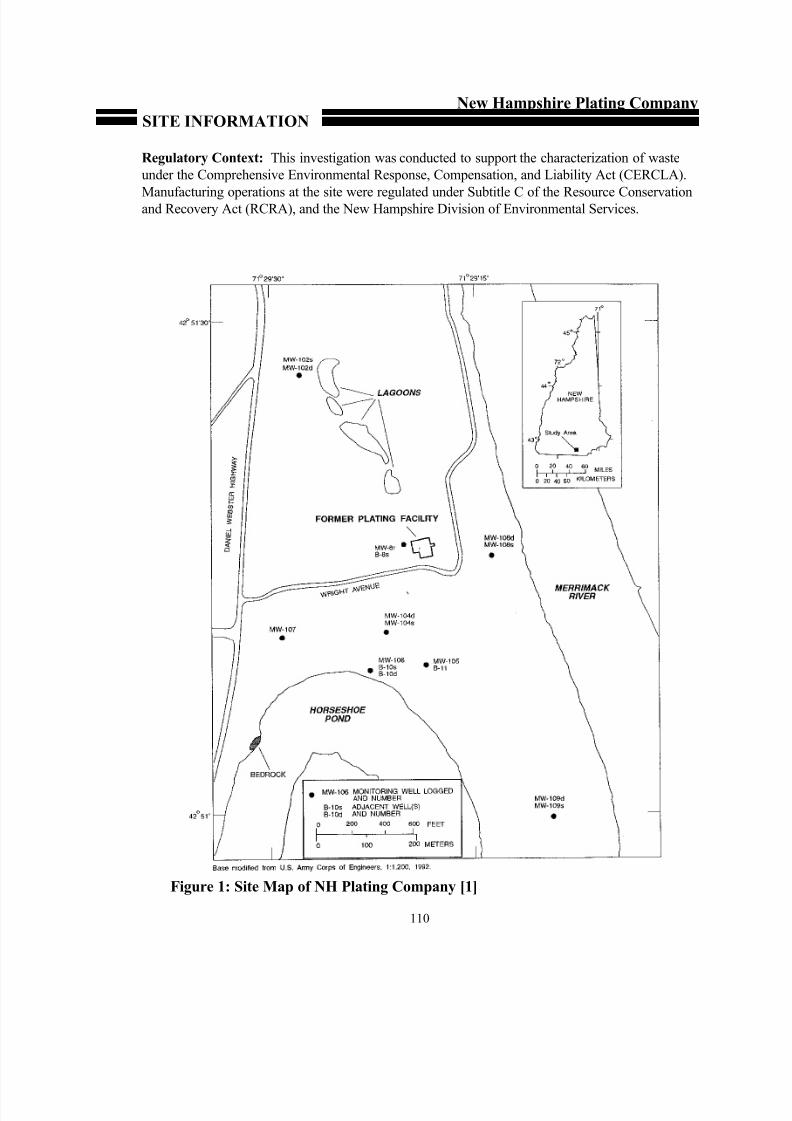
8/17/2019 Geophysical Investigation EPA
http://slidepdf.com/reader/full/geophysical-investigation-epa 116/164

8/17/2019 Geophysical Investigation EPA
http://slidepdf.com/reader/full/geophysical-investigation-epa 117/164
SITE INFORMATIONNew Hampshire Plating Company
111
Site Logistics/Contacts
Federal Lead Agency: EPA
Federal Oversight Agency: None
Remedial Project Manager:
Jim Dilorenzo
EPA Region 1
617-918-1247
Geophysical Subcontractor:
Thomas Mack
United States Geologic Survey
361 Commerce Way
Pembroke, NH 03275
603-226-7805
MEDIA AND CONTAMINANTS
Matrix Identification
Type of Matrix Sampled and Analyzed: Sand, silt, fine-grained lake bottom sediments, and
coarse-grained stratified drift.
Site Geology/Stratigraphy
Site geology is composed of an alluvial terrace consisting of sand, silt, and some gravel, ranging in
thickness from less than five to 25 feet (ft). The total thickness of surficial sediments overlying
bedrock in the study area ranges from zero at the northwestern bank of Horseshoe Pond to greater
than 120 ft between the center of the Horseshoe Pond and the plating facility, and approximately
20 ft along the northeastern bank of Horseshoe Pond.
The alluvial terrace is underlain by glaciolacustrine sediments and till. The glaciolacustrine
sediments consist primarily of sand, silt, and clay with some gravel. Coarse-grained sediments are
interspersed with fine-grained lake bottom sediments within this unit. The till is a poorly sorted
mixture of silt, sand, and gravel with some boulders and clay. The total thickness of these units
could be as much as 100 ft.
Underlying the glaciolacustrine sediments and till is a bedrock unit consisting of schists and
phyllites with minor amounts of granite and gneiss. The bedrock surface forms a north-south
trending trough and outcrops at the northwestern bank of Horseshoe Pond.
The depth to the water-table is approximately 5 to 20 ft in the study area. Groundwater flows
beneath the site to the east toward the Merrimack River and to the south toward Horseshoe Pond.
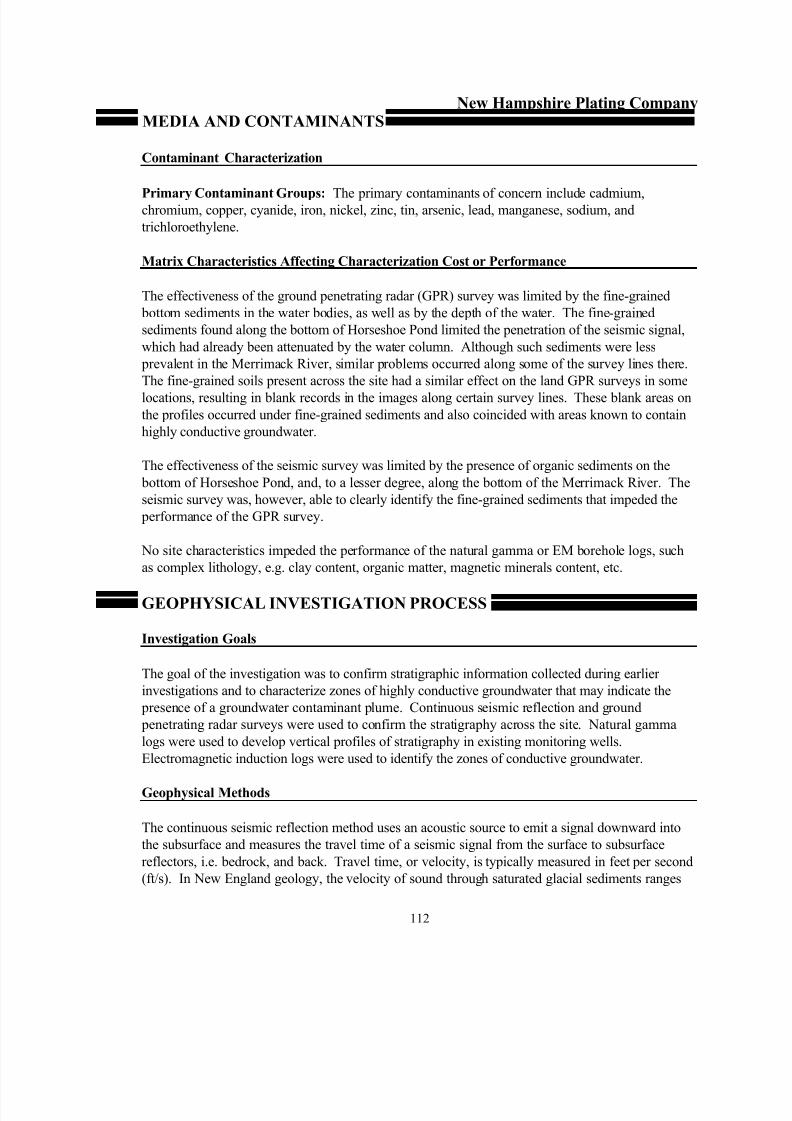
8/17/2019 Geophysical Investigation EPA
http://slidepdf.com/reader/full/geophysical-investigation-epa 118/164

8/17/2019 Geophysical Investigation EPA
http://slidepdf.com/reader/full/geophysical-investigation-epa 119/164
GEOPHYSICAL INVESTIGATION PROCESSNew Hampshire Plating Company
113
from 4,000 to 6,000 ft/s [2]. This study used a seismic sound velocity of 5,000 ft/s to calculate
penetration depth of the seismic signal. The continuous seismic reflection profile was carried out
using Geoacoustic’s Geopulse© equipment operated at a frequency of 700 to 1500 hertz.
The ground penetrating radar (GPR) method uses an antenna to radiate short pulses of high-
frequency radio waves into the subsurface and a receiving antenna to record variations in the
reflected return signal. Interpretations of GPR profiles depend on the sediments penetrated and the
scale adjustments as those sediments change. For example, the electromagnetic velocity in
saturated unconsolidated sediments is 0.2 feet per nanosecond (ft/ns) as compared to 0.4 ft/ns in
unsaturated unconsolidated sediments. The primary factor limiting depth of penetration is the
electrical conductivity of the sediments [1]. The type of equipment used was a GSSI System 10
operated at a frequency of 80 megahertz.
Natural gamma logging is the continuous physical measurement of the release of natural gamma
radiation from the soil and rocks surrounding the length of a borehole. The gamma log measuresthe total gamma radiation, in counts per second, as the detector is raised in the well column. In the
glaciated sediments of the northeast, fine-grained sediments rich in clay are generally more
radioactive than quartz sand or carbonate rocks [1]. The natural gamma data were gathered using
Century Equipment Natural Gamma detector which is capable of logging at a rate of 30 ft/min.
The electromagnetic induction method uses a transmitter coil that generates an electromagnetic
field that induces currents in the earth. A receiver coil intercepts the electromagnetic fields
generated induced current as a voltage that is linearly related to subsurface conductivities.
Subsurface conductivities are measured in terms of millisiemens/centimeter (µS/cm). The EM
conductivity of unconsolidated glacial sediments is primarily affected by the presence of clay
minerals and the conductivity of ground water. The presence of ions in water, such as dissolvedmetals, increases the electrical conductivity of that water [1]. The EM data were acquired using a
Century Equipment EM Flow Meter, Model 9721.
GEOPHYSICAL FINDINGS
Technology Calibration
The only calibration conducted was to focus the EM probe so that the maximum response was
obtained from soils about one foot from the probe, or the center of the borehole. This measure was
taken to avoid any interference with the well casing materials. The seismic, ground penetrating
radar and natural gamma instruments needed no calibration.

8/17/2019 Geophysical Investigation EPA
http://slidepdf.com/reader/full/geophysical-investigation-epa 120/164
GEOPHYSICAL FINDINGSNew Hampshire Plating Company
114
Investigation Results
Continuous seismic reflection profiles were generated along 16 lines around Horseshoe Pond.Along some lines, organic sediments at the bottom of the Pond impeded the penetration of the
seismic wave, resulting in ambiguous results. The profiles generated for Horseshoe Pond indicated
that bedrock, overlain at times by coarse-grained sediments, was identified at depths ranging from
the surface of the pond to approximately 20 ft below the surface. At the northernmost end of the
pond, the method was unable to detect bedrock known to be present at a depth of 100 ft. The
investigator believed that the inability of the method along this line was due to the presence of
organic bottom sediments that prevented the penetration of the seismic signal.
The seismic survey of the Merrimack River included eight lines along the western shore and five
lines taken along the midline of the river. Bedrock was found underneath the river at depths
ranging from 10 to 50 ft below the river surface, and to depths of 20 ft along the shoreline. The
results from the river survey were markedly better than those for the pond survey. The lack of organic sediments in the river resulted in a better profile of the bedrock surface in all lines.
Ground penetrating radar profiles were generated along 12 lines around the plating facility and
extending north and south from the facility. Along most of the lines, the survey found that the
subsurface materials consisted mainly of silt, sand, and clay. The subsurface materials graded to a
fine sand along the southernmost survey line, close to Horseshoe Pond. Bedrock outcrops can be
seen in a few of the profiles. The fine materials tended to limit the penetration of the radar signal
to depths no greater than 35 ft, and obscured the water table along most lines. In several of the
profiles, blank areas appear below a depths of 10 to 12 ft. These blank areas were interpreted to
represent the failure of the radar signal to penetrate fine-grained soils, or the presence of highly
conductive groundwater. Radar surveys taken on the pond and the river yielded ambiguous results,as the radar signal was attenuated by the water and failed to penetrate the fine-grained sediments
along the pond bottom.
Natural gamma logs were developed for seven existing monitoring wells, one upgradient of the
plating facility and its lagoons, and six downgradient. The gamma logs were useful in delineating
the stratigraphy of the subsurface materials and identifying permeable and impermeable zones.
The EM log was used to vertically delineate zones of increased electrical conductivity to identify
potential contaminant plumes.
Three of these logs have been reproduced in Figures 2 to 4. The EM and gamma logs in these
figures are shown along with the lithologic logs developed at the time the wells were installed
(presented to the right of the geophysical logs). The lithologic logs indicate significant
heterogeneity in the distribution of layers of coarse to fine materials. The only consistent stratumfound in each of the logs was the near-surface very fine sand layer. The gamma readings in each
of these borings correlated closely with the lithologic logs. Gamma readings were clearly higher in
strata composed of finer sands and silts and lower in sandy strata. Gamma counts of less than 100
counts per second (cps) consistently were measured in strata that were identified in the lithologic

8/17/2019 Geophysical Investigation EPA
http://slidepdf.com/reader/full/geophysical-investigation-epa 121/164
GEOPHYSICAL FINDINGSNew Hampshire Plating Company
115
logs as medium to coarse sands. Higher counts, in the range of 100 to 150 cps, were registered in
the layers of fine sand and silts.
The EM logs were taken to identify zones of conductive groundwater that may indicate the
presence of chromium-contaminated groundwater. In each of the logs shown in Figures 2 to 4,
there are significant spikes in the EM readings, indicating possible zones of contamination. MW-
8r (Figure 2), which is immediately downgradient of the lagoons and directly west of the plating
facility, showed three distinct zones of conductive ground water, centered at altitudes of
approximately 15, 58, and 92 ft above mean sea level (msl). In MW-104d which is located to the
south of the lagoons, only one such zone can be seen, centered at 75 ft msl (Figure 3). In MW-
108d, located to the east of the plating facility, a single zone is seen at 54 ft msl (Figure 4). It is
interesting to note that in each of the wells, the spikes in the EM readings occur in strata composed
of finer materials.
Results Validation
The results of the EM measurements were compared with water samples that were being collected
as part of the ongoing monitoring. Specific conductance was measured in each well and the result
printed on the geophysical logs in Figures 2 to 4 (shown to the right of the lithologic log). The
altitude at which the conductance log is printed and indicates the depth of the well screen. The
measured conductance correlated well with the locations with high conductivity from EM logging
in two of the three logs. In MW-8r and MW-108d, the specific conductance was higher at the
depths at which the EM measurements were also high. In MW-104d, however, high specific
conductance was measured near the bottom of the well, but the EM readings at that altitude were
not high relative to a higher location in the well. Measures of specific conductance can be sensitive
to naturally occurring ions, as well as ions associated with chromium contamination.

8/17/2019 Geophysical Investigation EPA
http://slidepdf.com/reader/full/geophysical-investigation-epa 122/164
GEOPHYSICAL FINDINGSNew Hampshire Plating Company
116
Figure 2: Geophysical Log for MW-8r [3]

8/17/2019 Geophysical Investigation EPA
http://slidepdf.com/reader/full/geophysical-investigation-epa 123/164
GEOPHYSICAL FINDINGSNew Hampshire Plating Company
117
Figure 3: Geophysical Log for MW-104d

8/17/2019 Geophysical Investigation EPA
http://slidepdf.com/reader/full/geophysical-investigation-epa 124/164
GEOPHYSICAL FINDINGSNew Hampshire Plating Company
118
Figure 4: Geophysical Log for MW-180d

8/17/2019 Geophysical Investigation EPA
http://slidepdf.com/reader/full/geophysical-investigation-epa 125/164

8/17/2019 Geophysical Investigation EPA
http://slidepdf.com/reader/full/geophysical-investigation-epa 126/164
LESSONS LEARNED
New Hampshire Plating Company
120
traveled far, and for more complex stratigraphy. In these situations, the borehole
technologies may be most effective in combination with examination of boring logs and
limited initial monitoring well placement. The monitoring wells are cost-effectively placedin combination with the borehole technologies investigation and are useful for correlating
results. Following the combination of initial efforts of boring log examination,
groundwater monitoring, and borehole technologies evaluations, additional borings and
monitoring wells may be placed more cost-effectively, than if only borings and monitoring
wells were placed.
• However, for sites with limited areal extent, shallow contamination, and/or simple
stratigraphy, borehole technologies (EM and natural gamma) are less cost-effective.

8/17/2019 Geophysical Investigation EPA
http://slidepdf.com/reader/full/geophysical-investigation-epa 127/164
New Hampshire Plating Company
121
REFERENCES
1. Mack, Thomas J. Geophysical Investigations in the Vicinity of a Former Electroplating
Facility in Merrimack, New Hampshire: U.S. Environmental Protection Agency, Region
1, 1994.
2. Haeni, F.P. Application of continuous seismic-reflection methods to hydrologic studies.
Ground Water, 1996, v. 24, no. 1, p. 23-31.
3. Beres, Milan Jr., and Haeni, F.P. Application of ground-penetrating-radar methods in
hydrogeologic studies. Ground Water, 1991, v. 29, no. 3, p. 375-386.

8/17/2019 Geophysical Investigation EPA
http://slidepdf.com/reader/full/geophysical-investigation-epa 128/164
122
PAGE LEFT BLANK INTENTIONALLY

8/17/2019 Geophysical Investigation EPA
http://slidepdf.com/reader/full/geophysical-investigation-epa 129/164
NMSHTD District 1 Headquarters
123
Case Study Abstract
New Mexico State Highway and Transportation Department (NMSHTD)
Underground Storage Tank (UST) Investigation
Deming, New Mexico
Site Name and Location:
NMSHTD UST Investigation
Deming, NM
Geophysical Technologies:
Magnetometry
Electromagnetics
Natural gamma logging
Soil gas analysis
Date of Investigation: July 1997
Period of Site Operation:
1955 to present
Operable Unit: N/A
Current Site Activities:
Planning for Soil Vapor Extraction
Remedy
Points of Contact:
Phil Ramos, 505-827-5528
Richard Meixner, 505-822-9400
Jim Viellenave, 303-278-1911
Geological Setting: Quaternary
bolson alluvium underlain by
Cretaceous Mesa Verde and Mancos
shale
Technology Demonstrator:
Sunbelt Geophysics
P.O. Box 36404
Albuquerque, NM 87176505-266-8717
TEG Rocky Mountain
400 Corporate Circle, Suite R
Golden, CO 80401
303-278-0104
Purpose of Investigation: The overall goal of this environmental investigation was to identify and characterize the source
of chlorinated VOC contamination in groundwater beneath the NMSHTD site. The goal of the magnetic and
electromagnetic survey was to locate buried materials that might be potential sources of contamination. The goal of the
gamma log survey was to guide the placement of the soil vapor sampling points.
Number of Images/Profiles Generated During Investigation: 33 natural gamma profiles.
Results: Magnetometry and electromagnetics identified two areas of concern. Natural gamma logs of direct-push boreholesidentified stratigraphic units that influenced the migration of contaminant vapors in the vadose zone. Permanent soil gas
sampling points were installed in the units identified by the gamma logs. The soil gas survey provided a representative
distribution of the contamination in the vadose zone.

8/17/2019 Geophysical Investigation EPA
http://slidepdf.com/reader/full/geophysical-investigation-epa 130/164
NMSHTD District 1 Headquarters
124
EXECUTIVE SUMMARY
The New Mexico State Highway and Transportation Department (NMSHTD) District 1 Headquarters site
is located in Deming, New Mexico in the southwestern part of the state. The site covers approximately 15
acres. The site lies within 10 miles of the U.S./Mexico border. The topography is generally flat with littleor no relief across the site. The Mimbres River is located north of the site and is the only nearby water
body. The property has been used since 1955 by the NMSHTD for vehicle maintenance, steam cleaning,
and other activities. During years of heavy roadbuilding, a materials testing laboratory used 1,1,1-
tetrachloroethane (1,1,1-TCA) on a regular basis for asphalt analyses. Spent solvent was either disposed
off site or recycled in an on-site still. The aggregate used in testing was apparently rinsed with water, and
the contaminated water was regularly rinsed down the drain and into the septic system.
Site geology consists of deposits typical of an arid zone basin that has been filled in by erosion of materials
from the surrounding uplands. Locally interlayered sandy clay and clayey sand are present with some
gravel. A thick gravel layer was present at depths between eight and 15 feet below ground surface (bgs).
Depth to groundwater is 100 to 150 feet bgs.
A geophysical investigation was completed as part of a soil gas survey conducted at the site in 1997. The
information presented in this report was derived from the interpretive report of the geophysical
investigation. Geophysical methods were used to identify buried materials and to find optimal locations for
the placement of soil gas sampling points. A reconnaissance survey was performed over the study area
using magnetometry and electromagnetics (EM) to identify buried materials that might be sources of
contamination. The reconnaissance survey was conducted over a 25-acre area from July 7 to July 22,
1997. The survey identified numerous areas of buried materials, but only two were of interest. A septic
tank was identified to the southeast of the building that had housed the materials testing laboratory. Also
identified was another area located approximately 75 feet to the north of the septic tank on the east side of
the building. Natural gamma logs taken in direct push boreholes were used to identify clay lenses that
might impede the migration of soil gas vapors. Soil gas sampling points were installed just below these
lenses.
The gamma logs were successful in locating the clay lenses that were controlling vapor migration in the
vadose zone. The resulting soil gas survey identified areas of groundwater contamination related to the
septic field that was acting as a source area.

8/17/2019 Geophysical Investigation EPA
http://slidepdf.com/reader/full/geophysical-investigation-epa 131/164
NMSHTD District 1 Headquarters
125
Figure 1: Site Location
SITE INFORMATION
Identifying Information
New Mexico State Highway and Transportation Department (NMSHTD)District 1 Headquarters Underground Storage Tank (UST) Site
2912 East Highway 80
Deming, NM
Background
Physical Description: The NMSHTD District 1 Headquarters Underground Storage Tank (UST)
site is located in Deming, New Mexico in the southwestern part of the state, as shown in Figure 1.
The site covers approximately 15 acres. This investigation was extended
off site to investigate various properties that may have contributed to the
on-site contamination [1].
The site lies within 10 miles of the U.S./Mexico border. The topography
is generally flat with little or no relief across the site. The Mimbres
River is located north of the site and is the only nearby water body [2].
Site Use: The property has been used since 1955 by the NMSHTD for
vehicle maintenance, steam cleaning, and other activities. Figure 2
shows a map of the site and the immediate area. During years of heavy
road building, a materials testing laboratory used 1,1,1-tetrachloroethane (1,1,1-TCA) on a regular
basis for asphalt analyses. Spent solvent was either disposed off site or recycled in an on-site still.
The aggregate used in testing was apparently rinsed with water, and the contaminated water was
regularly rinsed down the drain and into the septic system. This improper disposal of 1,1,1-TCA-contaminated water contributed to the contamination of the site [1, 2, 3, 4].
Release/Investigation History: During a tightness test of underground storage tanks at the
Deming site in July and August 1989, NMSHTD found leaks in underground storage tanks and
petroleum hydrocarbon contamination of subsurface soil. Subsequent investigations confirmed the
presence of gasoline-derived and chlorinated volatile organic compounds (VOCs) in groundwater at
concentrations in excess of New Mexico Water Quality Control Commission health standards [1,
3, 4].
In June 1996, Daniel B. Stephens & Associates (DBS&A) conducted a shallow soil gas survey
using passive soil gas samplers to detect contamination in the vadose zone. The survey was
conducted over an area of known VOC-contaminated groundwater, but the only VOC detected was perchloroethene (PCE). Furthermore, the distribution of PCE was not representative of the
distribution of chlorinated VOCs known to be present in the groundwater beneath the site. The
investigators from DBS&A believed that the local geology affected the movement of contaminant
vapors beneath the site, possibly preventing the shallow samplers from registering chemicals
known to be present in groundwater approximately 100 feet below ground surface (bgs) [1, 3].

8/17/2019 Geophysical Investigation EPA
http://slidepdf.com/reader/full/geophysical-investigation-epa 132/164
SITE INFORMATIONNMSHTD District 1 Headquarters
126
Figure 2: NMSHTD District 1 Headquarters Site [3]
Regulatory Context: New Mexico UST Regulations and New Mexico Water Quality Control
Commission standards [1, 3].

8/17/2019 Geophysical Investigation EPA
http://slidepdf.com/reader/full/geophysical-investigation-epa 133/164
SITE INFORMATIONNMSHTD District 1 Headquarters
127
Site Logistics/Contacts
State Lead Agency: NMSHTD
Federal Oversight Agency: Not applicable
Remedial Project Manager:
Richard Meixner
Daniel B. Stephens and Associates, Inc.
Albuquerque, NM 87176
505-822-9400
Site Contact:
Phil Ramos
New Mexico Highway and Transportation
DepartmentAlbuquerque, NM 87176
505-827-5528
Geophysical Subcontractors:
David Hyndman
Sunbelt Geophysics
P.O. Box 36404
Albuquerque, NM 87176
505-266-8717
James Viellenave
TEG Rocky Mountain
400 Corporate Circle, Suite R
Golden, CO 80401
303-278-0104
MEDIA AND CONTAMINANTS
Matrix Identification [3]
Type of Matrix Sampled and Analyzed: Subsurface clays, sands, and gravels.
Site Geology/Stratigraphy [3, 4, 5]
Regional geology in the area of the site consists of Quaternary alluvium underlain by Cretaceous
Mesa Verde and Mancos shale. In some areas the eroded materials have been reworked by local
streams. The local stratigraphy consists of deposits typical of an arid zone basin that has been
filled in by erosion of materials from the surrounding uplands. Locally interlayered sandy clay and
clayey sand are present with some gravel. A thick gravel layer was present at depths between eight
and 15 feet bgs. Some confining layers are present that may influence the migration of
contaminant vapors. Depth to groundwater is 100 to 150 feet bgs.
Contaminant Characterization [1, 3]
Primary Contaminant Groups: The primary contaminants of concern include trichloroethene
(TCE), perchloroethene (PCE), 1,1-dichloroethene (1,1-DCE), and 1,1,1-dichloroethane (1,1,1-DCA). A combination of benzene, toluene, ethylbenzene, and xylene (BTEX) was also present but
was not addressed in the investigation described here. The most frequently detected chlorinated
VOC in soil gas was 1,1-DCE.

8/17/2019 Geophysical Investigation EPA
http://slidepdf.com/reader/full/geophysical-investigation-epa 134/164
MEDIA AND CONTAMINANTSNMSHTD District 1 Headquarters
128
Matrix Characteristics Affecting Characterization Cost or Performance
The magnetometry survey was affected in three areas by the presence of sources of magnetic
interference, such as fences, buildings, etc, to the degree that the survey in those areas was replaced
by an electromagnetic survey [3].
The natural gamma detector used at the Deming site was found to be sensitive to temperature
change. After it was lowered into the hole, the field team allowed it to equilibrate to the lower
subsurface temperature before recording the counts of natural gamma radiation. Later models of
the detector are designed to be impervious to temperature differences and has been used in 100EF
temperatures [3, 6]. The detector is impervious to humidity and water. It functions in
groundwater and has been used in the rain and snow [5].
Certain geologic materials, such as granite-derived cobbles and gravel in conglomeratic deposits,
organic rich deposits, and phosphate and potash (K 2CO3) deposits, have low natural gammaradiation levels, and natural gamma logging may be insufficient to distinguish layers composed of
these materials. However, these materials were not present in the alluvial deposits examined at this
site [3, 5, 6].
The presence of a gravel layer between eight and 15 feet bgs and a tendency of the deeper materials
to collapse when the probe was advanced led the investigators to conduct the gamma logging inside
of the drive rods [3].
GEOPHYSICAL INVESTIGATION PROCESS
Investigation Goals [1, 3]
The overall goal of this environmental investigation was to identify and characterize the source of
chlorinated VOC contamination in groundwater beneath the NMSHTD site. The goal of the
magnetic and electromagnetic survey was to locate buried materials that might be potential sources
of contamination. The goal of the gamma log survey was to guide the vertical placement of the soil
vapor sampling points.
Geophysical Methods
A reconnaissance survey was performed over the study area using magnetometry and
electromagnetics (EM). The magnetometry survey was carried out using a Geometrics G-858
cesium magnetometer. Magnetic data were acquired every two feet along parallel traversesseparated by 10-foot intervals. The EM data were acquired using a Geonics EM-61 high precision
metal locator every 0.6 feet along parallel traverses separated by five-foot intervals.
Natural gamma data were gathered using a Mt. Sopris Slim Line prototype instrument with a
sodium iodide detector to measure the impinging natural gamma radiation. (A commercial version

8/17/2019 Geophysical Investigation EPA
http://slidepdf.com/reader/full/geophysical-investigation-epa 135/164
GEOPHYSICAL INVESTIGATION PROCESSNMSHTD District 1 Headquarters
129
Figure 3 - Typical Gamma Log [7]
of this instrument has been developed since the date
of this investigation [9]). The detector was 0.75
inches by 24 inches in size, and was attached to a
200 foot cable. An MGX data logger was connected
to the cable. Gamma logging is useful in borings
ranging from one to six inches in diameter [1, 3, 6].
Natural gamma logging is the physical measurement
of the release of natural gamma radiation from the
soil and rocks surrounding a borehole. Natural
gamma logging is based on the principle that more
intense natural gamma radiation is emitted from clay-
rich formations, which are usually higher in naturally
radioactive elements, than clay-poor formations.
Most natural gamma radiation occurs in clayscontaining thorium, uranium, or potassium 40.
Figure 3 shows a typical natural gamma log for some
consolidated sedimentary deposits. Note the higher
counts for clay-rich units like shale, particularly
marine shale, and bentonite.
Natural gamma measurement begins with the lowering of the detector to the bottom of a hole,
allowing it to equilibrate to the different subsurface temperature, and then reeling the detector up
the hole at a steady rate of between five and 10 feet per minute (allowing the logging of a 50-foot
hole in five to 10 minutes). The level of gamma radiation being emitted by a particular stratum is
measured in counts per second (cps). Interpretation of the gamma log depends as much on the
absolute value of the gamma counts as it does on the rate of change in gamma counts as thedetector passes from one material to the next. Statistical variations in gamma emissions,
significant at low counting rates, are smoothed out by integration over a short time interval. If the
hole is logged too quickly, however, the smoothing effect leads to erroneous results by shifting the
peaks in the direction of logging. The lower left-hand portion of Figure 3 illustrates the result of
logging too fast [8].
Multiport soil gas wells were installed at depths between 20 and 60 feet bgs using direct
push/hammer (Strataprobe®) technology. The Strataprobe® unit consisted of a dual ram with a
hydraulic hammer vibrating component capable of producing a high-frequency impact with an
8,000 pound static reaction weight and more than 35,000 pounds of pullback capacity. The truck-
mounted hydraulic percussion hammer unit was used to advance 1.75-inch outer diameter rodswith an expendable 2-inch diameter tip into the subsurface until downward progress ceased due to
refusal [1, 3].
After refusal, the rods were disconnected at the surface in order to conduct a subsurface natural
gamma profile in the borehole to depths of approximately 50 feet bgs. The probe was pushed to

8/17/2019 Geophysical Investigation EPA
http://slidepdf.com/reader/full/geophysical-investigation-epa 136/164
GEOPHYSICAL INVESTIGATION PROCESSNMSHTD District 1 Headquarters
130
total depth (averaging 50 feet), and the gamma logging was conducted from inside the pipe.
Permanent vapor sampling points were installed as the pipe was withdrawn [1, 3, 6].
GEOPHYSICAL FINDINGS
Technology Calibration [1, 3]
No calibration of the magnetometer or the EM detector were performed, as this is not general
practice.
To calibrate the natural gamma log readings for the Deming site, gamma logs were taken in three
existing monitoring wells: MW-102, MW-109, and MW-111. The gamma readings were
correlated with the lithology and stratigraphy that had been previously described for these wells.
Figures 4 through 6 show the lithologic logs for these wells on the left and the corresponding
gamma log on the right.
An examination of the logs revealed an acceptable level of correlation. In each of the gamma logs,
the presence of a near-surface layer of silty clay was indicated by an increase in the gamma counts
as the detector passed through that material. The individual logs, however, did show a difference
in the absolute values of gamma counts for this layer, as gamma counts rose to levels of 115 to 135
cps in MW-109 and MW-111, and to levels of approximately 275 cps in MW-102. The difference
in the absolute level of gamma counts probably indicated that the silty layer in MW-109 and MW-
111 contained a smaller proportion of coarser materials than it did in MW-102. The near-surface
silty layer was present in each of the lithologic logs.
The layer of coarse gravel that was identified in the monitoring well logs at depths ranging from
eight to 15 feet bgs can be seen in each of the calibration logs as both a small decline in absolute
gamma counts to levels of less than 100 cps and as an increase in the distance from peak to peak in
the log. Again, there appears to be a higher proportion of silty materials mixed with the gravel in
the log for MW-102, as evidenced by the higher gamma counts for similar materials shown in that
log than in the other two gamma logs.
The layer of silty materials present in the lithologic log for MW-109 and MW-111 at
approximately 25 feet bgs is identifiable in the gamma logs for those wells. The grading from
coarser sand materials into a silty clay can be seen as the gamma count rises above 100 cps. That
silty layer was not present in the lithologic log for MW-102, and no indication of such a layer can
be seen in the gamma log for that well.
The next interval in the lithologic logs is composed of predominantly sandy materials, although the
size of the interval varies across the three wells. In MW-102, this interval extends to an
approximate depth of 40 feet bgs, and the gamma log for that well shows small variations in
gamma counts which remain in the 150 to 225 cps range. In MW-109, the sandy layer extends
deeper to an approximate depth of 48 to 50 feet bgs. This layer can be seen in the gamma log for
MW-109 as an interval over which the gamma counts remain largely within a narrow range

8/17/2019 Geophysical Investigation EPA
http://slidepdf.com/reader/full/geophysical-investigation-epa 137/164
GEOPHYSICAL FINDINGSNMSHTD District 1 Headquarters
131
between 63 and 75 cps. The interval between 25 and 55 feet bgs in MW-111 is largely composed
of sand with gamma counts varying between 50 and 100 cps. This interval is interrupted at a
depth of approximately 38 feet bgs by a sandy clay material that can be seen in the gamma log as
gamma counts rise to approximately 125 cps.
The lithology of these wells over the remaining interval is significantly different. The lithology of
MW-102 below 40 feet bgs grades from sandy silt to sandy gravel and back to sandy silt at a depth
of 84 feet bgs. The short interval of sandy gravel, shown on the lithologic log from 65 to 75 feet
bgs, can be seen in the gamma log as a lower set of gamma counts beginning at approximately 68
feet bgs and extending to 78 feet bgs. The lithologic log shows a gradual coarsening of materials
below a depth of 50 feet bgs in MW-109 to a depth of 78 feet bgs. The gamma log for this well,
instead, shows a similar coarsening over the interval from 50 feet bgs to 60 feet bgs as the gamma
counts gradually decline. From 60 feet bgs to a depth of approximately 75 feet bgs there appears
to be a gradual increase in gamma counts. Such an increase may only indicate the presence of silty
materials mixed in with the sand that are not readily evident in a visual inspection of the samematerials.
Overall, there appears to be an adequate correlation between the lithologic logs and the gamma
logs for the three monitoring wells for successful calibration. In addition, the gamma logs reveal
the presence of fine-grain materials when the same materials are not noted in the lithologic logs.
This may be due to the fact that the lithologic logs were developed for another use and were used
here as a matter of convenience, or that gamma readings provide a more sensitive measure of
subtle changes in stratigraphic units than can be achieved with a visual inspection.
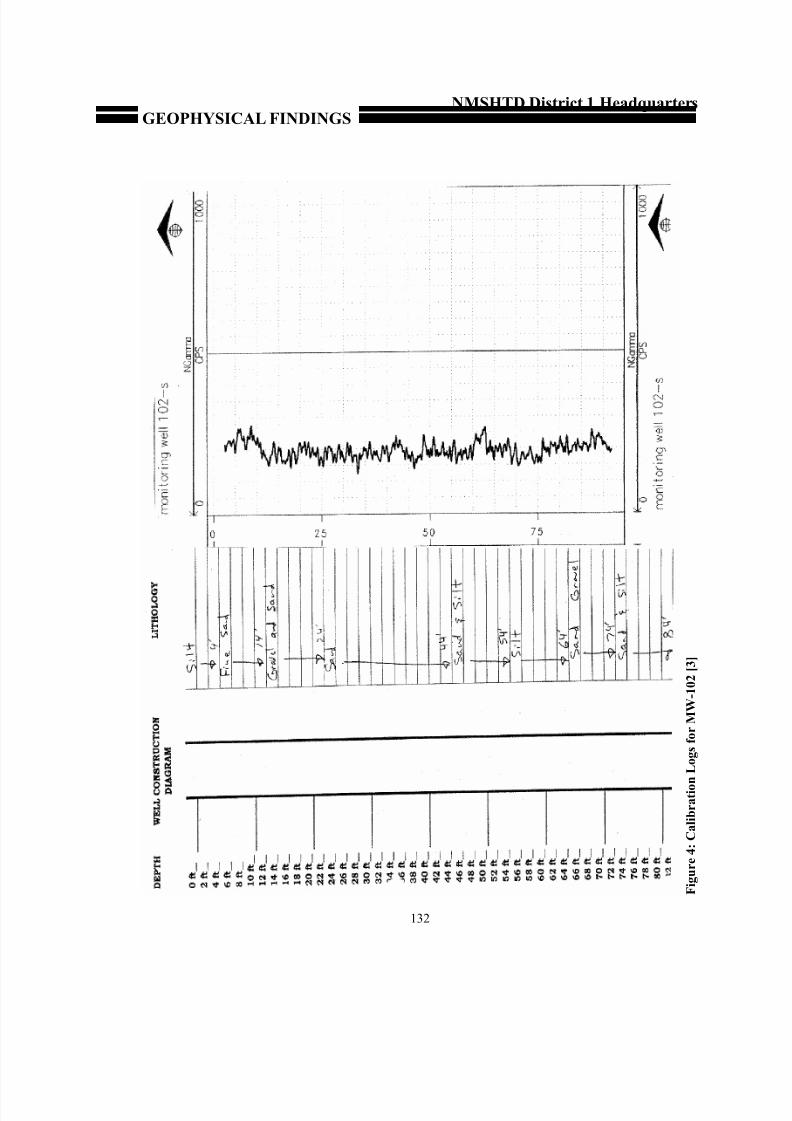
8/17/2019 Geophysical Investigation EPA
http://slidepdf.com/reader/full/geophysical-investigation-epa 138/164
GEOPHYSICAL FINDINGSNMSHTD District 1 Headquarters
132
F i g u r e 4 : C a l i b r a t i o n L o g s f o r M W - 1 0 2 [ 3 ]

8/17/2019 Geophysical Investigation EPA
http://slidepdf.com/reader/full/geophysical-investigation-epa 139/164
GEOPHYSICAL FINDINGSNMSHTD District 1 Headquarters
133
F i g u r e 5 : C a l i b r a t i o n L o g f o r M W - 1 0 9 [ 3 ]

8/17/2019 Geophysical Investigation EPA
http://slidepdf.com/reader/full/geophysical-investigation-epa 140/164
GEOPHYSICAL FINDINGSNMSHTD District 1 Headquarters
134
F i g u r e 6 : C a l i b r a t i o n L o g f o r M W - 1 1 1 [ 3 ]

8/17/2019 Geophysical Investigation EPA
http://slidepdf.com/reader/full/geophysical-investigation-epa 141/164
GEOPHYSICAL FINDINGSNMSHTD District 1 Headquarters
135
Investigation Results [3]
The reconnaissance survey was conducted over a 25-acre area from July 7 to July 22, 1997. The
survey identified numerous areas of buried materials, but only two were of interest. A septic tank
was identified to the southeast of the building that had housed the materials testing laboratory.
Also identified was another area located approximately 75 feet to the north of the septic tank on the
east side of the building. The latter area was described as a concentration of buried metal
materials of unknown origin.
The gamma logging and the installation of the soil gas wells occurred between July 8 and July 25,
1997. The installation of the soil gas wells began in the southern part of the Deming site near
the septic tank and the area of buried materials to the north in order to determine whether
chlorinated VOCs were present in the vadose zone. The area over which vapor sampling points
would be placed was based on the results of the reconnaissance survey. The vertical placement of
vapor sampling points was based on the field reading of geologic units as indicated by naturalgamma logs. Specifically, the gamma logs were used to find permeable layers positioned below
impermeable layers. This geologic setting forms a migration pathway for contaminant vapors, and
the characterization of migration pathways is an important step in contaminant detection.
An examination of the gamma logs from several holes revealed the presence of a series of fairly
consistent layers of sandy clay or similar material beginning at about 15 to 22 feet bgs (just below
the gravel), 27 to 32 feet bgs, and finally at 38 to 50 feet bgs, particularly in those wells near the
septic system. Beneath each of these layers the subsurface materials tended to grade into coarser,
sandy materials. The gamma log signature was reviewed in the field, and from this information
certain intervals were selected for the installation of gas points. A more permeable sampling
interval (identified by lower gamma counts) was selected for each gas point location. Examples of
three gamma logs indicating the presence of clay layers and the location of vapor sampling points
are shown in Figures 7 through 9.
In Figure 7, the first vapor sampling point was placed in a screened interval between 25 and 30 feet
bgs. At this level, the sampling point was located below the silty material that was present from 20
to 25 feet bgs, shown in the gamma log where the gamma count rises through 124 cps. The silty
materials would impede the upward movement of contaminant vapors. The screen was placed in
the relatively coarser material (located just below the silty material) through which vapors would
be likely to migrate. The second and third screen intervals were similarly located in coarser
materials located just below a less permeable layer, indicated in the gamma log by sharp increases
in gamma counts.
In Figure 8, the first sampling point is located just below the thin silty layer encountered at a depth
of approximately 21 feet bgs. At this depth, it appears that there is an interval of approximately 19
feet of coarse sandy material, and the screen was positioned at the top of this interval. The second
sampling point was located in a screened interval between 38 and 43 feet bgs. At this depth, the
screen is located toward the bottom of a layer of coarse materials that extends from 31 to 47 feet
bgs. The silty layer that would be expected to impede the migration of contaminant vapors is at

8/17/2019 Geophysical Investigation EPA
http://slidepdf.com/reader/full/geophysical-investigation-epa 142/164
GEOPHYSICAL FINDINGSNMSHTD District 1 Headquarters
136
least eight feet above the top of the screened interval. The third sampling point is located in a
screened interval between 55 and 60 feet bgs. In this position, the sampling point is located
directly below the silty material that can be see at a depth of 53 feet bgs, where the gamma counts
rise sharply to nearly 90 cps.
Figure 9 shows the gamma log for SG09, in which only two vapor sampling points were placed.
The first point was located in a screened interval between 21 and 24 feet bgs. At this depth, the
sampling point was located directly below the silty layer seen at 21 feet where the gamma counts
peak at approximately 70 cps. The lower sampling point was placed in a screened interval
between 46 and 55 feet bgs. This screen was placed more to take advantage of the coarse
materials located in that interval than to use a distinct impermeable layer located directly above.
The coarsing of the materials in this interval can provide a migration pathway for contaminant
vapors.

8/17/2019 Geophysical Investigation EPA
http://slidepdf.com/reader/full/geophysical-investigation-epa 143/164

8/17/2019 Geophysical Investigation EPA
http://slidepdf.com/reader/full/geophysical-investigation-epa 144/164
GEOPHYSICAL FINDINGSNMSHTD District 1 Headquarters
138
Figure 8: Vapor Sampling Points in SG08 [3]

8/17/2019 Geophysical Investigation EPA
http://slidepdf.com/reader/full/geophysical-investigation-epa 145/164
GEOPHYSICAL FINDINGSNMSHTD District 1 Headquarters
139
Figure 9: Vapor Sampling Points in SG09 [3]

8/17/2019 Geophysical Investigation EPA
http://slidepdf.com/reader/full/geophysical-investigation-epa 146/164
GEOPHYSICAL FINDINGSNMSHTD District 1 Headquarters
140
Results Validation [1, 3]
No additional activities were conducted to validate the findings of the natural gamma logging. The
results of the soil gas sampling conducted after the installation of the permanent sampling points
served as an indirect validation. The distribution of VOC contamination that was revealed was
representative of previous sampling, and was centered around the two source areas that had been
identified by the reconnaissance survey.
LESSONS LEARNED
There were several important lessons learned during the Deming investigation. These are discussed
below.
C Natural gamma readings should be calibrated to the site stratigraphy using site-specific
knowledge of local geology. The use of lithologic logs from existing wells can save thetime and effort that would be expended if the logs had to be generated during the same
investigation.
C Natural gamma logs appear to be more sensitive to subtle changes in stratigraphy than is
the visual inspection of lithologic logs, which often is based on the personal interpretation
of the geologist.
C The natural gamma logs were used successfully to make well point placement decisions in
the field at the time when the sampling points were being installed. In less dynamic
investigations, well point placement decisions might be delayed rather than made in the
field, potentially resulting in delays in the investigation.
C Because the natural gamma signature does not degrade or decay over time, this
information is representative for present and future investigations as well. The same
information that was used to guide sampling point locations can be used at a later date to
guide the installation of screening intervals for a soil vapor extraction system.
C Gamma logs are a useful tool for identifying interbedded impermeable layers that may be
thin and difficult to locate. This tool can be used to guide the placement of subsurface
sampling points, or screening intervals for soil vapor extraction or pump and treat systems
in geologically heterogenous materials.

8/17/2019 Geophysical Investigation EPA
http://slidepdf.com/reader/full/geophysical-investigation-epa 147/164
NMSHTD District 1 Headquarters
141
REFERENCES
1. Meixner, Richard, et al. Combination of Downhole Gamma Logging and Soil Vapor
Measurements to Track Low Level Chlorinated Solvent Contamination in the Deep
Vadose Zone. Proceedings of the Symposium on the Application of Geophysics toEngineering and Environmental Problems (SAGEEP 1998) pp. 369-378.
2. Personal communication with Phil Ramos, New Mexico State Highway Transportation
Department. September 24, 1998.
3. Daniel B. Stephens & Associates, Inc. Deming Surface Geophysical Survey and
Multiport Soil Gas Well Installation and Sampling . September 12, 1997.
4. Personal communication with Richard Meixner, Daniel B. Stephens & Associates, Inc.
September 8, 1998.
5. L.W. LeRoy, editor. Subsurface Geology. Colorado School of Mines, Golden, CO.
1977.
6. Personal communication with Jim Viellenave, TEG Rocky Mountain, Inc. September 17,
1998.
7. Telford, W.M., et al. Applied Geophysics. Cambridge University Press. Cambridge,
GB. 1984.
8. Personal communication with Jim Viellenave, TEG Rocky Mountain, Inc. September 11,
1998.
9. Personal communication with Jim Viellenave, TEG Rocky Mountain, Inc. September 15,
1998.

8/17/2019 Geophysical Investigation EPA
http://slidepdf.com/reader/full/geophysical-investigation-epa 148/164
142
PAGE LEFT BLANK INTENTIONALLY

8/17/2019 Geophysical Investigation EPA
http://slidepdf.com/reader/full/geophysical-investigation-epa 149/164
Tinker Air Force Base
143
Case Study Abstract
Tinker Air Force Base
Oklahoma City, OK
Site Name and Location:
Tinker Air Force BaseGeophysical Technologies:
Electromagnetics
Seismic reflection
Seismic Modeling
RCRA Permit #
1571724391
Period of Site Operation:
1942 - present
Operable Unit:
Not applicable
Current Site Activities:
Portions of the base are undergoing
investigation and remediation under the
Installation Restoration Program
Point of Contact:
Sara Sayler
OC-ALC/EMR
7701 Arnold Street, Suite 221
Tinker Air Force BaseTinker, OK 73145-9100
405-734-3058
Geological Setting:
Permian-age sedimentary rocks
overlain by Quaternary alluvium, sand
dunes, and terrace deposits
Technology Demonstrator:
IT Corporation
312 Directors Drive
Knoxville, TN 37923-4799
Phone - 423-690-3211Fax - 423-690-3626
Purpose of Investigation:
To help identify and map possible conduits for preferential groundwater flow in the shallow subsurface. The site-specific
decision being supported was to obtain additional information in planning the optimal placement of the installation of
groundwater recovery wells.
Number of Images/Profiles Generated During Investigation:
17,510 linear feet of seismic profiles collected along 8 survey lines. This case study focuses on the modeled and interpreted
compressional (p-wave) results from a portion of Line 4 and an intersecting portion of Line 5. These lines were selected to
represent typical site data and anomalies. This intersection is also the location of an interpreted sand channel near the
intersection of the two lines, making it easier to demonstrate the continuity of the interpreted sand channel.
Results:
Interpretation of the seismic data indicates several places where sand channels cut into the Upper Saturated Zone/Lower
Saturated Zone (USZ/LSZ) aquitard. The seismic reflection survey results will be used to recommend the placement of
Phase II recovery well drilling locations. The results of Phase I groundwater recovery well yield tests indicated good
correlation with several of the seismic anomalies identified in the target zones by the seismic survey. Seismic modeling was
conducted to provide support for the interpretation of the seismic results. A EM-31 terrain conductivity survey was
conducted along the eight seismic lines to screen for large scale anomalies caused by metallic objects that might interfere
with the seismic survey. Most of the anomalies were due to surface metal, such as the chain-link fences, nearby structures,
and monitoring well monuments.

8/17/2019 Geophysical Investigation EPA
http://slidepdf.com/reader/full/geophysical-investigation-epa 150/164
Tinker Air Force Base
144
EXECUTIVE SUMMARY
Tinker AFB covers 4,277 acres and is located on the southeast edge of the Oklahoma City metropolitan
area. The base is situated within the North Canadian River drainage basin and drains into the Crutcho and
Soldier Creeks and overlies a complex aquifer system that includes the Garber-Wellington Formation. TheSouthwest Quadrant Stabilization System (SQSS) Area is the location of two landfills that were used
sporadically for disposal over a forty-year span from the 1940s to the late 1960s for disposal of sanitary
and industrial wastes, including paints and solvents.
Near-surface geology at Tinker AFB consists of clays and clayey silts that are interbedded with thin, clayey
sand layers, reaching a maximum thickness of approximately 60 feet in the western and southwestern parts
of the base. The deeper geology is comprised of mostly unconsolidated materials, which are composed of
predominantly fine-grained sandstone, with lesser amounts of siltstone and shale. Bedrock formations dip
to the southwest by approximately 0.5 degrees, or by 40 to 50 feet per mile. Groundwater occurs at the
site in four water-bearing units, but only the surficial unit was the target for this study. Groundwater can
occur at depths as shallow as 20 feet, but public water supplies are drawn from depths of greater than 400
feet.
The purpose of the seismic survey was to locate permeable layers in the subsurface that might indicate
preferential pathways for groundwater flow. This information is being used to site new extraction wells for
the groundwater pump and treat system. Seismic methods were chosen as a cost-effective method for
gathering information on the subsurface stratigraphy. The geology of the area is highly complex and other
investigative methods, such as soil borings, would have yielded less information at a higher cost.
Two geophysical methods were used during this investigation: electromagnetic (EM) reconnaissance
survey, and a seismic survey. The EM survey was conducted to screen for subsurface conditions that
might cause interference in the seismic data collection. The seismic survey was conducted to identify
conductive layers in the subsurface that might be paths for groundwater migration. Seismic modeling was
conducted to provide analytical support for the interpretation of the seismic results.
The seismic survey revealed the presence of sand channels that were incised into the uppermost aquitard
and sand lenses located within that aquitard. Seismic modeling significantly improved the investigator’s
understanding of the seismic anomalies that were found by providing an analytical benchmark against
which to compare the seismic results. Strong correlation was found between the location of significant
seismic anomalies and known groundwater flow pathways.
The target structures were relatively shallow and groundroll effects were not a significant source of
interference. Poor surface conditions and cultural sources did, however, posed difficulties to data
collection. Several seismic data processing techniques, such as refraction statics, spectral whitening, and
mute analysis, significantly reduced the level of interference in the data and allowed for increased frequency andresolution of the seismic results.

8/17/2019 Geophysical Investigation EPA
http://slidepdf.com/reader/full/geophysical-investigation-epa 151/164
Tinker Air Force Base
145
Figure 1: Site Location
SITE INFORMATION
Identifying Information
Tinker Air Force Base (AFB)Oklahoma City, OK RCRA Permit # 1571724391
Southwest Quadrant SMU
Background [1, 2]
Physical Description: Tinker AFB covers 4,277 acres and is located on the southeast edge of the
Oklahoma City metropolitan area (see Figure 1). The base is bordered by Sooner Road to the west,
Douglas Boulevard to the east, interstate highway I-40 to the north, and SE 79th street to the south
The base is situated within the North Canadian River drainage basin and drains into the Crutcho
and Soldier Creeks. The base overlies a complex aquifer system that includes the
Garber-Wellington Formation .
The topology of the seismic study area, located in the
southwest portion of the base, is characterized by
nearly level plains to gently rolling hills, with surface
elevations ranging from 1,240 to 1,270 feet above
mean sea level. The surface consists of alluvial soils
near streams and flood plains, and residual soils
resulting from weathered bedrock [1].
Site Use: The Southwest Quadrant Stabilization
System (SQSS) Area is the location of two landfills
that were used sporadically for disposal over a forty-year span from the 1940s to the late 1960s.
Landfill #2 was used during the 1940s and 1950s for disposal of sanitary and industrial wastes,
including paints and solvents. Landfill #4 was used from 1961 to 1968 for the disposal of
drummed solvents, and sludges from petroleum and solvent storage tanks.
Release/Investigation History: On-site disposal of industrial wastes occurred from 1942 until
1979 when off-site disposal became the standard disposal practice. Organic solvents, including
trichloroethylene (TCE), tetrachloroethylene, and l,2-dichloroethylene, were used for degreasing
and aircraft maintenance. In the past, waste oils, solvents, paint sludges, and plating waste
generated from maintenance activities were disposed in Industrial Waste Pits Numbers 1 and 2,
located about l mile south of Soldier Creek and Building 3001. In 1997, a groundwater treatment
system was installed to treat contaminated groundwater.
Regulatory Context: Actions at this site are being undertaken in compliance with Federal and
State regulations under the Resource Conservation and Recovery Act (RCRA).
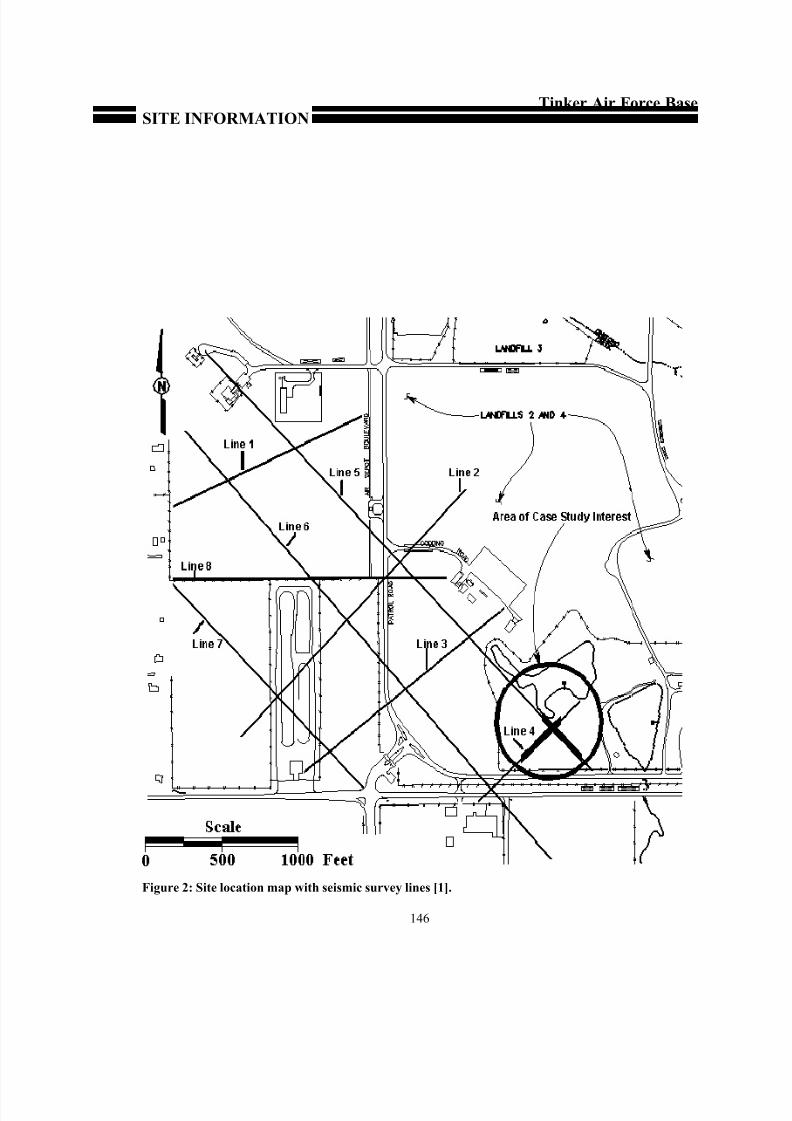
8/17/2019 Geophysical Investigation EPA
http://slidepdf.com/reader/full/geophysical-investigation-epa 152/164
SITE INFORMATIONTinker Air Force Base
146
Figure 2: Site location map with seismic survey lines [1].

8/17/2019 Geophysical Investigation EPA
http://slidepdf.com/reader/full/geophysical-investigation-epa 153/164
SITE INFORMATIONTinker Air Force Base
147
Site Logistics/Contacts
Federal Lead Agency:
United States Air Force
Federal Oversight Agency:
Environmental Protection Agency
Site Contact:
Sara Sayler
OC-ALC/EMR
7701 Arnold Street, Suite 221
Tinker Air Force Base
Tinker, OK 73145-9100
Remedial Project Manager:
Ruby Williams
EPA Region 6
214-665-6733
1445 Ross Avenue Suite # 1200
Dallas, TX 75202-2733
Geophysical Subcontractor:
IT Corporation
312 Directors Drive
Knoxville, TN 37923-4799
423-690-3211
MEDIA AND CONTAMINANTS
Matrix Identification
Type of Matrix Sampled and Analyzed: Subsurface soil/Bedrock
Site Geology/Stratigraphy
Near-surface geology at Tinker AFB consists of the Permian-age Hennessey Group and theGarber-Wellington Formation. The Hennessey Group is composed of clays and clayey silts that
are interbedded with thin, clayey sand layers, reaching a maximum thickness of approximately 60
feet in the western and southwestern parts of the base. The Hennessey Group is underlain by the
mostly unconsolidated materials of the Garber Formation, which are composed of predominantly
fine-grained sandstone, with lesser amounts of siltstone and shale. The deeper Wellington
Formation has a similar lithology to the Garber Formation, and together the two comprise the
1,000-foot thick Garber-Wellington Formation. Bedrock formations dip to the southwest by
approximately 0.5 degrees, or by 40 to 50 feet per mile.
Groundwater occurs at the site in four water-bearing units, that include the Hennessey Water
Bearing Zone (HWBZ), the Upper Saturated Zone (USZ), the Lower Saturated Zone (LSZ), and
the Producing Zone (PZ). The HWBZ consists of fine-grained sediments with very lowtransmissivity and large vertical hydraulic gradients. Beneath the HWBZ, the USZ is the
uppermost waterbearing zone of the Garber-Wellington aquifer. The USZ is made up of
permeable sand channels and lenses. It is generally believed that the HWBZ and the USZ are not
hydraulically connected. The USZ/LSZ aquitard is comprised of overlapping clay layers with
interbedded thin sand lenses and is not of uniform thickness. The aquitard ranges in thickness from

8/17/2019 Geophysical Investigation EPA
http://slidepdf.com/reader/full/geophysical-investigation-epa 154/164
MEDIA AND CONTAMINANTSTinker Air Force Base
148
less than 10 feet to more than 25 feet, with the base of the aquitard occurring at a depth of
approximately 110 feet below ground surface (bgs) in the southwest portion of the study area. The
LSZ ranges between 140 and 200 feet in thickness, and is separated from the underlying PZ by the
30- to 100-foot-thick LSZ-PZ aquitard. The PZ extends from between 210 and 280 feet bgs to
more than 1,000 feet bgs, and is used as the primary source of groundwater on the base and
elsewhere in the Oklahoma City area. Groundwater can occur at depths as shallow as 20 feet, but
public water supplies are drawn from depths of greater than 400 feet.
Contaminant Characterization
Primary Contaminant Groups: Volatile organics such as TCE.
Matrix Characteristics Affecting Characterization Cost or Performance [1, 2]
Certain subsurface structures, such as utilities and buried metallic objects, can cause interference,or noise, in the seismic data. To screen for such structures, frequency-domain electromagnetic
(EM) data were acquired along the seismic lines. No significant sources of subsurface interference
were found.
Significant interference with the seismic data collection was caused by muddy surface conditions
and standing water along portions of the survey lines, particularly along Line 8. The seismic
energy was significantly attenuated as it passed through the saturated soils, resulting in poor
seismic data quality along those lines. Other surficial sources of interference included cultural
noises, such as pumps, vehicles, wind and aircraft.
Groundroll can cause interference in data collection and interpretation. Groundroll is caused by
seismic waves that travel horizontally toward the geophone sometimes obscuring the collection of
seismic waves originating from deeper structures. During the investigation at Tinker AFB, the the
high velocity surface materials reduced interference from the slow groundroll and the targets of
principal interest were shallow and mostly located outside of the groundroll noise cone.
GEOPHYSICAL INVESTIGATION PROCESS
Investigation Goals [2, 3]
To help identify and map permeable materials in the USZ and the USZ/LSZ aquitard that might
indicate preferential groundwater flow in the shallow subsurface. This information was used to
place extraction wells to optimize the groundwater extraction system. The primary target of interest was near-surface sand channels and lenses within the USZ aquifer and the USZ/LSZ
aquitard which may form preferential flow channels in the subsurface [2].

8/17/2019 Geophysical Investigation EPA
http://slidepdf.com/reader/full/geophysical-investigation-epa 155/164
GEOPHYSICAL INVESTIGATION PROCESSTinker Air Force Base
149
Geophysical Methods [1, 2]
Two geophysical methods were used during this investigation: electromagnetic (EM)
reconnaissance survey, and a seismic survey. The EM survey was conducted to screen for
subsurface conditions that might cause interference in the seismic data collection. The seismic
survey was conducted to identify conductive layers in the subsurface that might be paths for
groundwater migration.
The EM survey was performed to detect sources of potential interference to seismic data collection.
The EM survey sought to identify variations in the electrical conductivity of subsurface materials
that might be caused by buried objects, conductive fluids, or geologic discontinuities. By
artificially applying a known electromagnetic field to the ground surface by means of a transmitter,
investigators measure the presence of disruptions to the known electromagnetic field with a
receiver. These disruptions, termed EM anomalies, can result from either geological changes or the
presence of metallic objects, such as pipes, drums, cables, tanks, etc., in the subsurface. The EMsurvey conducted at Tinker AFB was used to identify buried materials that might interfere with
seismic survey by scattering or attenuating seismic waves. A Geonics Limited EM-31 terrain
conductivity meter coupled to an Omnidata DL720 digital data logger was used to collect
quadrature-phase and in-phase component data along the length of each seismic line in the survey
area.
The seismic reflection method was used to collect seismic data in the subsurface with which
permeable layers in the subsurface can be identified. These permeable layers may act as
groundwater migration pathways, and may be good locations for future extraction wells. In a
seismic reflection survey, an artificial seismic source is used to create an acoustic wave that
propagates downward through the soil layers. When the wave reaches a soil layer whose seismic
conductivity is significantly different from that of the overlying soils, a portion of the wave is re-
directed to the surface. A geophone, or electromechanical transducer, is used at the surface to
receive the reflected wave energy. Subsurface stratigraphy is then mapped by measuring the travel
time necessary for a wave to pass through one layer to another, refract along the interface, and
return to the geophones at the surface. Seismic field equipment used to conduct the survey
consisted of three 48-channel Geometrics Strataview® seismographs in a master-slave
configuration, totaling 144 channels. Single, 40-Hz vertical geophones were used for collection of
p-wave data.
Seismic modeling was conducted to provide support for the interpretation of the seismic results.
Seismic models were developed to depict the anticipated seismic response of various types of
subsurface stratigraphy that might be encountered in the study area, i.e. sand channels cutting intothe aquitard or sand lenses embedded in a clay layer. Well lithologies and sonic logs acquired in
wells located within the survey area were used to develop estimates of the seismic velocities of the
various soil types found within the study area. These estimates were used to construct hypothetical
seismic models of subsurface structures of varying thickness and composition. When seismic
anomalies were encountered in the survey data, the actual seismic response was compared to the
modeled response of different stratigraphic features to help identify the type of subsurface

8/17/2019 Geophysical Investigation EPA
http://slidepdf.com/reader/full/geophysical-investigation-epa 156/164
GEOPHYSICAL INVESTIGATION PROCESSTinker Air Force Base
150
stratigraphy that might create such an anomalous response. The use of seismic models greatly
aided investigators in their interpretation of the seismic results by providing a set of benchmarks
against which actual results could be compared [4].
Seismic lines were chosen to satisfy three criteria:
C The survey area should include parallel and perpendicular coverage of a known geologic
strike. The lines within the area were located so that velocity data could be acquired in at
least one well on at least one line of the survey, and each of the lines were to have at least
one tie with another line in the survey.
C The survey area should include areas in which known contaminant plumes were present;
and
C
The survey lines should be placed in areas whose groundwater is under hydraulic controlfrom the groundwater pump and treat system.
Prior to collecting geophysical data, each seismic survey station was geospatially surveyed using a
Global Positioning System (GPS). The ability to geospatially reference the seismic profiles
allowed investigators to understand the relationships between the individual seismic profiles and the
larger site geology. Horizontal and vertical geospatial accuracies were kept within 0.5 feet and 0.1
feet, respectively.
A field test of the seismic parameters was used to evaluate the relative merits of collecting different
types of seismic wave during the survey, and to determine the optimal distance between the seismic
source and the geophones. Data on two types of seismic waves: compressional (p-wave) and
shear(s-wave) wave, were acquired along a short test section of Line 5 to evaluate and compare theresults such surveys would produce at the site. While p-wave data, the seismic wave that is
projected downward, were less complex to collect and interpret, s-wave data often provide a higher
resolution. S-wave data are collected as the seismic energy is transmitted horizontally from the
source to the receiver. Along this test section, p-wave data were recorded using vertical source
impacts and vertical geophones, and s-wave data were recorded using horizontal impacts and
horizontal, s-wave, geophones. Based on the noise tests conducted in the field and the depth of the
target, a 5-foot station and l0-foot shotpoint (energy source) spacing were used for the survey. The
investigators decided that the p-wave data would provide sufficient resolution to identify the
targeted subsurface structures, and, therefore, no additional s-wave data were collected.

8/17/2019 Geophysical Investigation EPA
http://slidepdf.com/reader/full/geophysical-investigation-epa 157/164
Tinker Air Force Base
151
GEOPHYSICAL FINDINGS
Technology Calibration [1, 2]
The calibration needed for a successful seismic survey is to establish the relationship between thedepth of an anomaly in the subsurface and the time it takes a seismic wave to propagate to that
anomaly and return back to the surface. In other words, the seismic time must be “tied” to depth.
To establish this link at Tinker AFB, investigators collected vertical seismic profiles (VSPs) and
sonic logs. The sonic logs were used to construct synthetic seismograms. A synthetic seismogram
is a statistical comparison of seismic velocity, soil density, and depth values used to convert
seismic velocity data into depth.
The VSP data were acquired in two monitoring wells with maximum depths of approximately 150
feet in order to better understand the subsurface velocities. For each profile, a geophone is locked
in a well at regular depth intervals and used to record the energy from a surface source at each
interval. The time lapse recorded between source and receiver is a measure of the time necessary
to go from the surface to the geophone in the well is displayed as a time versus depth graphic.
Data from an existing sonic log in a nearby well was also used to link the seismic time data to
depth. Together, the sonic log and the VSP data, were used to generate a synthetic seismogram.
The seismogram provides a correlated display of seismic velocities, time and known depths to
reflectors. These correlations establish the link between the seismic velocity of certain subsurface
materials and the depths at which those materials were encountered.
Investigation Results [1, 2]
The EM-31 reconnaissance survey was conducted along the eight seismic lines and revealed large-
scale anomalies caused by metallic objects. Most of the anomalies were caused by surface metal,such as the chain-link fences, nearby structures, and monitoring well monuments. Subsurface
anomalies were also identified as subsurface pipelines that cross the area, such as a north-to-south
trending pipe that exists in the western part of the site.
More than 17,000 linear feet of seismic data were collected along eight survey lines and the
resulting profiles identified four reliable locations for future extraction wells. For the purposes of
this case study, however, the discussion presented focuses only on the interpreted and modeled results
from the intersecting portions of Lines 4 and 5, as shown in Figure 2 on page 3. The seismic results along
both lines showed a sand channel near the intersection of the lines, increasing the reliability the
interpreted sand channel and its continuity. None of the EM anomalies, discussed above, were
located within this area [3].
Muddy surface conditions and standing water along portions of the survey lines caused significant
variation in and interference with the quality of the seismic data collected. Two statistical solutions
were applied to improve the quality of the data. Refraction statics, proved most effective in
minimizing the noise in the data. The adjusted data had less variation and improved resolution.

8/17/2019 Geophysical Investigation EPA
http://slidepdf.com/reader/full/geophysical-investigation-epa 158/164
GEOPHYSICAL FINDINGSTinker Air Force Base
152
The seismic reflection survey was conducted along each line using a 5-foot interval between
geophones and a 10-foot shotpoint interval. Data were acquired using a 0.5-millisecond (msec)
sampling rate; the record length was 1,024 msec. As data quality warranted, source impacts per
shotpoint were adjusted along each line.
The seismic profile generated along Line 4 at its intersection with Line 5 is shown in Figure 3. In
this profile, the top of the USZ/LSZ aquitard was interpreted to be at approximately 70-75 feet bgs
(25 msec), and the bottom of the aquitard was interpreted to be at approximately 110-115 feet bgs
(35 to 40 msec). Although only the USZ was targeted for this study, other structures can be seen
in Figure 3, such as the base of the LSZ, where the LSZ/PZ aquitard occurs, at approximately 295
feet bgs (75 msec). One significant anomaly can be seen in this Figure, centered on Station 295,
and is outlined by hash marks. This feature was interpreted to be a large sand channel within the
upper portion of the USZ/LSZ aquitard which is laterally continuous and was considered to be part
of a larger structure that can be seen nearby on the Line 5 section. The channel was presumed to
trend north to northeast, roughly in line with the high-yield B6 and B7 recovery wells. The seismicmodel data indicate that this anomaly could be caused by the presence of a low conductivity
materials (i.e. sand) embedded in higher conductivity materials (i.e. silts and clays). Above this
channel, the seismic data indicate the presence of a low velocity medium, likely a sand within the
USZ aquifer. This channel was suggested as a good location for a future extraction well.
The seismic profile generated along Line 5 at its intersection with Line 4 is shown in Figure 4. The
bottom of the USZ/LSZ aquitard can be seen at a depth of 110-115 feet bgs and a noticeable low
in this area (represented by the dashed line) indicated the presence of materials with similar seismic
velocity incised into the base of the aquifer, and/or the accumulation of slower velocity materials
locally, such as would be expected from a sand channel. Two anomalies appear in the Line 5 data
shown in Figure 4. A broad and subtle anomaly extending between stations 680 and 693 at a depth
of approximately 75-80 feet bgs was interpreted as a small incised sand lens at the bottom of theUSZ aquifer. The feature extending from station 650 to 667 at a depth of 80-90 feet bgs was
interpreted to be part of the same large sand channel that occurs along Line 4.
A seismic interpretation map of the entire survey area with the locations of interpreted channels
and lenses above and within the upper portion of the USZ/LSZ aquitard is shown in Figure 5A.
Several channels were interpreted near the bottom of the USZ/LSZ aquitard, and several deep
channel systems were interpreted within the LSZ (not discussed here). There is a substantial
concentration of interpreted lower aquitard channels in the southern and southeastern portion of the
survey area, and deep channel systems in the central and southeastern portions of the survey area.

8/17/2019 Geophysical Investigation EPA
http://slidepdf.com/reader/full/geophysical-investigation-epa 159/164
GEOPHYSICAL FINDINGSTinker Air Force Base
153
Results Validation [1]
Seismic data indicating areas of high hydraulic conductivity were compared to well yield test
results from the existing Phase I recovery wells which were drilled to an average depth of 80 to 90feet. All of the Phase I wells were drilled in locations based on engineering factors, plume location,
and groundwater flow direction. Wells A8, B3, B6, and B7 were drilled near anomalies identified
by the seismic data discussed in this case study. Figures 5A and 5B show the correlation between
higher yield zones, as determined with pump tests on the Phase I wells, and the locations of the
sand channel identified at the intersection of Lines 4 and 5. On Line 5, anomalies centered on
Station 658 correspond to high yields on the B6 and B7 recovery wells. Another anomaly found
along Line 5 and interpreted as a sand channel, centered on Station 205, corresponds to the high
yield recovery well B3. On Line 6, the anomaly centered near Station 390 corresponds to the high
yield A8 recovery well. Several other interpreted sand channels have not been verified at this time.
These areas present target locations for possible future Phase II recovery wells.
Further validation was provided by sonic logs taken in five of the extraction wells that were located
on or near the seismic survey lines. These helped to confirm reflector identification and also
demonstrated good correlation between the seismic findings and well tests [3].
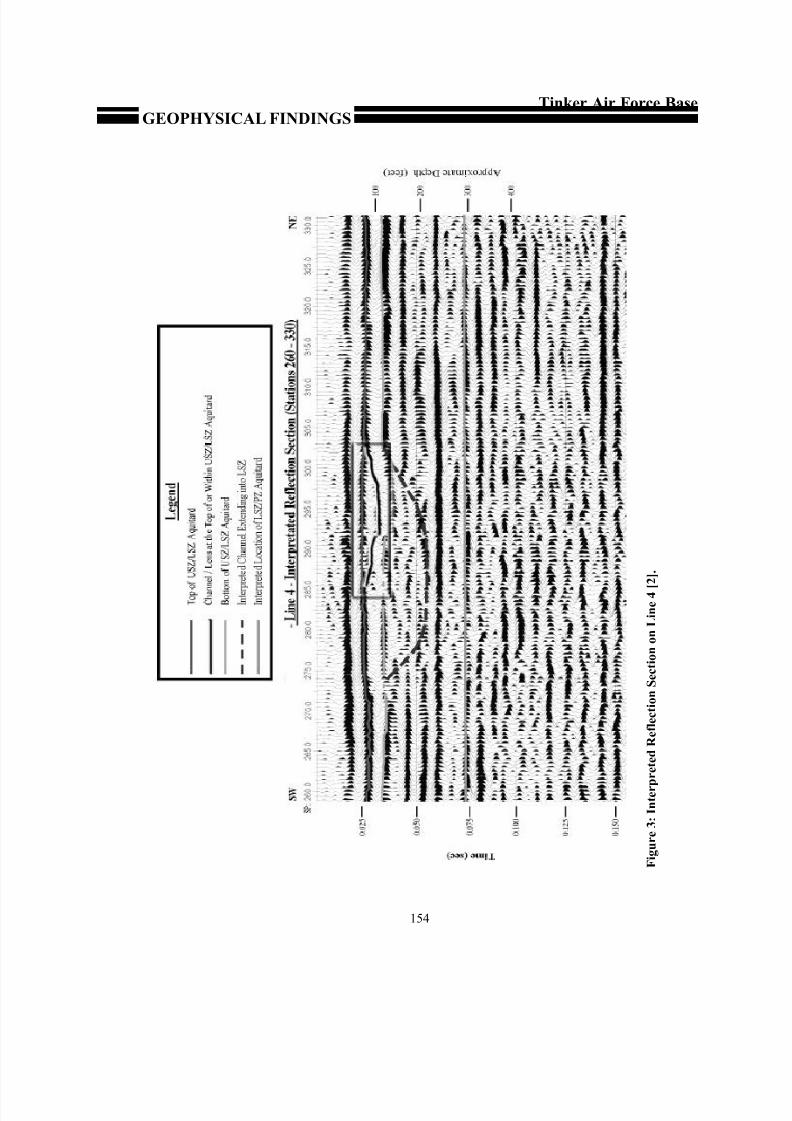
8/17/2019 Geophysical Investigation EPA
http://slidepdf.com/reader/full/geophysical-investigation-epa 160/164
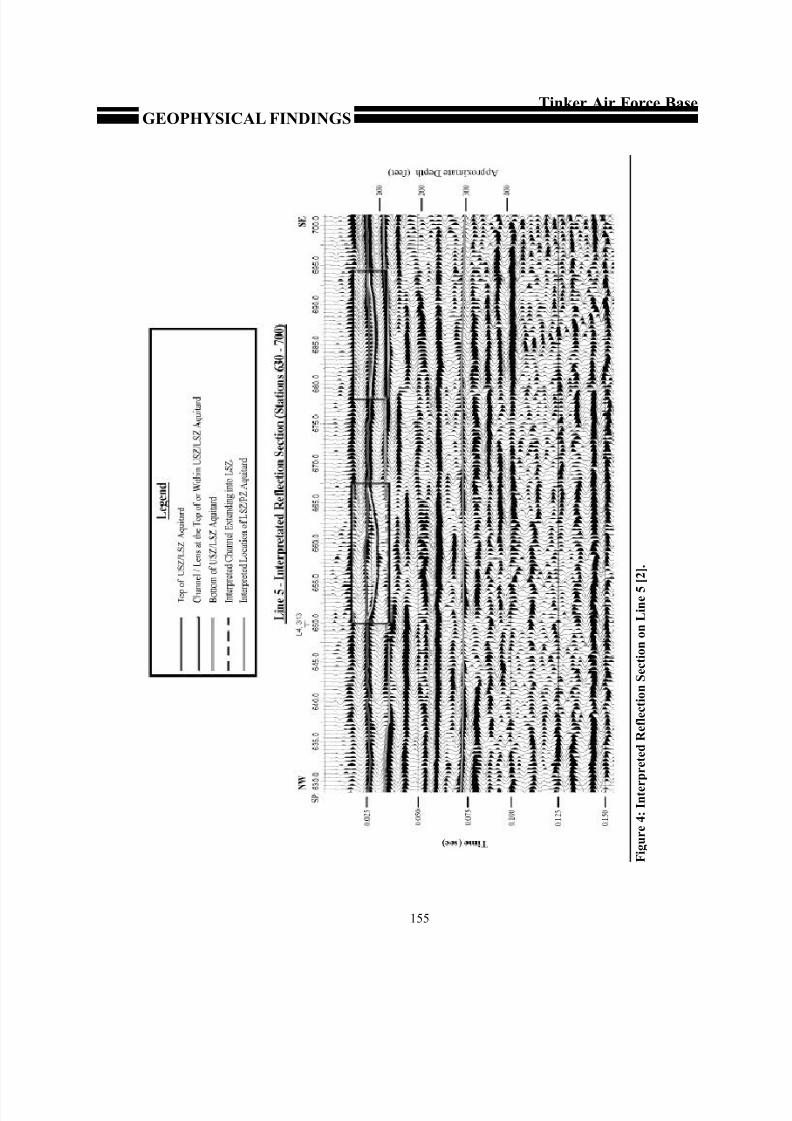
8/17/2019 Geophysical Investigation EPA
http://slidepdf.com/reader/full/geophysical-investigation-epa 161/164
GEOPHYSICAL FINDINGSTinker Air Force Base
155
F i g u r e 4 : I n t e r
p r e t e d R e f l e c t i o n S e c t i o n o n L i n e 5
[ 2 ] .

8/17/2019 Geophysical Investigation EPA
http://slidepdf.com/reader/full/geophysical-investigation-epa 162/164
GEOPHYSICAL FINDINGSTinker Air Force Base
156
Figure 5: Location of Significant Seismic Anomalies and Correlation with Well Yields[2]
8/17/2019 Geophysical Investigation EPA
http://slidepdf.com/reader/full/geophysical-investigation-epa 163/164
Tinker Air Force Base
157
LESSONS LEARNED
Lessons learned at the Tinker AFB study site include the following:
• The seismic survey results identified several areas in which permeable zones in thesubsurface are located and which may be favorable locations for future well installation.
Four of these sites represent locations where the highest potential for drilling into
significant sand channels is thought to exist [1].
• The EM survey successfully identified large scale anomalies caused by metallic objects,
such as the chain-link fences, nearby structures, and monitoring well monuments. The EM
anomalies found did not present a problem for the seismic data quality.
• Existing well yield data correlates well with several of the anomalies that are interpreted as
channels. Incorporation of recently acquired sonic log data and lithologic logs from
extraction wells drilled near any of the seismic lines with the seismic data will be
particularly useful for refining stratigraphic and depth correlation [1].
• The relatively high seismic velocities in the unconsolidated sediments at this site reduce the
spatial resolution that can be attained from the data. S-wave data should increase
resolution compared to the p-wave data. However, for this site, the s-wave data proved
inferior when compared to p-wave data, especially when the additional cost for acquiring
and processing the s-wave data is considered[2].
• The results developed for this site are only valid for two-dimensional cross sections of the
subsurface beneath each seismic line. If delineation of the spatial distribution of features
between lines is required, the acquisition of three-dimensional data should be considered at
this site [2]. Three-dimensional seismic techniques were the preferred method, but due tothe large areal extent of the survey area and associated data acquisition and processing
costs, the two-dimensional method was used [1].
• The application of seismic data processing algorithms, such as refraction statics and
spectral-whitening, reduced the level of interference in the data. This, combined with
thorough velocity and mute analysis along the seismic lines, allowed for increased
frequency and resolution of the seismic results [1].
• Seismic results often reveal a number of anomalous results attributable to a large variety
of conditions, such as poor surface conditions, interference from cultural sources, or
variation in seismic wave generation. These anomalies may, on the other hand, represent
the target structures. The use of seismic models in this survey aided the investigators byhelping them quickly identify whether the anomalous results were due to difficulties in data
acquisition or target structures. Moreover, by comparing seismic anomalies to model
results, investigators were able to refine their interpretation of the anomalous responses by
helping them to distinguish between different lithologic changes, such as a discontinuity in
a clay layer and a sand channel incised into the clay layer [4].

8/17/2019 Geophysical Investigation EPA
http://slidepdf.com/reader/full/geophysical-investigation-epa 164/164
Tinker Air Force Base
REFERENCES
• Hackworth, Jeffrey B., Sayler, Sara, Steensma, Gilein J., and Marcum, David W. Seismic
Reflection Survey For Mapping Groundwater Migration Pathways at Tinker Air Force
Base, Oklahoma. Proceedings of the Symposium on the Application of Geophysics toEngineering and Environmental Problems (SAGEEP) 1998.
• IT Corporation and Steensma, G. J. 2-D Seismic Reflection Survey Southwest Quadrant
Stabilization System Area Tinker Air Force Base Oklahoma City, Oklahoma. Draft
report. June 1997.
• Personal communication with Sara Sayler of Tinker Air Force Base. August 25, 1999.
• Personal communication with Sara Sayler of Tinker Air Force Base. December 17, 1999.