Embed Size (px)
Citation preview
GEOPHYSICAL SURVEY REPORT
Ashington, West Sussex
Client
Archaeology South-East
Survey Report
16435
Date
December 2019

Survey Report 16435: Ashington, West Sussex
Survey dates 19 November 2019
Field co-ordinator Andrew Bateman MSc
Field Team Simon Lobel BSc
Report Date 4 December 2019 CAD Illustrations Rebecca Fradgley BSc Report Author Rebecca Fradgley BSc
Project Manager Simon Haddrell BEng AMBCS PCIfA
Report approved Dr John Gater BSc DSc(Hon) MCIfA FSA
SUMO Geophysics Ltd SUMO Geophysics Ltd Cowburn Farm Vineyard House Market Street Upper Hook Road Thornton Upton upon Severn Bradford Worcestershire BD13 3HW WR8 0SA T: 01274 835016 T: 01684 592266 www.sumoservices.com [email protected]
Project Name: Ashington, West Sussex Job ref: 16435 Client: Archaeology South-East Date: Dec 2019 _____________________________________________________________________________________________________
_________________________________________________________________________ 1 © SUMO Geophysics Ltd
TABLE OF CONTENTS 1 LIST OF FIGURES 1
2 SURVEY TECHNIQUE 1
3 SUMMARY OF RESULTS 2
4 INTRODUCTION 2
5 RESULTS 3 - 4
6 DATA APPRAISAL & CONFIDENCE ASSESSMENT 4
7 CONCLUSION 4
8 REFERENCES 5
Appendix A Technical Information: Magnetometer Survey Methods, Processing and Presentation
Appendix B Technical Information: Magnetic Theory
1. LIST OF FIGURES Figure 01 NTS Site Location
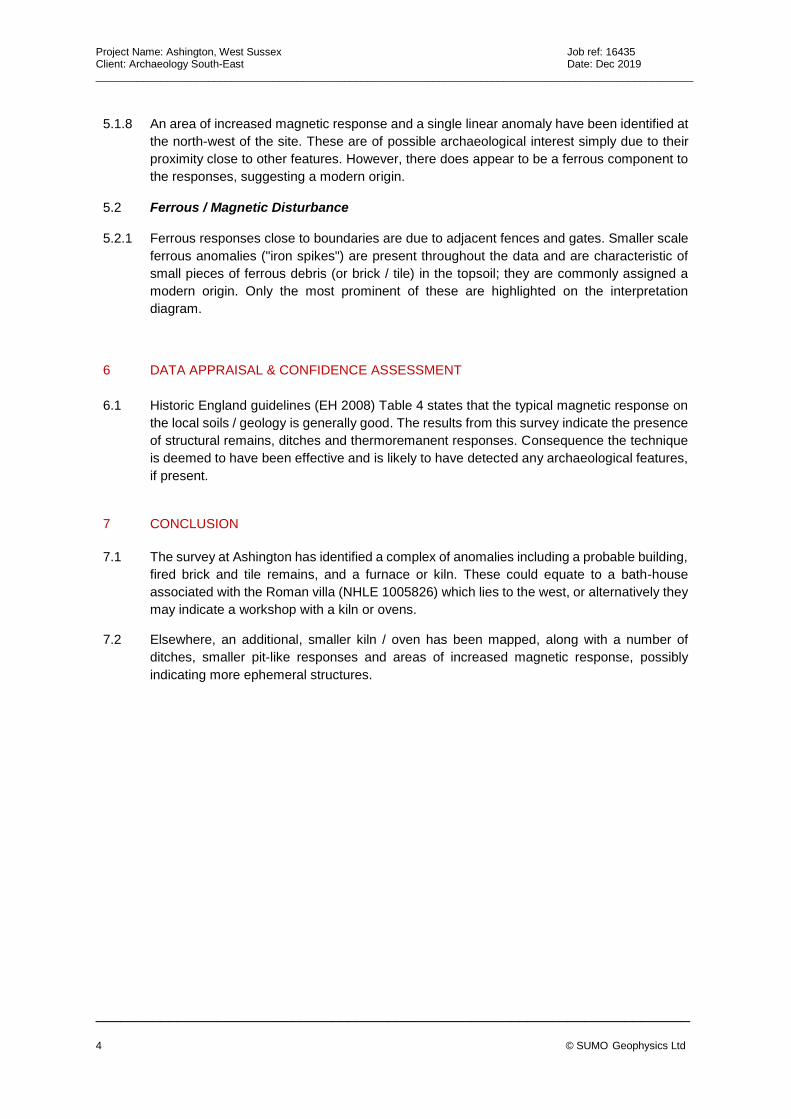
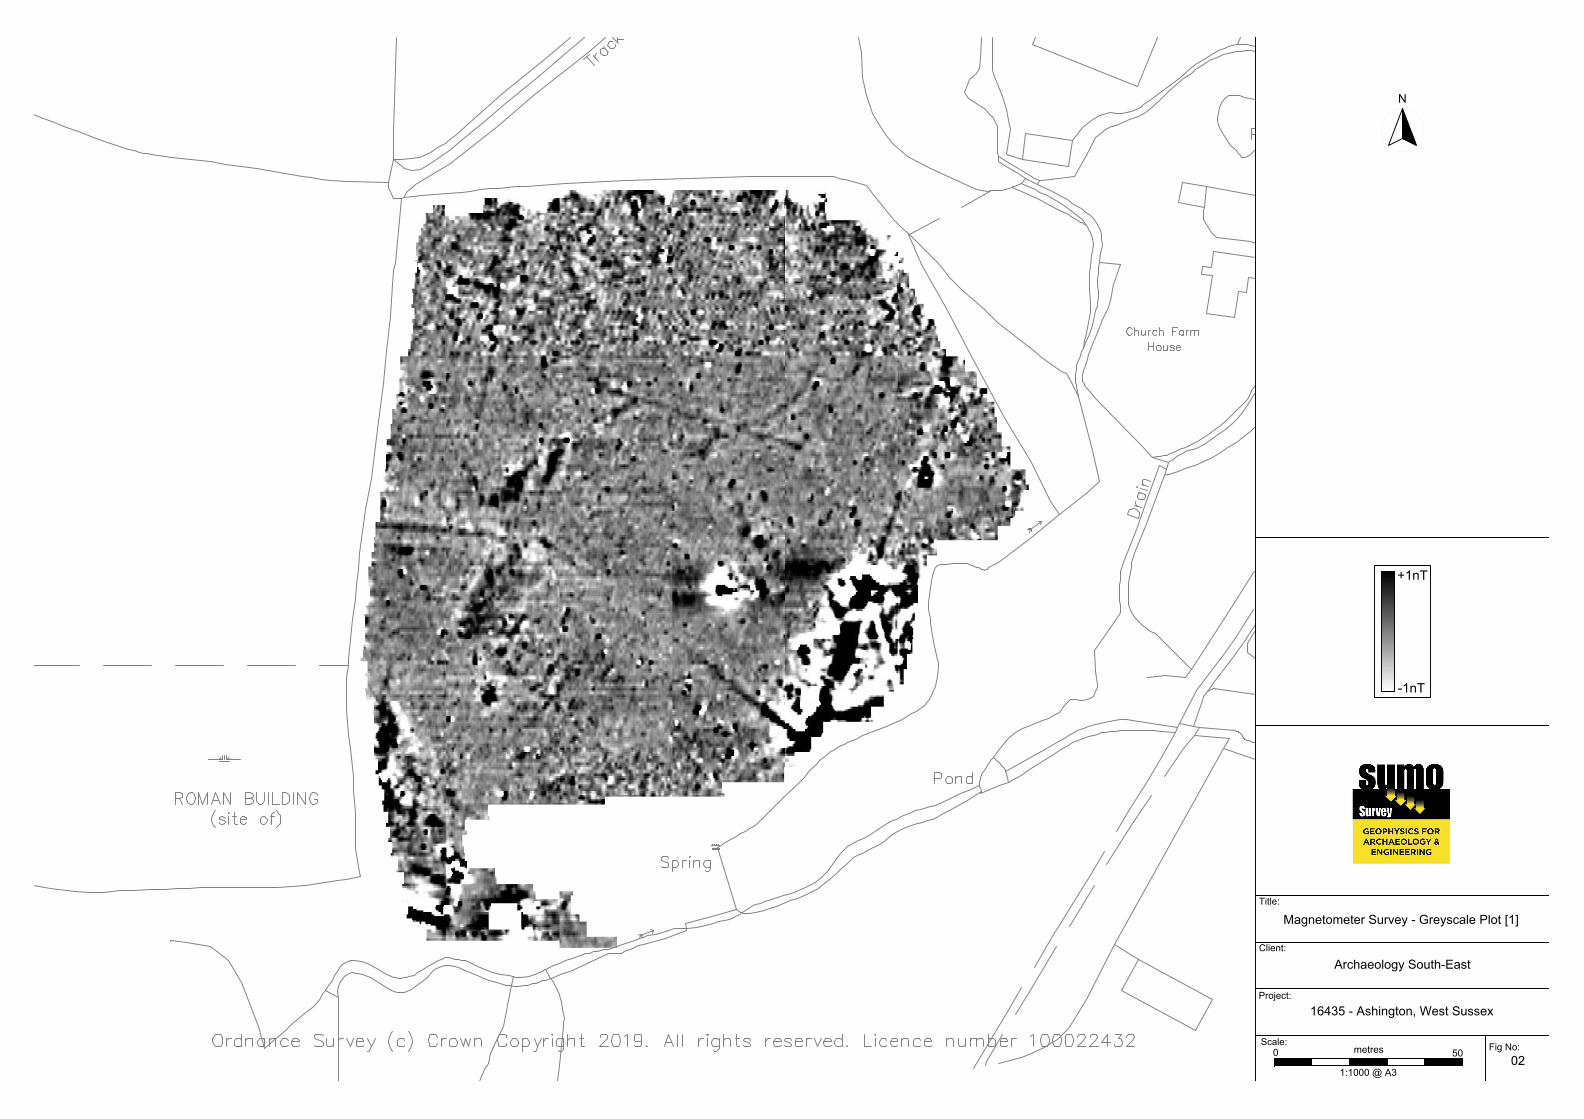
Figure 02 1:1000 Magnetometer Survey - Greyscale Plot [1]
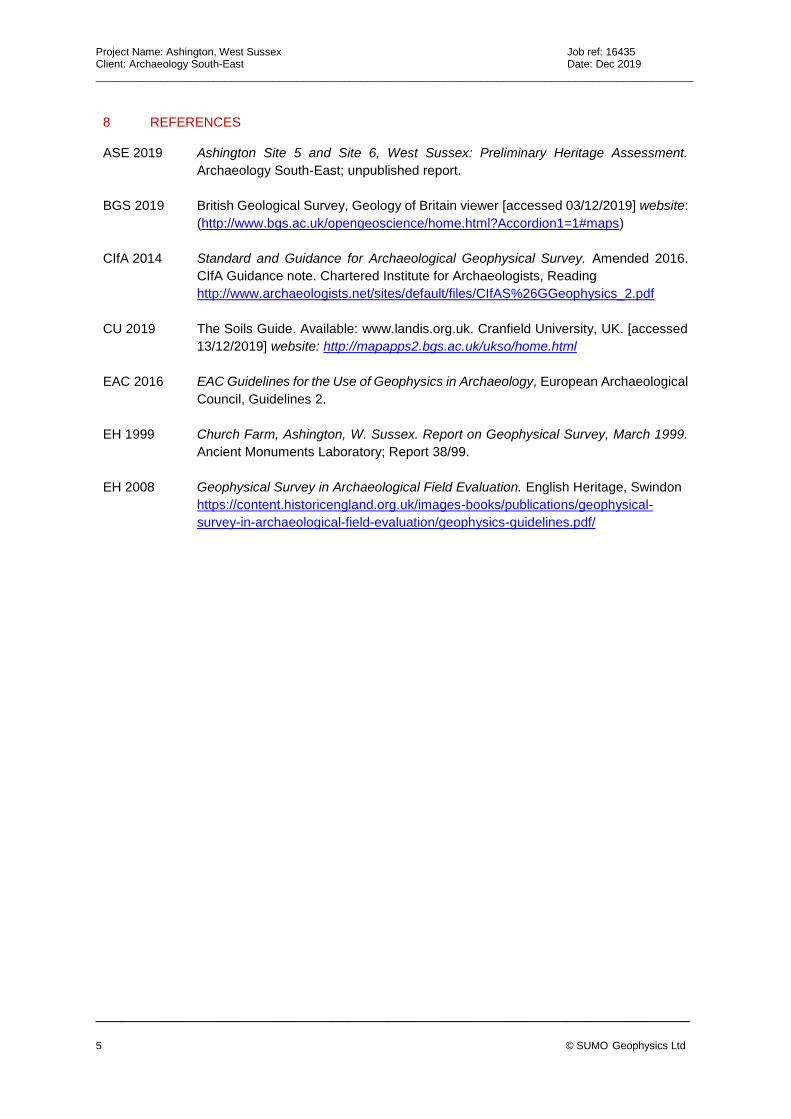
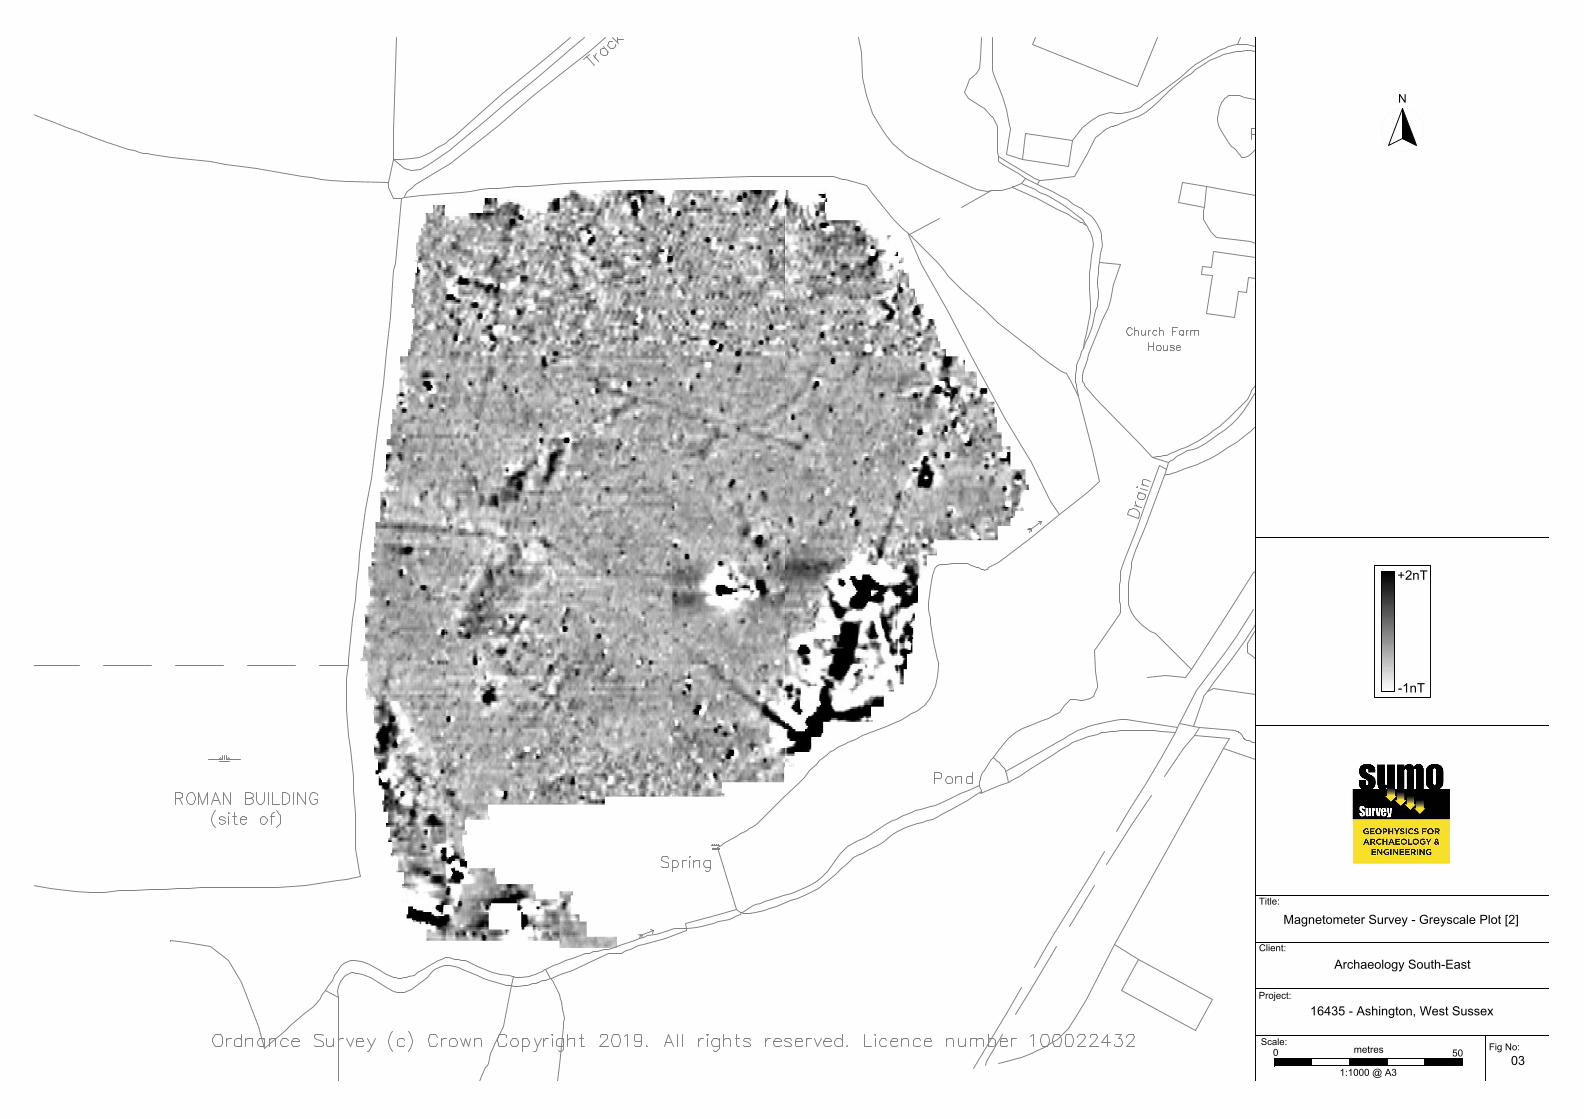
Figure 03 1:1000 Magnetometer Survey - Greyscale Plot [2]
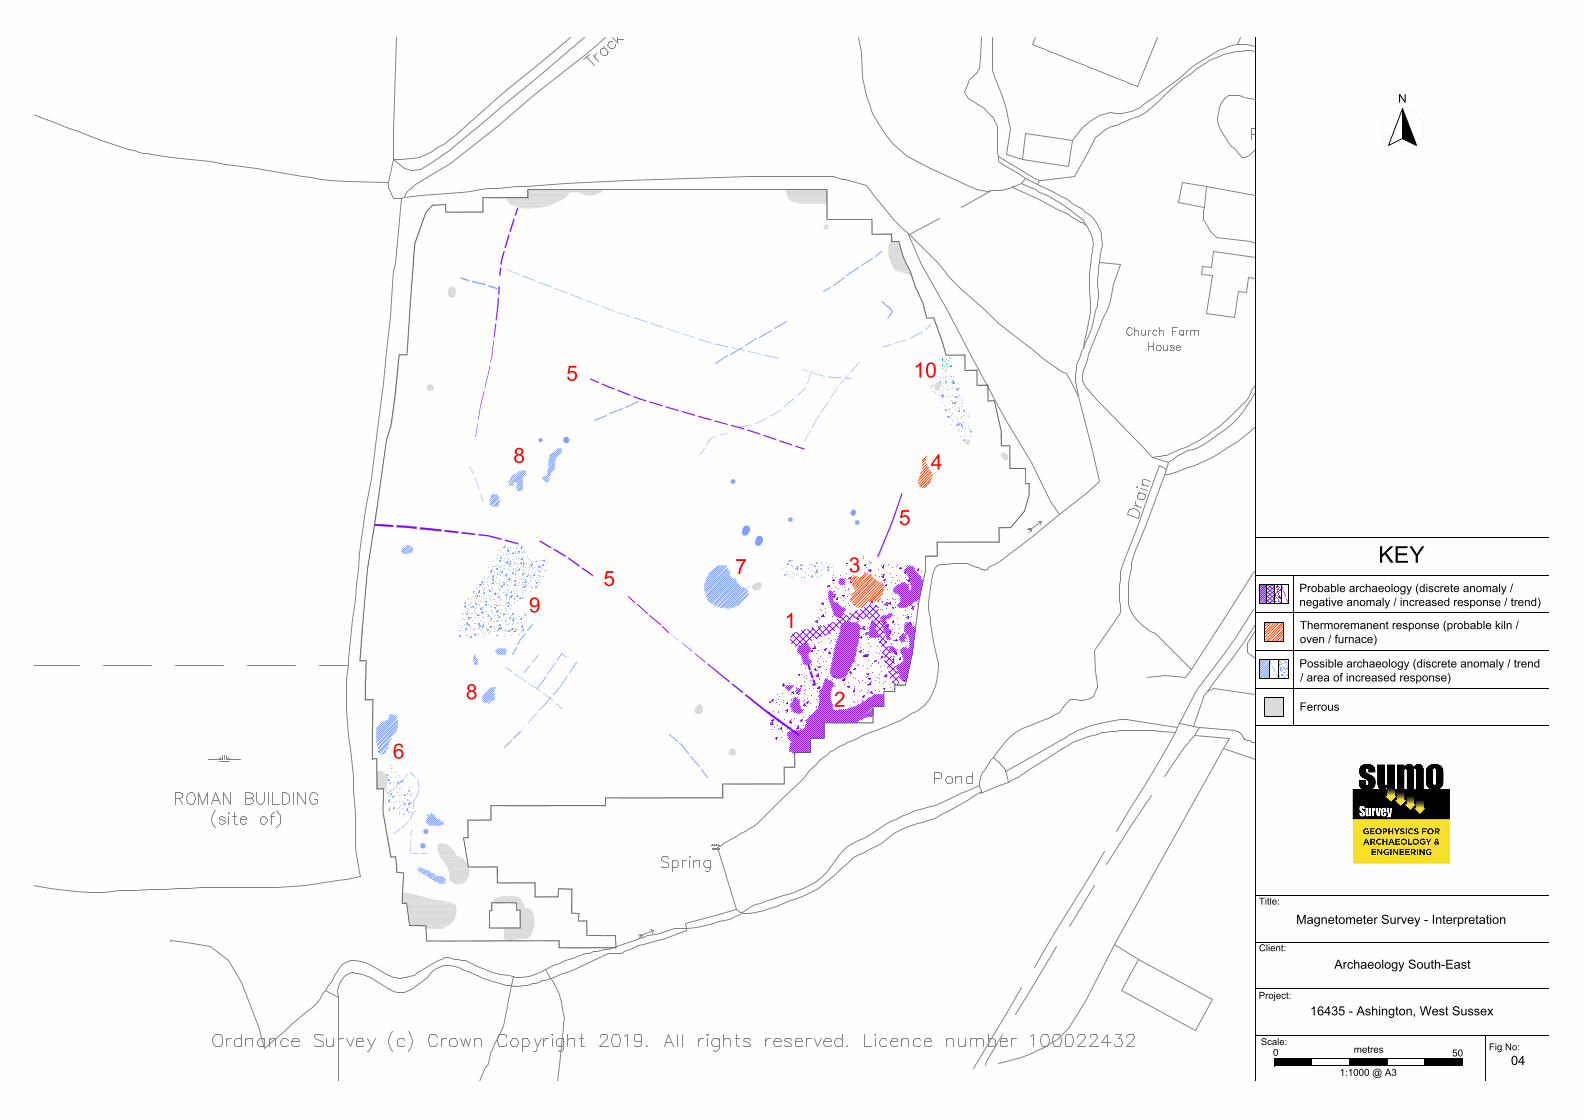
Figure 04 1:1000 Magnetometer Survey - Interpretation
Figure 05 1:1000 English Heritage (1999) - Magnetometer Interpretation
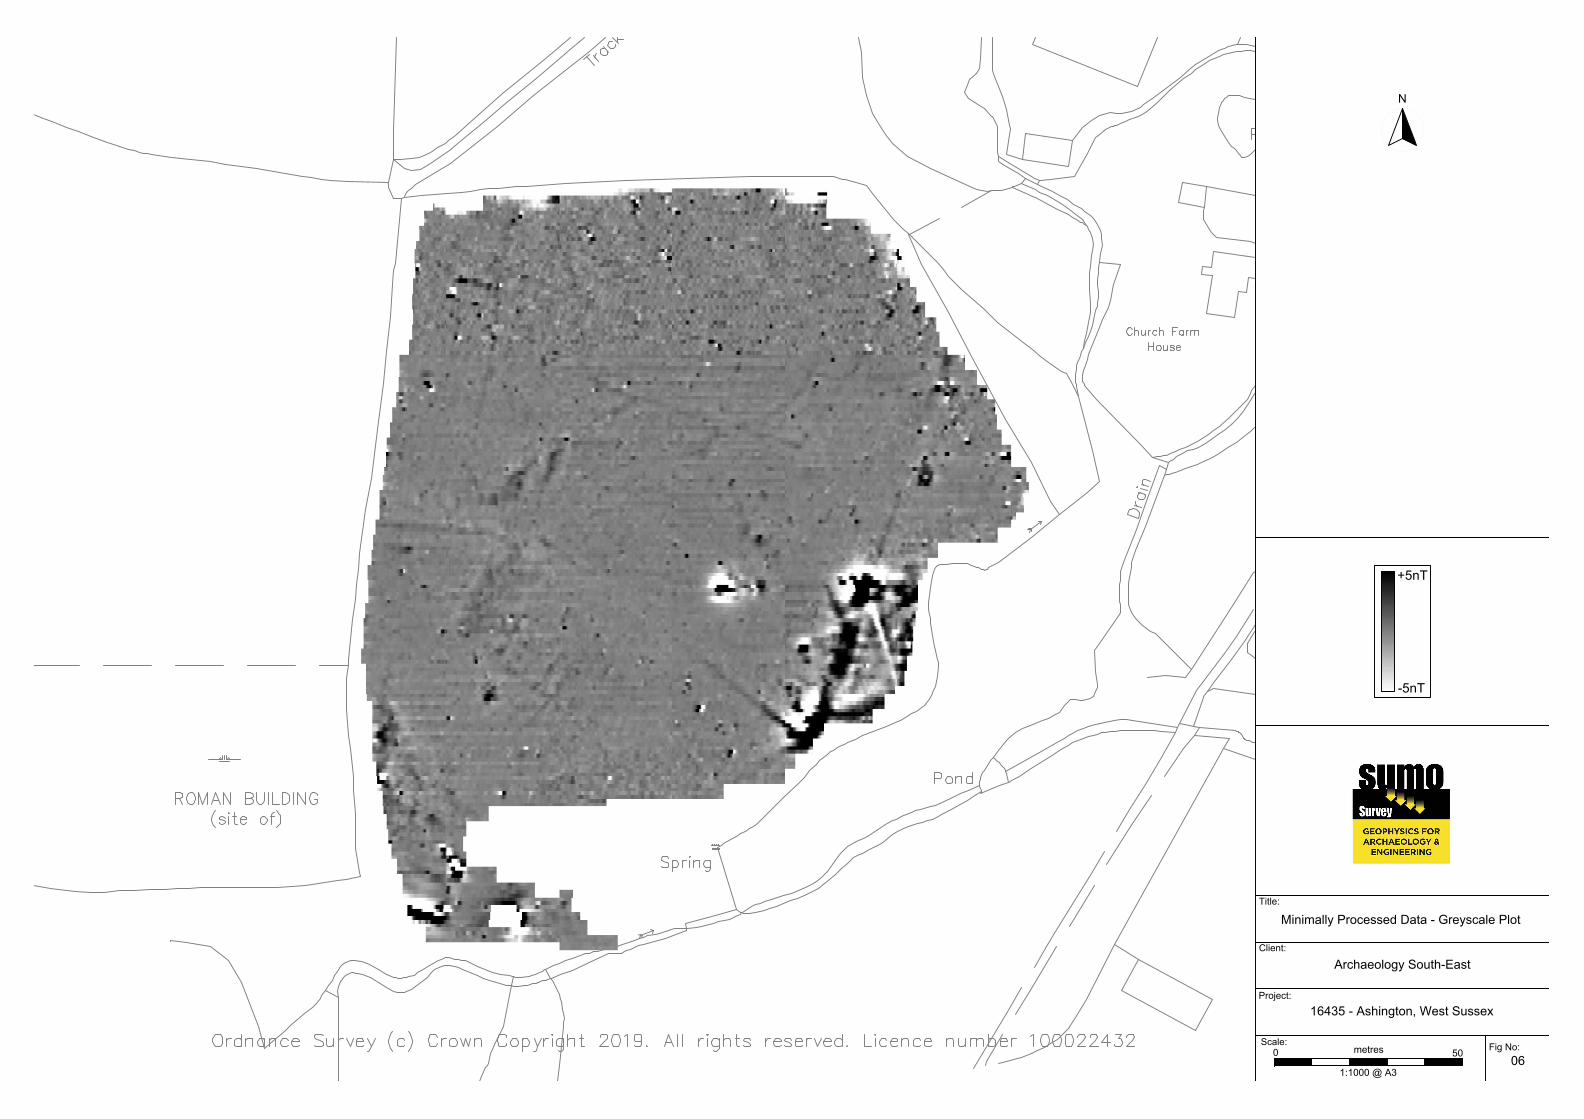
Figure 06 1:1000 Minimally Processed Data – Greyscale Plot
2. SURVEY TECHNIQUE
Detailed magnetic survey (magnetometry) was chosen as the most efficient and effective method of locating the type of archaeological anomalies which might be expected at this site.
Bartington Grad 601-2 Traverse Interval 1.0m Sample Interval 0.25m
Project Name: Ashington, West Sussex Job ref: 16435 Client: Archaeology South-East Date: Dec 2019 _____________________________________________________________________________________________________
_________________________________________________________________________ 2 © SUMO Geophysics Ltd
3 SUMMARY OF RESULTS
3.1 A detailed magnetometer survey was conducted over approximately 2.5 ha of land at Ashington, West Sussex. Several anomalies of archaeological interest have been identified and include tentative evidence for a bath-house / structure which is likely to be associated with the scheduled Roman building (NHLE 1005826) to the west. Thermoremanent anomalies indicative of kilns, ovens or even a furnace have also been detected, along with several ditch-type anomalies and possible pits.
4 INTRODUCTION
4.1 SUMO Geophysics Ltd were commissioned to undertake a geophysical survey of an area outlined for development. This survey forms part of an archaeological investigation being undertaken by Archaeology South-East.
4.2 Site details
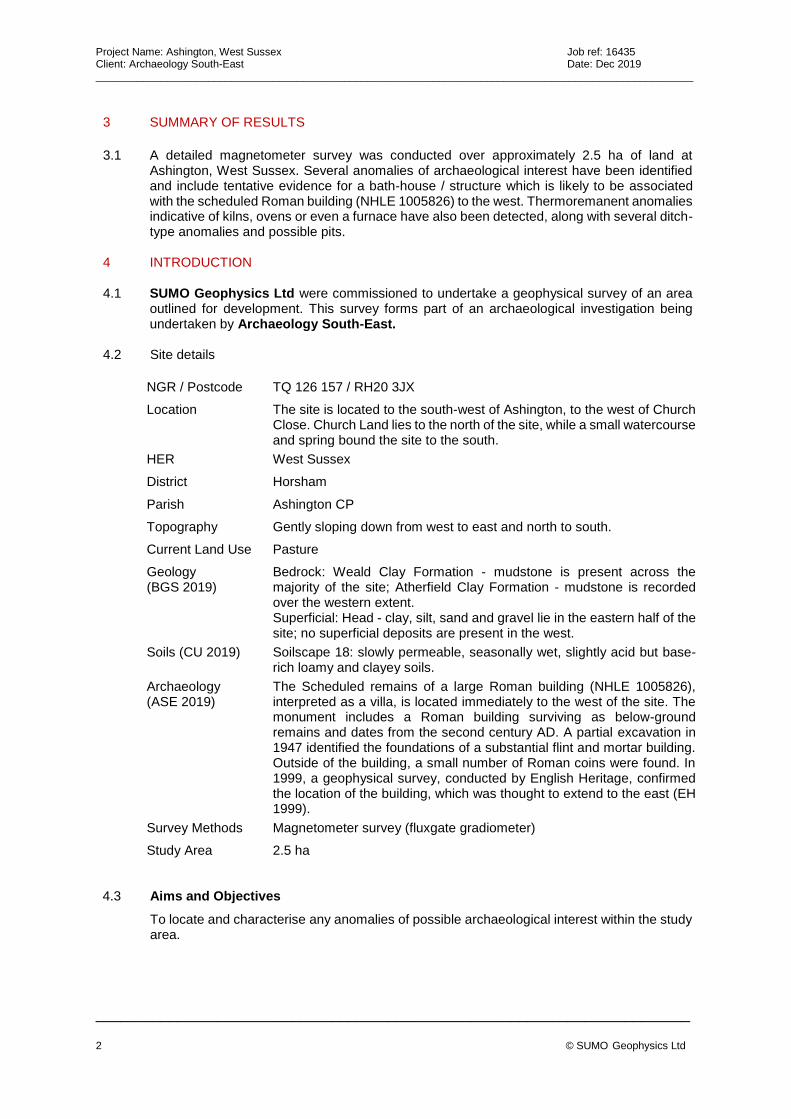
NGR / Postcode TQ 126 157 / RH20 3JX
Location The site is located to the south-west of Ashington, to the west of Church Close. Church Land lies to the north of the site, while a small watercourse and spring bound the site to the south.
HER West Sussex
District Horsham
Parish Ashington CP
Topography Gently sloping down from west to east and north to south.
Current Land Use Pasture
Geology (BGS 2019)
Bedrock: Weald Clay Formation - mudstone is present across the majority of the site; Atherfield Clay Formation - mudstone is recorded over the western extent. Superficial: Head - clay, silt, sand and gravel lie in the eastern half of the site; no superficial deposits are present in the west.
Soils (CU 2019) Soilscape 18: slowly permeable, seasonally wet, slightly acid but base-rich loamy and clayey soils.
Archaeology (ASE 2019)
The Scheduled remains of a large Roman building (NHLE 1005826), interpreted as a villa, is located immediately to the west of the site. The monument includes a Roman building surviving as below-ground remains and dates from the second century AD. A partial excavation in 1947 identified the foundations of a substantial flint and mortar building. Outside of the building, a small number of Roman coins were found. In 1999, a geophysical survey, conducted by English Heritage, confirmed the location of the building, which was thought to extend to the east (EH 1999).
Survey Methods Magnetometer survey (fluxgate gradiometer)
Study Area 2.5 ha
4.3 Aims and Objectives
To locate and characterise any anomalies of possible archaeological interest within the study area.

Project Name: Ashington, West Sussex Job ref: 16435 Client: Archaeology South-East Date: Dec 2019 _____________________________________________________________________________________________________
_________________________________________________________________________ 3 © SUMO Geophysics Ltd
5 RESULTS
Specific anomalies have been given numerical labels [1] [2] which appear in the text below,
as well as on the Interpretation Figure.
5.1 Probable / Possible Archaeology
5.1.1 A negative rectilinear response [1] is visible at the eastern edge of the site and is indicative
of structural remains, i.e. a wall or foundations measuring some 20m across. The response
is surrounded by an area of strong magnetic anomalies [2], suggestive of fired brick / tile or
other burnt deposits. Immediately north of [1] there is a very strong thermoremanent
response [3] which is indicative of a possible furnace for heating the building. If correct, such
an interpretation could indicate that the responses are a bath-house separated from the main
villa (NHLE 1005826) which lies to the west. Alternatively, the anomalies might be due to a
kiln or workshop. The presence of the nearby stream would be a good supply of water for
either function.
5.1.2 An additional thermoremanent response [4] has been detected to the north of the above
features. This response is considerably weaker; it is more likely to be a result of a smaller
kiln or oven, though there appears to be a lack of other archaeological features in the
immediate vicinity.
5.1.3 A few positive linear anomalies [5] have been detected and are indicative of former cut
features, i.e. ditches. They likely form part of a field system in the land surrounding the
Roman building (NHLE 1005826), though their alignment around the tentative bath-house [1]
is confusing; they could perhaps relate to a later ditch cutting into the structure. Further weak
linear trends are also visible in the data, though these are less clear and have been
interpreted as having possible archaeological origins.
5.1.4 A cluster of discrete positive anomalies, an area increased magnetic response and weak
linear trends [6] have been detected at the south-western edge of the site. These correspond
in location with the responses identified in the previous geophysical survey (EH 1999) which
were interpreted as forming the eastern extent of the Roman building (NHLE 1005826). The
responses at [6] lack clarity and are of low-moderate strength. That, combined with their
location at the edge of the survey area, which makes further interpretation difficult, has led
to their interpretation as being of ‘possible’ archaeological origin.
5.1.5 A strongly enhanced discrete response [7] has been detected to the north-west of the
rectilinear building [1] and possible kiln / furnace [3]. The response appears to be more
ferrous in its characteristics, rather than thermoremanent; however, its proximity to the
possible furnace [3] to its east indicates that it may be of archaeological interest.
5.1.6 A few discrete positive responses [8] are visible in the data. They are indicative of small
former cut features and could reflect former backfilled pits.
5.1.7 An area of very slightly increased magnetic response [9] has been detected near the centre
of the site. The response was suggested by English Heritage (1999) as possible building
remains; however, the responses are very weak in comparison to those elsewhere on the
site e.g. [1-2]. It is suggested that the area of increased response is perhaps related to much
more ephemeral features, including possible timber structures.
Project Name: Ashington, West Sussex Job ref: 16435 Client: Archaeology South-East Date: Dec 2019 _____________________________________________________________________________________________________
_________________________________________________________________________ 4 © SUMO Geophysics Ltd
5.1.8 An area of increased magnetic response and a single linear anomaly have been identified at
the north-west of the site. These are of possible archaeological interest simply due to their
proximity close to other features. However, there does appear to be a ferrous component to
the responses, suggesting a modern origin.
5.2 Ferrous / Magnetic Disturbance
5.2.1 Ferrous responses close to boundaries are due to adjacent fences and gates. Smaller scale
ferrous anomalies ("iron spikes") are present throughout the data and are characteristic of
small pieces of ferrous debris (or brick / tile) in the topsoil; they are commonly assigned a
modern origin. Only the most prominent of these are highlighted on the interpretation
diagram.
6 DATA APPRAISAL & CONFIDENCE ASSESSMENT
6.1 Historic England guidelines (EH 2008) Table 4 states that the typical magnetic response on
the local soils / geology is generally good. The results from this survey indicate the presence
of structural remains, ditches and thermoremanent responses. Consequence the technique
is deemed to have been effective and is likely to have detected any archaeological features,
if present.
7 CONCLUSION
7.1 The survey at Ashington has identified a complex of anomalies including a probable building,
fired brick and tile remains, and a furnace or kiln. These could equate to a bath-house
associated with the Roman villa (NHLE 1005826) which lies to the west, or alternatively they
may indicate a workshop with a kiln or ovens.
7.2 Elsewhere, an additional, smaller kiln / oven has been mapped, along with a number of
ditches, smaller pit-like responses and areas of increased magnetic response, possibly
indicating more ephemeral structures.
Project Name: Ashington, West Sussex Job ref: 16435 Client: Archaeology South-East Date: Dec 2019 _____________________________________________________________________________________________________
_________________________________________________________________________ 5 © SUMO Geophysics Ltd
8 REFERENCES
ASE 2019 Ashington Site 5 and Site 6, West Sussex: Preliminary Heritage Assessment.
Archaeology South-East; unpublished report.
BGS 2019 British Geological Survey, Geology of Britain viewer [accessed 03/12/2019] website:
(http://www.bgs.ac.uk/opengeoscience/home.html?Accordion1=1#maps)
CIfA 2014 Standard and Guidance for Archaeological Geophysical Survey. Amended 2016.
CIfA Guidance note. Chartered Institute for Archaeologists, Reading
http://www.archaeologists.net/sites/default/files/CIfAS%26GGeophysics_2.pdf
CU 2019 The Soils Guide. Available: www.landis.org.uk. Cranfield University, UK. [accessed
13/12/2019] website: http://mapapps2.bgs.ac.uk/ukso/home.html
EAC 2016 EAC Guidelines for the Use of Geophysics in Archaeology, European Archaeological
Council, Guidelines 2.
EH 1999 Church Farm, Ashington, W. Sussex. Report on Geophysical Survey, March 1999.
Ancient Monuments Laboratory; Report 38/99.
EH 2008 Geophysical Survey in Archaeological Field Evaluation. English Heritage, Swindon
https://content.historicengland.org.uk/images-books/publications/geophysical-
survey-in-archaeological-field-evaluation/geophysics-guidelines.pdf/
Client:
Project:
Title:
Site Location
Fig No:
01
Scale:
NOT TO SCALE
Archaeology South-East
N
Survey Area
Reproduced from Ordnance Survey's 1:25 000 map of 1998 with the permission of
the controller of Her Majesty's Stationery Office. Crown Copyright reserved.
Licence No: 100018665
Survey Area
16435 - Ashington, West Sussex
Archaeology South-East
Client:
Project:
Title:
Magnetometer Survey - Greyscale Plot [1]
Fig No:
+1nT
-1nT
02
N
Scale:
050
metres
1:1000 @ A3
16435 - Ashington, West Sussex
Archaeology South-East
Client:
Project:
Title:
Magnetometer Survey - Greyscale Plot [2]
Fig No:
+2nT
-1nT
03
N
Scale:
050
metres
1:1000 @ A3
16435 - Ashington, West Sussex
1
3
2
4
5
5
5
8
6
7
8
9
10
Archaeology South-East
16435 - Ashington, West Sussex
Client:
Project:
Title:
Magnetometer Survey - Interpretation
Fig No:
N
KEY
04
Ferrous
Possible archaeology (discrete anomaly / trend
/ area of increased response)
Probable archaeology (discrete anomaly /
negative anomaly / increased response / trend)
Thermoremanent response (probable kiln /
oven / furnace)
Scale:
050
metres
1:1000 @ A3

24
23
20
22
21
16
10
15
25
2
Archaeology South-East
16435 - Ashington, West Sussex
Client:
Project:
Title:
English Heritage (1999) - Magnetometer
Interpretation
Fig No:
N
KEY
05
Positive magnetic anomaly
Tentative magnetic anomaly
Negative magnetic anomaly
Magnetic disturbance
Scale:
050
metres
1:1000 @ A3
(Tentative) Positive linear magnetic anomaly
Previous magnetometer survey area
Archaeology South-East
16435 - Ashington, West Sussex
Client:
Project:
Title:
Minimally Processed Data - Greyscale Plot
Fig No:
+5nT
-5nT
06
N
Scale:
050
metres
1:1000 @ A3
_____________________________________________________________________________________________________ © SUMO Survey: Geophysics for Archaeology and Engineering
Appendix A - Technical Information: Magnetometer Survey Method, Processing and Presentation
Standards & Guidance This report and all fieldwork have been conducted in accordance with the latest guidance documents issued by Historic England (EH 2008) (then English Heritage), the Chartered Institute for Archaeologists (CIfA 2014) and the European Archaeological Council (EAC 2016).
Grid Positioning For hand held gradiometers the location of the survey grids has been plotted together with the referencing information. Grids were set out using a Trimble R8 Real Time Kinematic (RTK) VRS Now GNSS GPS system. An RTK GPS (Real-time Kinematic Global Positioning System) can locate a point on the ground to a far greater accuracy than a standard GPS unit. A standard GPS suffers from errors created by satellite orbit errors, clock errors and atmospheric interference, resulting in an accuracy of 5m-10m. An RTK system uses a single base station receiver and a number of mobile units. The base station re-broadcasts the phase of the carrier it measured, and the mobile units compare their own phase measurements with those they received from the base station. This results in an accuracy of around 0.01m.
Technique Instrument Traverse Interval Sample Interval
Magnetometer Bartington Grad 601-2 1m 0.25m
Instrumentation: Bartington Grad 601-2 Bartington instruments operate in a gradiometer configuration which comprises fluxgate sensors mounted vertically, set 1.0m apart. The fluxgate gradiometer suppresses any diurnal or regional effects. The instruments are carried, or cart mounted, with the bottom sensor approximately 0.1-0.3m from the ground surface. At each survey station, the difference in the magnetic field between the two fluxgates is measured in nanoTesla (nT). The sensitivity of the instrument can be adjusted; for most archaeological surveys the most sensitive range (0.1nT) is used. Generally, features up to 1m deep may be detected by this method, though strongly magnetic objects may be visible at greater depths. The Bartington instrument can collect two lines of data per traverse with gradiometer units mounted laterally with a separation of 1.0m. The readings are logged consecutively into the data logger which in turn is daily down-loaded into a portable computer whilst on site. At the end of each site survey, data is
transferred to the office for processing and presentation. Data Processing Zero Mean Traverse
This process sets the background mean of each traverse within each grid to zero. The operation removes striping effects and edge discontinuities over the whole of the data set.
Step Correction (De-stagger)
When gradiometer data are collected in 'zig-zag' fashion, stepping errors can sometimes arise. These occur because of a slight difference in the speed of walking on the forward and reverse traverses. The result is a staggered effect in the data, which is particularly noticeable on linear anomalies. This process corrects these errors.
Display Greyscale/ Colourscale Plot
This format divides a given range of readings into a set number of classes. Each class is represented by a specific shade of grey, the intensity increasing with value. All values above the given range are allocated the same shade (maximum intensity); similarly, all values below the given range are represented by the minimum intensity shade. Similar plots can be produced in colour, either using a wide range of colours or by selecting two or three colours to represent positive and negative values. The assigned range (plotting levels) can be adjusted to emphasise different anomalies in the data-set.
_____________________________________________________________________________________________________ © SUMO Survey: Geophysics for Archaeology and Engineering
Presentation of results and interpretation
The presentation of the results includes a ‘minimally processed data’ and a ‘processed data’ greyscale plot. Magnetic anomalies are identified, interpreted and plotted onto the ‘Interpretation’ drawings. When interpreting the results, several factors are taken into consideration, including the nature of archaeological features being investigated and the local conditions at the site (geology, pedology, topography etc.). Anomalies are categorised by their potential origin. Where responses can be related to other existing evidence, the anomalies will be given specific categories, such as: Abbey Wall or Roman Road. Where the interpretation is based largely on the geophysical data, levels of confidence are implied, for example: Probable, or Possible Archaeology. The former is used for a confident interpretation, based on anomaly definition and/or other corroborative data such as cropmarks. Poor anomaly definition, a lack of clear patterns to the responses and an absence of other supporting data reduces confidence, hence the classification Possible.
_____________________________________________________________________________________________________ © SUMO Survey: Geophysics for Archaeology and Engineering
Interpretation Categories
In certain circumstances (usually when there is corroborative evidence from desk-based or excavation
data) very specific interpretations can be assigned to magnetic anomalies (for example, Roman Road,
Wall, etc.) and where appropriate, such interpretations will be applied. The list below outlines the
generic categories commonly used in the interpretation of the results.
Archaeology / Probable Archaeology
This term is used when the form, nature and pattern of the responses are clearly or very probably archaeological and /or if corroborative evidence is available. These anomalies, whilst considered anthropogenic, could be of any age.
Possible Archaeology
These anomalies exhibit either weak signal strength and / or poor definition, or form incomplete archaeological patterns, thereby reducing the level of confidence in the interpretation. Although the archaeological interpretation is favoured, they may be the result of variable soil depth, plough damage or even aliasing as a result of data collection orientation.
Industrial / Burnt-Fired
Strong magnetic anomalies that, due to their shape and form or the context in which they are found, suggest the presence of kilns, ovens, corn dryers, metal- working areas or hearths. It should be noted that in many instances modern ferrous material can produce similar magnetic anomalies.
Former Field Boundary (probable & possible)
Anomalies that correspond to former boundaries indicated on historic mapping, or which are clearly a continuation of existing land divisions. Possible denotes less confidence where the anomaly may not be shown on historic mapping but nevertheless the anomaly displays all the characteristics of a field boundary.
Ridge & Furrow Parallel linear anomalies whose broad spacing suggests ridge and furrow cultivation. In some cases, the response may be the result of more recent agricultural activity.
Agriculture (ploughing)
Parallel linear anomalies or trends with a narrower spacing, sometimes aligned with existing boundaries, indicating more recent cultivation regimes.
Land Drain Weakly magnetic linear anomalies, quite often appearing in series forming parallel and herringbone patterns. Smaller drains may lead and empty into larger diameter pipes, which in turn usually lead to local streams and ponds. These are indicative of clay fired land drains.
Natural These responses form clear patterns in geographical zones where natural variations are known to produce significant magnetic distortions.
Magnetic Disturbance
Broad zones of strong dipolar anomalies, commonly found in places where modern ferrous or fired materials (e.g. brick rubble) are present.
Service Magnetically strong anomalies, usually forming linear features are indicative of ferrous pipes/cables. Sometimes other materials (e.g. pvc) or the fill of the trench can cause weaker magnetic responses which can be identified from their uniform linearity.
Ferrous This type of response is associated with ferrous material and may result from small items in the topsoil, larger buried objects such as pipes, or above ground features such as fence lines or pylons. Ferrous responses are usually regarded as modern. Individual burnt stones, fired bricks or igneous rocks can produce responses similar to ferrous material.
Uncertain Origin Anomalies which stand out from the background magnetic variation, yet whose form and lack of patterning gives little clue as to their origin. Often the characteristics and distribution of the responses straddle the categories of Possible Archaeology / Natural or (in the case of linear responses) Possible Archaeology / Agriculture; occasionally they are simply of an unusual form.
Where appropriate some anomalies will be further classified according to their form (positive or negative) and relative strength and coherence (trend: weak and poorly defined).
_____________________________________________________________________________________________________ © SUMO Survey: Geophysics for Archaeology and Engineering
Appendix B - Technical Information: Magnetic Theory
Detailed magnetic survey can be used to effectively define areas of past human activity by mapping spatial variation and contrast in the magnetic properties of soil, subsoil and bedrock. Although the changes in the magnetic field resulting from differing features in the soil are usually weak, changes as small as 0.1 nanoTeslas (nT) in an overall field strength of 48,000 (nT), can be accurately detected. Weakly magnetic iron minerals are always present within the soil and areas of enhancement relate to increases in magnetic susceptibility and permanently magnetised thermoremanent material. Magnetic susceptibility relates to the induced magnetism of a material when in the presence of a magnetic field. This magnetism can be considered as effectively permanent as it exists within the Earth’s magnetic field. Magnetic susceptibility can become enhanced due to burning and complex biological or fermentation processes. Thermoremanence is a permanent magnetism acquired by iron minerals that, after heating to a specific temperature known as the Curie Point, are effectively demagnetised followed by re-magnetisation by the Earth’s magnetic field on cooling. Thermoremanent archaeological features can include hearths and kilns; material such as brick and tile may be magnetised through the same process. Silting and deliberate infilling of ditches and pits with magnetically enhanced soil creates a relative contrast against the much lower levels of magnetism within the subsoil into which the feature is cut. Systematic mapping of magnetic anomalies will produce linear and discrete areas of enhancement allowing assessment and characterisation of subsurface features. Material such as subsoil and non-magnetic bedrock used to create former earthworks and walls may be mapped as areas of lower enhancement compared to surrounding soils. Magnetic survey is carried out using a fluxgate gradiometer which is a passive instrument consisting of two sensors mounted vertically 1m apart. The instrument is carried about 30cm above the ground surface and the top sensor measures the Earth’s magnetic field whilst the lower sensor measures the same field but is also more affected by any localised buried feature. The difference between the two sensors will relate to the strength of a magnetic field created by this feature, if no field is present the difference will be close to zero as the magnetic field measured by both sensors will be the same. Factors affecting the magnetic survey may include soil type, local geology, previous human activity and disturbance from modern services.

• Archaeological • Geophysical • Laser Scanning
• Measured Building • Topographic • Utility Mapping
SUMO Services Ltd, incorporated under the laws of England and Wales, Company Registration No.4275993.
Registered Office Unit 8 Hayward Business Centre, New Lane, Havant, Hampshire, PO9 2NL


![Ashington Piggeries v Hill [1972] Ac 441 - Hl](https://img.pdfslide.net/doc/110x75/54753c9cb4af9f541b8b45e4/ashington-piggeries-v-hill-1972-ac-441-hl.jpg)