Embed Size (px)
Citation preview
Geophysical Survey Report MSSJ27
for
Waking the Legions: Exploring Chester’s Roman Fort,
Deanery Field, Chester
Cheshire
For
Big Heritage
Magnitude Surveys Ref: MSSJ27
September 2016

Deanery Field, Chester MSSJ27 - Geophysical Survey Report
1 | P a g e
Unit 17, Commerce Court
Challenge Way
Bradford
BD4 8NW
+44 (0)1274 926020
Report Written by:
Leanne Swinbank BA
Figures Produced by:
Leanne Swinbank BA; Finnegan Pope-Carter BSc MSc FGS
Report Checked by:
Chrys Harris BA MSc
Report Issued:
06 September 2016
Abstract Magnitude Surveys was commissioned to undertake a geophysical investigation on a c. 1 ha area of
land at Deanery Field for Big Heritage’s Waking the Legions project. This was work undertaken as part
of the Festival of Archaeology 2016, which aimed to engage members of the public with archaeological
heritage. A multimethod geophysical approach using ground penetrating radar, earth resistance, and
magnetic methods targeted buried Roman remains that had previously been discovered during
excavations in the 1920s and 1930s. This combined approach successfully detected a number of
archaeological features that likely reflect Roman occupation of the site.
Deanery Field, Chester MSSJ27 - Geophysical Survey Report
2 | P a g e
Contents Abstract ................................................................................................................................................... 1
List of Figures .......................................................................................................................................... 3
1. Introduction .................................................................................................................................... 4
2. Quality Assurance ........................................................................................................................... 4
3. Objectives........................................................................................................................................ 4
4. Geographic Background .................................................................................................................. 5
5. Archaeological Background ............................................................................................................. 5
6. Methodology ................................................................................................................................... 6
Data Collection ........................................................................................................................ 6
Data Processing ....................................................................................................................... 7
Data Visualisation and Interpretation ..................................................................................... 8
7. Results ............................................................................................................................................. 9
Qualification ............................................................................................................................ 9
Survey Considerations ............................................................................................................ 9
Discussion ................................................................................................................................ 9
Interpretation........................................................................................................................ 10
General Statements ...................................................................................................... 10
Magnetic Results - Specific Anomalies .......................................................................... 10
Resistance Results ......................................................................................................... 11
Ground Penetrating Radar Results ............................................................................... 12
8. Conclusions ................................................................................................................................... 13
9. Archiving ....................................................................................................................................... 14
10. Copyright ....................................................................................................................................... 15
References ............................................................................................................................................ 15
Deanery Field, Chester MSSJ27 - Geophysical Survey Report
3 | P a g e
List of Figures Figure 1: Site Location 1:25,000 @ A4 Figure 2: Survey Area 1:10,000 @ A4 Figure 3: Magnetic Greyscale 1:500 @ A3 Figure 4: Magnetic Interpretation 1:500 @ A3 Figure 5: Earth Resistance (Beta) 1:500 @ A3 Figure 6: Earth Resistance (Gamma) 1:500 @ A3 Figure 7:
Earth Resistance Interpretation
1:500 @ A3
Figure 8:
GPR Representative Depth Slice (Shallow)
1:500 @ A3
Figure 9: GPR Interpretation (Shallow) 1:500 @ A3 Figure 10:
GPR Representative Depth Slice (Middle)
1:500 @ A3
Figure 11:
GPR Interpretation (Middle)
1:500 @ A3
Figure 12:
GPR Representative Depth Slice (Deep)
1:500 @ A3
Figure 13: GPR Interpretation (Deep) 1:500 @ A3
Deanery Field, Chester MSSJ27 - Geophysical Survey Report
Magnitude Surveys Ltd 4 | P a g e
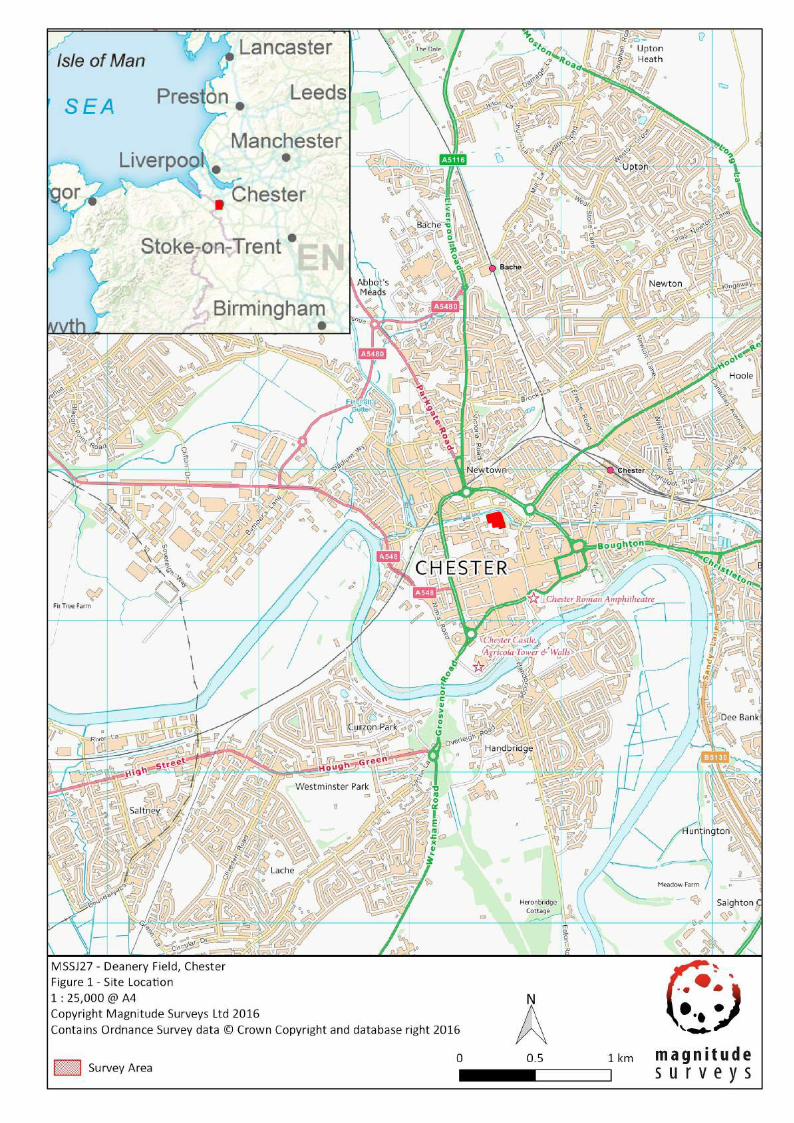
1. Introduction Magnitude Surveys Ltd (MS) was commissioned by Big Heritage (BH) to undertake a
geophysical survey on a c. 1 ha area of land on Deanery Field, north of Chester Cathedral,
located in the north east corner of the city walls (SJ 405 666).
The geophysical survey comprised:
Hand pulled, cart-mounted fluxgate gradiometer survey.
Hand pulled, cart-mounted earth resistance survey.
Hand pulled, sledge mounted ground penetrating radar survey.
The survey was conducted in line with the current best practice guidelines produced by
Historic England (David et al., 2008), the Charted Institute of Field Archaeologists (CIfA, 2014)
and the European Archaeological Council (Schmidt et al., 2015).
The survey commenced on 23 July and took 2 days to complete.
2. Quality Assurance Project management, survey work, data processing and report production have been carried
out by qualified and professional geophysicists to standards exceeding the current best
practice (CIfA, 2014; David et al., 2008, Schmidt et al., 2015).
Magnitude Surveys is a corporate member of ISAP (International Society of Archaeological
Prospection).
Director Graeme Attwood is a Member of the Chartered Institute for Archaeologists (CIfA),
the chartered UK body for archaeologists, as well as a member of GeoSIG, the CIfA Geophysics
Special Interest Group.
Director Finnegan Pope-Carter is a Fellow of the London Geological Society, the chartered UK
body for geophysicists and geologists, as well as a member of GeoSIG, the CIfA Geophysics
Special Interest Group.
All MS managers have postgraduate qualifications in archaeological geophysics. All MS field
staff have relevant archaeology degrees and at least three years’ field experience.
3. Objectives The aim of the geophysical survey is summarised from the project proposal produced by Big
Heritage (Kirton, 2016):
The geophysical survey aimed to re-examine the excavation and interpretation of Professor
Newstead’s excavation of the site in the 1920’s and 30s using non-invasive survey methods.
The survey results will be used to better understand the character and preservation of the
Deanery Field, Chester MSSJ27 - Geophysical Survey Report
Magnitude Surveys Ltd 5 | P a g e
north eastern quarter of the Roman fort and contribute to an improved understanding of
Chester in the Roman and later periods.
With the geophysical investigations being undertaken as part of the Festival of Archaeology
2016, the survey work sought to facilitate public engagement with local residents and school
age children. This engagement allowed participants to get hands-on experience with a range
of geophysical techniques and learn the basic science behind the methods.
4. Geographic Background The underlying geology comprises Chester Pebble Beds Formation - Sandstone, Pebbly
(gravelly). No superficial deposits were recorded (BGS, 2016).
The soils consist of slowly permeable seasonally wet slightly acid but base-rich loamy and
clayey soils (Soilscapes, 2016). Historic England guidelines state the variability of success with
ground penetrating radar over wet and clayey soils depends on signal attenuation, which in
part is governed by how saturated the soils are (David et al., 2008).
The area was a flat field of short pasture bounded on the north and the east by Chester’s city
wall.
5. Archaeological Background The following archaeological background is summarised from the project proposal written by
Big Heritage (Kirton, 2016):
Previous excavations have taken place on the site of Chester’s Roman fort in the 1880’s, 1920s,
1930s and 1970’s. The original excavations uncovered approximately 20% of the site revealing
Roman barrack blocks from the 2nd century AD. The remainder of the site was assumed to
have been used for similar purposes. Projected site plans were created based on the known
excavated archaeology (barrack blocks). Further barrack buildings were added to the plan,
with their locations based on the location and alignment of the excavated barracks.
Subsequent investigations on the site have been intermittent. The last major intervention was
conducted between 1975-77, as part of a rescue-style investigation re-exploring the defensive
wall and interval tower of the city walls.
During the English Civil War, additional defences were raised along the perimeter of the city
walls during the Siege of Chester (1645-46). These defences may have impacted the north
eastern quarter of the Roman fort.
Deanery Field, Chester MSSJ27 - Geophysical Survey Report
Magnitude Surveys Ltd 6 | P a g e
6. Methodology Data Collection
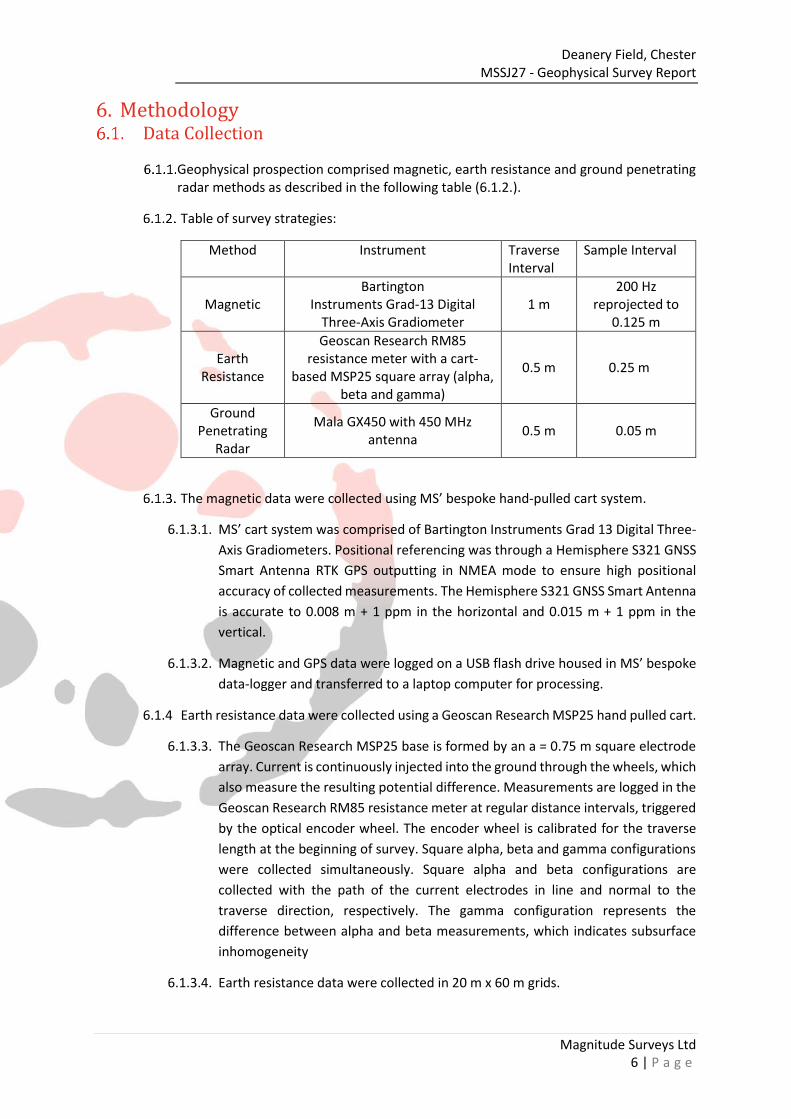
Geophysical prospection comprised magnetic, earth resistance and ground penetrating radar methods as described in the following table (6.1.2.).
Table of survey strategies:
Method Instrument Traverse Interval
Sample Interval
Magnetic Bartington
Instruments Grad-13 Digital Three-Axis Gradiometer
1 m 200 Hz
reprojected to 0.125 m
Earth Resistance
Geoscan Research RM85 resistance meter with a cart-
based MSP25 square array (alpha, beta and gamma)
0.5 m 0.25 m
Ground Penetrating
Radar
Mala GX450 with 450 MHz antenna
0.5 m 0.05 m
The magnetic data were collected using MS’ bespoke hand-pulled cart system.
6.1.3.1. MS’ cart system was comprised of Bartington Instruments Grad 13 Digital Three-
Axis Gradiometers. Positional referencing was through a Hemisphere S321 GNSS
Smart Antenna RTK GPS outputting in NMEA mode to ensure high positional
accuracy of collected measurements. The Hemisphere S321 GNSS Smart Antenna
is accurate to 0.008 m + 1 ppm in the horizontal and 0.015 m + 1 ppm in the
vertical.
6.1.3.2. Magnetic and GPS data were logged on a USB flash drive housed in MS’ bespoke
data-logger and transferred to a laptop computer for processing.
6.1.4 Earth resistance data were collected using a Geoscan Research MSP25 hand pulled cart.
6.1.3.3. The Geoscan Research MSP25 base is formed by an a = 0.75 m square electrode
array. Current is continuously injected into the ground through the wheels, which
also measure the resulting potential difference. Measurements are logged in the
Geoscan Research RM85 resistance meter at regular distance intervals, triggered
by the optical encoder wheel. The encoder wheel is calibrated for the traverse
length at the beginning of survey. Square alpha, beta and gamma configurations
were collected simultaneously. Square alpha and beta configurations are
collected with the path of the current electrodes in line and normal to the
traverse direction, respectively. The gamma configuration represents the
difference between alpha and beta measurements, which indicates subsurface
inhomogeneity
6.1.3.4. Earth resistance data were collected in 20 m x 60 m grids.
Deanery Field, Chester MSSJ27 - Geophysical Survey Report
Magnitude Surveys Ltd 7 | P a g e
6.1.5. Ground penetrating radar (GPR) data were collected using a Mala Ground Explorer
450 MHz antenna, hand pulled behind the user.
6.1.5.1 GPR data were collected along lines, using the system’s odometer wheel to
position sampling points. GPR data were collected in the grids established for the
earth resistance survey.
6.1.6. A series of temporary sight markers were established in each survey area to guide the
surveyor and ensure full coverage with the instruments. Grid corner canes were set
out using a Hemisphere S321 GNSS Smart Antenna RTK GPS which is accurate to 0.008
m + 1 ppm in the horizontal and 0.015 m + 1 ppm in the vertical.
Data Processing
Magnetic data were processed in bespoke in-house software produced by MS. Processing steps were limited to:
Sensor Calibration – The sensors were calibrated using a bespoke in-house algorithm, which conforms to Olsen et al. (2003).
Zero Median Traverse – The median of each sensor traverse is calculated within a specified range and subtracted from the collected data. This removes striping effects caused by small variations in sensor electronics.
Projection to a Regular Grid – Data collected using RTK GPS positioning requires a uniform grid projection to visualise data. Data are rotated to best fit an orthogonal grid projection and are resampled onto the grid using an inverse distance-weighting algorithm.
Interpolation to Square Pixels – Data are interpolated using a bicubic algorithm to increase the pixel density between sensor traverses. This produces images with square pixels for ease of visualisation.
Earth resistance data were processed in the standard commercial software package Geoplot v. 4.0. Earth resistance processing steps were limited to:
Despike—Erroneous measurements (“spikes”) due to high contact resistance or poor electrode-to-ground contact were corrected by analysing the mean of measurements in a specified window size and replacing measurements outside a defined threshold with the average measurement of neighbouring positions.
Interpolation to Square Pixels – Data were interpolated using a sin(x)/x algorithm to increase the pixel density between traverses. This produced images with square pixels for ease of visualisation.
GPR data were processed in the standard commercial software package ReflexW 3D. GPR Processing steps were limited to:
DC Shift – The waveform response for each traverse was centred to correct for striping
effects caused by small variations in sensor electronics and orientation.
Bandpass Filter – Frequencies outside the normal range of the measuring antennae
were filtered out to remove errors from external sources.
Deanery Field, Chester MSSJ27 - Geophysical Survey Report
Magnitude Surveys Ltd 8 | P a g e
Gain Adjust – A gain curve was manually calculated to account for signal attenuation
with depth. The gain adjust allows features at depth with a weaker signal to be
resolved at the same plotting scale as near surface features.
Hyperbola fitting – Manual fitting of hyperbola curves was conducted to calculate the
velocity of the wave. This allows the calculation of response depth from response
time.
Data Visualisation and Interpretation
The individual GPR radargrams have been stacked to form a three-dimensional cube of
measurements. Greyscales have been created by horizontally slicing the cube to
produce plan-view time-slices. Time-slices were initially considered in an animated GIF
form to analyse the three-dimensional extent of anomalies. For print purposes, three
representative time slices of “shallow,” “middle,” and “deep” soil volumes are
presented. The GIF is available on the archive disk.
The earth resistance alpha and beta configurations were averaged to reduce the
directional biases of the individual configurations. The gamma configuration is
presented separately to the averaged alpha and beta results, as it represents the
difference between the alpha and beta measurements. A single earth resistance
interpretation figure has been produced. This combined interpretation depicts
anomalies discernible in both the averaged and gamma greyscales.
This report presents geophysical results as greyscale images. Greyscale images have
been interpreted in a layered environment in consideration with satellite imagery and
historic mapping. Magnetic greyscale images should also be viewed alongside their
corresponding XY trace plots, while radar images should also be viewed alongside the
corresponding radargrams. XY trace plots and radargrams visualise the form of the
geophysical response, aiding in anomaly interpretation. XY trace plots and radargrams
can be found on the archive disk.
Deanery Field, Chester MSSJ27 - Geophysical Survey Report
Magnitude Surveys Ltd 9 | P a g e
7. Results Qualification
Geophysical techniques are not a map of the ground and are instead a direct measurement of subsurface properties. Detecting and mapping features requires that said features have properties that can be measured by the chosen technique(s) and that these properties have sufficient contrast with the background to be identifiable. The interpretation of any identified anomalies is inherently subjective. While the scrutiny of the results is undertaken by qualified, experienced individuals and rigorously checked for quality and consistency, it is often not possible to classify all anomaly sources. Where possible an anomaly source will be identified along with the certainty of the interpretation. The only way to improve the interpretation of results is through a process of comparing excavated results with the geophysical reports. MS actively seek feedback on their reports as well as reports of further work in order to constantly improve our knowledge and service.
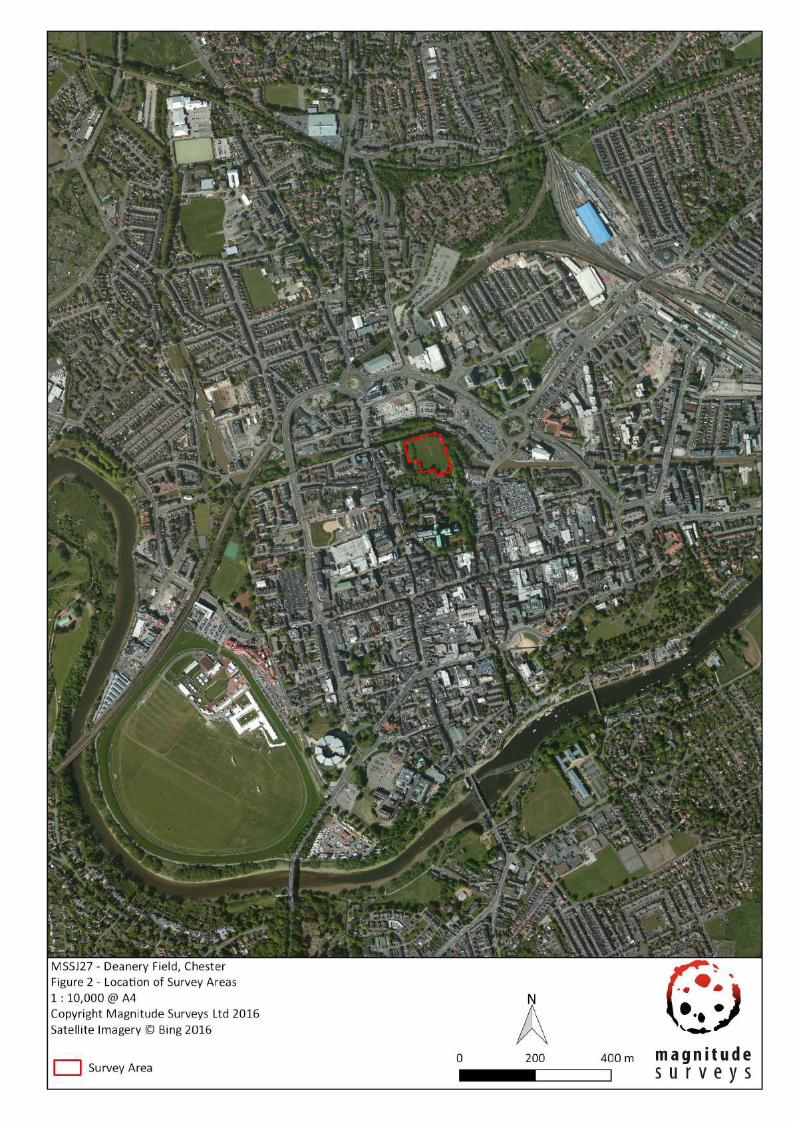
Survey Considerations
Survey Area
No. Survey Blocks
Surveyed Y/N
Ground Conditions Further notes:
1 1 Y Flat, short pasture. Deanery Field consists of one flat pasture field currently used for falconry shows. The benches used for the audience were moved for the survey.
2 1 Y Flat, short pasture. Also in Deanery Field, this narrow area is raised above the larger expanse. The lack of GPS coverage in this area prevented magnetic data collection.
Refer to Figure 2 for survey area locations.
Discussion
The geophysical results, both greyscale images and XY traces, were interpreted in
consideration with satellite imagery and the 1920s-1930s excavation plans. The
excavation plans have been georeferenced and serve as reference to better relate the
different geophysical methods to one another.
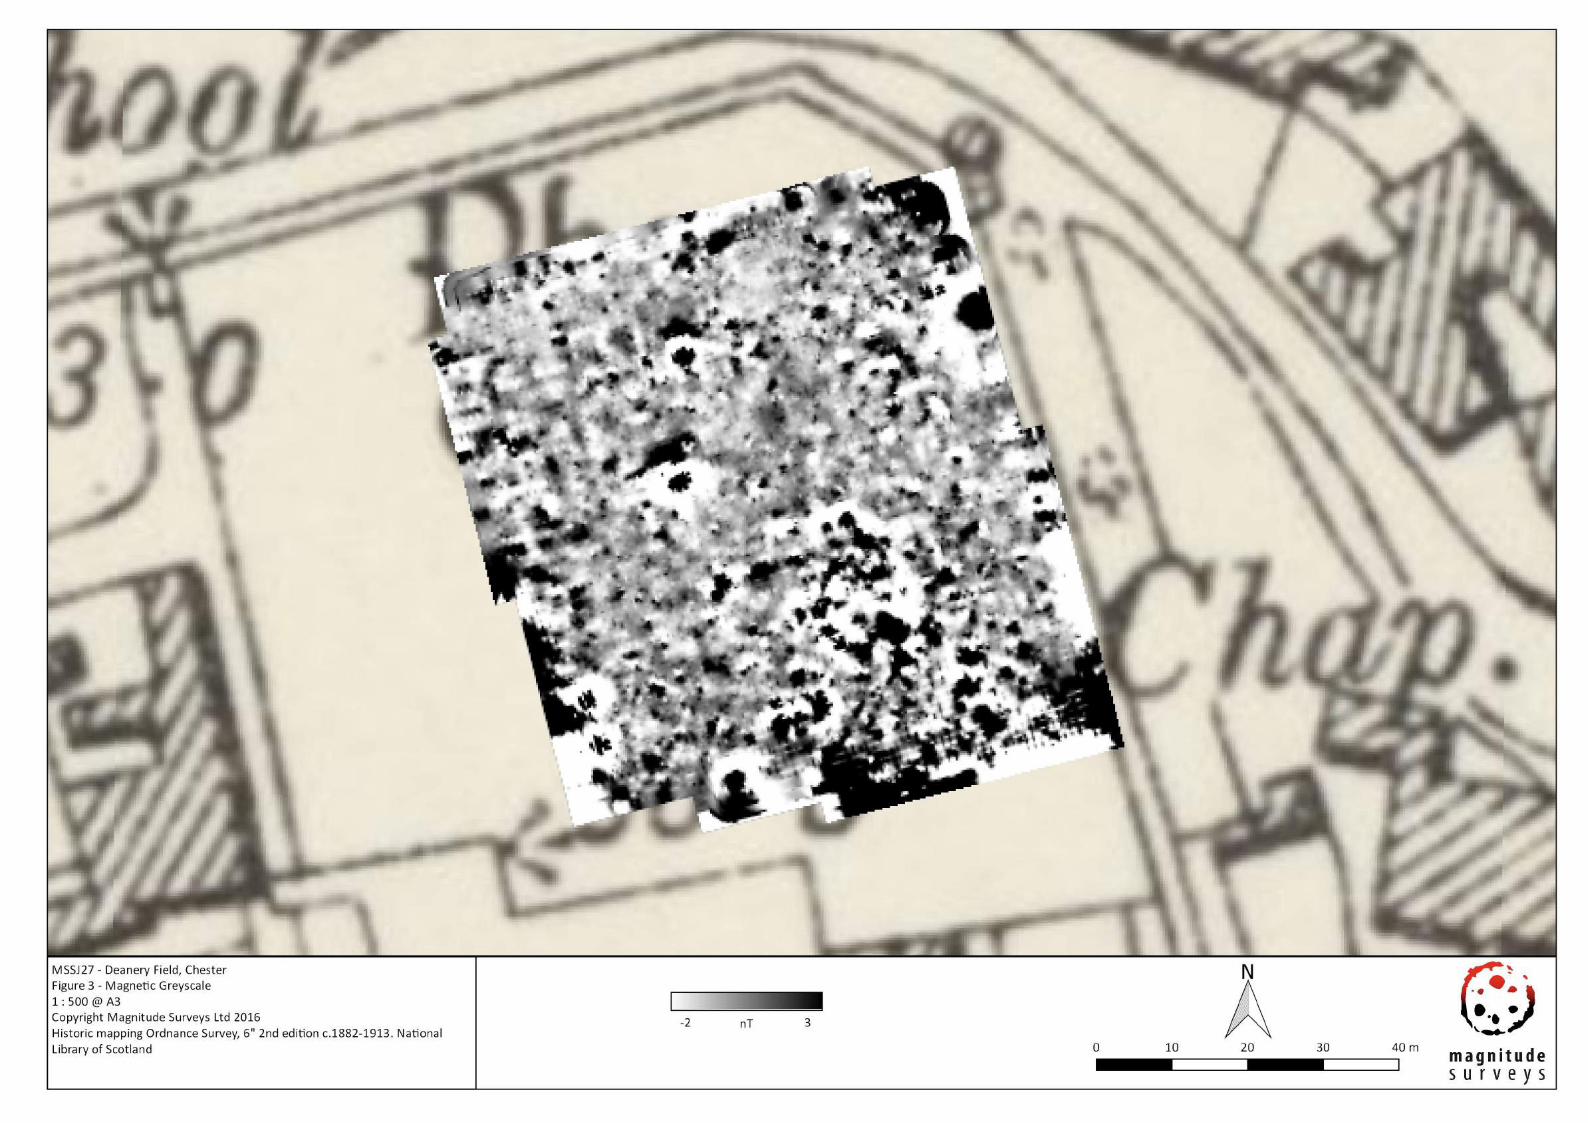
The magnetic survey has been the least effective geophysical method at Deanery Field.
The magnetic results reflect a large amount of modern, ferrous material distributed
across the site. The overwhelming response (“halo”) of this ferrous material will mask
any weaker, archaeological signals should they be present. These overshadowing halo
responses makes interpretation more difficult. Despite these issues, a number of
possible archaeological features have been identified in addition to some features of an
ambiguous origin.
The earth resistance survey has responded well to conditions at Deanery Field. The
gamma results in particular show numerous linear responses, whose alignment with the
excavation plans suggests a probable archaeological origin. By comparison, the
Deanery Field, Chester MSSJ27 - Geophysical Survey Report
Magnitude Surveys Ltd 10 | P a g e
combined alpha and beta results are less detailed, but still depict anomalies reflecting
archaeological activity. The majority of these probable archaeological features occur
within the extrapolated Blocks D and E on the excavation plan.
The GPR survey has been the most effective geophysical method at Deanery Field. The
GPR survey has produced successful results across various depths, and has added to the
number of responses categorised as probable archaeology. A distinct feature occurring
in the middle to deep time slices exhibits identical dimensions, alignment and internal
structuring to excavated barracks buildings. This feature extends between the
extrapolated Blocks D and E. Further linear anomalies appear to form features that likely
reflect structural remains. While further probable archaeology anomalies are in
alignment with the excavated buildings, many do not correlate with the extrapolated
barracks positions.
Interpretation
General Statements
7.4.1.1. Geophysical anomalies will be discussed broadly as classification types across the
survey area. Only anomalies that are distinctive or unusual will be discussed
individually. Specific anomalies discussed within the text have been assigned
numbers, which are emboldened within square parenthesis e.g. [1] for magnetic
results, [I] for earth resistance results and [A] for GPR results.
7.4.1.2. Undetermined – Anomalies are classified as Undetermined when the anomaly
origin is ambiguous through the geophysical results and there is no supporting or
correlative evidence to warrant a more certain classification. These anomalies are
likely to be the result of geological, pedological or agricultural processes--
although an archaeological origin cannot be entirely ruled out. Undetermined
anomalies are generally not ferrous in nature.
7.4.1.3. Ferrous (Discrete/Spread) – Discrete ferrous-like, dipolar anomalies are likely to
be the result of modern metallic disturbance on or near the ground surface. A
ferrous spread refers to a concentrated scattering of these discrete, dipolar
anomalies. Broad dipolar ferrous responses from modern metallic features, such
as fences, gates, neighbouring buildings and services, may mask any weaker
underlying archaeological anomalies should they be present.
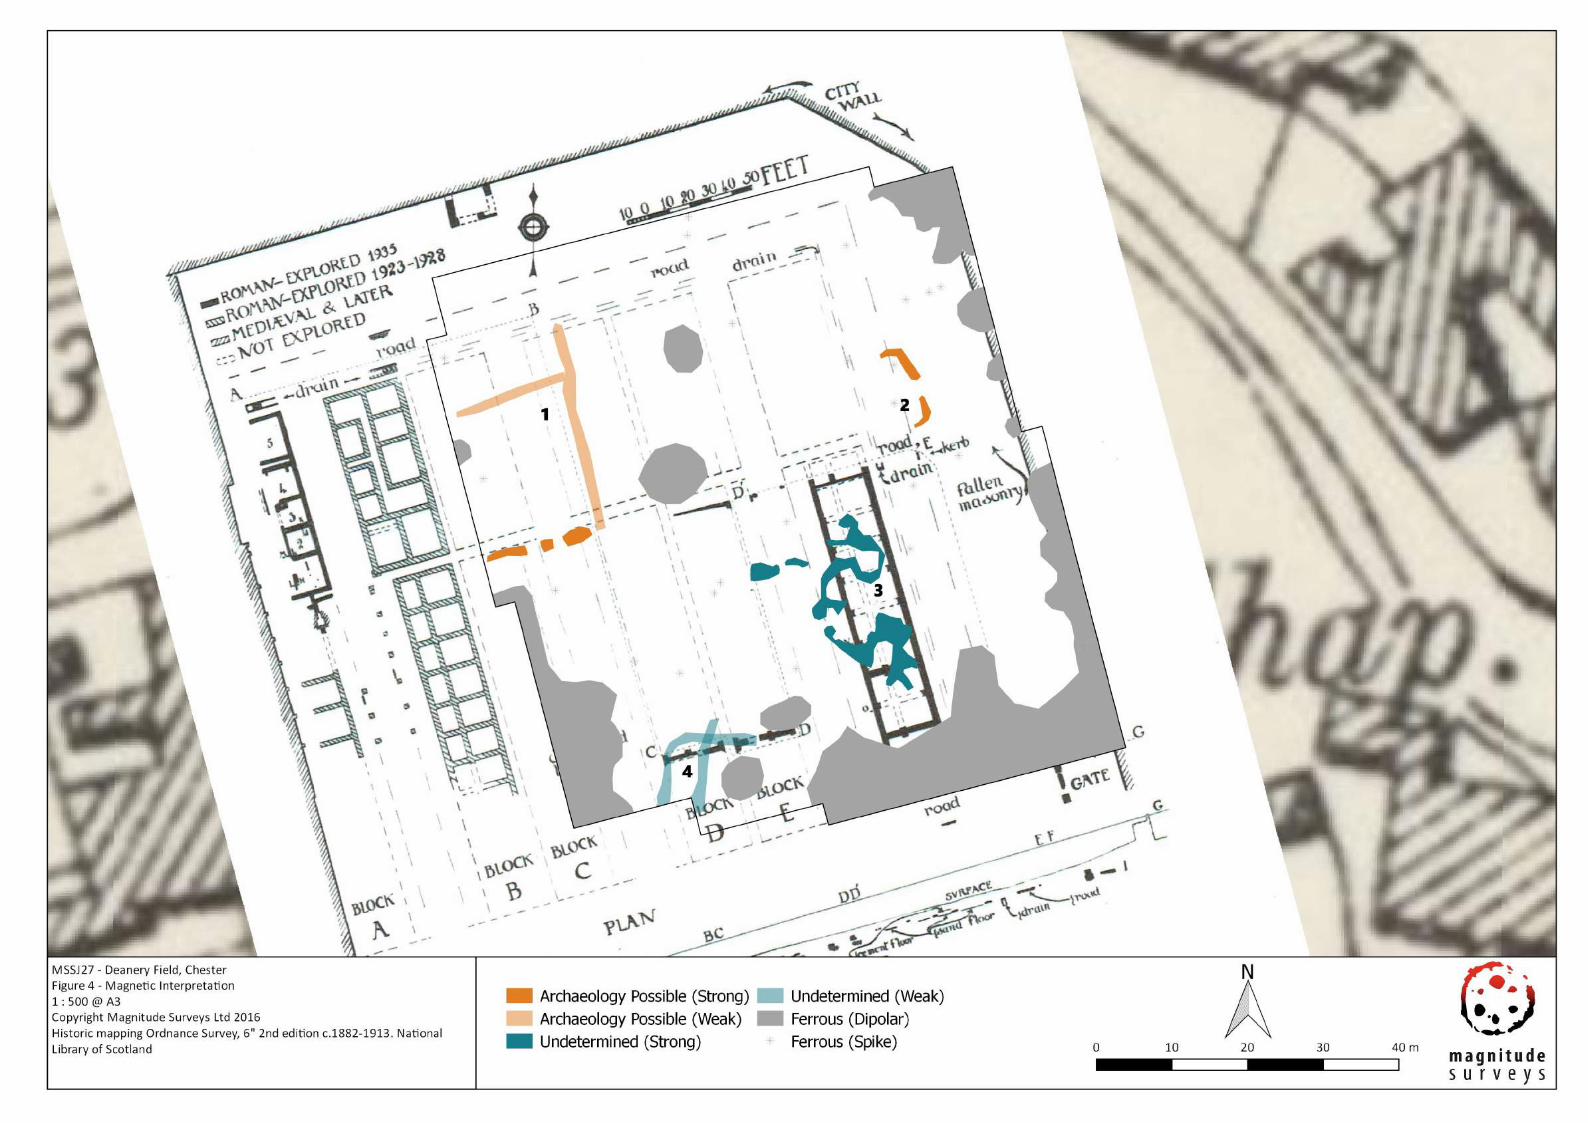
Magnetic Results - Specific Anomalies
7.4.2.1. Possible Archaeology – At the survey area’s western edge, two weak linear
anomalies and a series of small, strongly positive responses appear to form an
incomplete rectilinear feature [1] (Figure 4). No internal features are apparent in
the magnetic results. While this feature follows the alignment of the barrack
blocks on the excavation plans, it is larger in size than the recorded blocks.
Furthermore, this feature is poorly correlated to the other geophysical results.
The easternmost linear anomaly loosely corresponds with an anomaly in the GPR
results, but the GPR does not show any further anomalies that could be
Deanery Field, Chester MSSJ27 - Geophysical Survey Report
Magnitude Surveys Ltd 11 | P a g e
associated with this feature [1]. While the rectilinear form of [1] indicates a
potential archaeological origin, given the lack of correlation between the other
techniques, confidence in the archaeological interpretation is reduced.
7.4.2.2. Possible Archaeology – Towards the survey area’s eastern edge, a pair of strong,
linear magnetic anomalies [2] are along the same alignment as the barrack blocks
on the excavation plans. However, these anomalies [2] do not correlate with any
other possible or probable archaeology identified in the GPR or earth resistance
results.
7.4.2.3. Undetermined (Spread) – The area of disturbance highlighted on the
interpretation diagram [3] is an unusual response, not being typical of ferrous,
burnt or ditch-like anomalies. It has, therefore, been classified as Undetermined.
The location of this anomaly roughly corresponds with the current location used
during falconry shows, it is possible that the ring of benches usually placed here
(though moved for the survey) and repeated usage of this area has caused
disturbance to the topsoil. However, this anomalous spread occurs over the
excavated Block F, so may also potentially reflect soil disturbances relating to the
1935 excavation.
7.4.2.4. Undetermined – Two weak linear anomalies [4] that run parallel with each other
before intersecting have been classified as Undetermined. Their alignment is
offset from any probable or possible archaeology identified on the site. However,
given the presence of recorded archaeological features on site, an archaeological
origin cannot be entirely ruled out.
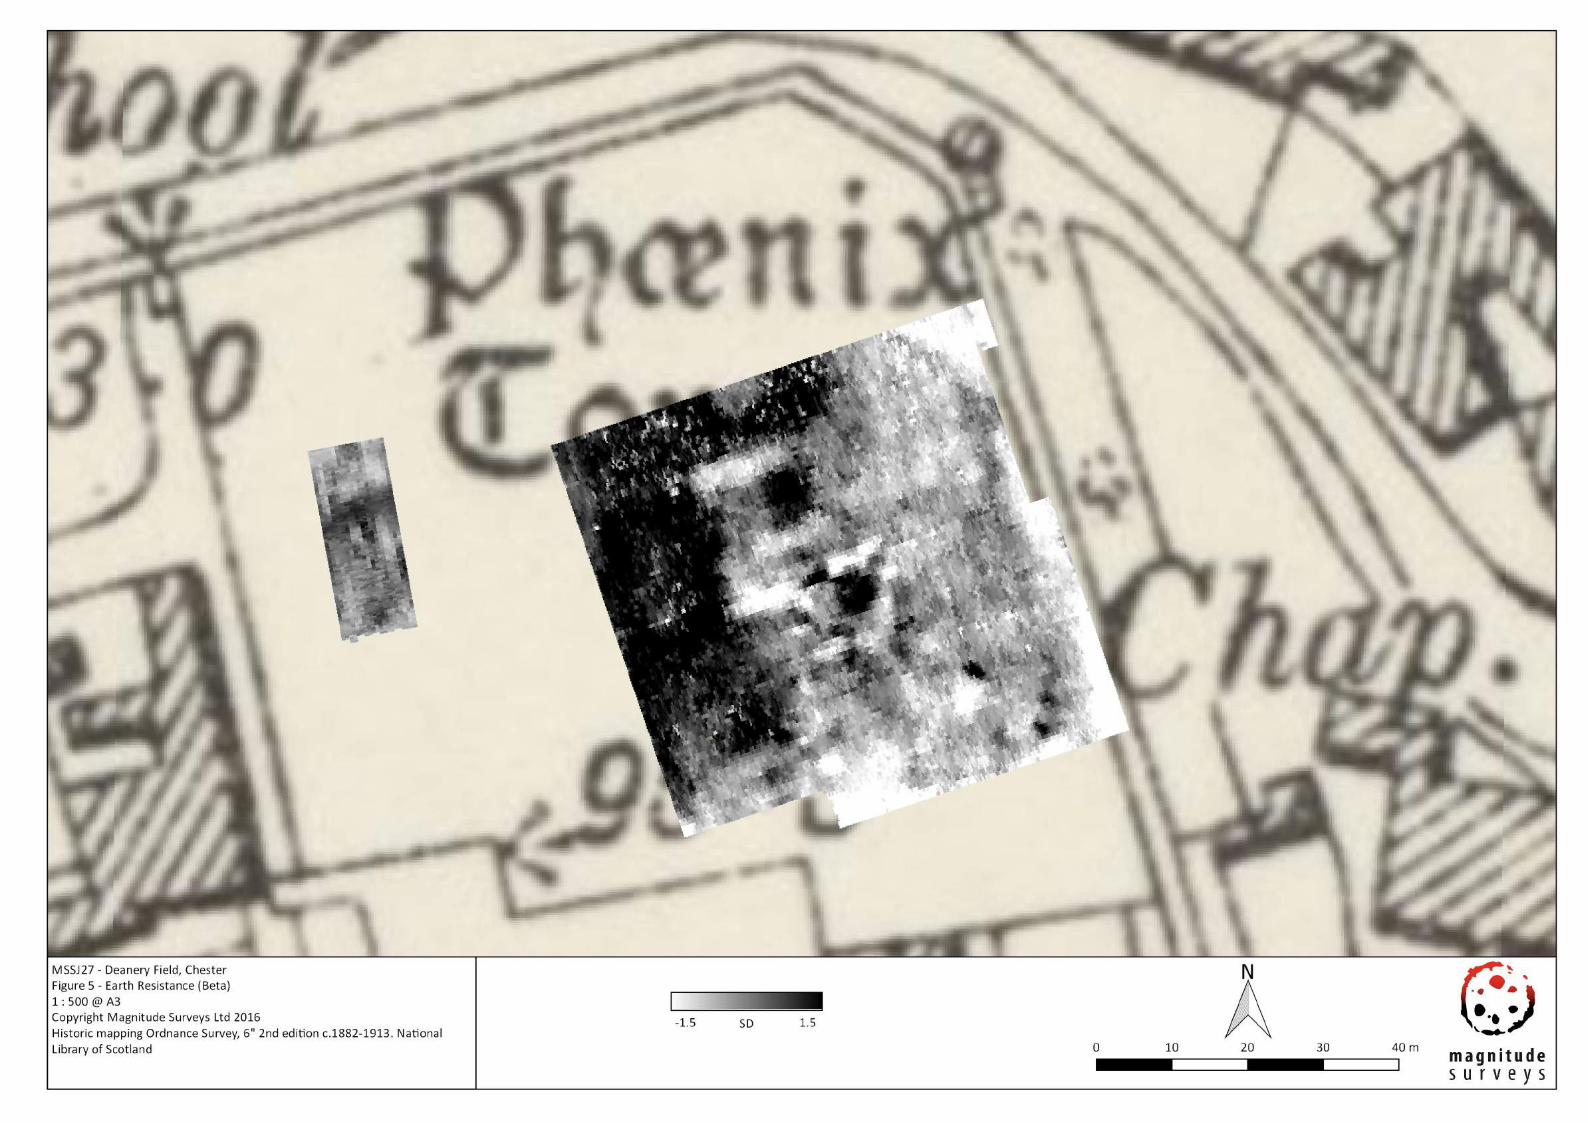
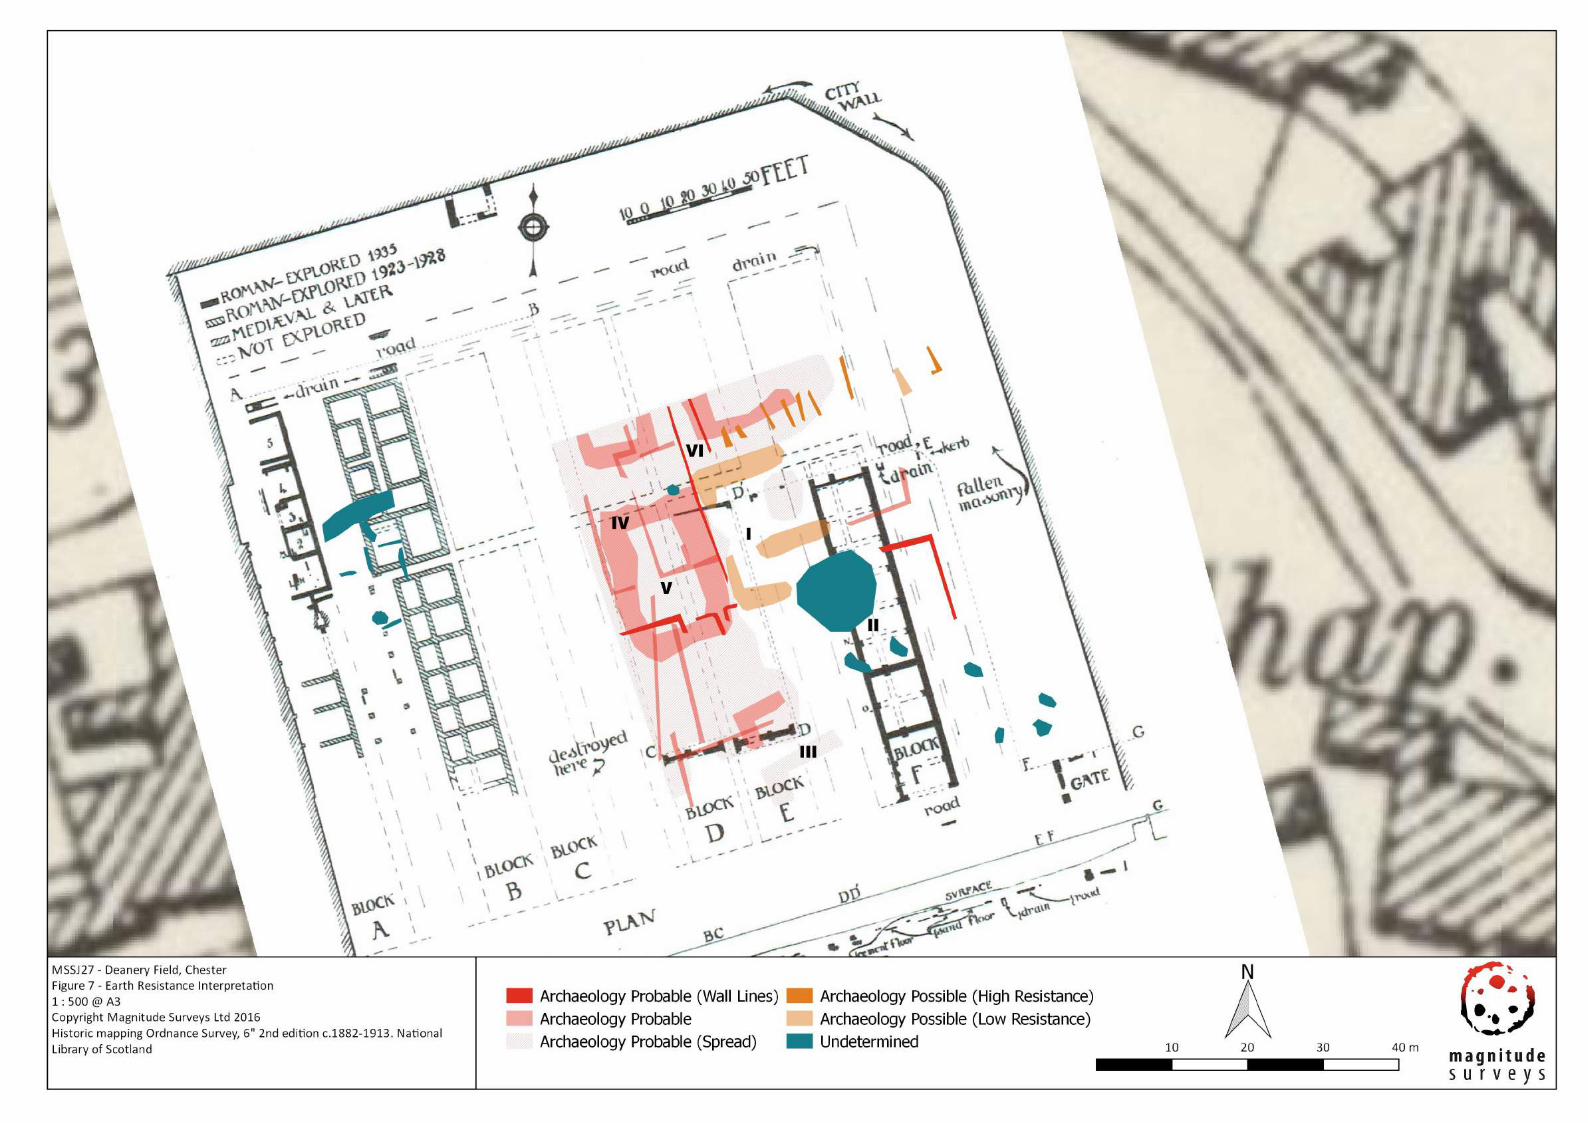
Resistance Results
Area 1:
7.4.3.1. Probable Archaeology (Rubble?) – The combined alpha and beta results (Figure
5) show a band of high resistance focused along the western extent of the survey
area, within the blocks D and E on the excavation plans. This band extends around
the survey area’s northern extent to approximately the midway point of the field.
The southern extent of this band terminates near features excavated in the
1920s. Given the magnitude of this band over the background values, this band
likely reflects a general spread of high resistance material, such as loose
archaeological rubble, foundations, or floors. This area does not occur with
excavation trenches; so therefore does not likely correlate with excavation
disturbances. Discrete, higher resistance linear anomalies [IV] can also be
identified through this band. These anomalies may relate to denser areas of
rubble or possible structural remains.
7.4.3.2. Probable Archaeology (Barracks?) – The gamma results (Figures 6,7) show linear
anomalies that correspond with the edges of the anomalies in the combined
alpha and beta results [VI]. The linear gamma anomalies have both parallel and
perpendicular orientation to one another [V]. These anomalies are in alignment
with the excavated barracks, which suggests these anomalies may be indicative
Deanery Field, Chester MSSJ27 - Geophysical Survey Report
Magnitude Surveys Ltd 12 | P a g e
of wall lines or feature edges. The majority of probable archaeological responses
identified in the gamma results fall within the band of high resistance visible in
the combined and alpha and beta results.
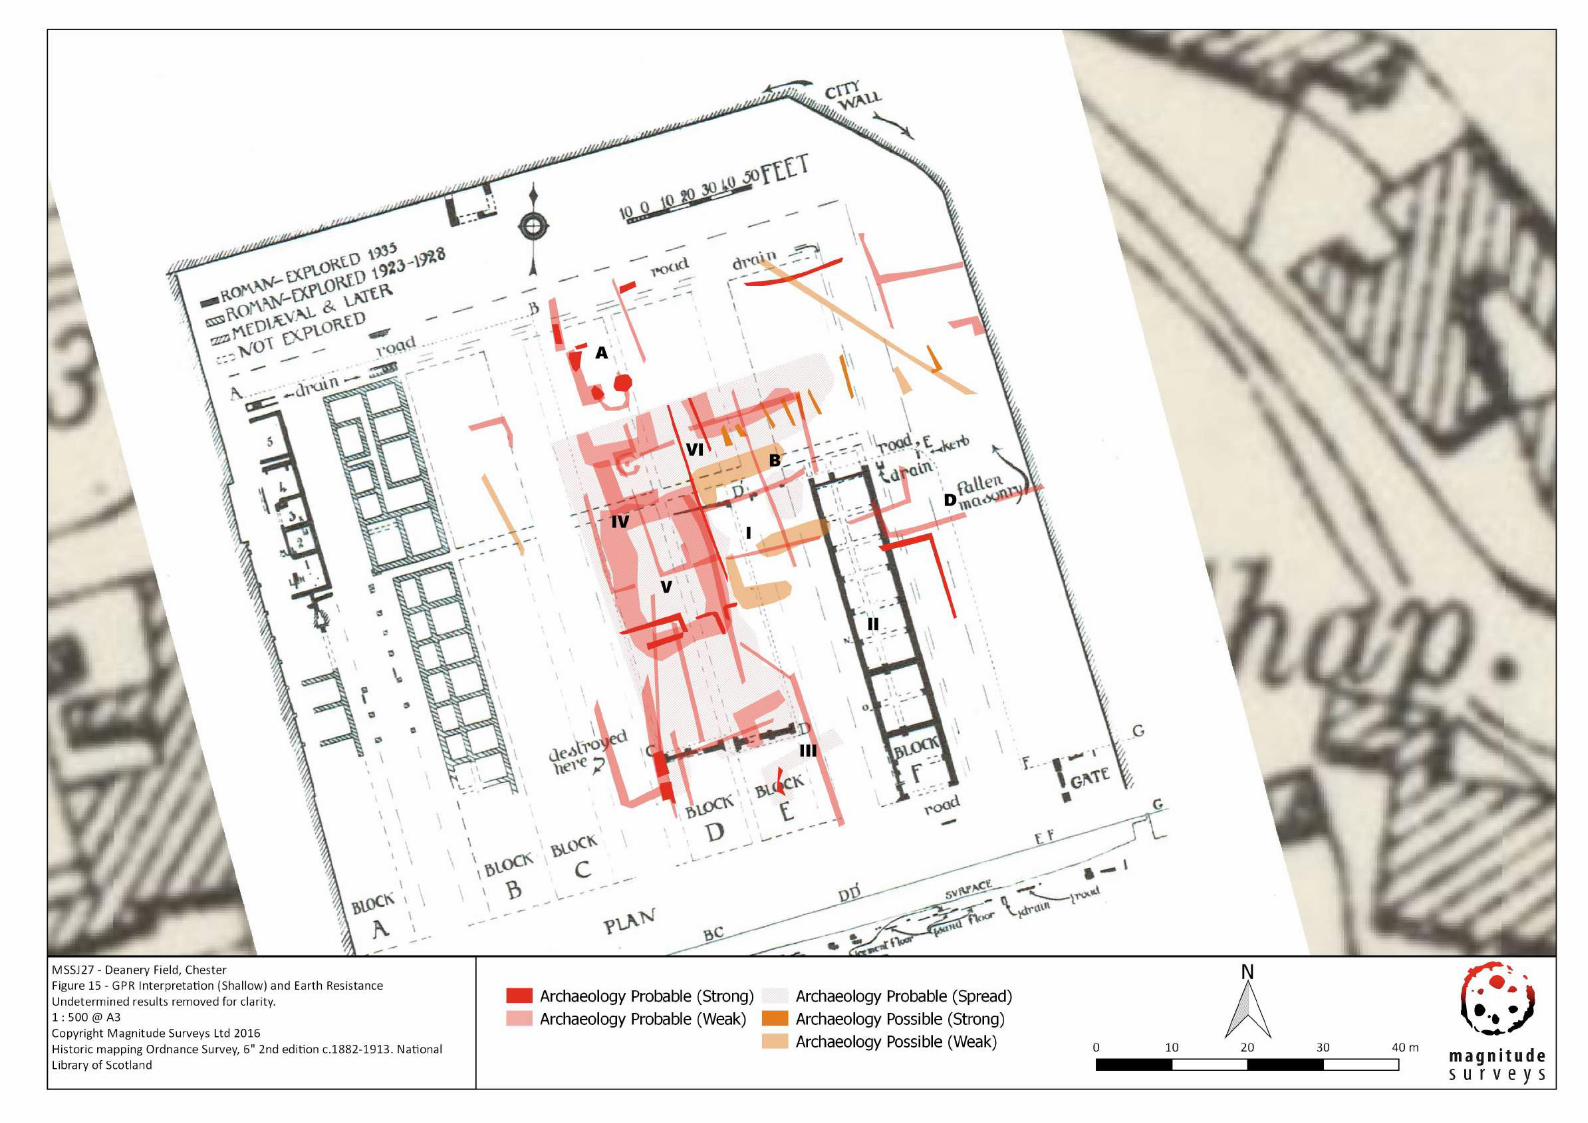
7.4.3.3. Possible Archaeology – A linear band of low resistance measurements [I] in the
combined alpha and beta results appear to form a semi-enclosed feature. These
anomalies correlate with linear anomalies shown in the shallow GPR
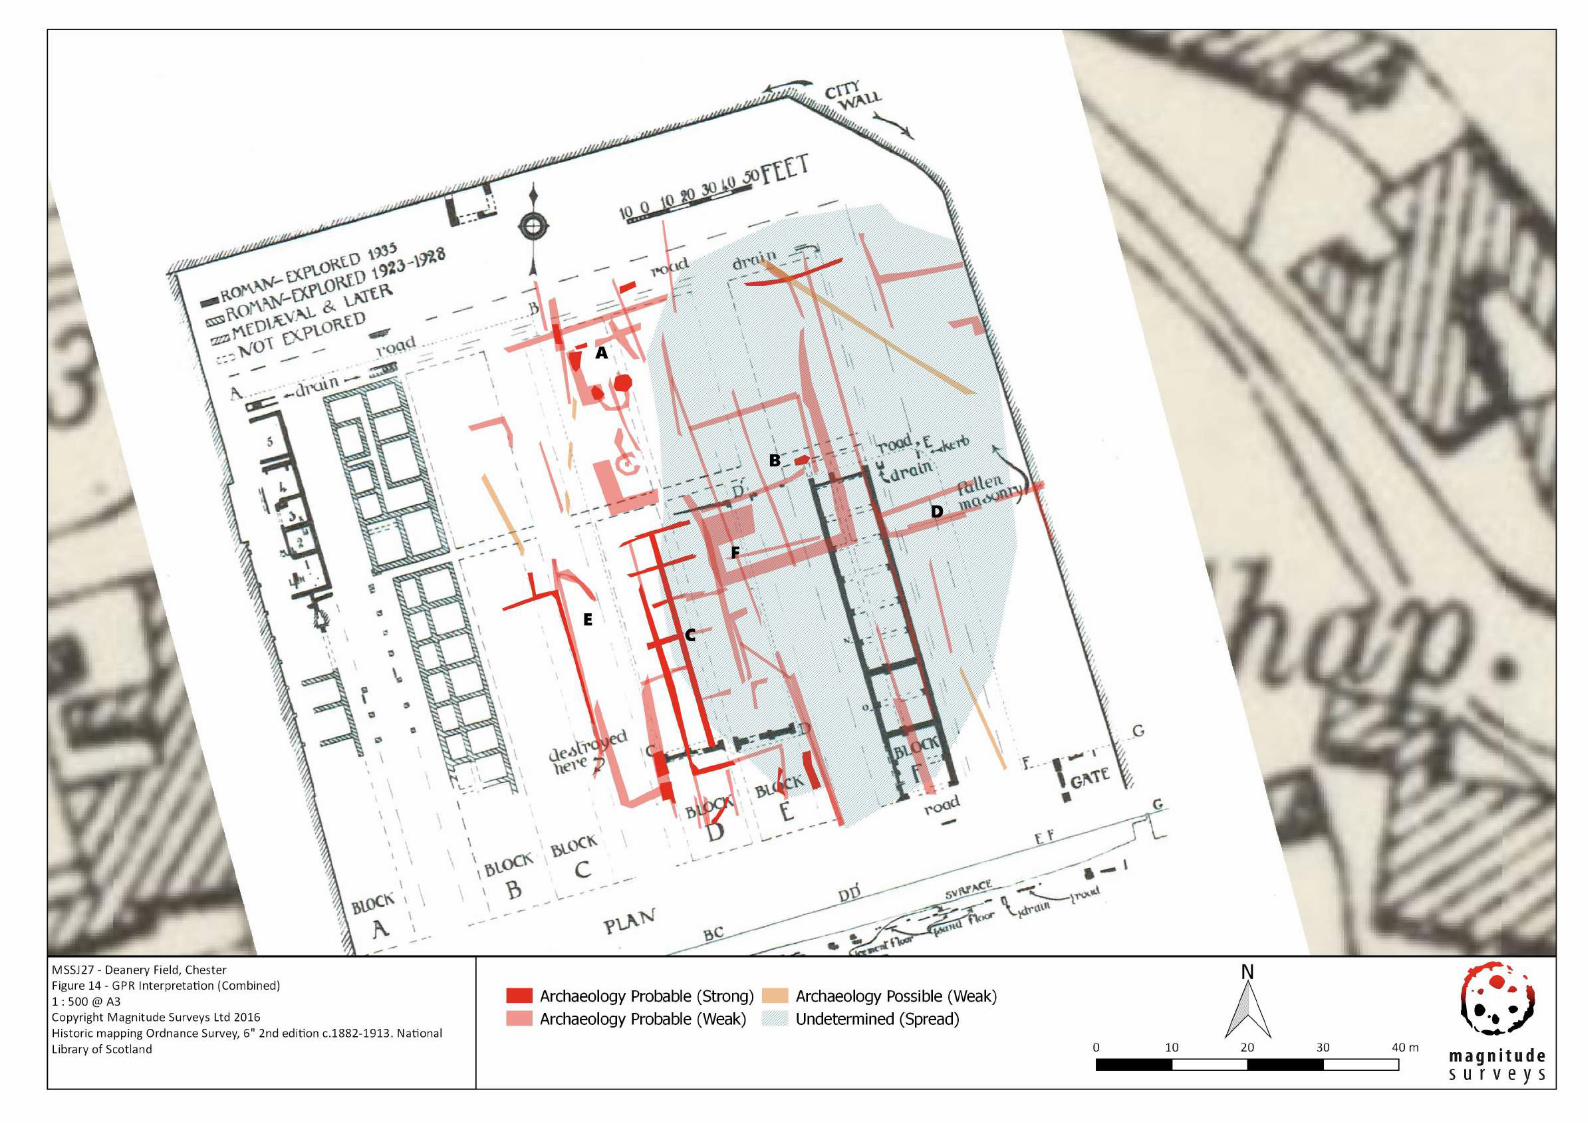
interpretation diagram [B] (Figure 9 & 15). These could be related to structural
components, although these would be expected to present strongly in earth
resistance data as high resistance values.
7.4.3.4. Possible Archaeology – A series of short, discrete linear anomalies in the survey
area’s northern edge are visible in the gamma data. These have been categorised
as Archaeology Possible because they share an alignment with the mapped
excavated blocks, but lack a coherent archaeological pattern.
7.4.3.5. Undetermined – In the centre of the survey area, a large, high resistance anomaly
and two smaller anomalies [II] are located with the disturbed area present in the
magnetic results [3]. The earth resistance and magnetic anomalies are therefore
likely to be caused by the same disturbance, which is postulated to be the
recurring use of the area for falconry shows and/or soil disturbances linked to the
excavation of Block F.
Area 2:
7.4.3.6. Undetermined - The small area to the west of the main field, Area 2, contains a
number of anomalies of an ambiguous origin. This area has been previously used
as a tennis court and has been the location of previous archaeological
excavations. As a result of these disturbances, these anomalies potentially reflect
modern activity instead of an archaeological feature.
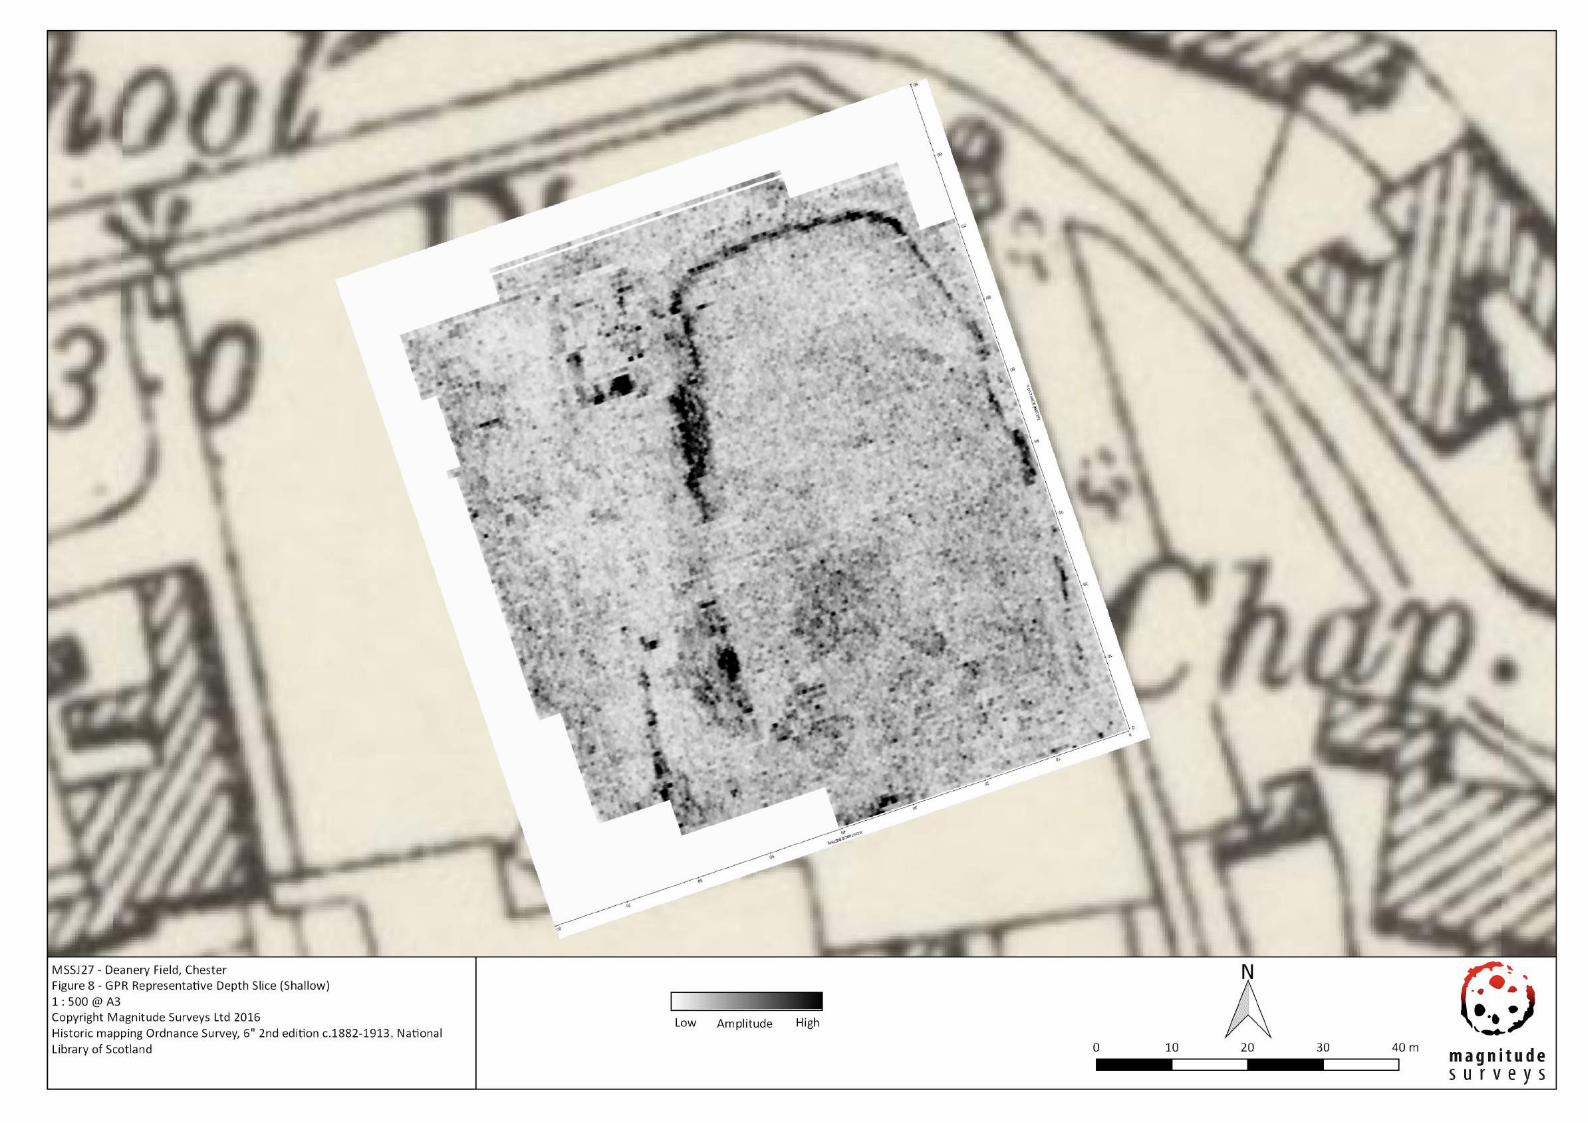
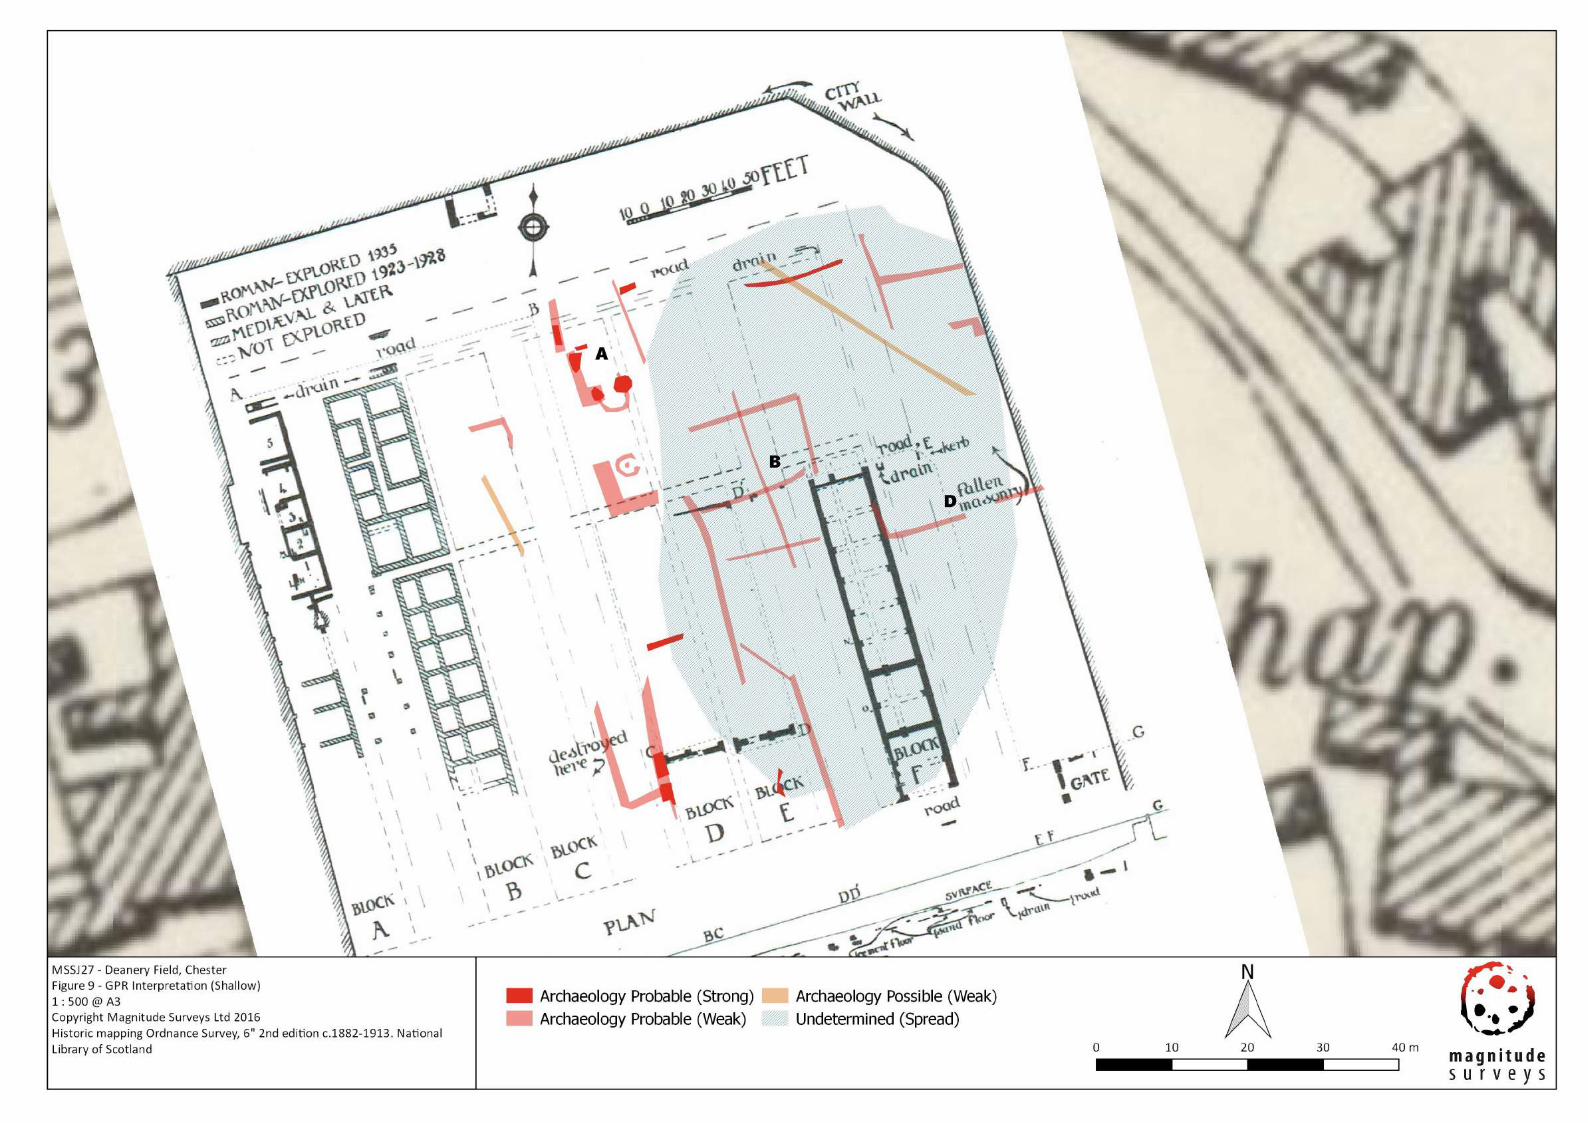
Ground Penetrating Radar Results
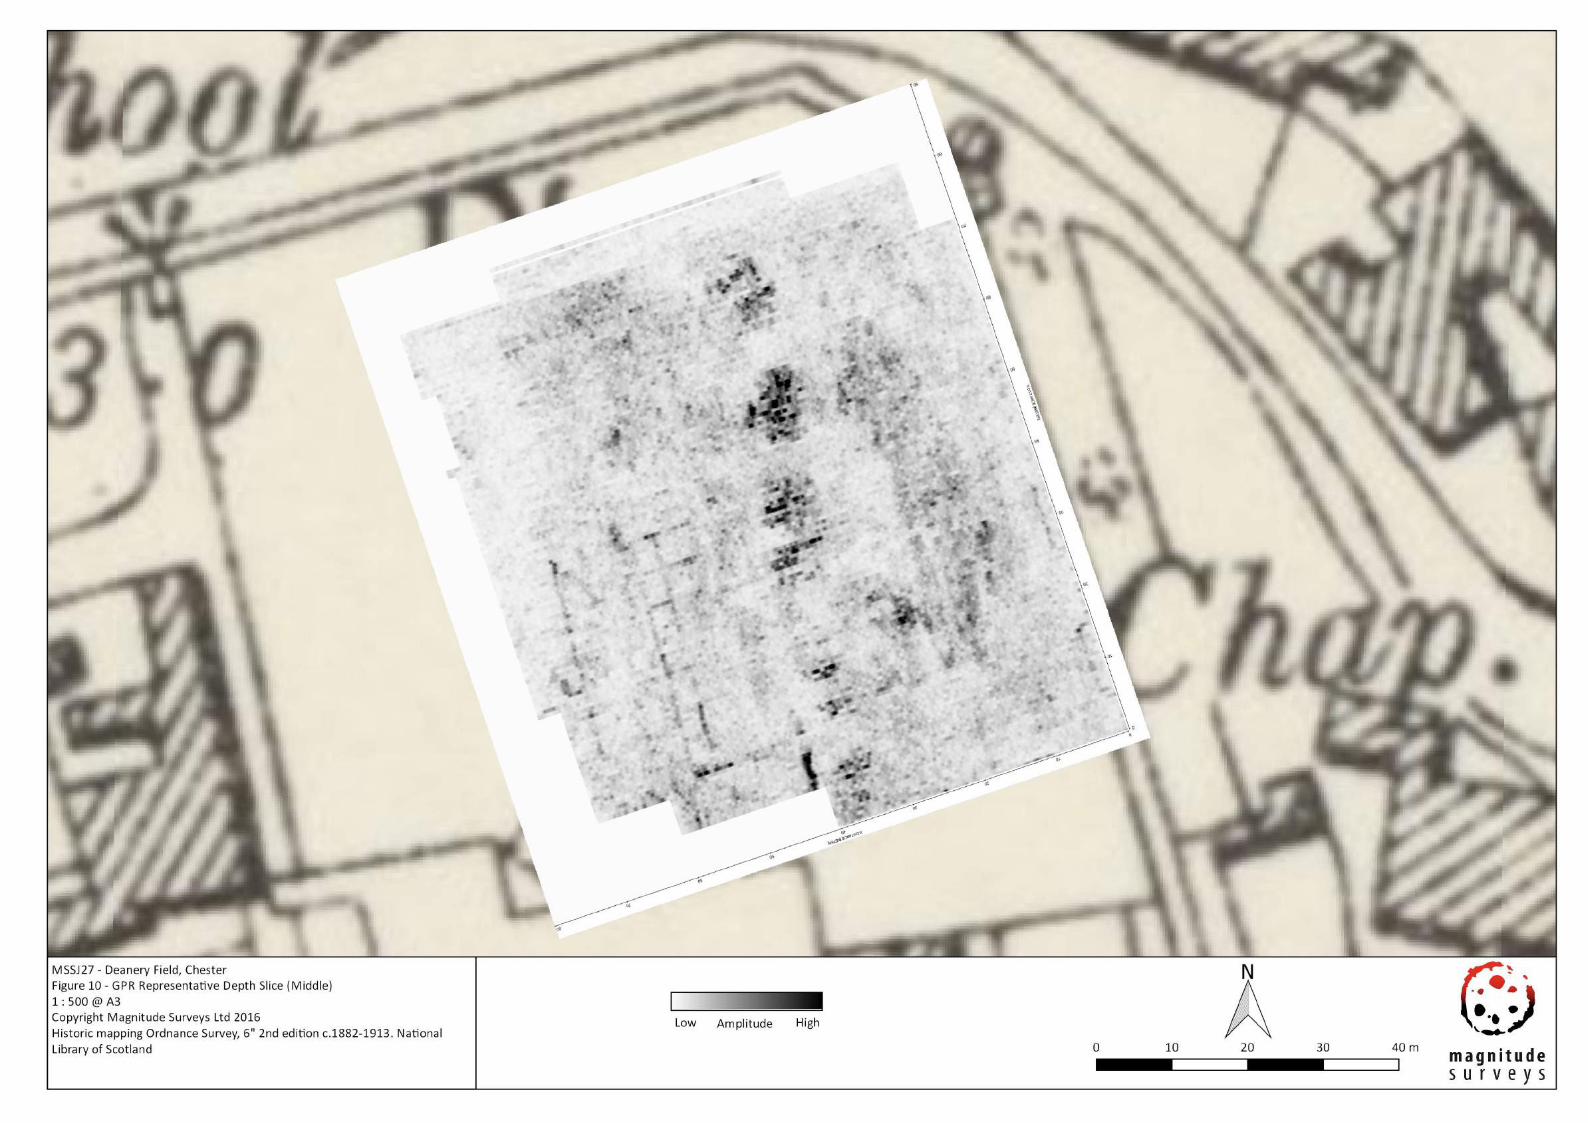
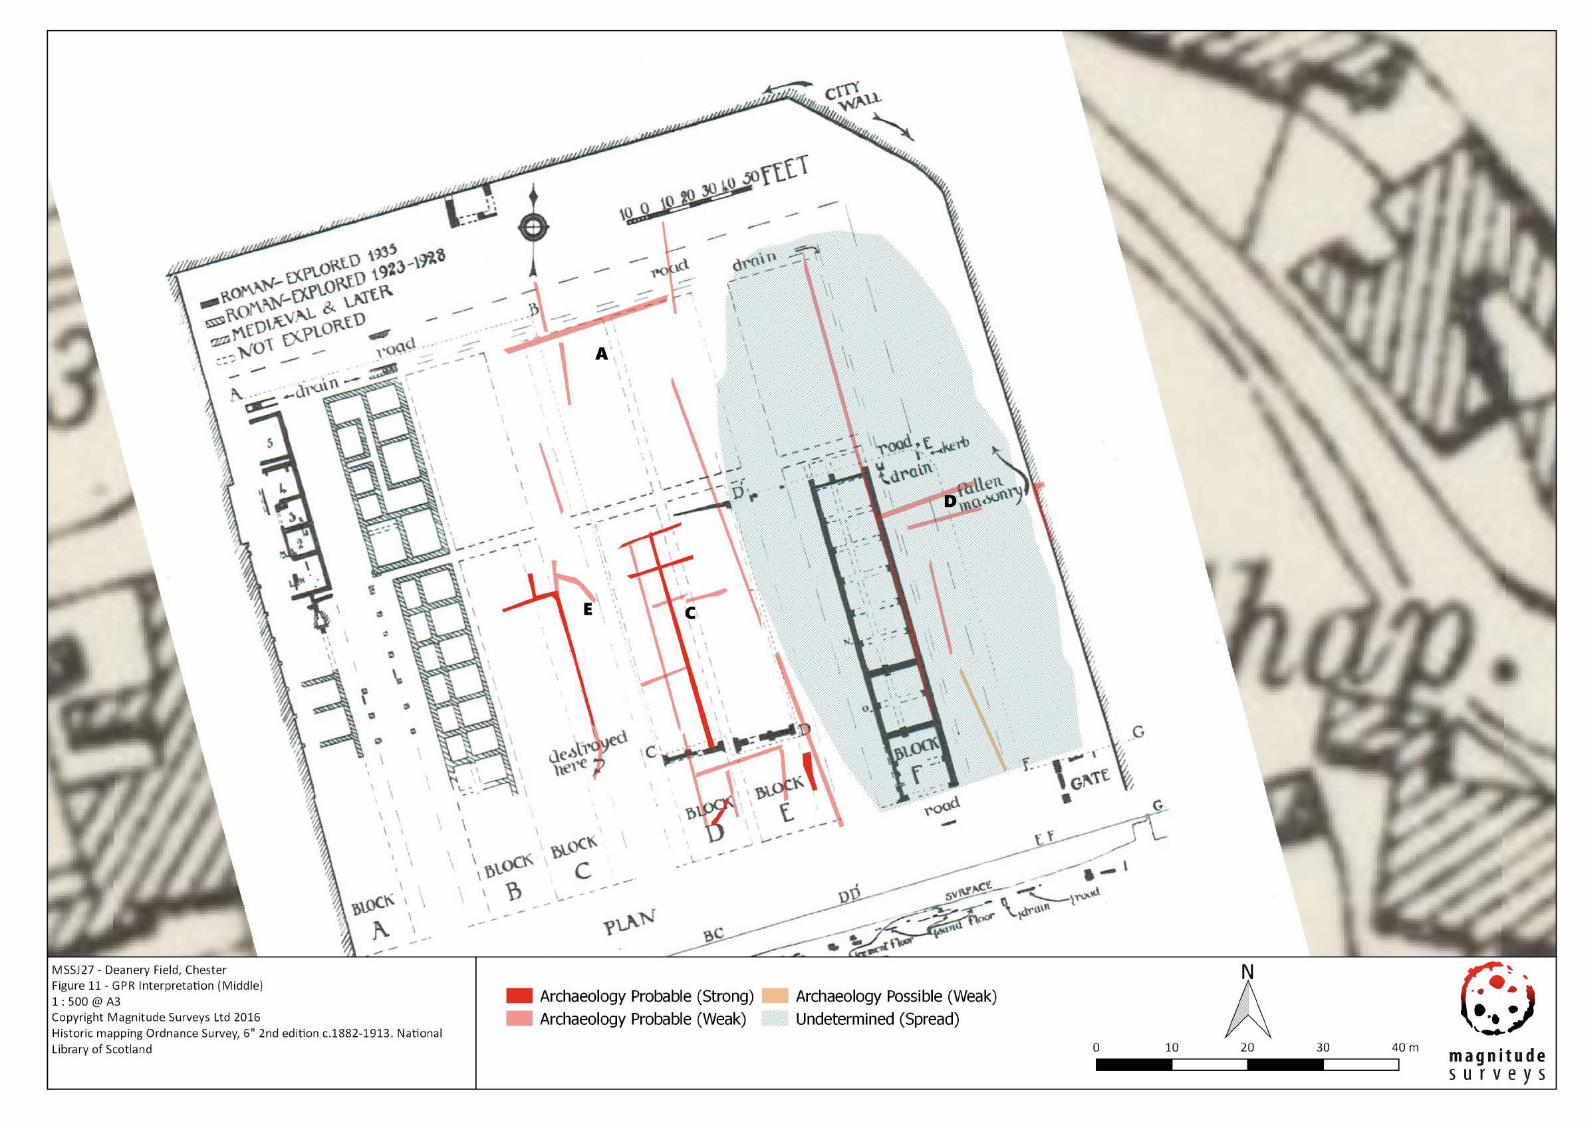
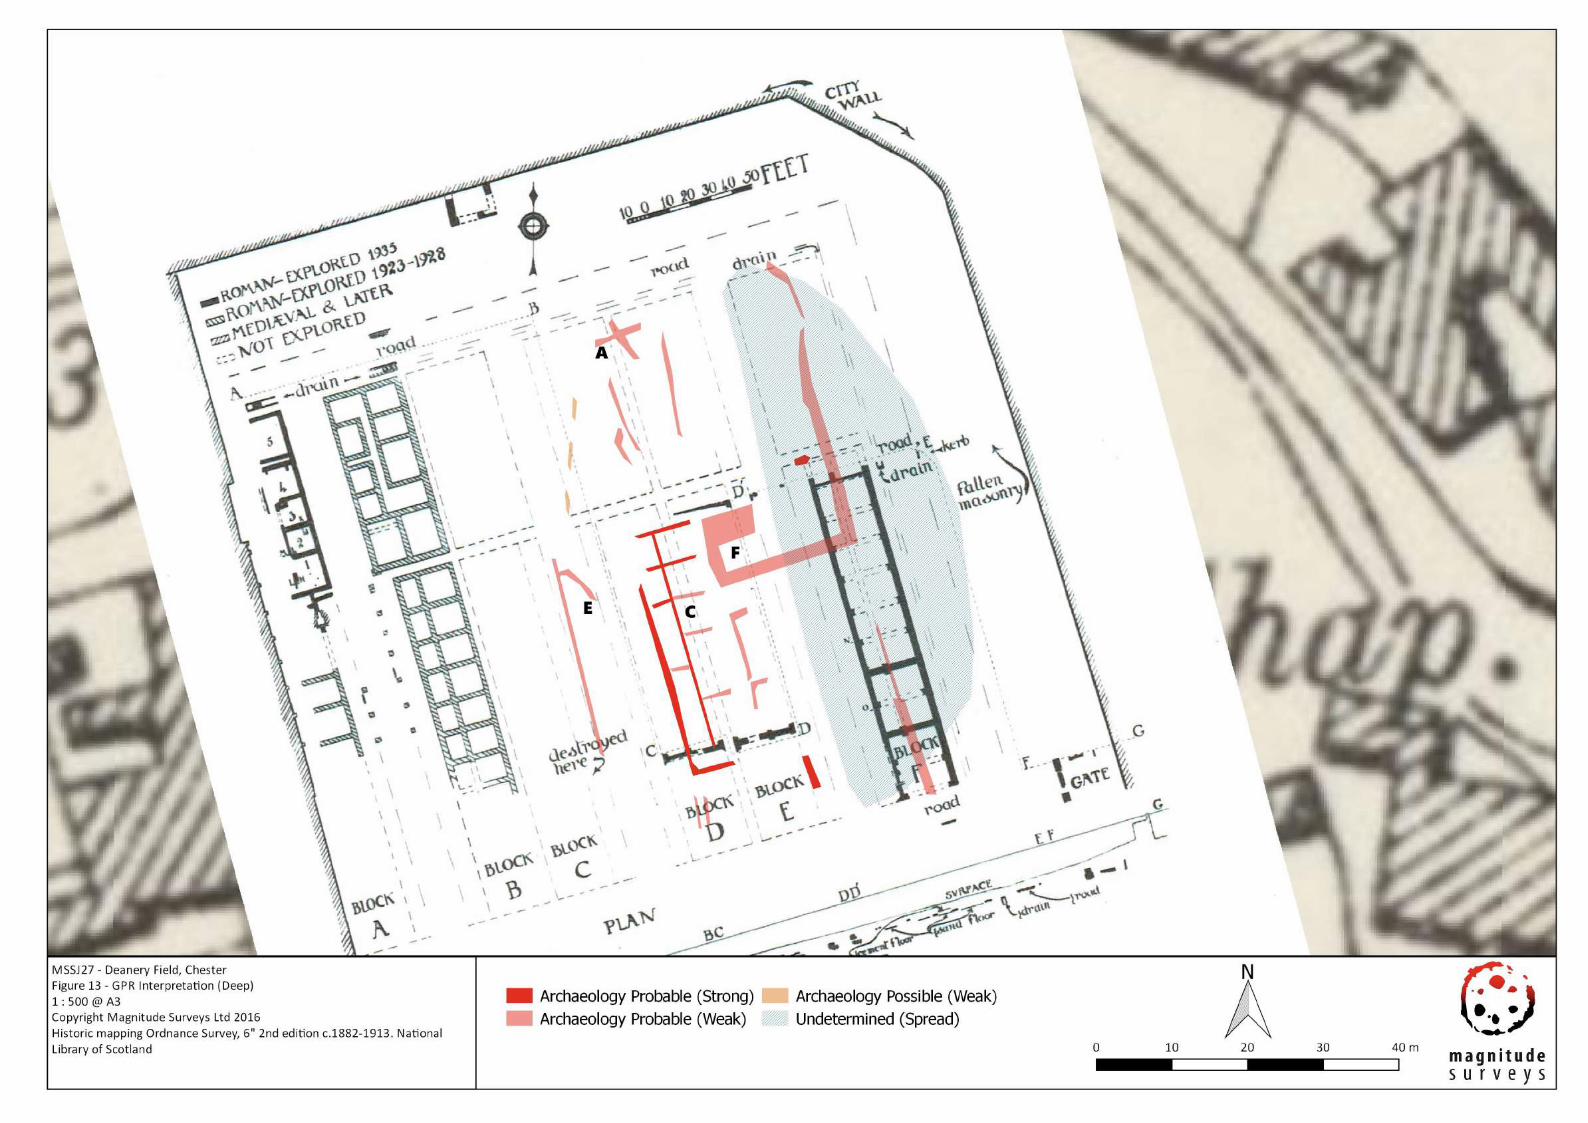
7.4.4.1. Probable Archaeology (Barracks?) – A number of linear anomalies form to
comprise feature [A]. Its presence is mainly detectable in shallow depth slices,
though middle and deep slices add to its size and structure. Feature [A] has good
alignment with the orientation of the excavated barracks buildings. Furthermore,
[A] fits within the anticipated extent of the northernmost Block B structure
denoted on the 1930s excavation plans; although its internal structure differs
from the excavated buildings.
7.4.4.2. Probable Archaeology (Barracks?) – Weak linear anomalies, which cross the area
of low resistance [I] (see 7.4.3.3.), are visible only in the shallow depth slices.
These anomalies have parallel and perpendicular alignment to each other and
may represent wall lines [B]. The orientation of these linear anomalies matches
that of the barracks shown in the excavation plans, although their spacing is
larger than the estimated barracks sizes for this area, derived from the original
excavations.
Deanery Field, Chester MSSJ27 - Geophysical Survey Report
Magnitude Surveys Ltd 13 | P a g e
7.4.4.3. Probable Archaeology (Barracks?) – In the middle and deep time-slices, a series
of linear anomalies appear to form a feature that matches almost perfectly with
the plan of an excavated barracks. Feature [C] has the length, width, and internal
structuring of the excavated barracks, but is off centred from the extrapolated
plans (Block D).
7.4.4.4. Probable Archaeology – Weak linear anomalies [D] near the eastern edge of
Deanery Field follow the alignment of archaeology denoted on the excavation
plans of the site. Though these anomalies do not form a clear structure, their
alignments suggests they likely represent a larger expanse of archaeological
remains.
7.4.4.5. Probable Archaeology – Anomaly [E] is visible to the western edge of the survey
area as a strong linear in the middle depth slices, and partially visible as a weaker
linear in the deeper depth slices. This anomaly is categorised as probable
archaeology because it runs parallel to the potential barracks features and has
the dimensions to form part of another barracks building.
7.4.4.6. Probable Archaeology – In the deep slices, anomaly [F] forms an incomplete
rectilinear feature. [F] is broader than many of the other discrete linear
anomalies and its dimensions are much larger than the size of the mapped
barracks. Interestingly the shallow depth anomaly [B] is a good fit inside [F]
(Figure 14). Without further investigation it is difficult to say if the two features
are related, perhaps indicating a building; or if the alignment is purely
coincidental.
7.4.4.7. Possible Archaeology – Isolated linear anomalies, which are offset from the
alignment of the excavated structures, have been given the category of possible
archaeology.
7.4.4.8. Undetermined – A large spread of undetermined origin is present throughout the
dataset. At its largest, in the shallowest depth it covers half of the survey area,
this is shown in the shallow depth interpretation diagram, going deeper this
anomaly decreases in size. Only in the deepest of depth slices is this anomaly
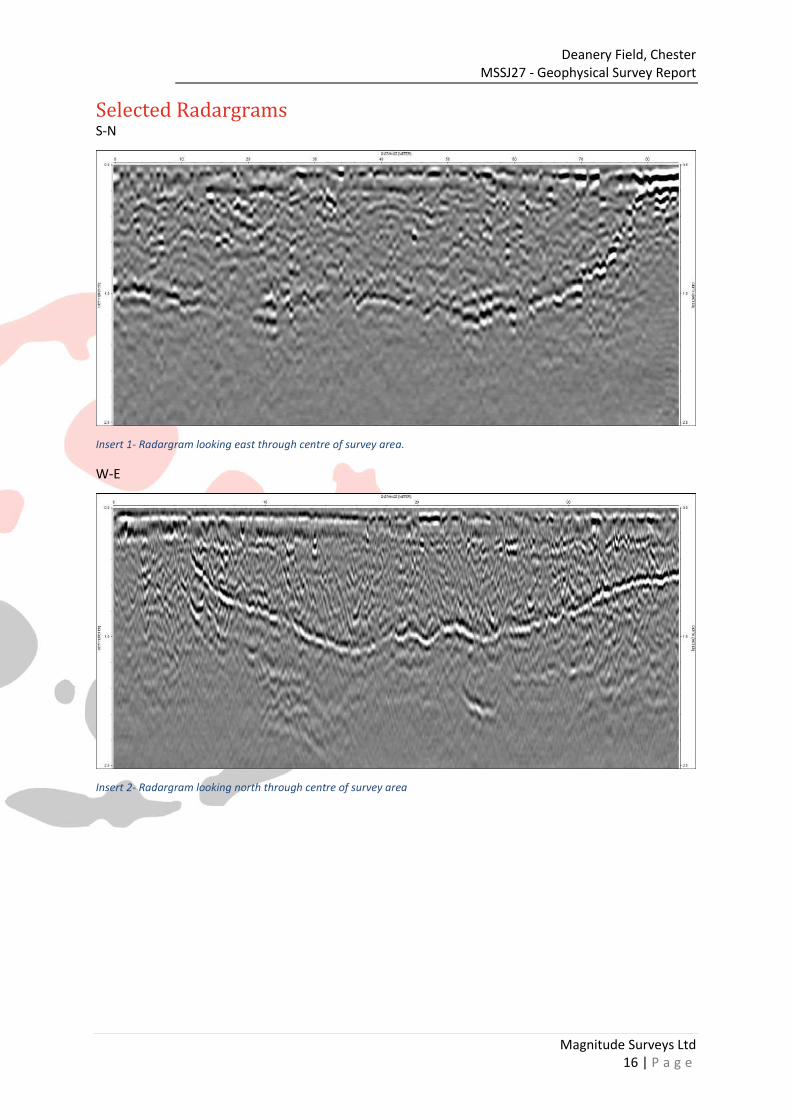
completely absent. Profiles through this anomaly can be seen in Insert 1 and
Insert 2 showing the size and form. Unusually for an anomaly of this size it does
not appear in the magnetic or earth resistance data. Excavation plans from the
1920s and 30s suggest that the land surface at the time was not flat and this
anomaly could be the result of modern landscaping.
8. Conclusions The geophysical survey has detected many anomalies of probable archaeological origin. These
anomalies are in alignment with the mapped Roman barrack features uncovered by
excavations in the 1880s, 1920s and 30s. A particular feature, [C] in the GPR results, has the
identical dimensions, alignment and internal structuring as the excavated barracks buildings.
Feature [C] and many of the other archaeological anomalies extend outside of the original
excavation areas, revealing more than was previously known about the site.
Deanery Field, Chester MSSJ27 - Geophysical Survey Report
Magnitude Surveys Ltd 14 | P a g e
The magnetic method was the least informative geophysical method for the archaeology on
site. The high level of ferrous debris across the survey area has disrupted the results, possibly
masking weak responses. Therefore, interpretation of the magnetic results is less certain,
which has resulted in many anomalies being classified as Undetermined.
The earth resistance method has detected numerous responses of probable archaeological
origin. The alpha and beta results identify a spread of high resistance material primarily in
Blocks D and E on the excavation plans. The majority of probable archaeology anomalies in
the gamma and GPR results are located in this area. The gamma results highlight feature
edges, which are less explicit in the alpha and beta results. These gamma anomalies match
the alignment of mapped excavated features and likely represent structural remains, possibly
wall lines.
The GPR method has been the most successful method for identifying archaeological features
at this site. The middle and deep time slices reveal a feature whose shape, size and internal
structuring matches perfectly with the plans of excavated barracks blocks. This feature [C] is
located in Block D, an area that has not been excavated. The GPR results also show many other
linear anomalies that align with excavated features, but none of these features have as
coherent a form as feature [C] does. Feature [A] correlates with the northernmost building of
Block D, but the GPR does not resolve internal structuring that maps the other excavated
buildings. This may indicate that this structure differs to the projected plan. A further area of
anomalies within the GPR produce a plan that does not match the projections based on the
known excavations, anomalies B & F when viewed together is both shorter and broader than
the barrack blocks, and also appears off the expected alignment. Whether this indicates a
building that is different to that expected or a groups of features that are not contemporary
with the fort cannot be known without further investigation.
Undetermined magnetic [3] and resistance [II] anomalies correlate with the current location
of benches for the falconry show. This modern activity could have caused these responses.
The large spread of undetermined responses identified through the GPR survey is of an
uncertain origin.
The results of the survey have successfully identified further archaeological features adding
greater detail to the known picture of the fortress. The group of anomalies [C] correlate
extremely well with what has already been excavated nearby. However, anomalies [A & B]
may indicate that the plan of the fort is not as simple as the projections may infer. Further
archaeological investigation of these three sets of anomalies would clarify what has been
identified within the results of the geophysics and add greatly to the understanding of the
development of the fortress.
9. Archiving MS maintains an in-house digital archive, which is based on Schmidt and Ernenwein (2013).
This archive stores unprocessed and processed data.
MS contributes all reports to the ADS Grey Literature Library subject to any time embargo
dictated by the client.
Deanery Field, Chester MSSJ27 - Geophysical Survey Report
Magnitude Surveys Ltd 15 | P a g e
Whenever possible, MS has a policy of making data available to view in easy to use forms on
its website. This can benefit the client by making all of their reports available in a single
repository, while also being a useful resource for research. Should a client wish to impose a
time embargo on the availability of data, this can be achieved in discussion with MS.
10. Copyright Copyright and the intellectual property pertaining to all reports, figures, and datasets
produced by Magnitude Services Ltd. is retained by MS. The client is given full licence to use
such material for their own purposes. Permission must be sought by any third party wishing
to use or reproduce any IP owned by MS.
References British Geological Survey, 2016. Geology of Britain. [Chester, Cheshire].
[http://mapapps.bgs.ac.uk/geologyofbritain/home.html/]. [Accessed 29/07/2016].
Charted Institute for Archaeologists, 2014. Standards and guidance for archaeological geophysical
survey. CIfA.
David, A., Linford, N., Linford, P. and Martin, L., 2008. Geophysical survey in archaeological field
evaluation: research and professional services guidelines (2nd edition). Historic England.
Google Earth, 2016. [Chester, Cheshire]. 53˚11’37.26”N, 2˚53’27.05”W. ©Google. [Accessed
29/07/2016]
Kirton, J., 2016. Project Proposal: Waking the Legions, Deanery Field, Chester. Big Heritage.
Olsen, N., Toffner-Clausen, L., Sabaka, T.J., Brauer, P., Merayo, J.M.G., Jorgensen, J.L., Leger, J.M., Nielsen, O.V., Primdahl, F., and Risbo, T., 2003. Calibration of the Orsted vector magnetometer. Earth Planets Space 55: 11-18.
Ordnance Survey, 6” 2nd edition c.1882-1913. National Library of Scotland, 2016 [http://maps.nls.uk]. [Accessed 25/07/2016].
Schmidt, A. and Ernenwein, E., 2013. Guide to Good Practice: Geophysical Data in Archaeology. 2nd ed., Oxbow Books, Oxford.
Schmidt, A., Linford, P., Linford, N., David, A., Gaffney, C., Sarris, A. and Fassbinder, J., 2015. Guidelines for the use of geophysics in archaeology: questions to ask and points to consider. EAC Guidelines 2. European Archaeological Council: Belgium.
Soilscapes, 2016. [Chester, Cheshire]. Cranfield University, National Soil Resources Institute
[http://landis.org.uk]. [Accessed 25/07/2016].
Deanery Field, Chester MSSJ27 - Geophysical Survey Report
Magnitude Surveys Ltd 16 | P a g e
Selected Radargrams S-N
Insert 1- Radargram looking east through centre of survey area.
W-E
Insert 2- Radargram looking north through centre of survey area


![LOTR SBG - Legions of Middle-Earth[1]](https://img.pdfslide.net/doc/110x75/54e816f84a7959704f8b482f/lotr-sbg-legions-of-middle-earth1.jpg)