Embed Size (px)
Citation preview
Geophysical Survey Report
of
Northop Road,
Flint, Flintshire
For
CgMs Consulting
On Behalf Of
Anwyl Land
Magnitude Surveys Ref: MSSJ221
December 2017

Geophysical Survey Report of Northop Road, Flint MSSJ221 - Geophysical Survey Report
2 | P a g e
Unit 17, Commerce Court
Challenge Way
Bradford
BD4 8NW
01274 926020
Report Written by:
Rob Legg BA MSc & Graeme Attwood MSc MCIfA
Figures Produced by:
Leanne Swinbank BA ACIfA
Report Checked by:
Chrys Harris BA MSc PhD
Report Issued:
20 December 2017
Abstract Magnitude Surveys was commissioned to assess the subsurface archaeological potential of a c. 8.4 ha area of land at Northop Road, Flint, Flintshire. A fluxgate gradiometer survey was successfully completed and while no anomalies have been categorised as archaeological, a potential Lime Kiln had been detected within Area 4, along with two further areas that likely reflect waste or remains of industrial processes; these have all been categorised as Industrial/Modern. Ridge and Furrow ploughing has been identified across most of the site, with a pair of former boundaries and track in the south also reflecting the agricultural land use. Natural variation in the soils and superficial geology can be seen throughout the results.
Geophysical Survey Report of Northop Road, Flint MSSJ221 - Geophysical Survey Report
3 | P a g e
Contents Abstract ............................................................................................................................................ 2
List of Figures .................................................................................................................................... 4
1. Introduction .............................................................................................................................. 5
2. Quality Assurance ...................................................................................................................... 5
3. Objectives .................................................................................................................................. 5
4. Geographic Background ............................................................................................................. 6
5. Archaeological Background ........................................................................................................ 7
6. Methodology ............................................................................................................................. 8
Data Collection ................................................................................................................... 8
Data Processing .................................................................................................................. 8
Data Visualisation and Interpretation ................................................................................. 9
7. Results ....................................................................................................................................... 9
Qualification .................................................................................................................... 10
Discussion ........................................................................................................................ 10
Interpretation .................................................................................................................. 10
General Statements .................................................................................................. 10
Magnetic Results - Specific Anomalies ...................................................................... 11
8. Conclusions ............................................................................................................................. 12
9. Archiving ................................................................................................................................. 12
10. Copyright ................................................................................................................................. 13
11. References ............................................................................................................................... 13
Geophysical Survey Report of Northop Road, Flint MSSJ221 - Geophysical Survey Report
4 | P a g e
List of Figures Figure 1: Site Location 1:25,000 @ A4 Figure 2: Location of Survey Areas 1:5000 @ A3 Figure 3: Magnetic Gradient 1:2000 @ A3 Figure 4: Magnetic Total Field 1:2000 @ A3 Figure 5: Magnetic Interpretation 1:2000 @ A3 Figure 6: Magnetic Interpretation Over Satellite Imagery 1:2000 @ A3 Figure 7: Magnetic Interpretation Over Historic Maps 1:3000 @ A3 Figure 8: XY Trace Plot 1:2000 @ A3
Geophysical Survey Report of Northop Road, Flint MSSJ221 - Geophysical Survey Report
Magnitude Surveys Ltd 5 | P a g e
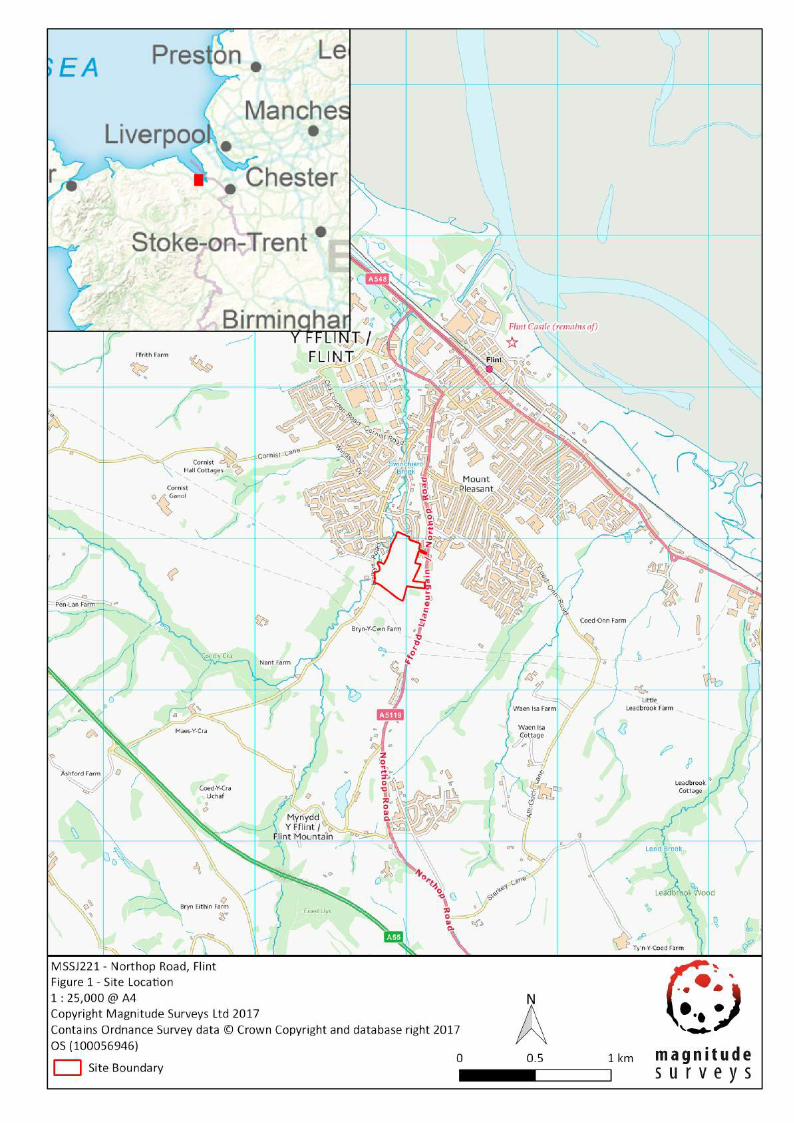
1. Introduction Magnitude Surveys Ltd (MS) was commissioned by CgMs Consulting on behalf of Anwyl Land to undertake a geophysical survey on a c. 8.4ha area of land off Northop Road, Flint, Flintshire (SJ 2396 7184).
The geophysical survey comprised hand-pulled, cart-mounted fluxgate gradiometer survey.
The survey was conducted in line with the current best practice guidelines produced by Historic England (David et al., 2008), the Chartered Institute for Archaeologists (CIfA, 2014) and the European Archaeological Council (Schmidt et al., 2015).
The survey commenced on 11 December 2017 and took 2 days to complete.
2. Quality Assurance Project management, survey work, data processing and report production have been carried out by qualified and professional geophysicists to standards exceeding the current best practice (CIfA, 2014; David et al., 2008, Schmidt et al., 2015).
Magnitude Surveys is a corporate member of ISAP (International Society of Archaeological Prospection).
Director Graeme Attwood is a Member of the Chartered Institute for Archaeologists (CIfA), the chartered UK body for archaeologists, as well as the Secretary of GeoSIG, the CIfA Geophysics Special Interest Group. Director Finnegan Pope-Carter is a Fellow of the London Geological Society, the chartered UK body for geophysicists and geologists, as well as a member of GeoSIG, the CIfA Geophysics Special Interest Group. Director Chrys Harris has a PhD in archaeological geophysics from the University of Bradford and is the Vice-Chair of the International Society for Archaeological Prospection.
All MS managers have postgraduate qualifications in archaeological geophysics. All MS field staff have relevant archaeology or geophysics degrees and supervisors have at least three years’ field experience.
3. Objectives The geophysical survey aimed to assess the subsurface archaeological potential of the survey area.
Geophysical Survey Report of Northop Road, Flint MSSJ221 - Geophysical Survey Report
Magnitude Surveys Ltd 6 | P a g e
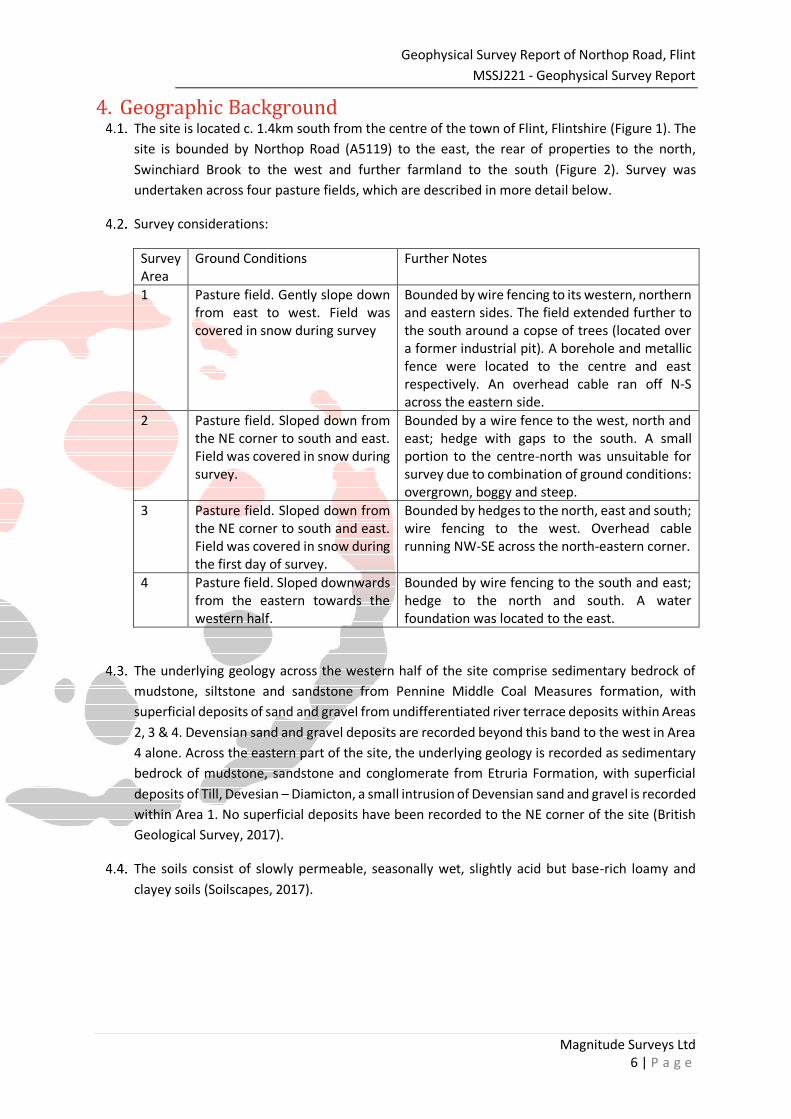
4. Geographic Background The site is located c. 1.4km south from the centre of the town of Flint, Flintshire (Figure 1). The site is bounded by Northop Road (A5119) to the east, the rear of properties to the north, Swinchiard Brook to the west and further farmland to the south (Figure 2). Survey was undertaken across four pasture fields, which are described in more detail below.
Survey considerations:
Survey Area
Ground Conditions Further Notes
1 Pasture field. Gently slope down from east to west. Field was covered in snow during survey
Bounded by wire fencing to its western, northern and eastern sides. The field extended further to the south around a copse of trees (located over a former industrial pit). A borehole and metallic fence were located to the centre and east respectively. An overhead cable ran off N-S across the eastern side.
2 Pasture field. Sloped down from the NE corner to south and east. Field was covered in snow during survey.
Bounded by a wire fence to the west, north and east; hedge with gaps to the south. A small portion to the centre-north was unsuitable for survey due to combination of ground conditions: overgrown, boggy and steep.
3 Pasture field. Sloped down from the NE corner to south and east. Field was covered in snow during the first day of survey.
Bounded by hedges to the north, east and south; wire fencing to the west. Overhead cable running NW-SE across the north-eastern corner.
4 Pasture field. Sloped downwards from the eastern towards the western half.
Bounded by wire fencing to the south and east; hedge to the north and south. A water foundation was located to the east.
The underlying geology across the western half of the site comprise sedimentary bedrock of mudstone, siltstone and sandstone from Pennine Middle Coal Measures formation, with superficial deposits of sand and gravel from undifferentiated river terrace deposits within Areas 2, 3 & 4. Devensian sand and gravel deposits are recorded beyond this band to the west in Area 4 alone. Across the eastern part of the site, the underlying geology is recorded as sedimentary bedrock of mudstone, sandstone and conglomerate from Etruria Formation, with superficial deposits of Till, Devesian – Diamicton, a small intrusion of Devensian sand and gravel is recorded within Area 1. No superficial deposits have been recorded to the NE corner of the site (British Geological Survey, 2017).
The soils consist of slowly permeable, seasonally wet, slightly acid but base-rich loamy and clayey soils (Soilscapes, 2017).
Geophysical Survey Report of Northop Road, Flint MSSJ221 - Geophysical Survey Report
Magnitude Surveys Ltd 7 | P a g e
5. Archaeological Background The following sections summarises the archaeological background of the site and the surrounding landscape from a heritage assessment produced by CgMs Consulting (Mercer, 2017). Several non-designated heritage assets have been identified within the site itself and relate to post medieval or later activity. These include ridge and furrow (87989) through the central fields, a lime kiln (104036) at the very eastern end, and a Spitfire crash site (130300) towards the northern boundary.
Many of the HER records within the close vicinity to the site relate to post medieval and later activity; however, located c. 200m from the southern limit of site is the scheduled site of Bryn-y-Cwm Motte and Bailey Castle, marked by a large earthwork mound located upon the northern end of a spur. A bailey is not readily associated with the mound and there is no documentary evidence for a castle in this location, though there is a reference to a palisaded site in AD1244. Further Medieval evidence with 1km of the survey are notable, with a field system c.600m to the east and three Medieval quillets, enclosed strips of land, northwest, west and south of the survey area. Evidence of Wat’s dyke, 8th -9th centuries in date, has also been identified c.550m to the southwest.
Further away from the environs of the site, evidence for prehistoric activity in the landscape is identifiable with an Iron Age defensive enclosure c. 560m southwest of the survey area. No heritage assets were attributable to the Roman period.
Seventy-five of the heritage assets identified within 1km of the survey area were identified as being post medieval in date. Nearly all of these sites were noted to relate to either marl, sand or clay pits.
The earliest map evidence for the area comes from an 1840 Tithe map of Flint, which identifies the survey area as being divided into ten separate fields. No change was noted in the 1871 1st edition OS map except for the extra detail of a coal mine shaft and spoil mound located to the east, a limekiln just to the north or them, a marl pit along the southern border and a trackway running east to west across the survey area. Changes in the following OS maps were mostly restricted to the disappearance of the mine shaft, limekiln and a few field boundaries. Greater change is noted in the OS map for 1963-1967 with disappearance of the marl pit, strip fields to the south and west of the survey area, and the creation of a boundary along the southern edge of the spoilheap.

Geophysical Survey Report of Northop Road, Flint MSSJ221 - Geophysical Survey Report
Magnitude Surveys Ltd 8 | P a g e
6. Methodology Data Collection
Geophysical prospection comprised the magnetic method as described in the following table.
Table of survey strategies:
Method Instrument Traverse Interval Sample Interval
Magnetic Bartington
Instruments Grad-13 Digital Three-Axis Gradiometer
1m 200Hz reprojected to 0.125m
The magnetic data were collected using MS’ bespoke hand-pulled cart system.
6.1.3.1. MS’ cart system was comprised of Bartington Instruments Grad 13 Digital Three-Axis Gradiometers. Positional referencing was through a Hemisphere S321 GNSS Smart Antenna RTK GPS outputting in NMEA mode to ensure high positional accuracy of collected measurements. The Hemisphere S321 GNSS Smart Antenna is accurate to 0.008m + 1ppm in the horizontal and 0.015m + 1ppm in the vertical.
6.1.3.2. Magnetic and GPS data were stored on an SD card within MS’ bespoke datalogger. The datalogger was continuously synced, via an in-field Wi-Fi unit, to servers within MS’ offices. This allowed for data collection, processing and visualisation to be monitored in real-time as fieldwork was ongoing.
6.1.3.3. Rows of temporary sight markers were established in each survey area to guide the surveyor and ensure full coverage with the cart. Data were collected by traversing the survey area along the longest possible lines, ensuring efficient data collection and processing.
Data Processing Magnetic data were processed in bespoke in-house software produced by MS. Processing steps conform to Historic England’s standards for “raw or minimally processed data” (see sect 4.2 in David et al., 2008: 11).
Sensor Calibration – The sensors were calibrated using a bespoke in-house algorithm, which conforms to Olsen et al. (2003).
Zero Median Traverse – The median of each sensor traverse is calculated within a specified range and subtracted from the collected data. This removes striping effects caused by small variations in sensor electronics.
Projection to a Regular Grid – Data collected using RTK GPS positioning requires a uniform grid projection to visualise data. Data are rotated to best fit an orthogonal grid projection and are resampled onto the grid using an inverse distance-weighting algorithm.

Geophysical Survey Report of Northop Road, Flint MSSJ221 - Geophysical Survey Report
Magnitude Surveys Ltd 9 | P a g e
Interpolation to Square Pixels – Data are interpolated using a bicubic algorithm to increase the pixel density between sensor traverses. This produces images with square pixels for ease of visualisation.
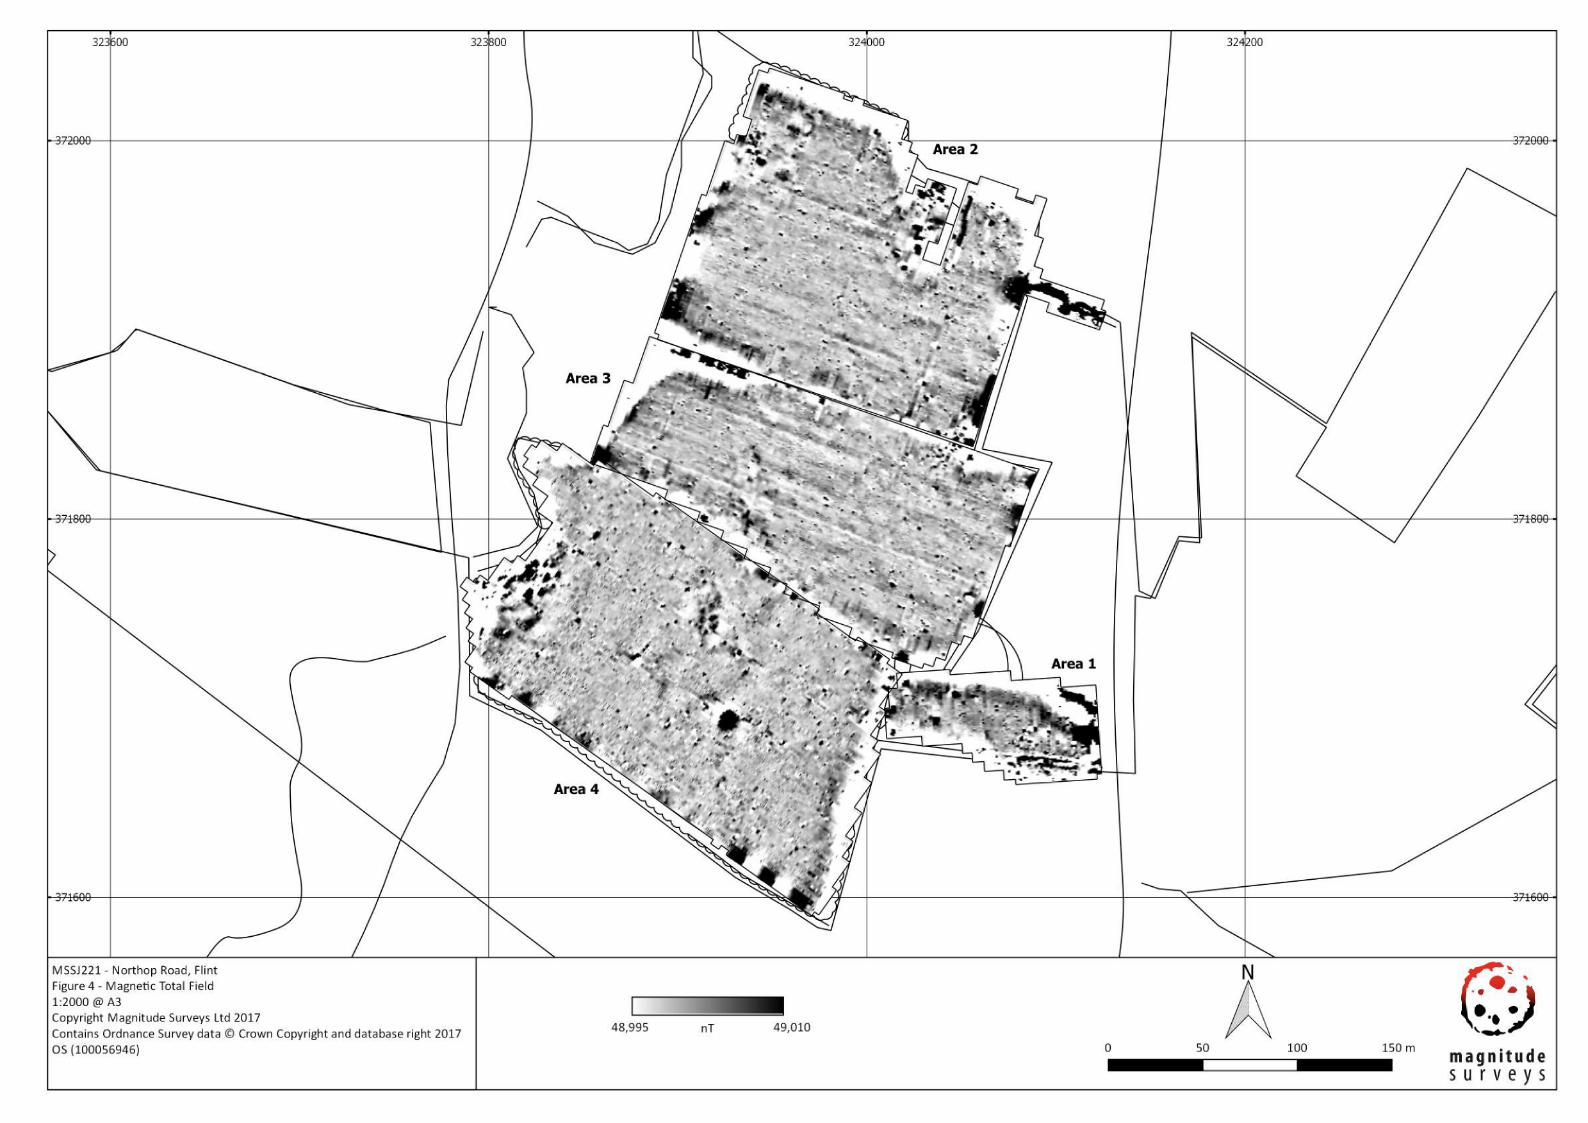
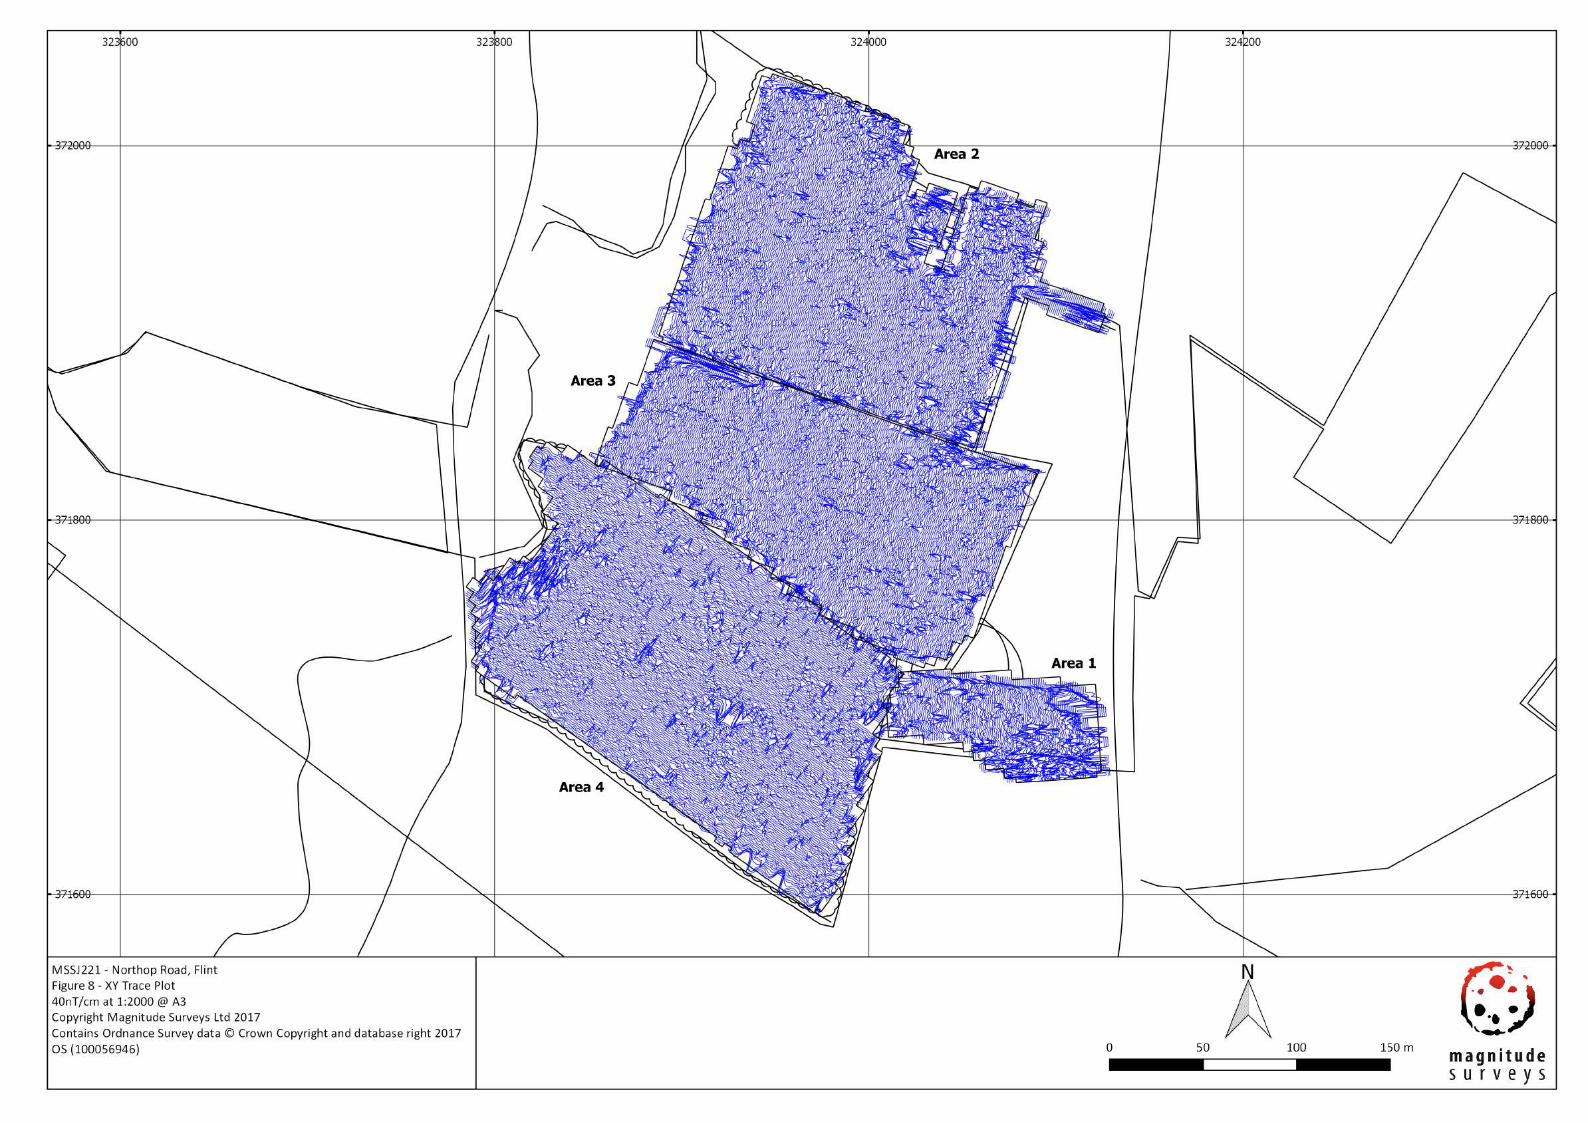
Data Visualisation and Interpretation This report presents the gradient of the sensors’ total field data as greyscale images, as well as the total field data from the upper and/or lower sensors. The gradient of the sensors minimises external interferences and reduces the blown-out responses from ferrous and other high contrast material. However, the contrast of weak or ephemeral anomalies can be reduced through the process of calculating the gradient. Consequently, come features can be clearer in the respective gradient or total field datasets. Multiple greyscales images at different plotting ranges have been used for data interpretation. Greyscale images should be viewed alongside the XY trace plot (Figure 8). XY trace plots visualise the magnitude and form of the geophysical response, aiding in anomaly interpretation.
Geophysical results have been interpreted using greyscale images and XY traces in a layered environment, overlaid against open street maps, satellite imagery, historic maps, and soil and geology maps. Google Earth (2017) was consulted as well, to compare the results with recent land usages.

Geophysical Survey Report of Northop Road, Flint MSSJ221 - Geophysical Survey Report
Magnitude Surveys Ltd 10 | P a g e
7. Results Qualification
Geophysical results are not a map of the ground and are instead a direct measurement of subsurface properties. Detecting and mapping features requires that said features have properties that can be measured by the chosen technique(s) and that these properties have sufficient contrast with the background to be identifiable. The interpretation of any identified anomalies is inherently subjective. While the scrutiny of the results is undertaken by qualified, experienced individuals and rigorously checked for quality and consistency, it is often not possible to classify all anomaly sources. Where possible an anomaly source will be identified along with the certainty of the interpretation. The only way to improve the interpretation of results is through a process of comparing excavated results with the geophysical reports. MS actively seek feedback on their reports as well as reports of further work in order to constantly improve our knowledge and service.
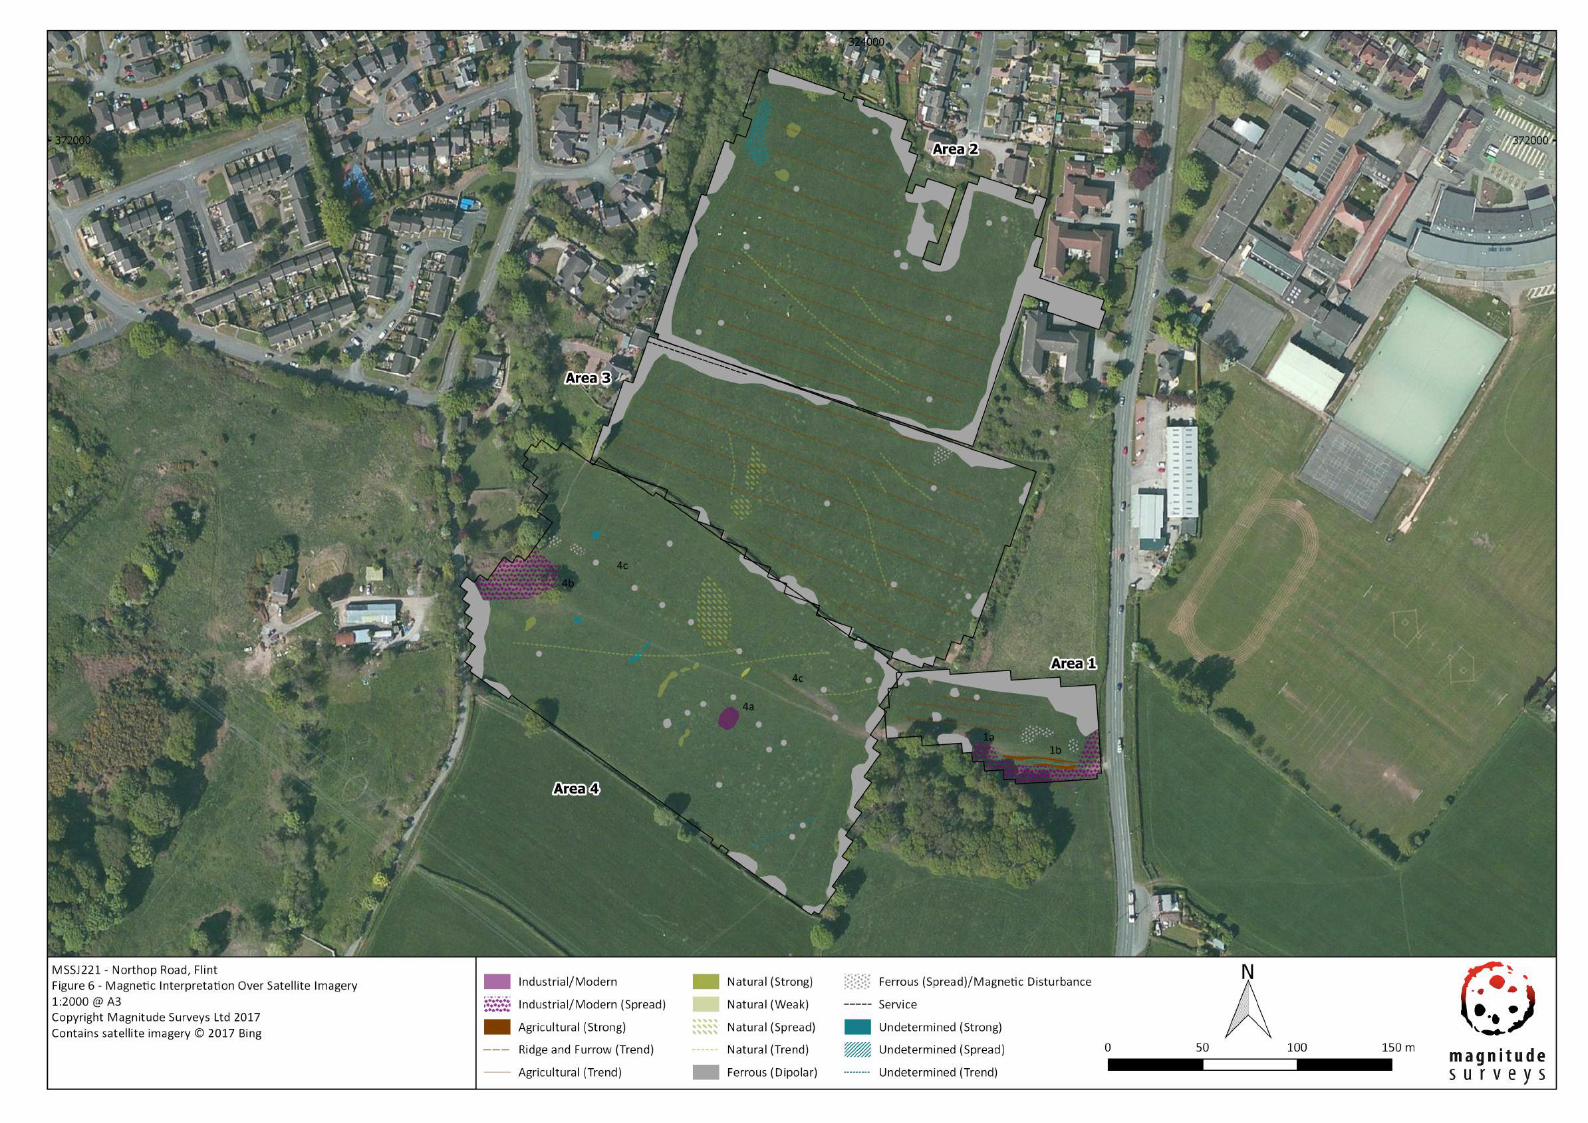
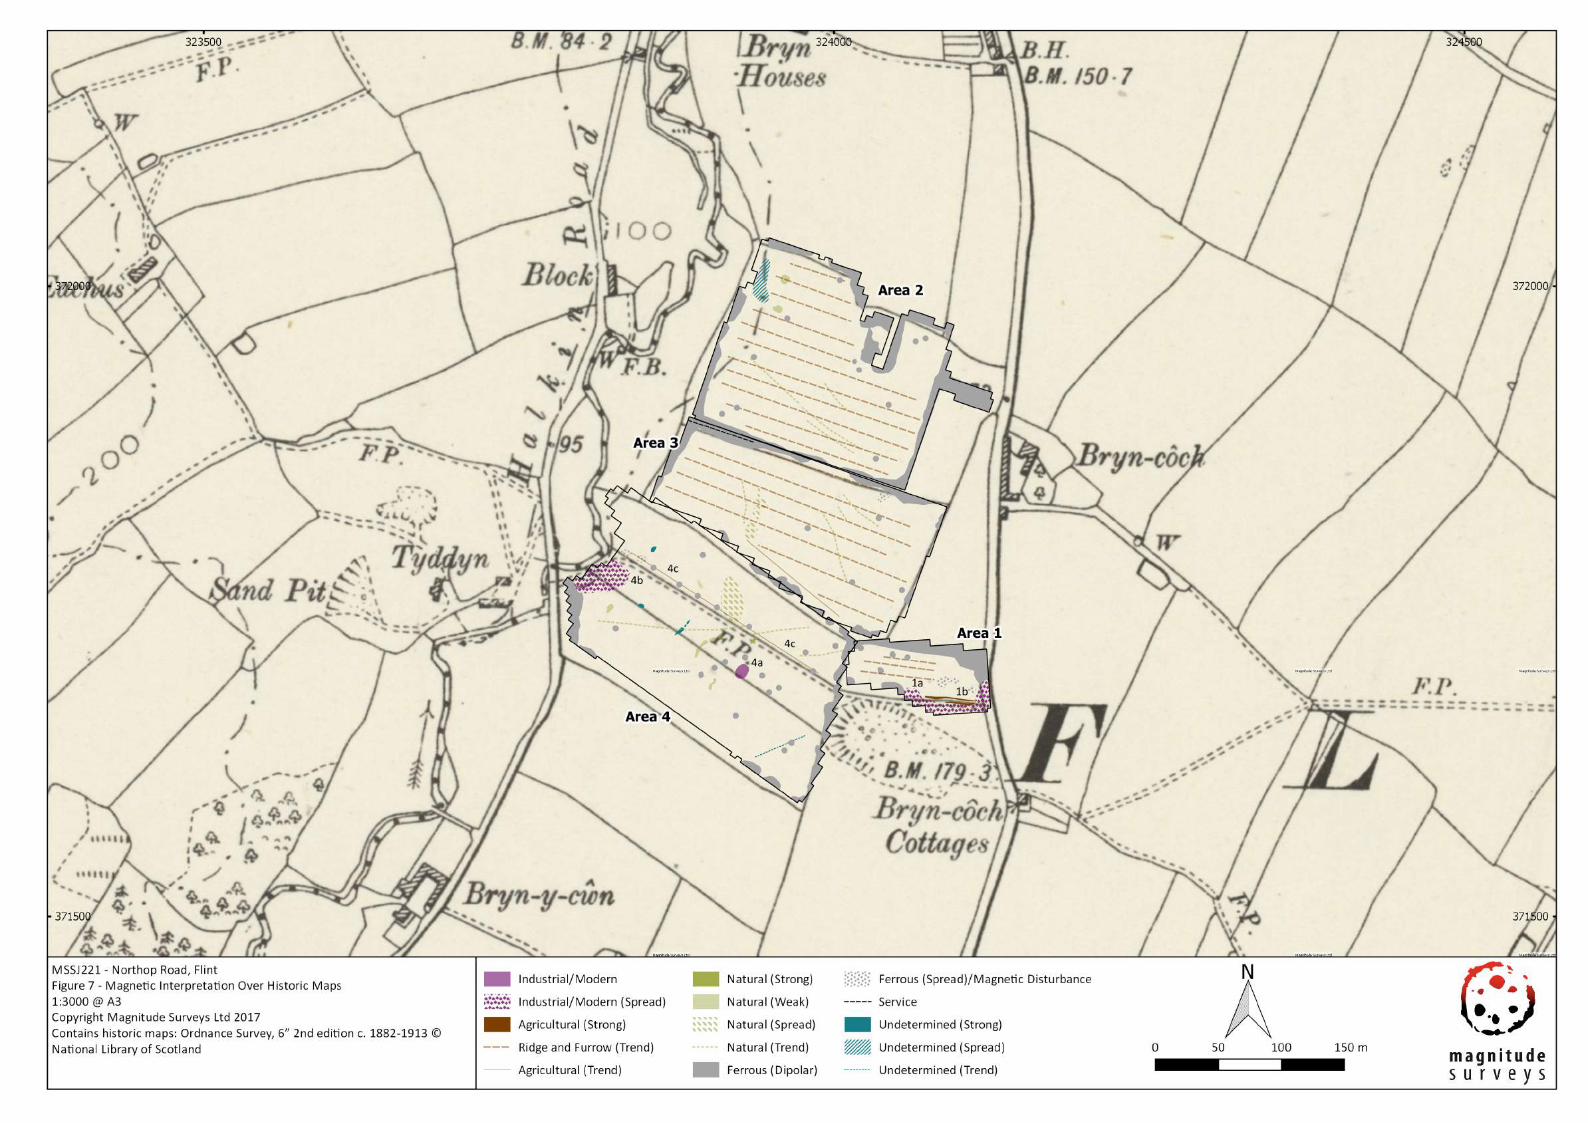
Discussion The geophysical results are presented in consideration with satellite imagery (Figure 6) and historic maps (Figure 7).
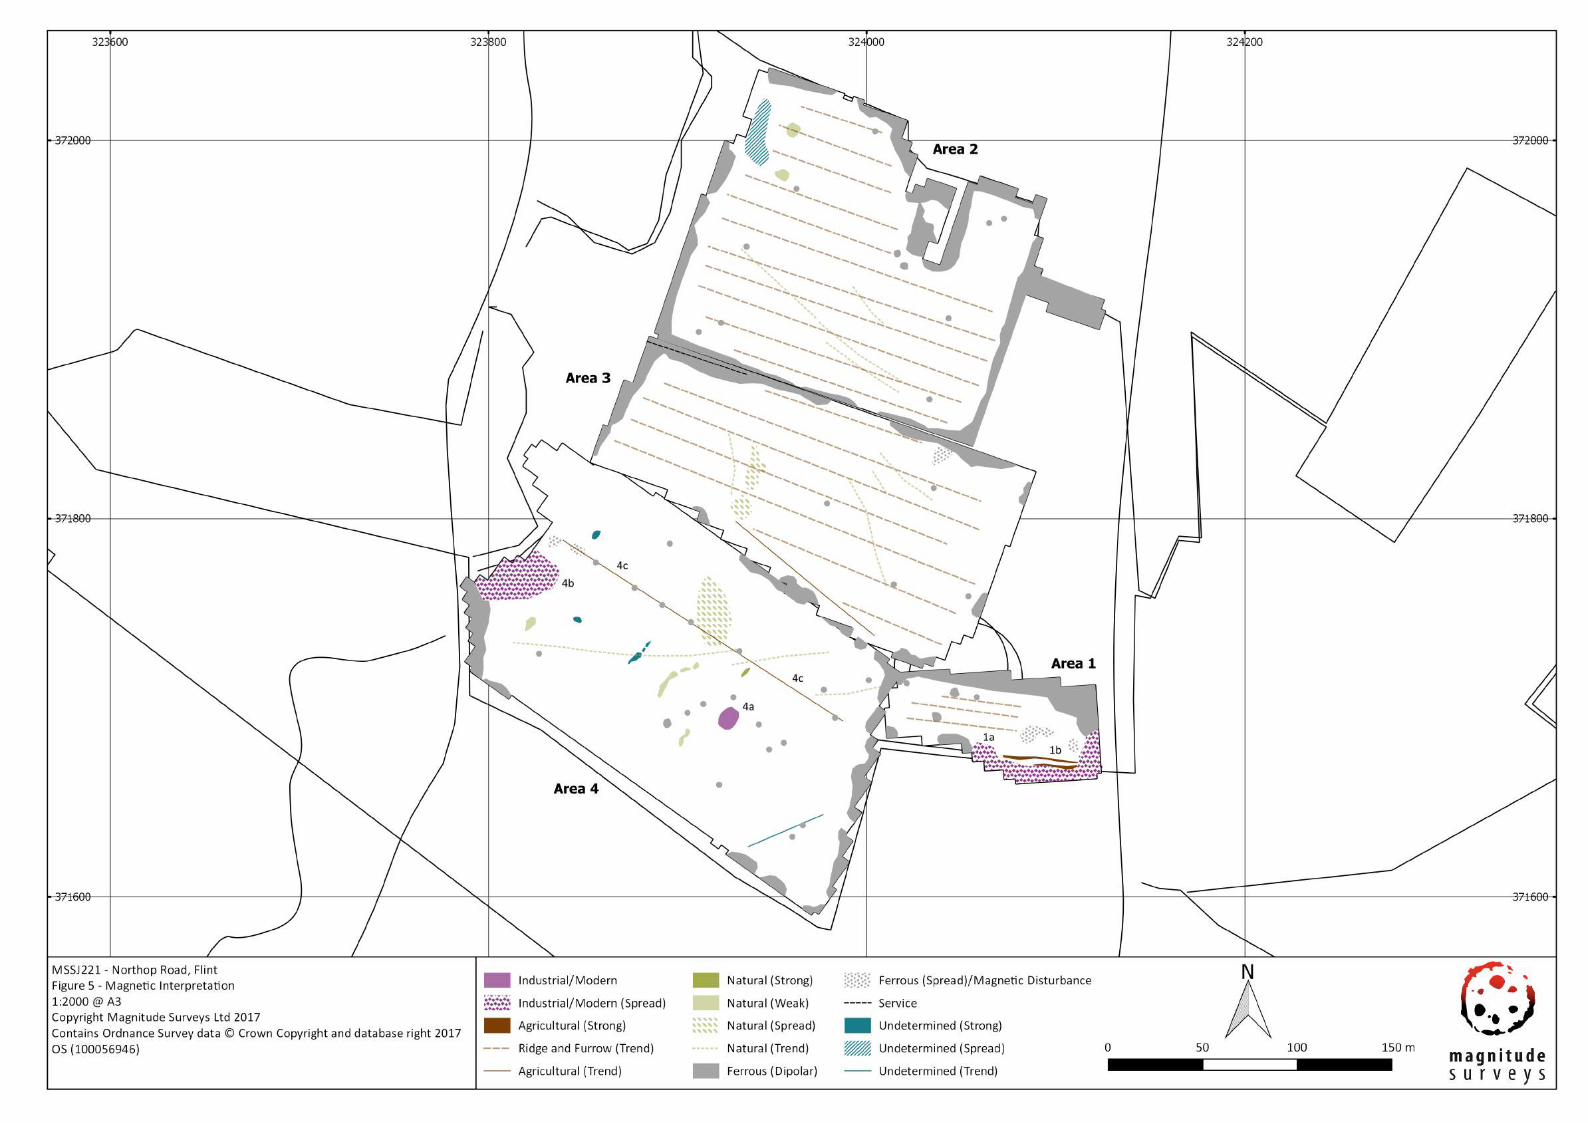
The fluxgate gradiometer survey has responded well to the environment of the survey. The survey has detected a range of anomaly sources from ephemeral agricultural and natural features to stronger anomalies of a modern and industrial origin. The nature of the underlying geology of the site can been seen within the data with pockets of increased magnetic response creating a dappled appearance though the dataset and reflecting the magnetic variation in the superficial geology and soils (see 4.2 & 4.3).
Traces of former ridge and furrow ploughing have been detected across the north and east of the site, while the remnants of two former boundaries have been identified as well. The site’s industrial heritage is also evidenced within the results in the form of areas of strong magnetic responses likely associated with the remnants of former quarrying and mining, and potentially the firing of material.
Modern influences on the dataset have largely been restricted to the edges of the survey areas. The wire stock fences around the perimeter of the fields have caused strong magnetic ‘halos’ which may mask any weaker anomalies should they be present.
Interpretation General Statements 7.3.1.1. Geophysical anomalies will be discussed broadly as classification types across
the survey area. Only anomalies that are distinctive or unusual will be discussed individually.
7.3.1.2. Undetermined – Anomalies are classified as Undetermined when the anomaly origin is ambiguous through the geophysical results and there is no supporting or correlative evidence to warrant a more certain classification. These anomalies are likely to be the result of geological, pedological or agricultural
Geophysical Survey Report of Northop Road, Flint MSSJ221 - Geophysical Survey Report
Magnitude Surveys Ltd 11 | P a g e
processes, although an archaeological origin cannot be entirely ruled out. Undetermined anomalies are generally not ferrous in nature.
7.3.1.3. Ferrous (Discrete/Spread) – Discrete ferrous-like, dipolar anomalies are likely to be the result of modern metallic disturbance on or near the ground surface. A ferrous spread refers to a concentrated deposition of these discrete, dipolar anomalies. Broad dipolar ferrous responses from modern metallic features, such as fences, gates, neighbouring buildings and services, may mask any weaker underlying archaeological anomalies should they be present.
Magnetic Results - Specific Anomalies 7.3.2.1. Industrial/Modern (Strong) – A large discrete anomaly [4a], demonstrating
significant magnetic enhancement has been detected towards the centre of Area 4 on the alignment of a former field boundary denoted on historic maps (Figure 7). The magnetic response of [4a] demonstrates a distinct double peaking response within the XY Traces (Figure 8), which is a characteristic signal of intense in-situ burning from kilns or ovens. An ‘Old Lime Kiln’ (104036) is denoted on the 1st Edition ordnance survey map some 110m to the east of [4a] and is located alongside a field boundary. Further ‘Old Lime Kilns’ denoted on the same map share similar locations within fields and all suggest the potential for [4a] representing an unmapped example.
7.3.2.2. Industrial/Modern (Spread) – Two areas within the data that display an increased magnetic response over the background readings have been categorised as a spread of modern or industrial material. [1a] along the southern boundary of Area 1 occurs to the immediate north of a former mine shaft (85016) and associated spoil heap (Figure 7) and is collocated with a former lime kiln (104036), all of which are denoted on the 1st edition Ordnance Survey map. The response likely reflects waste material from these activities. A spread of anomalies [4b] within a meander of the Swinchiard Brook on the western edge of Area 4 display a similar magnitude and density of response to [1a]. While there is no complementary mapping evidence at this location to indicate a potential anomaly source, the similarity in response to [1a] and the extent of industrial exploitation of the land within the vicinity of the survey area make the industrial/modern categorisation the most appropriate. This could further be supported by the correlation of [4b] with a depression visible on a LiDAR hillshade in CgMs Consulting’s Heritage Assessment (Mercer, 2017).
7.3.2.3. Agricultural – A pair of positive magnetic linear anomalies [1b] orientated east-west have been detected within Area 1. These are collocated with a former field boundary and track denoted on the historic maps (Figure 7) and near the current field entrance (Figure 6). A further former field boundary [4c] has been detected as a faint trend and alignment of ferrous anomalies.
7.3.2.4. Ridge and Furrow – Former agricultural ploughing has been detected through Areas 1-3. These broadly spaced linear anomalies indicate ridge and furrow

Geophysical Survey Report of Northop Road, Flint MSSJ221 - Geophysical Survey Report
Magnitude Surveys Ltd 12 | P a g e
rather than later mechanised ploughing and corelates well with the LiDAR evidence (Mercer, 2017).
8. Conclusions A fluxgate gradiometer survey has been successfully completed across the site and has detected a range of anomalies of varying magnetic strength throughout the survey area. The magnetic variation in the soils and superficial geology can be seen across all survey areas as a subtle mottled effect. Anthropogenic activity in the form of both agricultural and industrial/modern use of the land has been identified.
Several anomalies of a likely industrial or modern origin have been detected in Areas 1 and 4. The most prominent has the potential to be a former Lime Kiln, identifiable through characteristic double peaking within the XY traces. Lime kilns are denoted on historic maps in the vicinity of this anomaly but not its location, suggesting an unmapped occurrence. Two spreads of increased magnetic response likely reflect waste material form the mining, firing and quarrying that took place in and around the survey area.
Ridge and furrow ploughing, identifiable through its greater spacing of furrows, has been identified across Areas 1-3. Ridge and furrow has been previously noted on site through analysis of LiDAR data (Mercer, 2017). However, the ploughing trends visible in the LiDAR hillshade in Area 4 are ambiguous in the geophysical results; Area 4 has slightly different magnetic background to the other areas, which could account for the differences in detection. A track and former boundary in Area 1 and second former boundary in Area 2 have further been identified by the survey and corelate well with features recorded on historic maps.
Ferrous anomalies caused by fences and upstanding modern features have largely been restricted to the edges of the survey area, with a small scattering of ferrous spikes throughout each area indicative of ferrous or fired material in the topsoil. There no obvious anomalies to suggest the location of the potential Spitfire crash site; any debris associated with the crash would take the form of a ferrous-type anomaly.
9. Archiving MS maintains an in-house digital archive, which is based on Schmidt and Ernenwein (2013). This stores the collected measurements, minimally processed data, georeferenced and un-georeferenced images, XY traces and a copy of the final report.
MS contributes all reports to the ADS Grey Literature Library subject to any time embargo dictated by the client.
Whenever possible, MS has a policy of making data available to view in easy to use forms on its website. This can benefit the client by making all of their reports available in a single repository, while also being a useful resource for research. Should a client wish to impose a time embargo on the availability of data, this can be achieved in discussion with MS.
Geophysical Survey Report of Northop Road, Flint MSSJ221 - Geophysical Survey Report
Magnitude Surveys Ltd 13 | P a g e
10. Copyright Copyright and the intellectual property pertaining to all reports, figures, and datasets produced by Magnitude Services Ltd. is retained by MS. The client is given full licence to use such material for their own purposes. Permission must be sought by any third party wishing to use or reproduce any IP owned by MS.
11. References British Geological Survey, 2017. Geology of Britain. [Flint, Flintshire]. [http://mapapps.bgs.ac.uk/geologyofbritain/home.html/]. [Accessed 18/12/2017].
Chartered Institute for Archaeologists, 2014. Standards and guidance for archaeological geophysical survey. CIfA.
David, A., Linford, N., Linford, P. and Martin, L., 2008. Geophysical survey in archaeological field evaluation: research and professional services guidelines (2nd edition). Historic England.
Google Earth, 2017. Google Earth Pro V 7.1.7.2606. 53®14’17.56”N, 3®08’22.90”W. Eye alt 690m. ©2017 Google.
Mercer, E., 2017 Northop Road, Flint, Flintshire: Archaeological Desk-Based Assessment Unpublished Report, CgMs Consulting, Manchester.
Olsen, N., Toffner-Clausen, L., Sabaka, T.J., Brauer, P., Merayo, J.M.G., Jorgensen, J.L., Leger, J.M., Nielsen, O.V., Primdahl, F., and Risbo, T., 2003. Calibration of the Orsted vector magnetometer. Earth Planets Space 55: 11-18.
Schmidt, A. and Ernenwein, E., 2013. Guide to good practice: geophysical data in archaeology. 2nd ed., Oxbow Books, Oxford.
Schmidt, A., Linford, P., Linford, N., David, A., Gaffney, C., Sarris, A. and Fassbinder, J., 2015. Guidelines for the use of geophysics in archaeology: questions to ask and points to consider. EAC Guidelines 2. European Archaeological Council: Belgium.
Soilscapes, 2017. [Flint, Flintshire]. Cranfield University, National Soil Resources Institute [http://landis.org.uk]. [Accessed 18/12/2017].